 Jindong Chang1,3,4,5,6†
 Liming Yong1,5†
 Yali Yi2,6*
 Xiaolei Liu7Hanbing Song1,5Yan Li1,5Ming Yang1,4,5Lei Yao1,5Naiqing Song3,6*
- 1School of Physical Education, Southwest University, Chongqing, China
- 2School of Mathematics and Statistics, Yulin Normal University, Guangxi, China
- 3The Branch of the Collaborative Innovation Center of Assessment Toward Basic Education Quality, Southwest University, Chongqing, China
- 4Key Laboratory of Physical Fitness Evaluation & Motor Function Monitoring, General Administration of Sport of China, Southwest University, Chongqing, China
- 5Institute of Motor Quotient, Southwest University, Chongqing, China
- 6School of Mathematics and Statistics, Southwest University, Chongqing, China
- 7High School Affiliated to Southwest University, Chongqing, China
The Exercise Orientation Questionnaire (EOQ) is a method for evaluating individuals' exercise attitudes and behaviors associated with exercise motivation. A lack of exercise motivation can affect physical activity attitudes, behavior, and action among university students. Physical inactivity may lead to health risks. The purpose of this study was to assess the measurement of psychological properties in the EOQ and to determine the reliability and validity of the EOQ when applied to Chinese university students. A total of 368 university students (male 48.8%) aged between 17 and 23 years (M = 19.60, SD = 1.18) participated in the current study. Confirmatory factor analysis (CFA) and exploratory structural equation modeling (ESEM) were used to verify the factorial validity of the EOQ. The internal consistency coefficient (Cronbach's alpha and McDonald's omega) was used to determine reliability. Multiple regression analysis was used to test concurrent validity. The International Physical Activity Questionnaire (IPAQ) was used to determine the participants' level of physical activity. The range of the subscale coefficient was 0.80–0.89, and the total scale was 0.95, which indicated that the reliability of the EOQ was excellent. The research showed that the initial CFA model of the EOQ had poorly fitting indices. The corrected model after seven residual correlations achieved the setting standard, but the correlation coefficient between some factors exceeded the standard threshold, which indicated that the CFA fitting model was not ideal. ESEM is a combination of exploratory and verifiable analytical techniques. Using ESEM and abbreviated version CFA to analyze the data indicated that the model fitted well [ESEM: TLI = 0.97 > 0.90, CFI = 0.96 > 0.90, SRMR = 0.02 < 0.08, and RMSEA = 0.045 < 0.08 (90% CI 0.033–0.055); CFA: TLI = 0.92 > 0.90, CFI = 0.91 > 0.90, SRMR = 0.08, and RMSEA = 0.06 < 0.08 (90% CI 0.055–0.067)]. The results of multiple regression analysis suggested that the ESEM model was effective in distinguishing the differences between individuals with different levels of physical activity (PAL) and body mass index (BMI). Overall, the Chinese abbreviated version of the EOQ (EOQ-CA) was fond to be a reliable tool for monitoring the exercise attitudes and behaviors of Chinese University students.
Introduction
Unhealthy lifestyles such as low levels of physical activity, sedentary, high screen time, poor diet habits, and staying up late (short sleep duration) have become important factors affecting university students' cardiovascular disease (1–5). The World Health Organization warns individuals that physical inactivity can increase the risk of cancer, heart disease, stroke, and diabetes by 20–30% and shorten their lifespan by 3–5 years (6). Studies showed that in the United States (7), Canada (8), Germany (9), Spain (10), Portugal (11), Australia (12), Japan (13), and China (14, 15), the lack of exercise motivation was the main reason for college students' physical inactivity.
Exercise is a significant contributor to human happiness, and is of great concern to Western countries (16, 17). Individuals are motivated to engage in exercise for various reasons, such as strengthening muscles, improving skills, reducing weight, body shaping, and leisure (16, 18, 19). Previous studies showed that the motivation for physical-appearance exercise was associated with “self-control” orientation; exercising for pleasure and social reasons were related to “external-control” factors (20). The perception of exercise is a process of cognitive development from viewing it as a massive task to daily conscious actions (21). The benefits of exercise are well-known, but there are still concerns that some individuals under-exercise and others over-exercise or become addicted (19). Therefore, a tool for testing exercise orientation was needed to assess the daily exercise of ordinary individuals.
The 27-item exercise orientation questionnaire (EOQ), with 6 factors, was developed by Yates et al. (16) to observe individuals' exercise attitudes and behavior. During the development process, different patterns of motivation and perception were considered to identify obesity, eating disorders, and well-trained athletes. Their research focused on the assessment of exercise behavior to identify eating disorders or exercise addiction. Yates et al. (22) studied eating disorder (ED) risk through the evaluation of exercise attitudes and behaviors using the EOQ scale. Draeger et al. (23) studied the concept of obligatory exercise by assessing an overcommitment to exercise using the Self-Loathing Subscale (SLSS). Aruguete et al. (24) verified the reliability and validity of the SLSS as a tool for possible EDs. These studies suggest that the SLSS has high internal consistency, concurrent validity, and convergent validity. Aruguete et al. (24) also mentioned that the SLSS as a part of the EOQ was based on exercise-related issues; therefore, it was not easily identifiable by participants as a screening tool for eating disorders. Hausenblas and Downs (25) noted that overstating the similarities between eating disorders and obligatory exercisers and using unidimensional scales to assess the complete construct was not appropriate. This problem may be related to the social factors of the research object, like Yates et al.'s (26) research, which found that differences in runners, cyclists, and paddlers might be related to specific social pressures among different ethnic groups.
An assessment tool for predicting the exercise attitude and behaviors of ordinary exercisers, the EOQ, is currently the most widely used after being tested for reliability and validity. However, the EOQ scale has not been verified in China. The purpose of the current research is to examine the psychometric properties of the Chinese EOQ and determine its reliability and validity among Chinese university students.
Materials and Methods
Participants and Procedure
Our sample consisted of 368 university students (valid 94.1%) aged 17–23 years (M = 19.60, SD = 1.18). There were 48.4% male and 51.6% female participants (Table 1). The sample data were tested before the formal investigation using the Chinese Residents Exercise and Health Study (CREHS). CREHS is a national survey of Chinese residents (aged 7–65 years), including 13,787 adults and children from 34 provincial units. The CREHS aims to study the association between exercise and health in Chinese residents. The focus is on revealing the relationship between exercise habits, healthy behaviors, physical literacy, and exercise to provide analysis for public health research. The sampling method strictly adhered to the CREHS sample, which represents 95% of the total population in China.
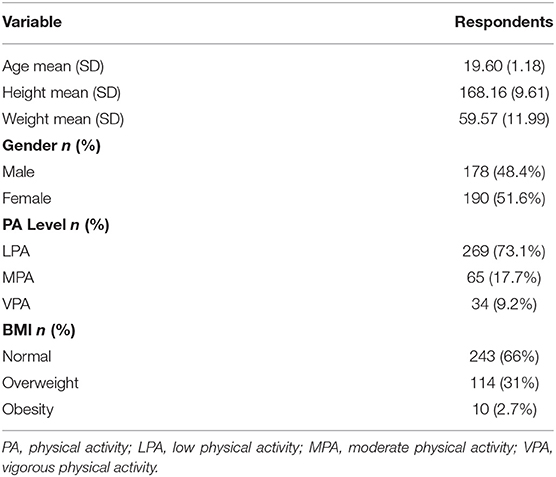
Table 1. General demographic characteristics of the participants.
Participants in the CREHS were recruited from the University Academic Group in China (CUAG). CUAG is an academic mutual aid organization. It comprises 2,000 scientific research workers from colleges and universities across the China. A member publishes survey information, and members assist each other in the questionnaire organization in their area. The preliminary investigation was conducted from 15 October to 14 November 2019 using an online questionnaire (https://www.wjx.cn/hj/k1ucgdtvduzys5szqgfxq.aspx).
A background questionnaire asked participants' gender, age, height, weight, education level, and job status. Body mass index (BMI) was calculated by using the data of self-reported height and weight. According to Chinese National Physical Health Test Standards (CNPHTS), BMI was divided into four groups: low weight (BMI < 14.8 kg/m2), normal (14.8 kg/m2 < BMI < 24 kg/m2), overweight (24 kg/m2 < BMI < 28 kg/m2), and obesity (BMI > 28 kg/m2) (27).
Instruments
Instrument I: Exercise Orientation Questionnaire
This was developed to measure a range of exercise attitudes and behaviors in populations (22). It consists of six factors: self-control, exercise orientation, self-loathing, weight reduction, identity, and competition (16). The six factors with a combined total of 27 items explained 44.6% of the total variance—the alpha values of each factor ranged from 0.74 to 0.87, with the total alpha value being 0.92 (22). The concurrent validity of the EOQ was verified by the high correlation between the factor score and the regularity and intensity of exercise and self-evaluation of investment (16). A 5-point Likert scale ranging from 1 = “strongly disagree” to 5 = “strongly agree” was used inthis study (16).
The Chinese version of the EOQ was completed in three steps. First, the 27 items of the English EOQ were translated into Chinese by two authors (JC and LY). Second, two linguistics professors collectively reviewed and modified the language expression. Then, 14 students were recruited to form a focus group of 4 university students, 6 middle-school students, and 4 elementary-school students. The research team members had a face-to-face interview with them to test the experience and record the problems. Third, the research team discussed and revised the questions raised by the focus group again and finalized the Chinese version of the EOQ (28).
Instrument II: International Physical Activity Questionnaire (IPAQ)
This was developed by an International Consensus Group (ICG) between 1997 and 1998 (29). It was developed as an instrument that included four long and four short versions for measuring health-related physical activity in populations. For both versions, the reliability and validity of IPAQ have been extensively tested and are currently used in many international studies (30). Qu and Li (31) studied the reliability and validity of the IPAQ Chinese version and suggested that the reliability of the extended version was better than the short version. The validity of the vigorous physical activity (VPA) consistency rate was higher than moderate physical activity (MPA), and the reliability and validity of the Chinese version were consistent with the Japanese version. As IPAQ extended-version scoring was relatively complex, the ICG did not give a unified grouping standard. The data processing and analysis methods provided by Fan et al. (32) were used in this study. According to the above process, the level of physical activity was divided into three groups: VPA, MPA, and low physical activity (LPA).
Statistical Analysis
Statistical analysis was performed using SPSS24.0, JASP, and Mplus8.0. Descriptive statistics were derived to analyze the demographic characteristics of the sample, such as the frequency and percentage of categorical variables, and the mean and standard deviation (SD) of continuous variables. The internal consistency reliabilities of scale were judged using Cronbach's alpha and McDonald's omega coefficient. The coefficient omega (ω) and coefficient omega subscale (ωS) were calculated to judge the amount of variance explained by the general factor and the specific factors (33–35). Confirmatory factor analysis (CFA, see Figure 1A) and exploratory structural equation modeling (ESEM, see Figure 1B) were used to assess the psychometric properties of the EOQ by using the robust maximum likelihood estimator (MLR) (36). Hair et al. (37), evaluated model fitness against several fit indices: the comparative fit index (CFI), the Tucker–Lewis index (TLI), the root mean square error of approximation (RMSEA), and the standardized root mean square residual (SRMR). The results of CFA and ESEM were interpreted based on the following commonly used cutoff criteria for adequate model fit: χ2/df ≤ 3, CFI > 0.90, TLI > 0.90, RMSEA < 0.08, and SRMR < 0.08 (38–43). A good criterion for CFA and ESEM is that each latent variable factor should be >0.5 and ideally >0.7 (37). We conducted the test of measurement invariance of the scale's items across gender and based on published guidelines for establishing measurement invariance of models (44–46). To avoid the potential for over-fitting, we applied ESEM to conduct a mixed method of EFA and CFA to evaluate its factorial validity (47). To further verify the concurrent validity of the calibration model, we conducted multiple regression analyses in which gender, age, physical activity level (PAL) and body mass index (BMI) were measured. The regression analyses were performed with IBM SPSS Statistics (Version 24.0).
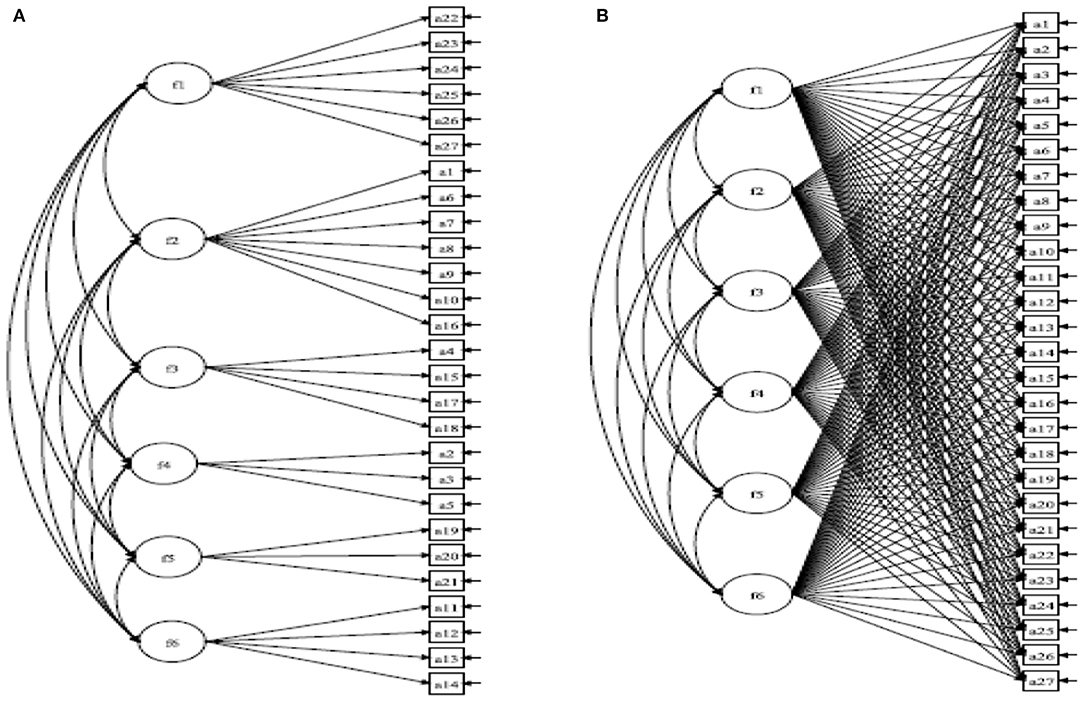
Figure 1. (A) Confirmatory factor analysis (CFA), and (B) exploratory structural equation (ESEM) modeling.
Composite reliability based on the CFA model was used to estimate the internal consistency reliability of each factor. A reliability coefficient of more than 0.70 was considered to be acceptable (48). For discriminant validity, the correlation coefficient between the two factors was lower than 0.85 as the criterion of validity (49). Based on the above fitting indicators, the applicability of the initial model was verified.
Results
Preliminary Analyses
Preliminary investigations showed that all items had no missing values, discrete values, or invalid values. Table 2 displayed the item correlations, means, standard deviations, skewness, and kurtosis. The correlation matrix of all items showed that only four indicators (A16 with A22; A20 with A15; A21with A15; and A21 with A5) were not statistically significant at a = 0.05. The preliminary analyses showed that the data were suitable for CFA. The mean score of the 27-item EOQ was 89.17 (SD = 20.63). The initial univariate skewness and kurtosis of most item scores were above the acceptable ±2.00 limit (49), indicating that the assumption of normality was not valid. Therefore, the MLR parameter estimator was considered suitable for performing CFA and ESEM (50).
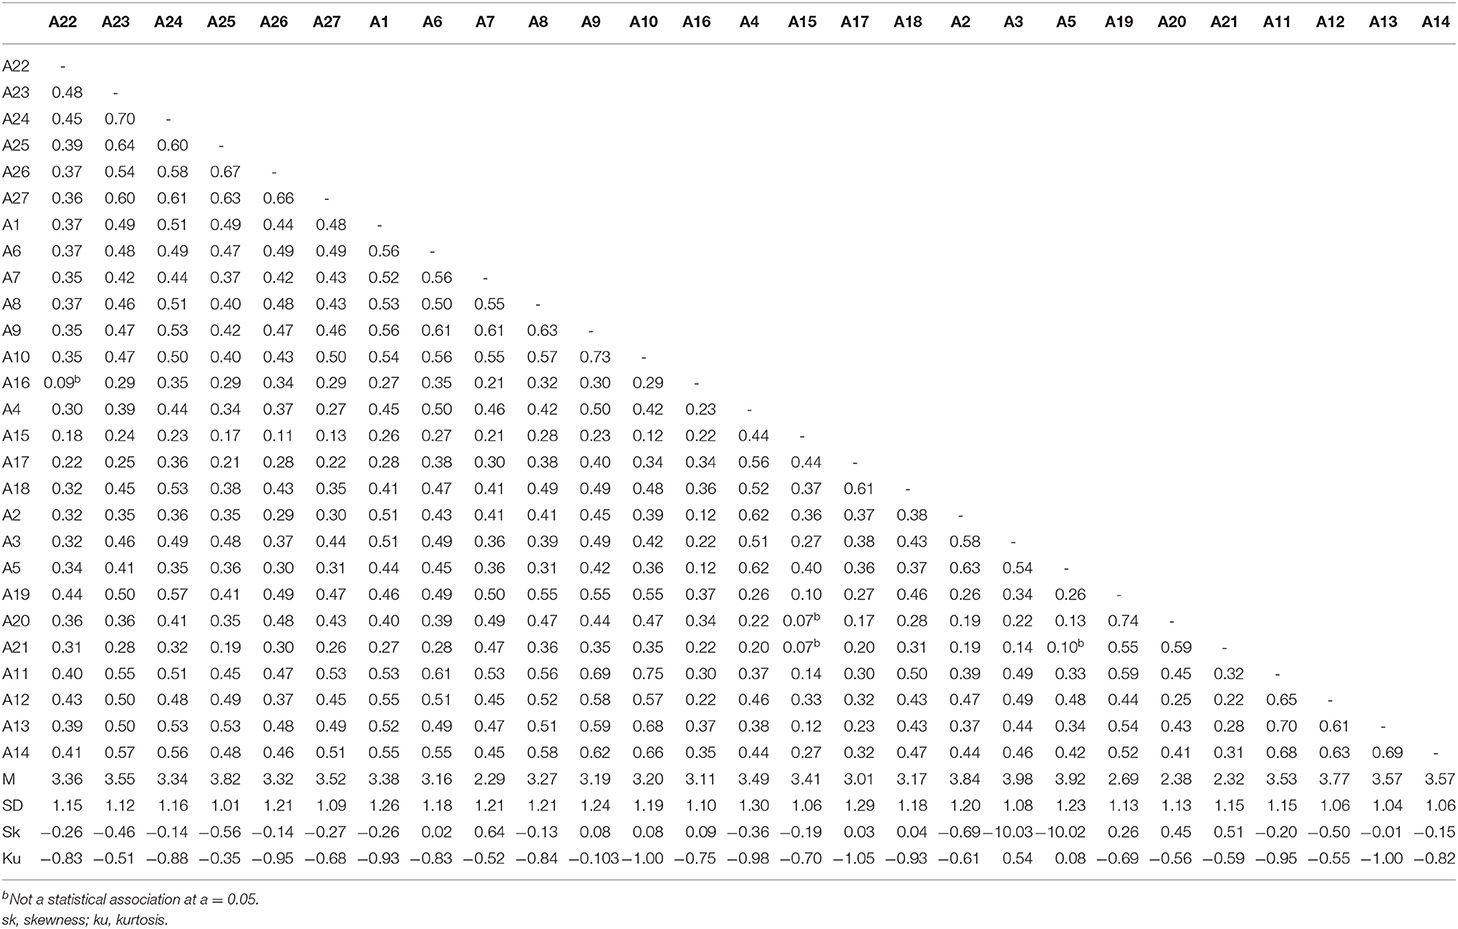
Table 2. Correlation and description for the EOQ items.
Internal Consistency
Table 3 listed the critical indicators of the internal consistency of the Chinese EOQ. The corrected item-total correlations (CITC) for individual items ranged from 0.34 to 0.76, indicating that most of the indicators were suitable for scale construction. The internal consistency of each subscale ranged from 0.80 to 0.89: Self-Control, 0.88; Orientation Exercise, 0.87; Self-Loathing, 0.80; Weight Reduction, 0.81; Identity, 0.83; and Competition, 0.89. The Cronbach's alpha coefficient of the Chinese EOQ was 0.95, indicating that the scale was reliable (50). Coefficient ω was high [0.95, 95% CI (0.94, 0.96)], which meant that 95% of the total variance was explained by the general factor and the specific factors. The amount of explained variance for each subscale was high, with ωS ranging between 0.80 and 0.88. Thus, the internal consistency of the Chinese EOQ was acceptable (51).
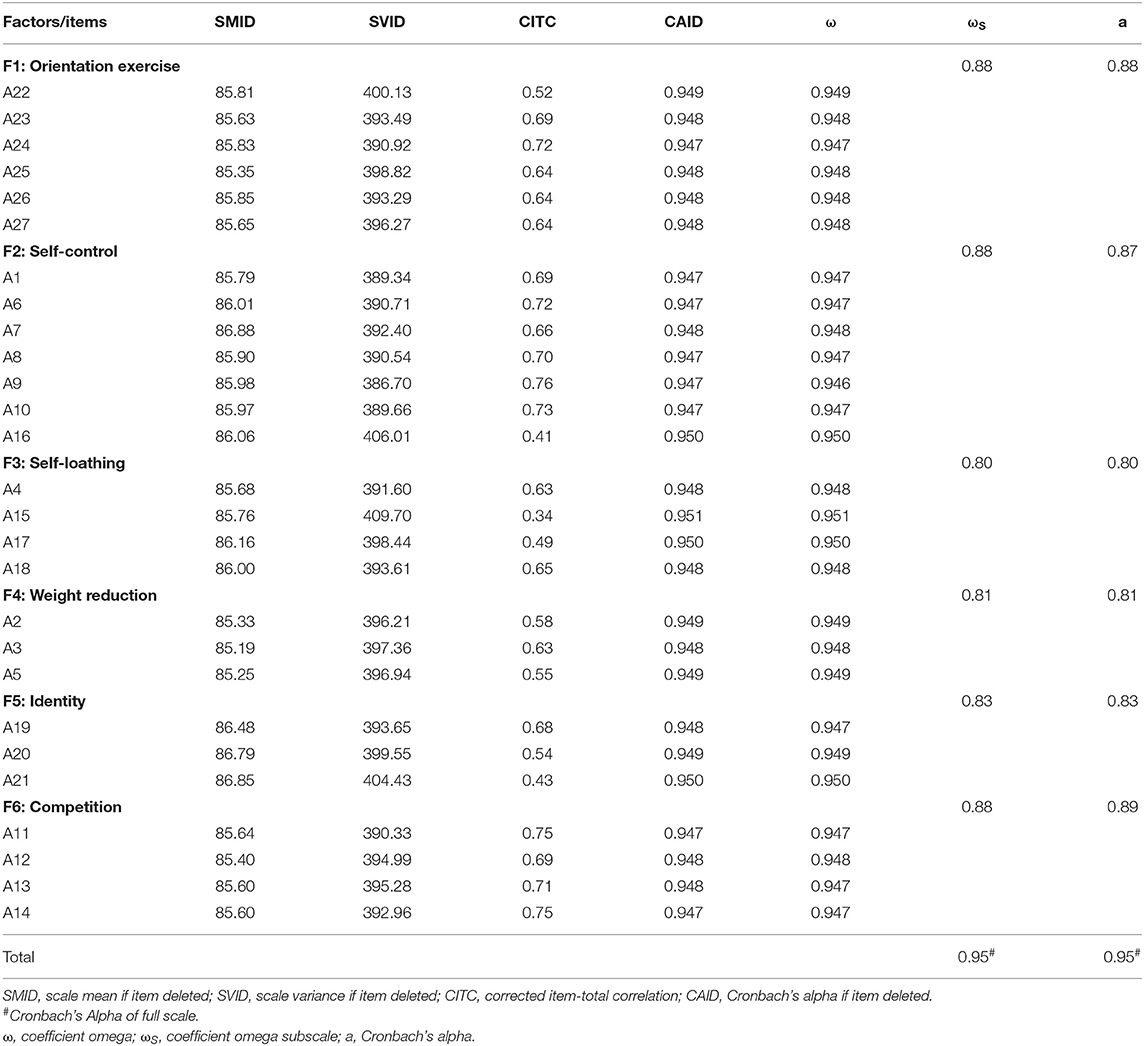
Table 3. Item-total statistics.
Factorial Validity
The CFA results of the initial measurement model (Model-1) reported poor factorial validity. The EOQ that included six factors with a 27-item structure failed to meet most of the criteria for a good model fit, with χ2/df = 810.077/315 = 2.57 < 3, p < 0.001, TLI = 0.897, CFI = 0.885, SRMR = 0.084, and RMSEA = 0.065 (90% CI 0.06–0.071). Although the loading of all items was >0.40 (see Figure 2A), the poorly fitting indices indicated that Model-1 did not fit the data well (52). For models with inadequate fit, it has become common practice to modify the model by deleting unimportant parameters and adding parameters that can improve the fit (49).
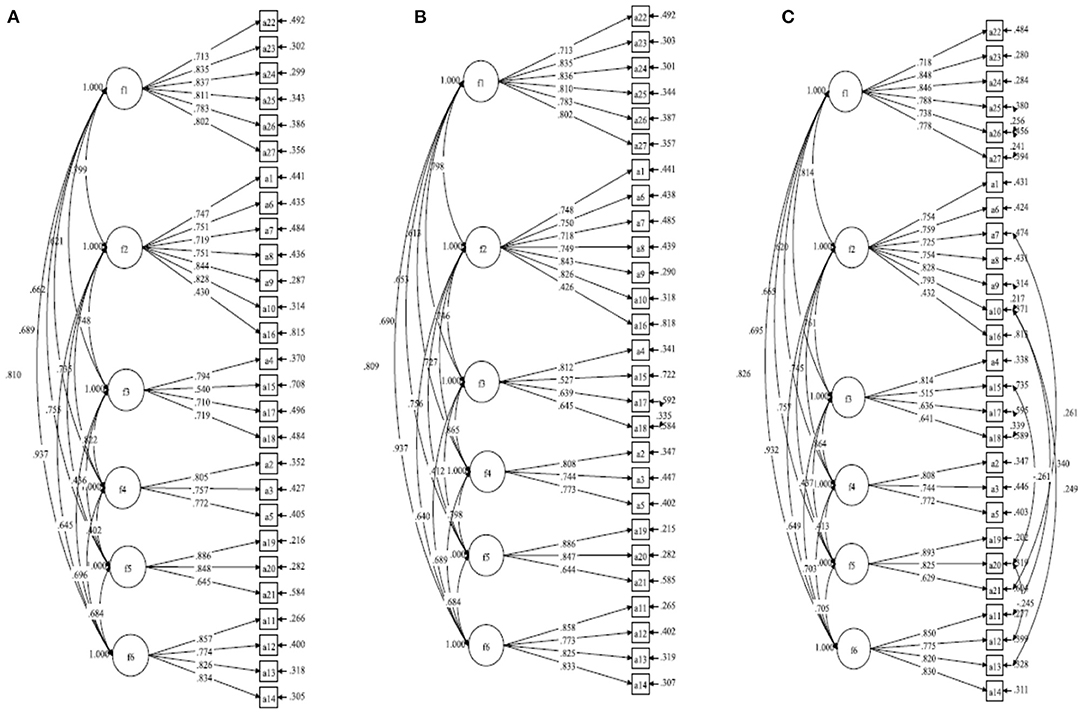
Figure 2. Standardized factor loading for (A) Model-1, (B) Model-2, and (C) Model-8.
Next, we modified the initial measurement model according to the model parameter adjustment principle (49). Based on Model-1, the residuals for item A18 and A17 were correlated to establish a modified Model-2 (Figure 2B). The fitting results of Model-2 showed that the value of χ2 decreased by 24.57, CFI increased by 0.05, TLI increased by 0.15, RMSEA decreased by 0.01, and SRMR decreased by 0.01. Although each fitting index of the model was improved to a certain extent (see Table 3), the fit indices of TLI and SRMR were outside the recommended values. The factor loadings of all items in Model-2 were above 0.40 (Figure 2B).
According to the same model modification principle, the residuals of items A11 with A10, A20 with A15, A20 with A12, A21 with A7, A26 with A25, and A26 with A27 were correlated in turn, and Model-3, Model-4, Model-5, Model-6, Model-7, and Model-8 were established simultaneously (see Table 4). Finally, all fitting indices of Model-8 were within the recommended values (see Figure 2C). However, there was a higher correlation between f2 and f6 with r = 0.932 (p = 0.015), and f3 and f4 with r = 0.864 (p = 0.038). Two pairs of correlation r-values exceeded 0.85, indicating that the discriminant validity had some degree of misfit with the model.
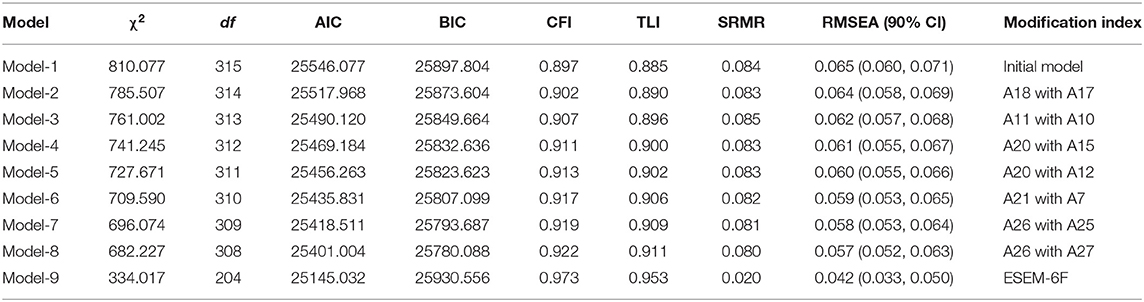
Table 4. Model fit indices for nine Exercise Orientation Questionnaire (EOQ) models.
Further investigation was conducted using ESEM to explore the fitting validity of the model. The fit of the ESEM model (Model-9) showed that the data were acceptable on the fit indices, with TLI = 0.973, CFI = 0.960, SRMR = 0.020, and RMSEA = 0.045 (90% CI 0.33–0.55) (see Table 3). The chi-square test of model fitness was significant, χ2/df = 334.017/204 = 1.64 < 3, p < 0.001, indicating some degree of misfit with the model. Compared with Model-8, the correlation coefficient between each factor of Model-9 established using ESEM was <0.85 (see Table 5), indicating that the fitting of the ESEM model was better than the CFA model (27-item).
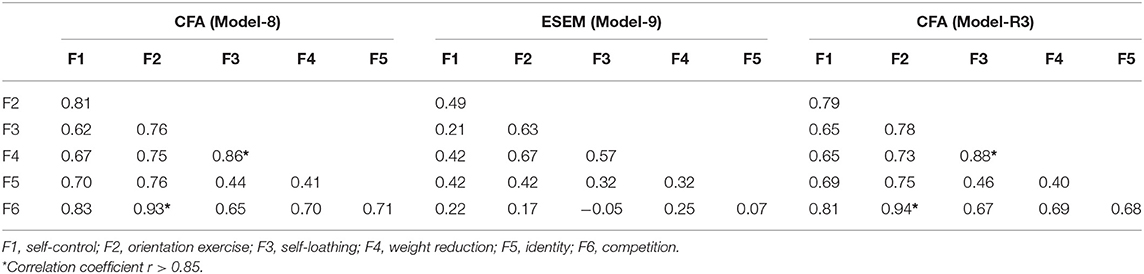
Table 5. Confirmatory factor analysis and exploratory structural equation modeling standardized factor correlations based on the EOQ.
Table 3 presented an analysis Cronbach's alpha if item deleted (CAID). The results showed that the removal of an item did not have a significant impact on the value of the Cronbach's alpha. One of the potential solutions is to shortened the scale or create an abbreviated version (53–56). Therefore, we tried to shorten the scale for the CFA version. Based on the CITC and model fitting index, item A15 was deleted to build a new modified Model-R1. In the same way, Model-R2 was built by deleting item A16. The modified Model-R2 approximate fitting index was >0.90, and the correlation load between each item and factor was >0.6. According to Hermida's recommendations (57), we considered the relevant correction of item residuals for Model-R2. When the residuals of A17 and A18 were related, Model-R3 met the fitting standard (see Table 6 and Figure 3).
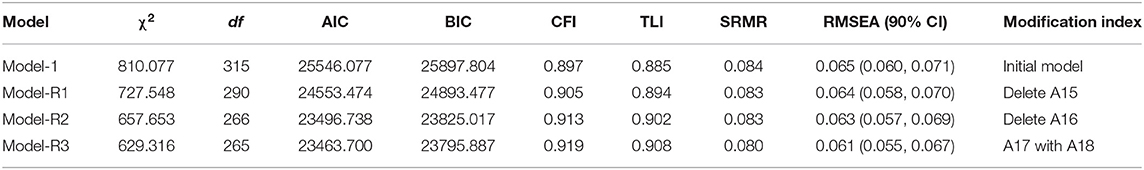
Table 6. Model fit indices for abbreviated EOQ models.
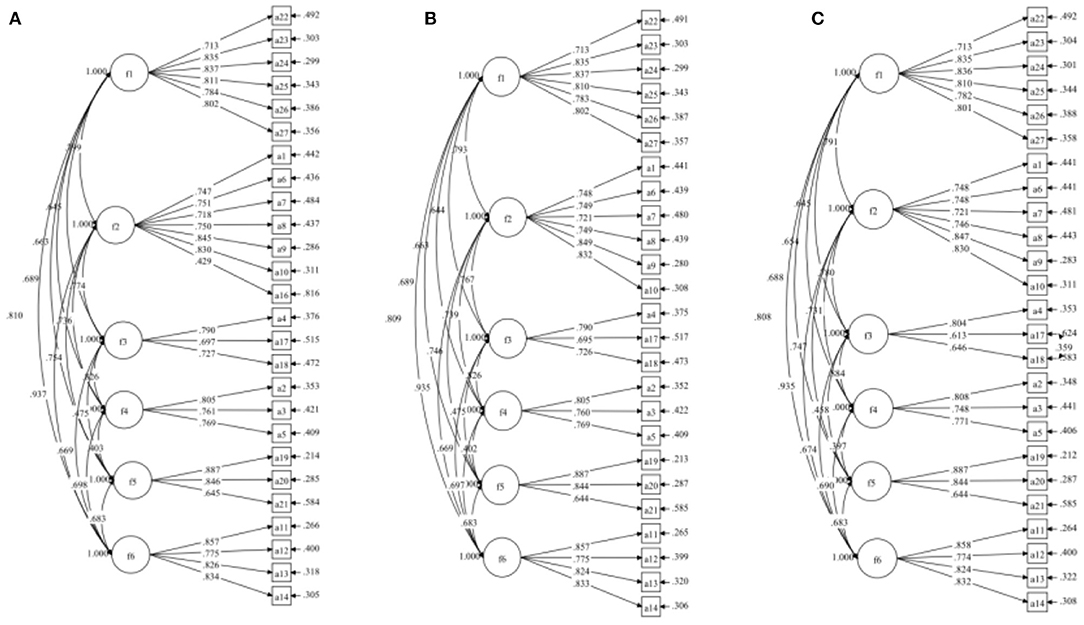
Figure 3. Standardized factor loading for (A) Model-R1, (B) Model-R2, and (C) Model-R3.
The Model-R2 as baseline model (configural model) was used to test measurement invariance for boys and girls. The configural invariance model fit the data well (see Table 7), since all three fit criteria (CFI, TLI and RMSEA) indicated good model fit. The first constrained mode (Model-R4), the weak invariance model, fit the data well (see Table 7). Changes of CFI, TLI, and RMSEA, when the weak invariance model was compared with the configural model, were within recommended values (ΔCFI = −0.003, ΔTLI = 0, ΔRMSEA = 0). This indicated that the items used to estimate the factor loadings had the same meaning for males and females. The second constrained model (Model-R5), the strong invariance model also fit the data well (see Table 7). The results showed the strong invariance (ΔCFI = −0.005, ΔTLI = 0.002, ΔRMSEA = 0.001). The last constrained model (Model-R6), which constrained the factor loadings, item intercept, and residual variances, to produce the strict invariance model was then inspected. The changes of the fit indices were within the acceptable values (ΔCFI = −0.003, ΔTLI = 0.001, ΔRMSEA = 0). Taken together, it can be concluded that the measurement invariance across gender was valid.
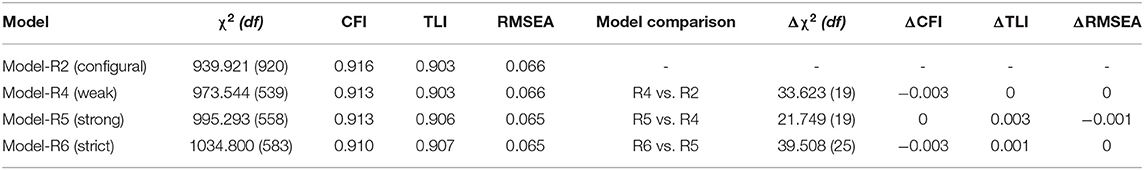
Table 7. The tests of measurement invariance for abbreviated EOQ models.
Table 8 listed multiple regression coefficients describing the effect of participants' gender, age, PAL, and BMI on the factor scores of the Chinese abbreviated version of the EOQ (EOQ-CA). The results showed that gender factor had a significant impact on EOQ-CA (p < 0.05) and its subscale Orientation Exercise (p < 0.05) and Identity (p < 0.05). Self-Loathing (p < 0.05) and Identity (p < 0.05) were affected significantly by the age factor. PAL and BMI had a significant impact on EOQ-CA and each of its subscales (p < 0.01). Further analysis of the PAL subgroup showed the mean of all factors differed significantly (p < 0.01), with the exception of Self-Loathing (p < 0.05) (see Table 9). In addition, the mean results of different groups found that VPA subgroup scored the highest in all factors, followed by MPA, and LPA was the lowest (see Table 9).
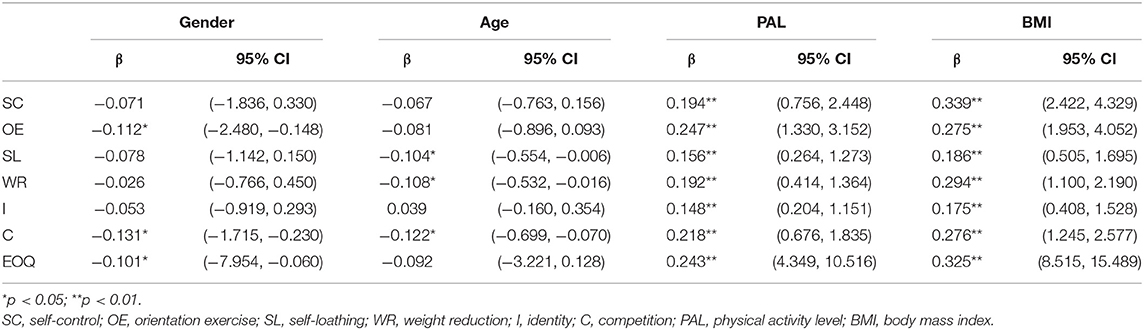
Table 8. Standardized multiple regression coefficients (Partialβ) of Model-R3.
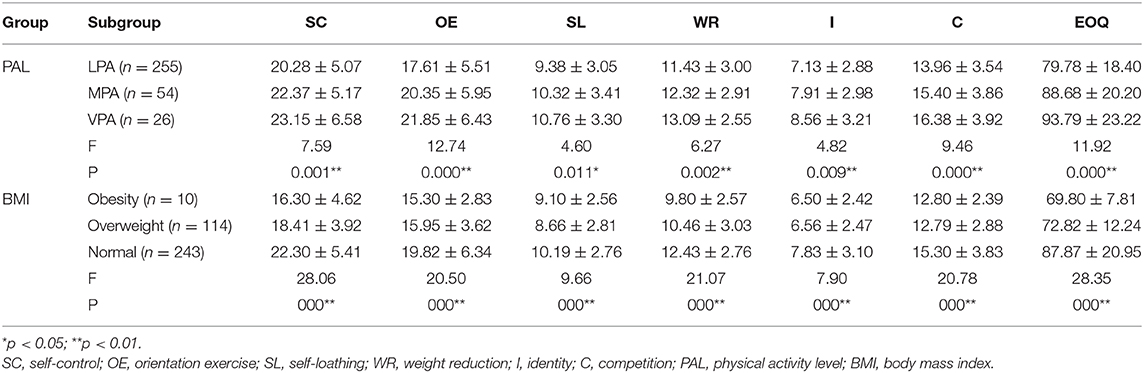
Table 9. Descriptive of mean scores of different PAL and BMI values.
Additionally, Tables 8, 9 displayed the relationship between the EOQ-CA and its subscales with the measures related to with BMI. One-way ANOVA in the BMI group found that the EOQ-CA and its subscales were significant different between obesity, overweight, and normal university students' group (p < 0.01). Table 9 showed the normal subgroup scored the highest in all factors, followed by the overweight subgroup, and the obesity subgroup was the lowest. Thus, the results demonstrated that the EOQ-CA using the translated abbreviation had good concurrent validity.
Discussion
The intention of developing the EOQ was to evaluate the exercise attitudes and behaviors of college students, including their psychological characteristics (16). The purpose of this study was to determine the psychometric characteristics of applying the EOQ to Chinese college students. The confirmatory factor analysis of 27 items showed that the initial model did not achieve model fitness. Accordingly, a model re-specification was performed based on high modification indices by correlating the residual items (58). The fitting parameters of the final model (Model-8) after seven corrections were acceptable. However, the discriminant validity of the modified model—the correlation threshold between the two factors was more than 0.85—did not meet the set standard. After further exploration and verification of the data using the ESEM model (Model-9) and abbreviated version model (Model-R1, R2, R3), the fitting indices of the Model-9 and Model-R3 met the required standard. Multiple regression analysis suggested that gender and age had a partly significant effect on EOQ scores, whereas physical activity level (PAL) and body mass index (BMI) had a significant effect. A comparison of the mean EOQ scores showed that the higher the physical activity level, the higher the EOQ score, and the difference was significant among different physical activity levels. Similarly, normal-weight college students scored higher than the overweight and obesity groups, and the difference was significant.
The factor structure of the initial EOQ was constructed using EFA, and its concurrent validity was verified by the correlation between exercise and EOQ score (16). Although the initial scale reported good reliability and validity, the Chinese version still required a confirmatory analysis considering the cross-cultural differences. The results when using the CFA model to verify the Chinese version of the factor structure suggested that the fit indices of the initial model did not meet the fitting criterion. Re-specification was conducted based on the initial measurement model using seven residual correlations; the model fit indices achieved the basic fitting standard, but the discrimination validity of the CFA modified model was inadequate (49).
Subsequently, ESEM and abbreviated CFA were used to explore the fit indices of the model, and various indicators showed that the ESEM model and abbreviated model (EOQ-CA) fitted better than the original CFA model (48). Multiple regression analysis showed that the level of physical activity and BMI affected the EOQ score, and the higher the level, the greater the score (50). Interestingly, age did not appear to be related to the EOQ score. This confirmed that the age of the initial scale was not significantly correlated with the EOQ score (22). In the initial scale, F3 (Self-Loathing) was the only factor that did not establish concurrent validity. However, the concurrent validity of Self-Loathing was confirmed in this study (22).
As reported in numerous review articles, CFA models often fail to meet standards of good measurement because of the strict requirement of zero cross-loadings (59–62). This overly restrictive assumption results in “biased parameter estimates which permeate across other parameter estimates in the model” (63). There is another possible explanation to explain why the CFA results did not fulfill the criteria for model fit: because the original developers of the scale only relied on EFA for its development, the scale may suffer from a potential problem of factorial validity. This problem is common for those scales developed before CFA became popular and user friendly. One of the potential solutions is to shorten the scale or create an abbreviated version (53–56). We shortened the scale by deleting two items and verified that the concurrent validity of EOQ-CA showed a greater fit. Measurement invariance of the abbreviated version questionaries also supports the consistency of evaluations between males and females. ESEM is an optimal integration between EFA and CFA that incorporates many advantages of CFA, but its limitation is a lack of freedom (47). ESEM has been widely used in psychological research but, to date, no study has applied ESEM to the EOQ (61, 64–66).
In summary, the ESEM model and CFA abbreviated version model have better fitting parameters than the original CFA model (63). The reliability and validity of the EOQ-CA fit the required standard, and it is a reliable tool for measuring college students' exercise attitudes and behavior.
Nonetheless, the present study still has some limitations. The first relates to data management. Self-managed reporting methods may cause bias in the collected data. Second, there was a lack of professional college athletes among the participants. In future research, first, we will strengthen the design to address these issues and increase the diversity of research objects. Second, we will enlarge the sample size and monitor the quality of sample data. In addition, we will carry out EOQ-CA measurement invariance test and introduce a two-factor model to further verify the structure of EOQ-CA.
Conclusions
The 25-item Chinese abbreviated version of the EOQ (EOQ-CA) scale, with six factors, provided an acceptable model fit for good scale reliability. The results of the present study show that the EOQ-CA can be used to predict exercise attitudes or behavior of Chinese University students in relation to physical activity and BMI. The verification of the EOQ-CA scale also expands the global study and application of this assessment instrument.
Data Availability Statement
The raw data supporting the conclusions of this article will be made available by the authors, without undue reservation.
Ethics Statement
The studies involving human participants were reviewed and approved by The Scientific Ethics Committee of Southwest University. Written informed consent to participate in this study was provided by the participants' legal guardian/next of kin.
Author Contributions
JC, LiY, YY, XL, YL, HS, MY, and LeY: data collection. JC, LiY, YY, and NS: data analysis, conception, and design. JC, YY, and NS: research design, writing the manuscript and revision. All authors contributed to the article and approved the submitted version.
Funding
This research was funded by National Social Science Fund (15CTY011), the Fundamental Research Funds for the Central Universities of Southwest University (SWU1709240), the Innovation Team of Southwest University (SWU1909105), and Chongqing Educational Science Planning Project (2020-GX-257).
Conflict of Interest
The authors declare that the research was conducted in the absence of any commercial or financial relationships that could be construed as a potential conflict of interest.
Acknowledgments
We would like to thank all volunteers who participated in this study, as well as the study staff for their support. We sincerely thank CUAG for providing the data collection platform. Besides, we appreciate the reviewers' comments and suggestions.
References
1. Carson V, Stone M, Faulkner G. Patterns of sedentary behavior and weight status among children. Pediatr. Exerc. Sci. (2014) 26:95–102. doi: 10.1123/pes.2013-0061
2. Kell KP, Cardel MI, Bohan Brown MM, Fernández JR. Added sugars in the diet are positively associated with diastolic blood pressure and triglycerides in children. Am. J. Clin. Nutr. (2014) 100:46–52. doi: 10.3945/ajcn.113.076505
3. Leech RM, McNaughton SA, Timperio A. The clustering of diet, physical activity and sedentary behavior in children and adolescents: a review. Int. J. Behav. Nutr. Phys. Act. (2014) 11:1–18. doi: 10.1186/1479-5868-11-4
4. Wang K, Xue Y, Fan X, Huang T, Chen Z. Sedentary behaviors, psychological status, and sleep quality in Chinese university students. Soc. Behav. Pers. (2019) 47:1–10. doi: 10.2224/sbp.7446
5. Gong QH, Li SX, Wang SJ, Wu YH, Han LY, Li H. Sleep duration and overweight in Chinese adolescents: a prospective longitudinal study with 2-year follow-up. Sleep Breath. (2020) 24:321–8. doi: 10.1007/s11325-019-01979-0
6. World Health Organization [WHO] (2020). Physical Activity. Available online at: https://www.who.int/health-topics/physical-activity#tab=tab_1 (accessed July 16, 2018).
7. Kim MS, Cardinal BJ. Differences in university students' motivation between a required and an elective physical activity education policy. J Am. Coll. Health. (2019) 67:207–14. doi: 10.1080/07448481.2018.1469501
8. Thomas AM, Beaudry KM, Gammage KL, Klentrou P, Josse AR. Physical activity, sport participation, and perceived barriers to engagement in first-year Canadian University students. J. Phys. Act. Health. (2019) 16:437–46. doi: 10.1123/jpah.2018-0198
9. Murphy JJ, MacDonncha C, Murphy MH, Murphy N, Nevill AM, Woods CB. What psychosocial factors determine the physical activity patterns of university students? J. Phys. Act. Health. (2018) 16:325–32. doi: 10.1123/jpah.2018-0205
10. Lores AP, Murica JAM, Gutierrez M, Sicilia A. Motivation of Spanish university students regarding practice of physical activity and sport. J. Behav. Sci. (2017) 17:1–18.
11. Onetti-Onetti W, Chinchilla-Minguet JL, Martins FML, Castillo-Rodriguez A. Self-concept and physical activity: differences between high school and university students in Spain and Portugal. Front. Psychol. (2019) 10:1333. doi: 10.3389/fpsyg.2019.01333
12. Di Benedetto M, Towt CJ, Jackson ML. A cluster analysis of sleep quality, self-care behaviors, and mental health risk in Australian University students. Behav. Sleep Med. (2020) 18:309–20. doi: 10.1080/15402002.2019.1580194
13. Wakayama H, Watanabe E, Inomata K. Exploratory factor analysis of the sport orientation questionnaire and the task and ego orientation in sport questionnaire in a Japanese sport setting. Percept. Mot. Skills. (2002) 95:1179–86. doi: 10.2466/pms.2002.95.3f.1179
14. Li M. The influence of psychological needs and exercise motivation on exercise dependence among chinese college students. Psychiatr. Q. (2018) 89:983–90. doi: 10.1007/s11126-018-9595-2
15. Yang M, Viladrich C, Cruz J. Measuring motivation in physical education among chinese and spanish adolescents: comparing the psychometric properties of perceived locus of causality scale. Revista Psicología del Deporte. (2019) 28:87–96.
16. Yates A, Edman J, Crago M, Crowell D, Zimmerman R. Measurement of exercise orientation in normal subjects: gender and age differences. Pers. Indiv. Diff. (1999) 27:199–209. doi: 10.1016/S0191-8869(98)00121-4
17. Nicholls R. 15 Minutes to Happiness: Easy, Everyday Exercises to Help You be the Best You Can be. London: Bonnier Publishing Ltd (2017).
18. Swain DP, Franklin BA. Comparison of cardioprotective benefits of vigorous versus moderate intensity aerobic exercise. Am. J. Cardiol. (2006) 97:141–7. doi: 10.1016/j.amjcard.2005.07.130
19. Penedo FJ, Dahn JR. Exercise and well-being: a review of mental and physical health benefits associated with physical activity. Curr. Opin. Psychiatry. (2005) 18:189–93. doi: 10.1097/00001504-200503000-00013
20. Field LK, Steinhardt MA. The relationship of internally directed behavior to self-reinforcement, self-esteem, and expectancy values for exercise. Am. J. Health Promot. (1992) 7:21–7. doi: 10.4278/0890-1171-7.1.21
21. Brisswalter J, Collardeau M, René A. Effects of acute physical exercise characteristics on cognitive performance. Sports Med. (2002) 32:555–66. doi: 10.2165/00007256-200232090-00002
22. Yates A, Edman JD, Crago M, Crowell D. Using an exercise-based instrument to detect signs of an eating disorder. Psychiatry Res. (2001) 105:231–41. doi: 10.1016/S0165-1781(01)00341-9
23. Draeger J, Yates A, Crowell D. The obligatory exerciser: assessing an overcommitment to exercise. Phys. Sports Med. (2005) 33:13–23. doi: 10.3810/psm.2005.06.101
24. Aruguete MS, Yates A, Edman JL. Further validation of the self-loathing subscale as a screening tool for eating disorders. Eating Disord. (2007) 15:55–62. doi: 10.1080/10640260601044493
25. Hausenblas HA, Downs DS. How much is too much? The development and validation of the exercise dependence scale. Psychol. Health. (2002) 17:387–404. doi: 10.1080/0887044022000004894
26. Yates A, Edman JD, Crago M, Crowell D. Eating disorder symptoms in runners, cyclists, and paddlers. Addict. Behav. (2003) 28:1473–80. doi: 10.1016/S0306-4603(02)00263-0
27. Shen Y, Chang J. Research on the physical attributes evaluation criterion of college students. Adv. Phys. Educ. (2014) 4:6–9. doi: 10.4236/ape.2014.41002
28. Chang J, Yi Y, Song N. Development and validation of a short version sport orientation questionnaire for Chinese adolescents (SOQ-CA). Front. Psychol. (2020) 11:1039. doi: 10.3389/fpsyg.2020.01039
29. Craig CL, Marshall AL, Sjöström M, Bauman AE, Booth ML, Ainsworth BE, et al. International physical activity questionnaire: 12-country reliability and validity. Med. Sci. Sports Exerc. (2003) 35:1381–95. doi: 10.1249/01.MSS.0000078924.61453.FB
30. Hagströmer M, Oja P, Sjöström M. The international physical activity questionnaire (IPAQ): a study of concurrent and construct validity. Publ. Health Nutr. (2006) 9:755–62. doi: 10.1079/PHN2005898
31. Qu NN, Li KJ. Study on the reliability and validity of international physical activity questionnaire (Chinese vision, IPAQ). Zhonghua Liu Xing Bing Xue Za Zhi. (2004) 25:265–8.
32. Fan M, Lyu J, He P. Chinese guidelines for data processing and analysis concerning the international physical activity questionnaire. Zhonghua Liu Xing Bing Xue Za Zhi. (2014) 35:961–4.
33. Reise SP, Bonifay WE, Haviland MG. Scoring and modeling psychological measures in the presence of multidimensionality. J. Pers. Assess. (2013) 95:129–40. doi: 10.1080/00223891.2012.725437
34. Béland S, Cousineau D, Loye N. Utiliser le coefficient omega de McDonald à la place de l'alpha de Cronbach. McGill J. Educ. (2017) 52:791–804. doi: 10.7202/1050915ar
35. Gignac GE, Reynolds MR, Kovacs K. Digit span subscale scores may be insufficiently reliable for clinical interpretation: distinguishing between stratified coefficient alpha and omega hierarchical. Assessment. (2019) 26:1554–63. doi: 10.1177/1073191117748396
36. Li CH. Confirmatory factor analysis with ordinal data: comparing robust maximum likelihood and diagonally weighted least squares. Behav. Res. Methods. (2016) 48:936–49. doi: 10.3758/s13428-015-0619-7
37. Hair JF, Black WC, Babin BJ, Anderson RE. Multivariate Data Analysis. 7th ed. Upper Saddle River, NJ: Pearson Prentice Hall (2010).
38. Bentler PM, Bonett DG. Significance tests and goodness of fit in the analysis of covariance structures. Psychol. Bull. (1980) 88:588–606. doi: 10.1037/0033-2909.88.3.588
39. Byrne BM. Structural Equation Modeling with Lisrel, Prelis, and Simplis: Basic Concepts, Applications, and Programming. London: Erlbaum Associates (1998).
40. Hu LT, Bentler PM. Cuto? criteria for fit indexes in covariance structure analysis: conventional criteria versus new alternatives. Struct. Equation Model. (1999) 6:1–55. doi: 10.1080/10705519909540118
41. Kline RB. Principles and Practice of Structural Equation Modeling. 2nd ed. New York, NY: Guilford Press (2005).
42. Schreiber JB, Nora A, Stage FK, Barlow EA, King J. Reporting structural equation modeling and confirmatory factor analysis results: a review. J. Educ. Res. (2006) 99:323–38. doi: 10.3200/JOER.99.6.323-338
43. Brown TA. Confirmatory Factor Analysis for Applied Research. 2nd ed. New York, NY: Guilford Publications (2014).
44. Muthén LK, Muthén BO. Mplus User's Guide. 7th ed. Los Angeles, CA: Muthén and Muthén (1998–2012).
45. Wang J, Wang X. Structural Equation Modeling Applications Using Mplus. Chichester: John Wiley and Sons Ltd (2012). doi: 10.1002/9781118356258
46. Byrne BM. Structural Equation Modeling With Mplus: Basic Concepts, Applications, and Programming. New York, NY: Routledge, Taylor and Francis Group (2013). doi: 10.4324/9780203807644
47. Satorra A, Bentler PM. A scaled deference chi-square test statistic for moment structure analysis. Psychometrika. (2001) 66:507–14. doi: 10.1007/BF02296192
48. Marsh HW, Morin AJ, Parker PD, Kaur G. Exploratory structural equation modeling: an integration of the best features of exploratory and confirmatory factor analysis. Ann. Rev. Clin. Psychol. (2014) 10:85–110. doi: 10.1146/annurev-clinpsy-032813-153700
49. Kline RB Principles and Practice of Structural Equation Modeling. 3rd ed. New York, NY: The Guilford Press (2011).
50. Tabachnick BG, Fridell LS. Using Multivariate Statistics. 6th ed. Boston, MA: Pearson Education (2013).
51. Gäde JC, Schermelleh-Engel K, Klein AG. Disentangling the common variance of perfectionistic strivings and perfectionistic concerns: a bifactor model of perfectionism. Front. Psychol. (2017) 8:160. doi: 10.3389/fpsyg.2017.00160
53. Fung S, Fung ALC. Development and evaluation of the psychometric properties of a brief parenting scale (PS-7) for the parents of adolescents. PLoS ONE. (2020) 15:e0228287. doi: 10.1371/journal.pone.0228287
54. Fung S, Chow EO, Cheung C. Development and evaluation of the psychometric properties of a brief wisdom development scale. Int. J. Environ. Res. Publ. Health. (2020) 17:2717. doi: 10.3390/ijerph17082717
55. Fung S, Kong CYW, Huang Q. Evaluating the dimensionality and psychometric properties of the brief self-control scale amongst chinese university students. Front. Psychol. (2020) 10: 2903. doi: 10.3389/fpsyg.2019.02903
56. Smith GT, McCarthy DM, Anderson KG. On the sins of short-form development. Psychol. Assess. (2000) 12:102–11. doi: 10.1037/1040-3590.12.1.102
57. Hermida R. The problem of allowing correlated errors in structural equation modeling: concerns and considerations. Comput. Methods Soc. Sci. (2015) 3:5–17.
58. Liu KT, Kueh YC, Arifin WN, Ismail Ibrahim M, Shafei MN, Kuan G. Psychometric properties of the decisional balance scale: a confirmatory study on Malaysian university students. Int. J. Environ. Res. Publ. Health. (2020) 17:2748. doi: 10.3390/ijerph17082748
59. Marsh HW, Hau KT, Grayson D. Goodness of fit evaluation in structural equation modeling. In: Maydeu-Olivares A, McArdle J, editors. Psychometrics A Festschrift to Roderick P McDonald. Hillsdale, NJ: Erlbaum (2005), p. 275–340.
60. Marsh HW. Self-Concept Theory, Measurement and Research Into Practice: The Role of Self-Concept in Educational Psychology. Leicester: British Psychological Society (2007).
61. Marsh HW, Lüdtke O, Muthén B, Asparouhov T, Morin AJ, Trautwein U, et al. A new look at the big five factor structure through exploratory structural equation modeling. Psychol. Assess. (2010) 22:471–91. doi: 10.1037/a0019227
62. Dicke T, Marsh HW, Riley P, Parker PD, Guo J, Horwood M. Validating the copenhagen psychosocial questionnaire using Set-ESEM: identifying psychosocial risk factors in a sample of school principals. Front. Psychol. (2018) 9:584. doi: 10.3389/fpsyg.2018.00584
63. Marsh HW, Guo J, Dicke T, Parker PD, Craven RG. Confirmatory factor analysis (cfa), exploratory structural equation modeling (esem), and set-esem: optimal balance between goodness of fit and parsimony. Multivariate Behav. Res. (2020) 55:102–19. doi: 10.1080/00273171.2019.1602503
64. Marsh HW, Muthén B, Asparouhov T, Lüdtke O, Robitzsch A, Morin AJ, et al. Exploratory structural equation modeling, integrating CFA and EFA: application to students' evaluations of university teaching. Struct. Equation Model. (2009) 16:439–76. doi: 10.1080/10705510903008220
65. Rosellini AJ, Brown TA. The NEO five-factor inventory: latent structure and relationships with dimensions of anxiety and depressive disorders in a large clinical sample. Assessment. (2011) 18:27–38. doi: 10.1177/1073191110382848
66. Sánchez-Carracedo D, Barrada JR, López-Guimerà G, Fauquet J, Almenara CA, Trepat E. Analysis of the factor structure of the sociocultural attitudes towards appearance questionnaire (SATAQ-3) in Spanish secondary-school students through exploratory structural equation modeling. Body Image. (2012) 9:163–71. doi: 10.1016/j.bodyim.2011.10.002
Keywords: factor analysis, reliability, psychometric, university students, exercise orientation, physical activity
Citation: Chang J, Yong L, Yi Y, Liu X, Song H, Li Y, Yang M, Yao L and Song N (2021) Psychometric Properties of the Exercise Orientation Questionnaire: A Confirmatory Study on Chinese University Students. Front. Public Health 9:574335. doi: 10.3389/fpubh.2021.574335
Received: 23 June 2020; Accepted: 25 March 2021;
Published: 22 April 2021.
Edited by:
Noel C. Barengo, Florida International University, United StatesReviewed by:
Sai-fu Fung, City University of Hong Kong, Hong KongOlutayo Aloba, Obafemi Awolowo College of Health Sciences, Central African Republic
Copyright © 2021 Chang, Yong, Yi, Liu, Song, Li, Yang, Yao and Song. This is an open-access article distributed under the terms of the Creative Commons Attribution License (CC BY). The use, distribution or reproduction in other forums is permitted, provided the original author(s) and the copyright owner(s) are credited and that the original publication in this journal is cited, in accordance with accepted academic practice. No use, distribution or reproduction is permitted which does not comply with these terms.
*Correspondence: Yali Yi, eWl5YWxpX3ludUAxNjMuY29t; Naiqing Song, c29uZ25xQHN3dS5lZHUuY24=
†These authors have contributed equally to this work and share first authorship