 Ginger C. Hanson1*
 Anjali Rameshbabu2
 Todd E. Bodner3
 Leslie B. Hammer2
 Diane S. Rohlman4
 Ryan Olson2
 Brad Wipfli3
 Kerry Kuehl5
 Nancy A. Perrin1
 Lindsey Alley2
 Allison Schue6
 Sharon V. Thompson7
 Megan Parish8
- 1School of Nursing, Johns Hopkins University, Baltimore, MD, United States
- 2Oregon Healthy Workforce Center, Oregon Institute of Occupational Health Sciences, Oregon Health & Science University, Portland, OR, United States
- 3OHSU-PSU School of Public Health, Portland State University, Portland, OR, United States
- 4Occupational and Environmental Health, University of Iowa, Iowa City, IA, United States
- 5School of Medicine, Oregon Health & Science University, Portland, OR, United States
- 6College of Osteopathic Medicine, Western University of Health Sciences, Lebanon, OR, United States
- 7Division of Nutritional Sciences, University of Illinois at Urbana-Champaign, Urbana, IL, United States
- 8Confluence Health, Wenatchee, WA, United States
Objective: The aim of this study was to present safety, health and well-being profiles of workers within five occupations: call center work (N = 139), corrections (N = 85), construction (N = 348), homecare (N = 149), and parks and recreation (N = 178).
Methods: Baseline data from the Data Repository of Oregon's Healthy Workforce Center were used. Measures were compared with clinical healthcare guidelines and national norms.
Results: The prevalence of health and safety risks for adults was as follows: overweight (83.2%), high blood pressure (16.4%), injury causing lost work (9.9%), and reported pain (47.0%). Young workers were least likely to report adequate sleep (46.6%). Construction workers reported the highest rate of smoking (20.7%). All of the adult workers reported significantly lower general health than the general population.
Conclusion: The number of workers experiencing poor safety, health and well-being outcomes suggest the need for improved working conditions.
Introduction
There is growing awareness in the literature that providing a healthy labor force requires integrated consideration of each workplace's impact on employees' safety, health, and well-being (1). This relationship between work and well-being is further impacted by changing trends within the American workforce as well as the nature of work. For example, there is a growing number of working older adults. It is estimated that by 2024, the employment rate of workers 65–74 years is projected to grow by 55% and that of workers 75 years and older is expected to grow by 86% (2). Further, while physically hazardous jobs with high risk of injury and illness continue to exist, jobs that increase the risk of chronic illness are becoming increasingly prevalent as employees remain inactive for long hours, experience high job stress and burnout, and face greater job insecurity and occupational health disparities.
Moreover, the prevalence of preventable chronic health conditions across all age groups is increasing (3). About 60% of the U.S. population suffers from at least one chronic health condition (4), and healthcare costs associated with these conditions account for 75% of healthcare spending (5). Modifiable exposures and health risk factors such as stress, physical inactivity, and obesity account for ~26% of employer healthcare costs, at $761 per employee (6).
Occupational injuries in the U.S. workforce continue to be a concern, with 3.2 cases per 100 full-time workers in the private sector and 5.0 per 100 in the public sector in 2014 (7). Furthermore, there are bi-directional interactions of safety and health. For example, workers with obesity who experience workplace injuries experience 80.0% greater working time loss and incur 81.4% higher costs than workers without obesity (8). Another example can be found among commercial truck drivers, where drivers with untreated sleep apnea have a five-fold risk of a serious crash (9). A holistic intervention approach that targets workplace safety, health, and worker well-being can curtail costs from largely preventable workplace injuries and chronic illnesses.
To this end, in 2011, the National Institute for Occupational Safety and Health (NIOSH) launched Total Worker Health® (TWH), an approach that recognizes that work is a key determinant of one's health and well-being. This approach prioritizes a hazard-free work environment and emphasizes integrated interventions that collectively target worker safety, health, and well-being. TWH is defined as policies, programs, and practices that integrate protection from work-related safety/health hazards with promotion of injury and illness prevention efforts to advance worker well-being (10, 11). As part of this effort, NIOSH funded the Total Worker Health Centers of Excellence (12), one of which is the Oregon Healthy Workforce Center (OHWC) (13).
An integrated effort first requires monitoring of the safety, health, and well-being risk factors at employee and organizational levels; doing so will help us identify targets for change. At OHWC, we have created a repository of data collected via a set of common measures used across multiple projects, with the goal of comparing safety and health data of participants from various industry sectors. This fairly novel approach has the potential to improve the quality and utility of occupational health research by facilitating stronger comparisons across populations.
Common Measures Approach vs. Meta-Analyses
Occupational health meta-analyses have helped identify relationships between workplace risk factors and employee health outcomes, including correlations between job strain and leisure-time physical inactivity (14), and work stress and tobacco smoking (15). Although such meta-analyses can be powerful, measuring the same construct using different survey items on different scales of measurement, can add error to the conclusions. Meta-analyses can overcome differences in measurement tools by using effect sizes that serve as a standardized measure. Although this approach works well when examining the relationship between different variables, it cannot be applied when comparing single-risk factors across different occupational groups. Using the same measure across studies is a way to increase the precision of the measurement by reducing variability due to the way the survey items are measured.
A common measures approach has multiple advantages. We can utilize the same measures across different study populations to benchmark comparisons of the data. Further, given that there are 19,256 unique industry sectors in the U.S. workforce (16), standardizing the safety and health measures across sectors within occupational safety and health intervention studies allows us to test the effectiveness of program components within and between populations. In turn, this will expedite the process of translating and disseminating interventions to diverse work settings (17). The goal to increase standardization in measurement is consistent with NIH's funding to develop and promote PROMIS®, a set of standard measures that assess physical, social, and mental health among adults and children (18).
Comparing Common Outcomes Across Studies vs. Population-Based Studies
Most studies examining health risks have focused on a specific occupational setting or have used random sampling to estimate the overall population risk (19–23). Although both of these methods make important contributions to understanding the relationship between work and health, both methods leave some gaps. For example, general population studies typically include working and non-working individuals. Further, information about occupations may be limited to broad categories such as white-collar vs. blue-collar occupations (22). All of the population-based studies we found were conducted among working populations outside of the United States, often in European countries where governments sponsor recurring studies on working conditions (15, 20, 21, 24). Generalizations to the U.S. are limited due to possible differences in national policies, work experiences, organizational culture, population health status, and occupational health risk factors. Moreover, large population studies are costly and are conducted only periodically. For example, the European Working Conditions Surveys are collected every 5 years and focus on work-related exposures, not on the impact of work on individual health behaviors (21).
A common measures approach has unique strengths and weaknesses. It can be a powerful research strategy to surveil the safety and health of the workforce, make comparisons between occupations, and inform intervention strategies that are best suited within and across workplace settings. A challenge of the common measures approach is that it can involve a high degree of coordination and buy-in from separate collaborators. However, the advantage is the ability to use individual data on the same scale of measurement to make direct comparisons. This approach may be less expensive and resource-intensive than larger population-based studies. The advantage of a less expensive approach is that it can be done more frequently or fill in the gaps between costly population-based occupational groups. These “grass roots” efforts can be especially helpful in continuously monitor the safety and health of workers as the nature of the work continues to evolve with changes in technology, shifts in economic policies, and other changing factors in the landscape of work.
We found one other study that uses this common measures approach: Community Interventions for Health (CIH)—a collaboration that seeks to understand the impact of health behavior interventions on health outcomes in developing countries (25). Each country agrees to use a core set of measures designed in a way that adds culturally relevant examples and appropriate items. This approach enables CIH to assemble large datasets from multiple countries and highlight the relationships that are common across different countries (26–28).
The OHWC Common Measures Data Repository currently includes data from five separate studies, and we have compared the safety, health, and well-being outcomes of working populations across different occupations. OHWC presents collective and unique profiles of these worker groups: call center workers, corrections officers, construction workers, homecare workers, and parks and recreation workers. Each work setting includes unique hazards and risk factors, and physical and psychological demands (29). For example, homecare workers often receive little safety training or health benefits, work primarily alone, and are responsible for lifting and moving their consumer-employers multiple times per day (30–32). Construction workers also face considerable physical demands, but have a great deal more supervision and adhere to rigid schedules, making them particularly susceptible to issues regarding work-family conflicts and psychological stress (33).
Methods
Measures
Baseline data were gathered from five studies funded by NIOSH. A standardized set of measures was agreed upon prior to data collection for each study. From this set, individual study teams selected the measures that best fit their needs. Thus, not every sample reported data on every variable. For purposes of our study, we chose measures of safety (injuries), health [pain, body mass index (BMI), blood pressure], health behaviors (smoking, sleep, exercise), and well-being (health status) used by at least three of our studies. Where possible we computed these variables so that they could be compared with clinical healthcare recommendations or national norms. Additionally, biomarker assessment was conducted by a trained research assistant unless otherwise indicated.
Injuries
Injuries were measured with a single item: “In the last 6-months, if you had 1 or more injuries at work that required you to miss work on following shifts, how many total work days did you miss?” Responses were coded 0 (No missed days) or 1 (Yes, 1 or more missed days). The 6-month timeframe was chosen because research indicates that participant recollection of medical events are less accurate for 1-year than for 1-month (34) however, injuries are rare and thus 1-month was not ideal. Given this 6-months seemed a reasonable compromise between exposure and accuracy.
Pain
Musculoskeletal pain that interfered with normal activities was measured with four items adapted from the Standardized Nordic Questionnaires for the Analysis of Musculoskeletal Symptoms (35). The items asked how often in the last 3 months pain interfered with normal activities at work or at home. The following body areas were included: neck/shoulder, lower back, wrist or forearm, and lower extremities. For the present study, participants were coded as 0 if they answered “not at all” to all questions and 1 if they reported any interference with work on any of the four items.
Health Status
Health status was measured using the SF12v2, which contains 12 survey items measuring eight subscales: general health, physical functioning, role physical, role emotional (i.e., ability to perform role-related responsibilities due to emotional or physical health issues) bodily pain, mental health, vitality, and social functioning. The scale has been validated for use in general U.S. populations, in 10 other countries, and in populations of individuals with a variety of health conditions. Extensive information about the reliability and validity of the SF12v2 can be found in the SF12v2 instruction manual (36). Scores were normed using means and standard deviations from a representative sample of the general U.S. population described in the Participants section of the present paper. Per instructions in the manual, z-scores were computed by subtracting the provided mean for each subscale from the general U.S. sample and dividing by the provided standard deviation for the subscale from the general U.S. sample. Following the instructions in the manual t-score transformations were computed by adding 50 and multiplying by 10. This facilitated a comparison to that national representative sample with a mean of 50 and a standard deviation of 10.
BMI
BMI and cut-offs for overweight and obesity were calculated based on CDC guidelines (37). Participants were weighed with clothes on, pockets emptied, and no shoes, belts or heavy jewelry/watches, etc. For adults, BMI was calculated using the standard formula: weight (kg)/height (m)2. For workers under 18y, BMI was computed based on sex-specific age growth charts. For both groups, individuals were coded as overweight if they had a BMI of 25.0–29.9 and obese if they had a BMI of 30.0 or greater.
Blood Pressure
Blood pressure was taken after 3 min rest followed by 3 measurements, each 1 min apart; then we took the average of those three measurements. Blood pressure cut-offs for pre-hypertension and hypertension were based on NIH National Heart, Lung, and Blood Institute (NHLBI) recommendations (38). Cases were coded as pre-hypertensive if they had a systolic blood pressure of 120–139 mm Hg or a diastolic blood pressure of 80–89 mm Hg, and as hypertensive if they had a systolic blood pressure of ≥140 or a diastolic blood pressure of ≥90 mm Hg. We did not inquire as to whether workers were participating in anti-hypertensive treatment at the time of data collection.
Smoking
Participants were asked: “In the past 7 days, have you smoked any cigarettes?” Responses were coded 0 (no) or 1 (yes). This is consistent with the U.S. Department of Health and Human Services' initiative to end the tobacco epidemic (39).
Sleep
Sleep was measured using two items from the Pittsburgh Sleep Quality Index (40) to compute time spent in bed. Minimum guidelines for sleep were adopted from the CDC (41). Adults were coded as meeting the minimum guidelines if they got at least 7 h of sleep; young workers were coded as meeting the minimum guideline if they got at least 9 h of sleep per night.
Exercise
For all of the adult participants, exercise was coded as “yes” if the participant reported engaging in moderate or vigorous exercise for 30 min on 5 or more days per week [per CDC recommendations (42)] and “no” if they did not. In the young worker sample, participants were not asked about intensity (“moderate/vigorous”).
Participants
Call Center Workers
Participants included 139 employees from two customer service call centers. There are ~29,000 customer service employees in Oregon (43). Employees were recruited by study advertisements and completed all study activities during work hours. Participants received a $25 gift card for completing the study. Data were collected in the summer through fall of 2015. All study procedures were approved by Oregon Health & Science University (OHSU) IRB #0753.
Correction Officers
Participants in the first study included 85 corrections officers from four Oregon Department of Corrections institutions. Oregon employs ~2,300 correction officers in 14 state prisons (44). Prior to recruiting participants, permission was granted by the Superintendent of each institution. Participants were full-time security staff at the institutions. Data were collected between June 2011 through May 2013. All study procedures were reviewed and approved by OHSU IRB #7925.
Construction Workers
Participants in the second study included 349 construction workers from two public works agencies with a total of 520 construction workers, giving us a response rate of 67.12%. There are ~80,000 construction workers in Oregon (43). The results from the main study are published in the article cited here (45). Data were collected on company time in the summer of 2012. Participants were provided a $25 gift card for their participation. All study procedures were reviewed and approved by Portland State University IRB #111884.
Homecare Workers
Participants in the third study included 148 Oregon homecare workers recruited from the population of caregivers enrolled in a publicly funded home care system overseen by the Oregon Home Care Commission (31). There were ~12,000 homecare workers registered with the OHCC in the spring of 2013 when we collected these data (46). Within this system, caregivers work as independent contractors and are hired directly by “consumer-employers” who qualify for Medicaid-funded in-home services. With the assistance of the Service Employees International Union SEIU and the Commission, workers were recruited in-person at training classes, but also through emails, mailed fliers, and referrals. All study procedures were reviewed and approved by OHSU IRB #5473. The results of the main study are published in the article cited here (31).
Parks and Recreation Workers
In the summer of 2013, we sent emails to 436 young workers (14–24 years of age) from a city parks and recreation department who were seasonal summer employees. Throughout the results and discussion we refer to this sample of 14–24 year olds as young workers and our other samples of workers aged 25 and older as adult workers. Of those invited to participate 178 completed baseline surveys, a response rate of 40.83%. Results from the main study are published in the article referenced here (47). There are about 1,800 parks and recreation workers in the state of Oregon (43). Participants were recruited during new hire orientation; parental consent letters were distributed to minors. No biomarkers were assessed in this study. All study materials and procedures were approved by OHSU IRB #0753.
U.S. General Population Norming Means and SD
The means and SD for norming the scores for comparison to the U.S. general population are in the SF12v2 scoring manual (36). These data are from the 1998 National Survey of Functional Health Status (NSFHS), conducted from October to December 1998 by the National Research Corporation (NRC). Surveys were mailed to randomly selected members of the National Family Opinion (NFO) panel; 7,069 participants responded (overall response rate: 67.8%). The population contained both working and non-working adults. Sampling weights were applied to adjust the sample to match the age, gender, and age-by-gender distribution of the 1998 census.
Analyses
Descriptive statistics, frequencies, means, and standard deviations were computed to create profiles for these participating workers. One-sample t-tests were used to test whether the normed scores from our participants on the SF-12 subscales were statistically different from a nationally representative sample, with a mean of 50 for all subscales. Alpha was set at p = 0.05 for a two-tailed test for determining statistical significance.
Results
Demographics and Work Characteristics
A comparison of the demographics and work characteristics of the five samples in Table 1.
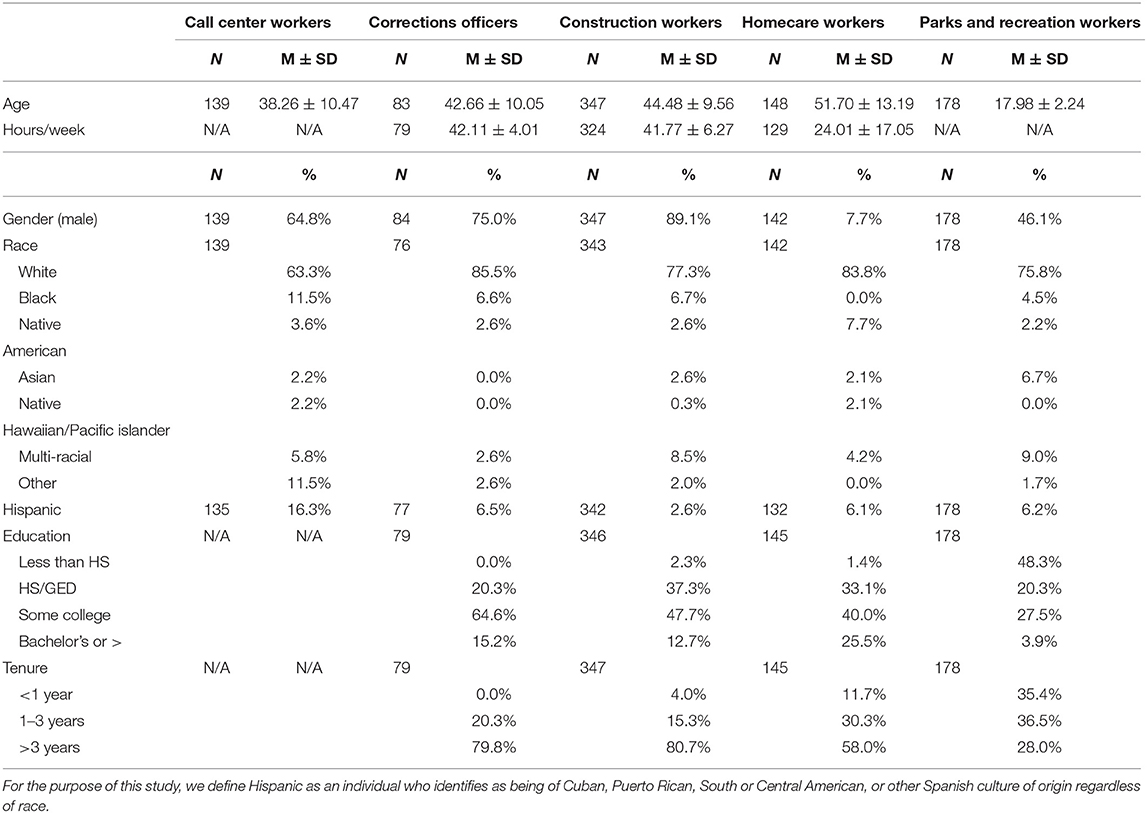
Table 1. OHWC descriptive statistics, demographics, and work characteristics.
Comparison Across Measures of Safety, Health, Health Behaviors, and Well-Being
Table 2 provides an overview of the safety and health profiles for all worker samples. Ten percent of older adult workers (i.e., 65 and above; call center, construction, corrections, and homecare) reported work-related injuries that resulted in missed work during the past 6 months. Such injuries were highest among construction workers at 16.2%. Forty-seven percent of adult workers reported experiencing pain in the last 6 months that interfered with normal activities. More than 70% of all participants were overweight or obese. In the young worker sample, just over 21% were overweight or obese. Conversely, 83.2% of older adult workers were overweight or obese. Among the adult participants, 16.4% had high blood pressure (HBP) and 41.0% were pre-hypertensive. Approximately 15% of all workers reported smoking in the last week/month. Smoking was lowest among young workers employed by parks and recreation department (4.5%) and highest among construction workers (20.7%). Approximately 60% of all workers reported getting sufficient sleep; as recommended by NIH. Sleep sufficiency was lowest in the young worker sample (46.6%) for whom more sleep is recommended. Only 35% of the workers were getting 150 min of moderate to vigorous physical activity per week as recommended by the CDC. Young workers were more likely to meet exercise guidelines, yet even in this sample, just over 50% met the guidelines. Physical activity was lowest among corrections officers and homecare workers, at just over 20%.
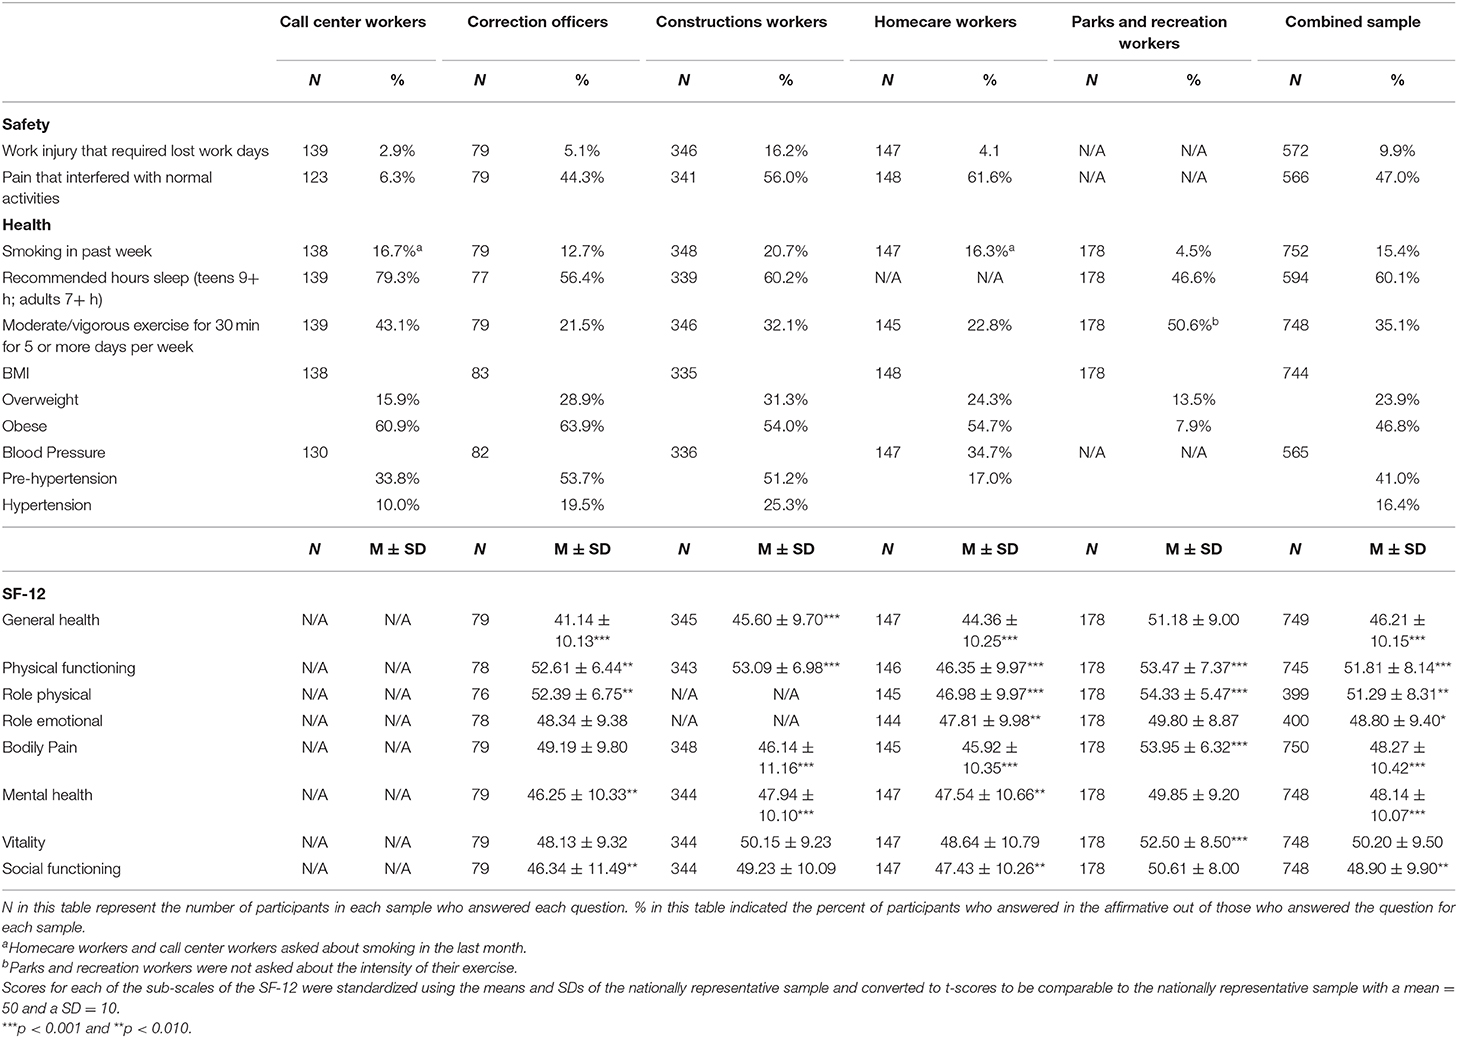
Table 2. OHWC descriptive statistics for health, safety, well-being, and health behaviors.
One-sample t-tests indicated that construction workers and homecare workers reported being pain-free significantly less often than the U.S. general population (p < 0.001); young parks and recreation workers were significantly more pain free (p < 0.001). All four of the adult samples had significantly poorer general health (p < 0.001) than a nationally representative sample. No evidence could be found that the general health of young workers was significantly different from that of a nationally representative sample. The homecare workers, who were also our oldest sample, had significantly poorer physical functioning than a nationally representative sample (p < 0.001). However, all of the other occupational samples had significantly better physical functioning (p < 0.010all 4 samples). Homecare workers scored significantly lower than the nationally representative sample in both role physical and role emotional (p < 0.010); that is, they reported feeling limited in their ability to perform role-related responsibilities due to emotional or physical health issues. The other worker groups were significantly healthier than the U.S. general population on role functioning (p < 0.010), but not statistically different from the U.S. general population on role emotional. All of our adult samples reported poorer mental health than the U.S. general population (p < 0.010). The parks and recreations workers scored significantly higher on vitality than the US general population (p < 0.001). We found no difference between any of the adult samples and the U.S. general population on vitality. Corrections officers and homecare workers scored significantly lower than the general US population on social functioning (p < 0.010).
Discussion
Overview of Findings
Our findings point to a workforce with both health and safety concerns. With regard to safety, 11% of adult workers reported work-related injuries that resulted in missed work and 47% were experiencing pain that interfered with normal activities. Further, many workers in our studies are at risk for chronic health conditions. Over 70% of the overall sample was overweight or obese and 57% of older adult workers were hypertensive or pre-hypertensive. Our findings show that working populations such as those in our studies can benefit from a Total Worker Health approach that targets factors that can improve health, safety, health behaviors, and well-being.
Role of the Work Environment on Safety and Health Outcomes
Studies at the Oregon Healthy Workforce Center have found that while individual behaviors play a role in worker health, safety, and well-being, the workplace environment can also have a large impact, such as access to safety equipment, access to healthy foods, reasonable working hours and breaks, access to opportunities to engage in physical activities at or near work (48–51). In addition, workers who are stressed or injured at work may engage in unhealthy behaviors such as poor diet, lack of physical activity, lack of sleep, and substance abuse, which in turn can contribute to further injuries or chronic health conditions such as obesity or HBP (52, 53). Our findings suggest that there is much need to study and improve working conditions for these occupational groups, with the goal of promoting health, safety, and well-being. Specifically, organizations should influence employee lifestyles through structural changes to the design of work and working conditions that would facilitate engaging in these activities, along with programs that target individual motivation and participation.
In our study, there was a high rate of pain reported among workers in corrections, construction and homecare. Population-based studies indicate that levels of musculoskeletal pain in adults range from 6 to 55% (19, 54). In a large random sample of working adults from one UK region, the prevalence of adults with pain in upper limbs and neck was 50.5%. This UK region had a large percentage of manufacturing workers; however, only 13% reported pain that interfered with functioning. In a large random sample of people from Sweden, 55% of the population perceived consistent pain for three 3 months or more (54). This sample consisted of residents from two regions of the country: one with a high percentage of industrial manufacturing and blue-collar workers and the other with a high percentage of fishing and agricultural workers. Factors found to be associated with musculoskeletal pain included the following: repetitive lifting of heavy objects, prolonged neck bending, working with arms at shoulder height or higher, low job control, low supervisor support, blue-collar occupations, and female gender. Growing evidence suggests that work-related injuries play a part in the opioid epidemic (55, 56). Occupations that require a high degree of manual labor such as construction show a higher likelihood that a worker will develop a dependency on prescription opioids (55).
All of our adult samples had lower levels of mental health than the general US population. Workplace factors associated in the literature with decreased mental health include: high job strain—which is a combination of high demands and low discretionary control over work—low social support at work, effort-reward imbalance, shift work (especially night shift), and long work hours (20, 57–61). Organizational interventions to prioritize mental health by reducing sources of job stress and providing access to employee-assistance programs such as confidential counseling are critical. Similarly, increasing job control may help to decrease stress, improve work-life balance, thereby reducing the risk for stress-related outcomes such as hypertension.
Occupational Differences
A crucial component in identifying cross-population factors related to risks and general wellness at the occupation-level lies in comprehensively understanding the distinct challenges, contexts, and profiles of the workers within each setting (62). Differences between samples could be evidence of structural barriers in workplaces that do not prioritize safety and health behaviors. Research has demonstrated that aspects of the physical environment or nature of work impact safety and health behaviors and related outcomes. For example, at a public health level, the following are related to greater participation in physical activity: accessibility of fitness facilities, the presence of sidewalks, and low-traffic (48). In the work environment, examples of facilitators of physical activity could include pedal stands, having proper work breaks, and safe spaces to walk at work.
Homecare workers had poorer health across several measures compared to the other occupational groups; they also reported greater pain, poorer physical functioning, and role functioning than the U.S. general population. Our previous qualitative research indicated that these homecare workers, who were employed by the consumers or their families, reported low support for safety (32). In an institutional care organization, lifting would be done by a group of workers whereas homecare workers must often do this lifting alone. Because homecare workers are dependent on their consumer and the consumer's case manager to request safety equipment, the process is often unclear for the worker. They also reported poorer well-being as indicated by lower emotional and social functioning than the nationally representative sample. In our previous work we found that homecare workers also reported feeling socially isolated, having almost no contact with co-workers other than during training sessions. This isolation could contribute to lower well-being among homecare workers. These are some aspects of the work environment that could be targeted to decrease injuries and pain, and improve well-being.
Construction workers had the highest rate of injuries and, like homecare workers, reported a high degree of pain interfering with normal activities. Of all the occupational groups, construction workers had among the highest occupational exposure to posture-related risk factors for injury (21). The vast majority of construction workers were overweight or obese and were pre-hypertensive or hypertensive. Smoking was also more prevalent among construction workers than among the other occupations we assessed. Construction workers would benefit substantially from interventions focused on reducing hazardous exposures and work-related injuries, smoking cessation programs (63), and by training supervisors to better support work-life integration (64), and safety communications (65).
Corrections workers reported less pain than our other samples. They also showed better outcome measures of health (i.e., general health) and well-being (e.g., mental health and social functioning) than the U.S. population in general. They did, however, have among the highest percentage of overweight and pre-hypertension/hypertension of our occupational groups. Further research into how the work environment could be modified to reduce risks of preventable diseases could be particularly useful for these workers.
Younger and Older Workers
There were a variety of notable differences between the younger and older workers. The older workers generally had poorer general and mental health than the general U.S. population. On the other hand, younger workers were no different than the general U.S. population. Research has indicated that reports of pain increase as workers age (54). We saw evidence of this in our sample: two of the older worker samples (homecare and construction) reported significantly more bodily pain than the general population while the young workers reported significantly less pain than the general population. Young workers scored significantly higher on vitality than the U.S. general population (p > 0.001); there was no difference between the adult samples and the U.S. general population on vitality. Younger workers, who need more sleep than older adults, were more likely to report inadequate sleep than older workers. TWH interventions geared toward older adults would include healthy pain management strategies (at the individual level) in combination with addressing important changes to the work environment such as providing tools for safe lifting and preventing worksite risks for injuries and accidents. Although young workers are healthier compared with older workers, they could benefit from interventions to increase sleep and physical activity. Intervening with younger workers to establish prevention strategies that are reinforced through their career could be a worthwhile approach that may help to prevent worsening of health conditions as career paths progress (47).
Limitations
Our study has some limitations. All samples were chosen to address the main aims of the sub-studies making up the OHWC. These occupational groups are not meant to be representative of the entire national workforce but rather these specific occupational groups within Oregon. These were convenience samples within single organizations and thus may not be as representative of their respective occupational groups compared to a study using random sampling of all individuals in a certain occupation. The OHWC targets working populations with high burden and need, which should be considered when generalizing our results. When comparing our samples to the national representative sample, we could not match the age or gender of our samples because we did not have the individual data for the national sample. We cannot rule out the influence of other factors beyond working conditions on workers' health, as the data is cross-sectional and we did not measure pre-existing conditions. In addition, more detail on several of our outcomes would allow conclusions that are more precise. For example, we asked about smoking in the past week. We did not ask how long workers had smoked or whether some may have only recently quit. When including common measures across multiple studies that may not be relevant to other aims in is necessary to trade off details for efficiency. Next, all of these data were collected in the State of Oregon. It is possible that regulations in other states or other state-level variables could influence safety and health behaviors and outcomes for workers in similar occupations. In addition, after we began our data collection for these studies, the NIH published PROMIS measures (66–68)—a set of freely available, well-validated measures of various aspects of health, with the objective of standardizing measures across studies. We have adopted these measures for subsequent data collection across projects, but unfortunately, they could not be part of this study. Finally, some measures referenced varying reflective time periods (e.g., smoking a cigarette in the last week vs. last month); thus, direct comparisons on these specific variables should be made with caution. Nonetheless, the Common Measures Data Repository is a promising approach to learning and addressing the unique and shared needs of worker populations across occupations.
Practical Implications and Conclusions
Growing literature suggests that lifestyle behaviors such as getting adequate sleep, exercising regularly, eating a healthy diet, and not smoking can be influenced by work exposures, conditions, and policies (69). Because adults spend a significant amount of their awake hours at work and because work plays an important role in our lifestyle and well-being, the workplace is an opportune platform from which to address health behaviors and outcomes.
Using a common measures approach to understand occupational safety, health, and well-being outcomes across studies can serve to compare and contrast risks, and highlight avenues for interventions to reduce work-related hazards and promote health and well-being. The findings of our common measures analyses point to the potential benefit of a Total Worker Health approach, in particular, integrated interventions that can decrease work-related risk factors and improve facilitators for pursuing health, safety, and well-being among workers across industries and along the age spectrum. For example, early interventions to reduce risk for injury at work can prevent the experience of pain among older workers, which in turn could improve health and safety behaviors, enhance health outcomes, and overall facilitate long-term quality of life.
Data Availability Statement
The datasets presented in this article are not readily available because they must be approved by the OHWC Steering Committee. Requests to access the datasets should be directed to Ginger Hanson, Z2hhbnNvbjRAamh1LmVkdQ==.
Ethics Statement
The studies involving human participants were reviewed and approved by Oregon Health and Science University and Portland State University. Written informed consent to participate in this study was provided by the participants' legal guardian/next of kin.
Author Contributions
GH, AR, TB, LH, DR, RO, BW, KK, and NP: conception and design of study. GH, AR, TB, LH, DR, RO, BW, KK, NP, ST, and MP: acquisition of data. GH, AR, TB, and NP: analysis and/or interpretation of data. GH, AR, LA, and AS: drafting the manuscript. AR, TB, LH, DR, RO, BW, and KK: revising the manuscript critically for important intellectual content. All authors contributed to the article and approved the submitted version.
Conflict of Interest
The authors declare that the research was conducted in the absence of any commercial or financial relationships that could be construed as a potential conflict of interest.
Acknowledgments
This results reported herein correspond to specific aims of grant (U19 OH010154) to LH and RO from the National Institute for Occupational Safety. This work was also supported by funding from the Oregon Institute of Occupational Health Sciences. In addition, we would like to recognize the work of Rob Wright, Annie Buckmaster, and Kristy Luther Rhoten in the collection of COMPASS data.
References
1. Hammer LB, Sauter S. Total worker health and work-life stress. J Occup Environ Med. (2013) 55(Suppl. 12):S25–9. doi: 10.1097/JOM.0000000000000043
2. Toossi M, Torpey E. Older Workers: Labor Force Trends and Career Options. BLS Career Outlook (2017). Available online at: https://www.bls.gov/careeroutlook/2017/article/older-workers.htm (accessed May 21, 2020).
3. World Health Organization. Preventing Chronic Diseases : A Vital Investment. WHO Global Report (2005). Available online at: https://www.who.int/chp/chronic_disease_report/full_report.pdf (accessed May 21, 2020).
4. Centers for Disease Control and Prevention. Chronic Diseases in America. (2019). Available online at: https://www.cdc.gov/chronicdisease/resources/infographic/chronic-diseases.htm (accessed May 20, 2020).
5. Partnership to Fight Chronic Disease. Fighting Chronic Disease: The Case for Enhancing the Congressional Budget Analysis Process. Available online at: http://www.fightchronicdisease.org/sites/default/files/docs/PFCD_ChronDisease_FactSheet3Final.pdf (accessed May 20, 2020).
6. O'Donnell MP, Schultz AB, Yen L. The portion of health care costs associated with lifestyle-related modifiable health risks based on a sample of 223,461 employees in seven industries: the UM-HMRC Study. J Occup Environ Med. (2015) 57:1284–90. doi: 10.1097/JOM.0000000000000600
7. Bureau of Labor Statistics. Nonfatal occupational injuries and illnesses, 1976–2014. The Economics Daily. Available online at: https://www.bls.gov/opub/ted/2016/nonfatal-occupational-injuries-and-illnesses-1976-2014.htm (accessed May 20, 2020).
8. Young B, Swedlow A. Obesity as a Medical Disease: Potential Implications for Workers' Compensation. Available online at: https://www.cwci.org/document.php?file=2008.pdf (accessed May 20, 2020).
9. Burks SV, Anderson JE, Bombyk M, Haider R, Ganzhorn D, Jiao X, et al. Nonadherence with employer-mandated sleep apnea treatment and increased risk of serious truck crashes. Sleep. (2016) 39:967–75. doi: 10.5665/sleep.5734
10. National Institute of Occupational Safety and Heath. Issues Relevant to Advancing Worker Well-being Through Total Worker Health. Available online at: https://www.cdc.gov/niosh/twh/pdfs/TWH-Issues-4x3_10282015_final.pdf (accessed May 20, 2020).
11. Tamers SL, Chosewood LC, Childress A, Hudson H, Nigam J, Chang C-CC. Total worker health® 2014–2018: the novel approach to worker safety, health, and well-being evolves. Int J Environ Res Public Health. (2019) 16:321. doi: 10.3390/ijerph16030321
12. National Institute of Occupational Safety and Health. NIOSH Centers of Excellence for Total Worker Health. Available online at: https://www.cdc.gov/niosh/twh/centers.html (accessed May 20, 2020).
13. Oregon Health and Science University. Oregon Healthy Workforce Center. Available online at: https://www.ohsu.edu/oregon-healthy-workforce-center (accessed May 20, 2020).
14. Fransson EI, Heikkilä K, Nyberg ST, Zins M, Westerlund H, Westerholm P, et al. Job strain as a risk factor for leisure-time physical inactivity: an individual-participant meta-analysis of up to 170,000 men and women. Am J Epidemiol. (2012) 176:1078–89. doi: 10.1093/aje/kws336
15. Heikkilä K, Nyberg ST, Fransson EI, Alfredsson L, De Bacquer D, Bjorner JB, et al. Job strain and tobacco smoking: an individual-participant data meta-analysis of 166 130 adults in 15 european studies. PLoS ONE. (2012) 7:e35463. doi: 10.1371/journal.pone.0035463
16. US Census Bureau. Industry Statistics Portal: Business Data from the US Census Bureau. Available online at: https://www.census.gov/econ/isp/ (accessed May 20, 2020).
17. Tamers SL, Goetzel R, Kelly KM, Luckhaupt S, Nigam J, Pronk NP, et al. Research methodologies for total worker health®: proceedings from a workshop. J Occup Environ Med. (2018) 60:968–78. doi: 10.1097/JOM.0000000000001404
18. Fries JF, Bruce B, Cella D. The promise of PROMIS: Using item response theory to improve assessment of patient-reported outcomes. Clin Exp Rheumatol. (2005) 23(5 Suppl. 39):S53–7.
19. Sim J, Lacey RJ, Lewis M. The impact of workplace risk factors on the occurrence of neck and upper limb pain: a general population study. BMC Public Health. (2006) 6:234. doi: 10.1186/1471-2458-6-234
20. Clark C, Pike C, McManus S, Harris J, Bebbington P, Brugha T, et al. The contribution of work and non-work stressors to common mental disorders in the 2007 Adult Psychiatric Morbidity Survey. Psychol Med. (2012) 42:829–42. doi: 10.1017/S0033291711001759
21. Parent-Thirion A, Biletta I, Cabrita J, Vargas O. Sixth European Working Conditions Survey: Overview Report (2016). Available online at: https://www.eurofound.europa.eu/publications/report/2016/working-conditions/sixth-european-working-conditions-survey-overview-report (accessed May 21, 2020).
22. Kajitani S. Which is worse for your long-term health, a white-collar or a blue-collar job? J Jpn Int Econ. (2015) 38:228–43. doi: 10.1016/j.jjie.2015.09.002
23. Kim YS, Park J, Rhee KY, Kim HM. A comparison between the second Korean Working Conditions Survey (KWCS) and the First KWCS. Saf Health Work. (2015) 6:85–9. doi: 10.1016/j.shaw.2015.02.005
24. Ervasti J, Kivimäki M, Dray-Spira R, Head J, Goldberg M, Pentti1 J, et al. Socioeconomic gradient in work disability in diabetes: evidence from three occupational cohorts. J Epidemiol Community Health. (2015) 70:125–31. doi: 10.1136/jech-2015-205943
25. O'Connor Duffany K, Finegood DT, Matthews D, McKeed M, Narayane KMV, Puska P, et al. Community Interventions for Health (CIH): a novel approach to tackling the worldwide epidemic of chronic diseases. CVD Prev Control. (2011) 6:47–56. doi: 10.1016/j.cvdpc.2011.02.005
26. Anthony D, Dyson PA, Lv J, Thankappan KR, Fernández MT, Matthews DR. Reducing health risk factors in workplaces of low and middle-income countries. Public Health Nurs. (2015) 32:478–87. doi: 10.1111/phn.12189
27. Dyson PA, Anthony D, Fenton B, Matthews DR, Stevens DE. High rates of child hypertension associated with obesity: a community survey in China, India and Mexico. Paediatr Int Child Health. (2014) 34:43–9. doi: 10.1179/2046905513Y.0000000079
28. Dyson PA, Anthony D, Fenton B, Stevens DE, Champagne B, Li LM, et al. Successful up-scaled population interventions to reduce risk factors for non-communicable disease in adults: results from the international Community Interventions for Health (CIH) project in China, India and Mexico. PLoS ONE. (2015) 10:e0120941. doi: 10.1371/journal.pone.0120941
29. Theorell T, Ahlberghulten G, Sigala F, Perski A, Soderholm M, Kallner A, et al. A psychosocial and biomedical comparison between men in six contrasting service occupations. Work Stress. (1990) 4:51–63. doi: 10.1080/02678379008256964
30. Olson R, Wright RR, Elliot DL, Hess JA, Thompson S, Buckmaster A, et al. The COMPASS pilot study: a total worker healthTM intervention for home care workers. J Occup Environ Med. (2015) 57:406–16. doi: 10.1097/JOM.0000000000000374
31. Olson R, Thompson SV, Elliot DL, Hess JA, Rhoten KL, Parker KN, et al. Safety and health support for home care workers: the COMPASS randomized controlled trial. Am J Public Health. (2016) 106:1823–32. doi: 10.2105/AJPH.2016.303327
32. Mabry L, Parker KN, Thompson SV, Bettencourt KM, Haque A, Rhoten KL, et al. Protecting workers in the home care industry: workers' experienced job demands, resource gaps, and benefits following a socially supportive intervention. Home Health Care Serv Q. (2018) 37:259–76. doi: 10.1080/01621424.2018.1470590
33. Hammer LB, Truxillo DM, Bodner T, Rineer J, Pytlovany AC, Richman A. Effects of a workplace intervention targeting psychosocial risk factors on safety and health outcomes. Biomed Res Int. (2015) 2015:836967. doi: 10.1155/2015/836967
34. Short ME, Goetzel RZ, Pei X, Tabrizi MJ, Ozminkowski RJ, Gibson TB, et al. How accurate are self-reports? Analysis of self-reported health care utilization and absence when compared with administrative data. J Occup Environ Med. (2009) 51:786–96. doi: 10.1097/JOM.0b013e3181a86671
35. Kuorinka I, Jonsson B, Kilbom A, Vinterberg H, Biering-Sørensen F, Andersson G, et al. Standardised Nordic questionnaires for the analysis of musculoskeletal symptoms. Appl Ergon. (1987) 18:233–7.
36. Ware J, Kosinski M, Turner-Bowker D, Gandek B. How to Score Version 2 of the SF-12 Health Survey. Boston, MA: Health Assessment Lab (2005).
37. Centers for Disease Control and Prevention. Is BMI Interpreted the Same Way for Children and Teens as It Is for Adults? Healthy Weight. Available online at: http://www.cdc.gov/healthyweight/assessing/bmi/childrens_bmi/about_childrens_bmi.html#interpreted (accessed May 20, 2020).
38. Chobanian AV, Bakris GL, Black HR, Cushman WC, Green LA, Izzo JL Jr., et al. The seventh report of the joint national committee on prevention, detection, evaluation, and treatment of high blood pressure: the JNC 7 report. J Am Med Assoc. (2003) 42:1206–52. doi: 10.1001/jama.289.19.2560
39. U.S. Department of Health Human Services. Ending the Tobacco Epidemic: A Tobacco Control Strategic Action Plan for the U.S. Department of Health and Human Services. Washington, DC (2010). doi: 10.1001/jama.2012.9741
40. Buysse DJ, Reynolds CF, Monk TH, Berman SR, Kupfer DJ. The Pittsburgh sleep quality index: a new instrument for psychiatric practice and research. Psychiatry Res. (1989) 28:193–213.
41. Centers for Disease Control and Prevention. How Much Sleep Do I Need? Sleep and Sleep Disorders. Available online at: https://www.cdc.gov/sleep/about_sleep/how_much_sleep.html (accessed May 20, 2020).
42. Centers for Disease Control and Prevention. Weight Management. Physical Activity and Health. Available online at: https://www.cdc.gov/physicalactivity/basics/pa-health/index.htm (accessed May 20, 2020).
43. U.S. Bureau of Labor Statsitics. State Occupational Employment and Wage Estimates Oregon. Washington, DC (2019).
44. Doughty M. Corrections: An Oregon Institution Since 1842. (2020) Available online at: https://www.qualityinfo.org/-/corrections-an-oregon-institution-since-1842 (accessed December 18, 2020).
45. Bodner T, Kraner M, Bradford B, Hammer L, Truxillo D. Safety, health, and well-being of municipal utility and construction workers. J Occup Environ Med. (2014) 56:771–8. doi: 10.1097/JOM.0000000000000178
46. Hanson GC, Perrin NA, Moss H, Laharnar N, Glass N. Workplace violence against homecare workers and its relationship with workers health outcomes: a cross-sectional study. BMC Public Health. (2015) 15:11. doi: 10.1186/s12889-014-1340-7
47. Rohlman D, Parish M, Elliot D, Hanson G, Perrin N. Addressing younger workers' needs: the Promoting U through Safety and Health (PUSH) trial outcomes. Healthcare. (2016) 4:55. doi: 10.3390/healthcare4030055
48. Duncan MJ, Spence JC, Mummery WK. Perceived environment and physical activity: a meta-analysis of selected environmental characteristics. Int J Behav Nutr Phys Act. (2005) 2:1–9. doi: 10.1186/1479-5868-2-11
49. Hjarnoe L, Leppin A. A risky occupation? (Un)healthy lifestyle behaviors among Danish seafarers. Health Promot Int. (2014). 29:720–9. doi: 10.1093/heapro/dat024
50. Pechey R, Jebb SA, Kelly MP, Almiron-Roig E, Conde S, Nakamura R, et al. Socioeconomic differences in purchases of more vs. less healthy foods and beverages: analysis of over 25,000 British households in 2010. Soc Sci Med. (2013). 92:22–6. doi: 10.1016/j.socscimed.2013.05.012
51. Ravesteijn B, Van Kippersluis H, Van Doorslaer E. The contribution of occupation to health inequality. Res Econ Inequal. (2013) 21:311–32. doi: 10.1108/S1049-2585(2013)0000021014
52. Caruso C, Hitchcock E, Dick R, Russo J, Schmit J. Overtime and Extended Work Shifts: Recent Findings on Illness, Injuries and Health Behaviours Cincinnati, OH: NIOSH Publications Dissemination (2004).
53. Ulutasdemir N, Kilic M, Zeki Ö, Begendi F. Effects of occupational health and safety on healthy lifestyle behaviors of workers employed in a private company in Turkey. Ann Glob Heal. (2015) 81:503–11. doi: 10.1016/j.aogh.2015.08.018
54. Andersson HI, Ejlertsson G, Leden I, Rosenberg C, Centre BH, Bromölla. Chronic Pain in a Geographically Defined General Population. Clin J Pain. (1993). 9:174–82.
55. Berecki-Gisolf J, Collie A, McClure RJ. Prescription opioids for occupational injury: results from workers' compensation claims records. Pain Med. (2014) 15:1549–57. doi: 10.1111/pme.12421
56. Kowalski-Mcgraw M, Green-Mckenzie J, Pandalai SP, Schulte PA. Characterizing the interrelationships of prescription opioid and benzodiazepine drugs with worker health and workplace hazards. J Occup Environ Med. (2017) 59:1114–26. doi: 10.1097/JOM.0000000000001154
57. Harrington JM. Health effects of shift work and extended hours of work. Occup Environ Med. (2001) 58:68–72. doi: 10.1136/oem.58.1.68
58. Lee A, Myung SK, Cho JJ, Jung YJ, Yoon JL, Kim MY. Night shift work and risk of depression: meta-analysis of observational studies. J Korean Med Sci. (2017) 32:1091–6. doi: 10.3346/jkms.2017.32.7.1091
59. Sparks K, Cooper C, Fried Y, Shirom A. The effects of hours of work on health: a meta-analytic review. J Occup Organ Psychol. (1997) 70:391–408.
60. Stansfeld S, Candy B. Psychosocial work environment and mental health-a meta-analytic review. Scand J Work. (2006) 32:443–62. doi: 10.5271/sjweh.1050
61. Stansfeld SA, Shipley MJ, Head J, Fuhrer R. Repeated job strain and the risk of depression: longitudinal analyses from the Whitehall II Study. Am J Public Health. (2012) 102:2360–6. doi: 10.2105/AJPH.2011.300589
62. Pronk NP. Integrated worker health protection and promotion programs: overview and perspectives on health and economic outcomes. J Occup Environ Med. (2013) 55(Suppl. 12):S30. doi: 10.1097/JOM.0000000000000031
63. Sorensen G, Stoddard A, Hunt MK, Hebert JR, Ockene JK, Avrunin JS, et al. The effects of a health promotion-health protection intervention on behavior change: the wellworks study. Am J Public Health. (1998) 88:1685–90.
64. Hammer LB, Brady JM, Perry ML. Training supervisors to support veterans at work: effects on supervisor attitudes and employee sleep and stress. J Occup Organ Psychol. (2020) 93:273–301. doi: 10.1111/joop.12299
65. Anger WK, Kyler-Yano J, Vaughn K, Wipfli B, Olson R, Blanco M. Total worker health® intervention for construction workers alters safety, health, well-being measures. J Occup Environ Med. (2018) 60:700–9. doi: 10.1097/JOM.0000000000001290
66. Cella D, Riley W, Stone A, Rothrock N, Reeve B, Yount S, et al. The patient-reported outcomes measurement information system (PROMIS) developed and tested its first wave of adult self-reported health outcome item banks: 2005-2008. J Clin Epidemiol. (2010) 63:1179–94. doi: 10.1016/j.jclinepi.2010.04.011
67. Amtmann D, Cook KF, Jensen MP, Chen WH, Choi S, Revicki D, et al. Development of a PROMIS item bank to measure pain interference. Pain. (2010) 150:173–82. doi: 10.1016/j.pain.2010.04.025
68. DeWalt DA, Rothrock N, Yount S, Stone AA. Evaluation of item candidates: the PROMIS qualitative item review. Med Care. (2007) 45(5 Suppl. 1):S12. doi: 10.1097/01.mlr.0000254567.79743.e2
Keywords: health promotion, health behaviors, occupational safety, health, well-being
Citation: Hanson GC, Rameshbabu A, Bodner TE, Hammer LB, Rohlman DS, Olson R, Wipfli B, Kuehl K, Perrin NA, Alley L, Schue A, Thompson SV and Parish M (2021) A Comparison of Safety, Health, and Well-Being Risk Factors Across Five Occupational Samples. Front. Public Health 9:614725. doi: 10.3389/fpubh.2021.614725
Received: 06 October 2020; Accepted: 06 January 2021;
Published: 05 February 2021.
Edited by:
Caterina Ledda, University of Catania, ItalyReviewed by:
Yuke Tien Fong, Singapore General Hospital, SingaporeAngela Stufano, University of Bari Aldo Moro, Italy
Copyright © 2021 Hanson, Rameshbabu, Bodner, Hammer, Rohlman, Olson, Wipfli, Kuehl, Perrin, Alley, Schue, Thompson and Parish. This is an open-access article distributed under the terms of the Creative Commons Attribution License (CC BY). The use, distribution or reproduction in other forums is permitted, provided the original author(s) and the copyright owner(s) are credited and that the original publication in this journal is cited, in accordance with accepted academic practice. No use, distribution or reproduction is permitted which does not comply with these terms.
*Correspondence: Ginger C. Hanson, Z2hhbnNvbjRAamh1LmVkdQ==