 Richard E. Rothman1*†
 Yu-Hsiang Hsieh1†Anna DuVal1
 David A. Talan2Gregory J. Moran3Anusha Krishnadasan3Katy Shaw-Saliba1Andrea F. Dugas1
- 1Department of Emergency Medicine, Johns Hopkins University, Baltimore, MD, United States
- 2Ronald Reagan University of California, Los Angeles (UCLA) Medical Center, Los Angeles, CA, United States
- 3University of California, Olive-View Medical Center, Los Angeles, CA, United States
Objectives: To assess emergency department (ED) clinicians' perceptions of a novel real-time influenza surveillance system using a pre- and post-implementation structured survey.
Methods: We created and implemented a laboratory-based real-time influenza surveillance system at two EDs at the beginning of the 2013-2014 influenza season. Patients with acute respiratory illness were tested for influenza using rapid PCR-based Cepheid Xpert Flu assay. Results were instantaneously uploaded to a cloud-based data aggregation system made available to clinicians via a web-based dashboard. Clinicians received bimonthly email updates summating year-to-date results. Clinicians were surveyed prior to, and after the influenza season, to assess their views regarding acceptability and utility of the surveillance system data which were shared via dashboard and email updates.
Results: The pre-implementation survey revealed that the majority (82%) of the 151 ED clinicians responded that they “sporadically” or “don't,” actively seek influenza-related information during the season. However, most (75%) reported that they would find additional information regarding influenza prevalence useful. Following implementation, there was an overall increase in the frequency of clinician self-reporting increased access to surveillance information from 50 to 63%, with the majority (75%) indicating that the surveillance emails impacted their general awareness of influenza. Clinicians reported that the additional real-time surveillance data impacted their testing (65%) and treatment (51%) practices.
Conclusions: The majority of ED clinicians found surveillance data useful and indicated the additional information impacted their clinical practice. Accurate and timely surveillance information, distributed in a provider-friendly format could impact ED clinician management of patients with suspected influenza.
Introduction
Seasonal and pandemic influenza result in up to 960,000 hospitalizations and 80,000 deaths annually in the U.S. (1). Emergency departments (EDs) are one of the most frequent points of entry for initial diagnosis and management of patients with suspected influenza (2), serving as key sentinel surveillance sites (3, 4). Traditional approaches for gathering and distributing surveillance information have relied on collection of data from sentinel sites including EDs, then collating and sharing that information via local, regional or national data systems. While broadly useful for public health purposes, intrinsic limitations of traditional influenza surveillance include time lags and loss of local data granularity (5, 6). In addition, communication and delivery methods of sharing surveillance information from local, regional or national public health agencies with front-line clinicians have been challenging, especially during public health emergencies. Front-line clinicians have expressed that surveillance information should be a simple, easily-recognized, localized, authoritative, and practice-focus (7). Eliminating gaps might add value for front-line ED clinicians, with potential utility to inform clinical decisions in the face of seasonal or pandemic influenza.
Several studies from non-ED settings suggest real-time infectious disease surveillance may provide timely actionable information (4, 8–11). Accordingly, advances have been made in cloud-based reporting tools which could complement conventional surveillance systems but add closer to real-time or real-time capabilities (6, 12). Santillana et al. demonstrated ability to track real-time U.S. regional influenza activity using near real-time extracted electronic health record data via cloud-based services coupled with a machine learning algorithm. A real-time cloud-based data aggregation system, with connectivity to Cepheid's GeneXpert System via internet over data networks, was designed which permitted capture of real-time test specific data, including unique device identifier, geographic location, frequency of positive and negative results with running totals, by day, week, and month. The reporting relied on the FDA-cleared, Xpert Flu platform, which has high sensitivity and specificity for multiple influenza strains, a 1 h turn-around-time (TAT) and capacity for a cloud-based interface. Here, we assess clinician's perceived utility of this “prototype” molecular surveillance system.
We implemented a real-time influenza surveillance system that captured rapid molecular test results from two EDs. Here, we describe findings from a pre- and post-implementation survey of ED clinicians assessing their perceptions of this influenza system (electronic surveillance dashboard, and regular email updates generated from the dashboard). Findings may help guide approaches for collecting and distributing respiratory disease surveillance information with front-line ED clinicians.
Materials and Methods
Patients presenting with an acute respiratory illness to The Johns Hopkins Hospital ED and Olive View-UCLA Medical Center ED were systematically tested for influenza using Xpert Flu (Cepheid, Sunnyvale, CA) from November 2013 to April 2014 (13). Both study sites are urban, academic EDs that provide health care to a highly underserved racial/ethnically minority patient population. Results of de-identified influenza test data from the GeneXpert platforms in both EDs were automatically uploaded to a real-time cloud-based data aggregation system, and immediately displayed on an electronic dashboard as cumulative daily tests performed and test result for influenza A, B, or H1N1 2009 viruses. Users also had options to display daily, weekly or seasonal trends. Given this was a prototype system, the dashboard was equipped with controlled access, appropriate security and privacy.
At the start of the influenza season, ED clinicians (residents, advanced practice providers and attending physicians) were briefed regarding the real-time prototype surveillance system, and given instructions for using the secure electronic dashboard (Figure 1) and the website address with secure login and password information. They were also informed that they would receive bi-monthly emails with summary reports of the aggregate ED testing data from the surveillance system.
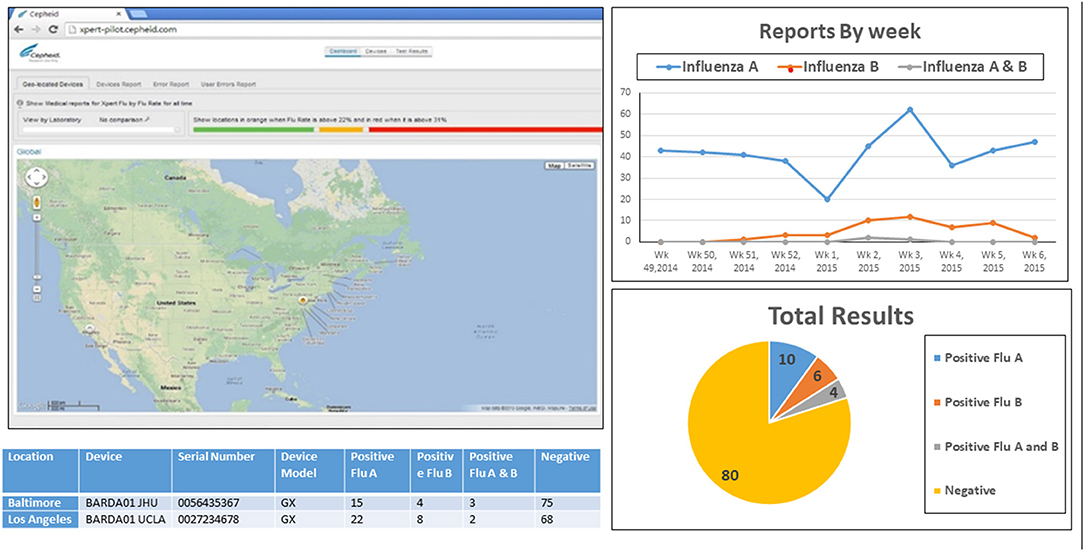
Figure 1. Webpage of the real-time, cloud-based and laboratory-based influenza surveillance system. Visual of Web accessible dashboard which displayed influenza testing data in real-time (as tests were performed) from the two emergency department testing sites. Results shown (below map) were real time view of daily test counts, and test results (positive or negative) for influenza A and influenza B. Display of results could be manipulated by users to show seasonal trend (top), total cumulative test distribution to date (bottom) for each site or both sites combined (based on viewer access privileges).
ED clinicians were invited to participate in a baseline survey prior to implementation of the surveillance system and a follow-up survey after the influenza season. The anonymous survey included questions about demographics, years in practice, self-reported method(s) for obtaining information regarding influenza activity, and clinical practice patterns regarding testing, diagnosis, and antiviral treatment. The follow-up survey included additional questions pertaining to perceived utility and impact of surveillance information (both web-based dashboard and email communications) on testing, diagnosis, and antiviral treatment practices. Chi-square test or Fisher's exact test was performed to compare acceptability, perception, and clinical practice between baseline and follow-up. Difference in proportions and the corresponding 95% confidence interval (CI) was used to determine the association with an increase or decrease in a specific binary response between two time points. P-value was used to determine the difference in distribution of groups between surveys for a question with 3 or more mutually exclusive responses. P-value < 0.05 was considered as significant. Both study site Institutional Review Boards approved this study.
Results
Overall, 151 (76%) of 198 ED clinicians participated in the baseline survey. Most were male (56%), <40 years old (70%), and physicians (91%), with 2-9 years of clinical practice (55%). Among 151 participants at the baseline, 87 (58%) responded to the follow-up survey. Demographics of participants who responded to the follow-up survey were similar to those at the baseline survey (Table 1).
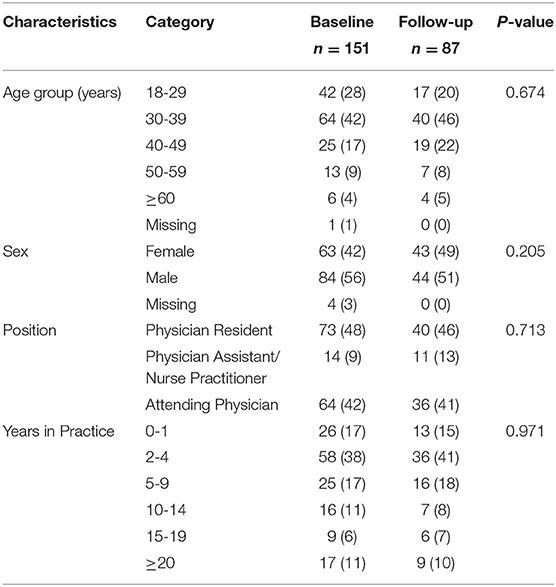
Table 1. Characteristics of participants at the baseline and follow-up survey.
Pre- and post-survey responses are summarized in Table 2. At baseline, 18% of clinicians reported that they regularly (weekly or monthly) “actively” obtained information about the influenza season and 51% “passively” obtaining information regularly.
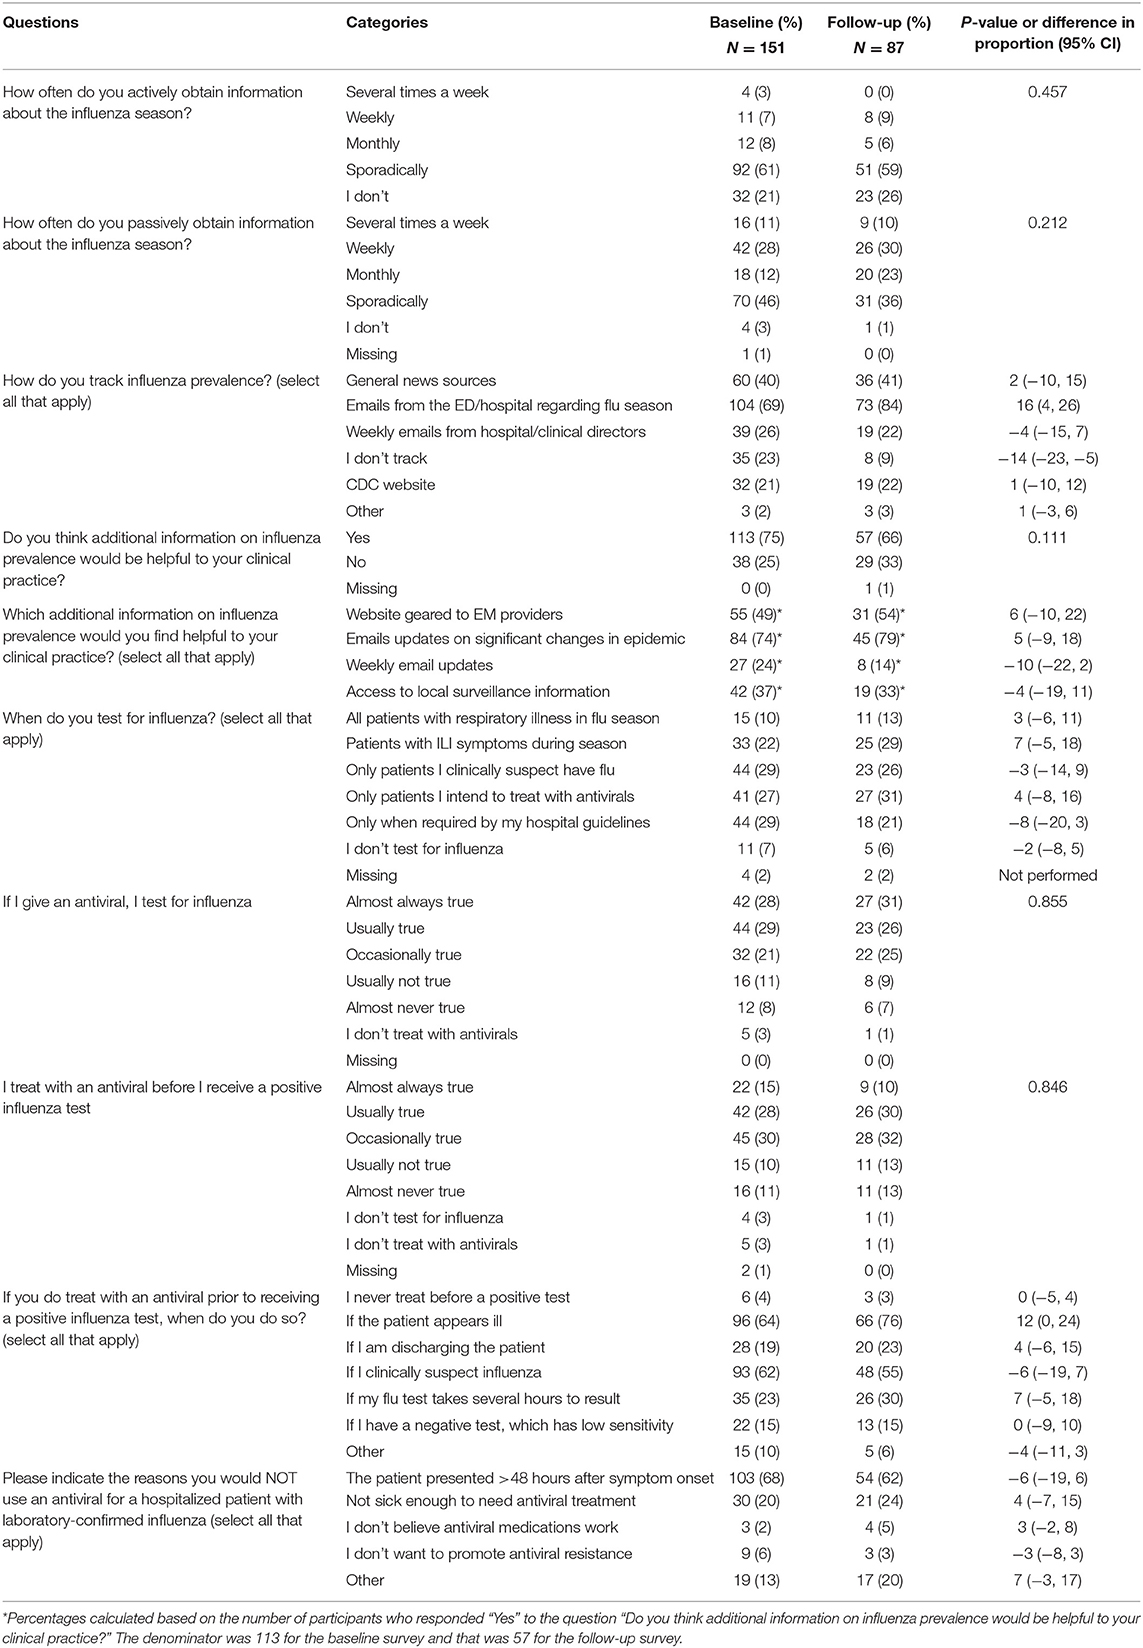
Table 2. Survey responses regarding impact of influenza surveillance information on clinical practice before and after the implementation of an emergency department prototype real-time surveillance system.
Findings from the post-implementation survey were similar to those in the baseline with the following exceptions. First, there was an absolute increase (13%, 95% CI: 0%, 26%) in the proportion of clinicians who reported passively obtaining regularly information about influenza activity at least monthly (i.e., several times a week, weekly, or monthly) from 50 to 63%. Second, there was an absolute decrease in the proportion of clinicians who indicated they did not track influenza prevalence from 23 to 9% (difference: −14%, 95% CI: −23%, −5%) (Table 2). Clinicians reported an absolute increase (16%, 95% CI: 4%, 26%) in use of emails from the ED/hospital as the main information source to track influenza. There was also an absolute increase (12%, 95% CI: 0%, 24%) in the proportion of clinicians who indicated they prescribe antivirals to patients who appear ill prior to receiving a positive test.
Survey questions focusing on usefulness of the prototype surveillance dashboard and regular email updates (Table 3) revealed that 45% said that they went to the dashboard at least some time during the season (weekly 5%; monthly 2%; sporadically 38%). Among those reporting using the dashboard (n = 39), 78% indicated the dashboard increased their general awareness of influenza activity. A similar response pattern was seen regarding email communications from the prototype system, with 75% indicating that the email updates increased their general awareness of influenza.
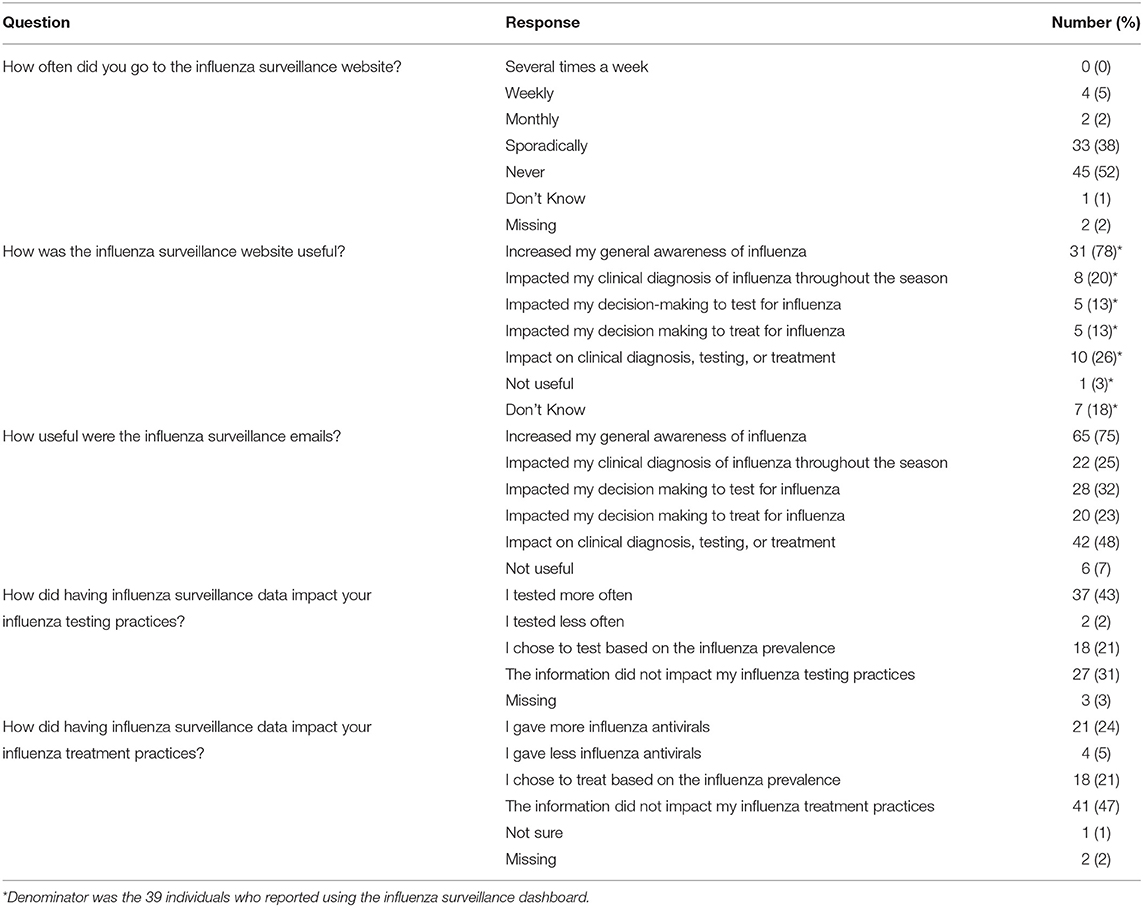
Table 3. Survey responses regarding use and perceived usefulness of the prototype influenza surveillance system (dashboard and email updates) from 87 Emergency Department Clinicians post-influenza season.
Regarding perceived impact of having additional influenza surveillance data on the testing practices, 66% of participants indicated that having closer to real-time surveillance data impacted their clinical testing practice (including 43% testing more, 21% testing based on prevalence, and 2% testing less). Further, 50% indicated that having access to the surveillance data impacted their treatment practices (including 24% treating more often, 21% treating based on influenza prevalence, and 5% treating less often) (Table 3).
Discussion
While influenza surveillance systems have potential usefulness for clinical settings, traditional methods for data sharing require gathering and collating data prior to data-sharing resulting in limited utility for front-line clinicians (11). Development and deployment of improved real-time data collection and reporting systems creates opportunities for sharing information more rapidly (6, 14, 15). Our survey of front-line providers before and after implementation on a prototype real-time cloud-based surveillance system suggests front-line clinicians perceive this as an added value for informing testing and treatment practices during a typical influenza season.
Very few published studies have assessed the potential utility of influenza surveillance for clinicians, and none specifically in the ED as far as we are aware. One study piloted various set triggers and real-time alerts for notifying physicians, finding that point-of-care testing and predefined alerts hold promise as tools for improving testing and/or treatment practices (16). Another systematic review found that local, real-time respiratory infectious disease surveillance data can increase antibiotic stewardship and antiviral prescribing practices (17). Our finding regarding the increased awareness and engagement associated with our influenza surveillance data sharing tools is important for ED clinicians, particularly given the clinical utility of prescribing appropriate antiviral to those at high risk for influenza complications. In addition, influenza surveillance system that includes near real-time influenza virus virulence data as well as antiviral resistance data would be able to further guide clinicians to modify their prescribing practice to optimize use of antivirals.
In our study, implementation of the dashboard and email updates was associated with an overall increase in clinician self-reported access to influenza surveillance data from 50 to 63%, and a decline in clinicians reporting never accessing influenza surveillance information. In addition, two-thirds and half of participants indicated that the added information impacted their overall testing and treatment practices, respectively. That effect observed from clinicians' self-reported responses was relatively small however, possibly due to clinician's uncertainty about how to use surveillance data to adjust their testing and treatment practices. In spite of being available in a dashboard web-based format, clinicians showed a preference for having updated surveillance information shared “passively” via email. This limits the true “real-time” value of the dashboard for situational awareness given that email updates were delivered only twice a month. Of note, the requirement for a separate secure login for clinicians to access the dashboard might have contributed to the relatively limited use of the dashboard.
Several limitations should be noted. First, the study occurred at two EDs; perceptions and uptake may not be generalizable to other settings. Second, although the characteristics of participants were similar between baseline and follow-up, more than 40% of participants did not return the follow-up survey. Those who responded to the follow-up survey are likely the ones who actually accessed the new surveillance platform. Therefore, the results of the follow-up survey are also partially reflective of the general attention and education provided as part of the implementation of the platform, rather than the use of the platform itself. Third, acceptability, perceptions, and self-reported clinical utility of the surveillance system is likely dependent on the magnitude and severity of each influenza season, and the 2013-2014 season was relatively mild. ED clinicians might find that the system has higher clinical utility in a more severe influenza season; stage of the influenza season (very early vs. later), may impact perceived utility, and that was not assessed here. Fourth, we measured perception, rather than actual impact on practice. Finally, newer testing and reporting systems have been advanced after this study was conducted, including those that are evolving in response to the global Coronavirus disease 2019 (COVID-19) pandemic (18). Findings from this front-line provider survey of a prototype system may be an informative baseline however, encouraging others to further advance and evaluate clinician's perceptions and practice patterns when interfacing with real-time reporting systems which take advantage of newer technologies and methods.
In conclusion, following implementation of a real-time reporting of influenza surveillance, ED clinicians reported increased awareness of influenza activity and modification of clinical practice patterns. Clinicians preferred receiving surveillance data passively via emails rather than proactively logging into a surveillance website. Further development of accurate and timely surveillance information distributed in easier to access formats for front-line ED clinicians may impact future management of patients with suspected influenza and other respiratory pathogens.
Data Availability Statement
The raw data supporting the conclusions of this article will be made available by the authors, without undue reservation.
Ethics Statement
The studies involving human participants were reviewed and approved by Johns Hopkins University School of Medicine and University of California Olive-View Medical Center. Written informed consent for participation was not required for this study in accordance with the national legislation and the institutional requirements.
Author Contributions
RR and AFD contributed to conception and design of the study. AD, DT, GM, AK, and AFD had primary responsibility for the data collection. AD organized the database. Y-HH performed the statistical analysis. RR, Y-HH, DT, KS-S, and AFD primarily interpreted the results. Y-HH wrote the first draft of the manuscript. All authors contributed to manuscript revision, read, and approved the submitted version.
Funding
The study was supported by US Department of Health and Human Services Biomedical Advanced Research and Development Authority (BARDA; agreement numbers IDSEP160031-01-00 and 130014-01-00). The funding bodies had no role in study design, data collection and analysis, preparation of the manuscript, or the decision to publish.
Conflict of Interest
The authors declare that the research was conducted in the absence of any commercial or financial relationships that could be construed as a potential conflict of interest.
Publisher's Note
All claims expressed in this article are solely those of the authors and do not necessarily represent those of their affiliated organizations, or those of the publisher, the editors and the reviewers. Any product that may be evaluated in this article, or claim that may be made by its manufacturer, is not guaranteed or endorsed by the publisher.
References
1. National Center for Immunization and Respiratory Diseases (NCIRD). Past Seasons Estimated Influenza Disease Burden. Centers for Disease Control and Prevention (2018). Available online at: https://www.cdc.gov/flu/about/disease/burden.htm (accessed February 13, 2020).
2. Mohareb A, Dugas A, Hsieh Y. Changing epidemiology and management of infectious diseases in US EDs. Am J Emerg Med. (2016) 34:1059–65. doi: 10.1016/j.ajem.2016.03.024
3. Dugas A, Hsieh Y, Levin S, Pines JM, Mareiniss DP, Mohareb A, et al. Google Flu Trends: correlation with emergency department influenza rates and crowding metrics. Clin Infect Dis. (2012) 54:463–9. doi: 10.1093/cid/cir883
4. Gesteland P, Samore M, Pavia A, Srivastava R, Korgenski K, Gerber K, et al. Informing the front line about common respiratory viral epidemics. AMIA Annu Symp Proc. (2007) 2007:274–8.
5. Reich N, Cummings D, Lauer S, Zorn M, Robinson C, Nyquist A-C, et al. Triggering interventions for influenza: the ALERT algorithm. Clin Infect Dis. (2015) 60:499–504. doi: 10.1093/cid/ciu749
6. Baltrusaitis K, Brownstein J, Scarpino S, Bakota E, Crawley AW, Conidi G, et al. Comparison of crowd-sourced, electronic health records based, and traditional health-care based influenza-tracking systems at multiple spatial resolutions in the United States of America. BMC Infect Dis. (2018) 18:403. doi: 10.1186/s12879-018-3322-3
7. Staes C, Wuthrich A, Gesteland P, Allison MA, Leecaster M, Shakib JH, et al. Public health communication with frontline clinicians during the first wave of the 2009 influenza pandemic. J Public Health Manag Pract. (2011) 17:36–44. doi: 10.1097/PHH.0b013e3181ee9b29
8. Goff D, Kullar R, Newland J. Review of Twitter for infectious diseases clinicians: useful or a waste of time? Clin Infect Dis. (2015) 60:1533–40. doi: 10.1093/cid/civ071
9. Paolotti D, Carnahan A, Colizza V, Eames K, Edmunds J, Gomes G, et al. Web-based participatory surveillance of infectious diseases: the Influenzanet participatory surveillance experience. Clin Microbiol Infect. (2014) 20:17–21. doi: 10.1111/1469-0691.12477
10. Messacar K, Hurst A, Child J, Campbell K, Palmer C, Hamilton S, et al. Clinical impact and provider acceptability of real-time antimicrobial stewardship decision support for rapid diagnostics in children with positive blood culture results. J Pediatric Infect Dis Soc. (2017) 6:267–74. doi: 10.1093/jpids/piw047
11. Gesteland P, Allison M, Staes C, Samore MH, Rubin MA, Carter ME, et al. Clinician use and acceptance of population-based data about respiratory pathogens: implications for enhancing population-based clinical practice. AMIA Annu Symp Proc. (2008) 2008:232–6.
12. Santillana M, Nguyen A, Louie T, Zink A, Gray J, Sung I, et al. Cloud-based electronic health records for real-time, region-specific influenza surveillance. Sci Rep. (2016) 6:25732. doi: 10.1038/srep25732
13. Dugas A, Hsieh Y, LoVecchio F, Moran GJ, Steele MT, Talen DA, et al. Derivation and validation of a clinical decision guideline for influenza testing in four U.S. emergency departments. Clin Infect Dis. (2020) 70:49–58. doi: 10.1093/cid/ciz171
14. Meyers L, Ginocchio C, Faucett A, Nolte FS, Gesteland PH, Lember A, et al. Automated collection of pathogen-specific diagnostic data for real-time syndromic epidemiological studies. JMIR Public Health Surveill. (2018) 4:e59. doi: 10.2196/preprints.9876.a
15. Klompas M, McVetta J, Lazarus R, Eggieston E, Haney G, Kruskal BA, et al. Integrating clinical practice and public health surveillance using electronic medical record systems. Am J Prev Med. (2012) 42:S154–62. doi: 10.1016/j.amepre.2012.04.005
16. Gren L, Porucznik C, Joy E, Lyon J, Staes C, Alder S. Point-of-care testing as an influenza surveillance tool: methodology and lessons learned from implementation. Influenza Res Treat. (2013) 2013:242970. doi: 10.1155/2013/242970
17. Lane I, Bryce A, Ingle S, Hay A. Does locally relevant, real-time infection epidemiological data improve clinician management and antimicrobial prescribing in primary care? A systematic review. Fam Pract. (2018) 35:542–50. doi: 10.1093/fampra/cmy008
Keywords: influenza, surveillance, emergency department, dashboard, provider acceptability, cloud-based, survey
Citation: Rothman RE, Hsieh Y-H, DuVal A, Talan DA, Moran GJ, Krishnadasan A, Shaw-Saliba K and Dugas AF (2021) Front-Line Emergency Department Clinician Acceptability and Use of a Prototype Real-Time Cloud-Based Influenza Surveillance System. Front. Public Health 9:740258. doi: 10.3389/fpubh.2021.740258
Received: 12 July 2021; Accepted: 11 October 2021;
Published: 04 November 2021.
Edited by:
Diamantis Plachouras, European Centre for Disease Prevention and Control (ECDC), SwedenReviewed by:
Pasi Penttinen, European Centre for Disease Prevention and Control (ECDC), SwedenRobert Mathes, New York City Department of Health and Mental Hygiene, United States
Copyright © 2021 Rothman, Hsieh, DuVal, Talan, Moran, Krishnadasan, Shaw-Saliba and Dugas. This is an open-access article distributed under the terms of the Creative Commons Attribution License (CC BY). The use, distribution or reproduction in other forums is permitted, provided the original author(s) and the copyright owner(s) are credited and that the original publication in this journal is cited, in accordance with accepted academic practice. No use, distribution or reproduction is permitted which does not comply with these terms.
*Correspondence: Richard E. Rothman, cnJvdGhtYTFAamhtaS5lZHU=
†These authors have contributed equally to this work and share first authorship