 Amin Ghanbarnejad1,2
 Masoumeh Kheirandish1*
 Feysal Yousefzade3Arash Rahimi1Abnoos Azarbad1
 Azim Nejatizadeh4Mehdi Shahmoradi1
- 1Endocrinology and Metabolism Research Center, Hormozgan University of Medical Sciences, Bandar Abbas, Iran
- 2Social Determinants in Health Promotion Research Center, Hormozgan University of Medical Sciences, Bandar Abbas, Iran
- 3Student Research Committee, Faculty of Medicine, Hormozgan University of Medical Sciences, Bandar Abbas, Iran
- 4Molecular Medicine Research Center, Hormozgan Health Institute, Hormozgan University of Medical Sciences, Bandar Abbas, Iran
Background: Metabolic syndrome (MetS) is defined as the presence of several metabolic risk factors. The traditional MetS criteria have been considered insufficient for evaluating individuals at risk. MetS has always been categorized using binary criteria, which deny that the risk associated with MetS is likely to exist as a continuum. Also, MetS may present differently depending on age, sex, race, or ethnicity. We aimed to derive age-sex-specific equations for MetS severity scores within a southern Iranian population.
Methods: This study used first-phase data from the Bandare-Kong Non-Communicable Diseases (BKNCD) Cohort Study as part of the Prospective Epidemiological Research Studies in IrAN (PERSIAN). After exclusion of the pregnant women, diabetic patients, and individuals taking antihypertensive, antihyperlipidemic, and antidiabetic medications, 2,735 individuals aged 35 to 70 years were selected for analysis. The diagnosis of MetS was based on the National Cholesterol Education Program (NCEP) criteria for the Iranian population. Confirmatory factor analysis (CFA) was performed to formulate MetS severity scores. The receiver operating characteristic (ROC) analysis was performed to validate MetS severity score equations for age-sex-specific categories.
Results: Triglyceride had the highest factor loading range in all age-sex categories for determining the MetS severity score. Conversely, systolic blood pressure and fasting plasma glucose (FPG) exhibited the lowest factor loadings across all age-sex groups. In both sexes, when age was considered, systolic blood pressure and FPG factor loadings were less significant among subjects aged ≥45 and 35–44 years, respectively.
Conclusion: MetS severity scores might be more applicable than the current criteria of MetS. Prospective population-based studies should be conducted to assess the accuracy and validity of the MetS severity score for predicting cardiometabolic diseases.
Introduction
Several cardiometabolic risk factors are embedded in the definition of metabolic syndrome (MetS). Abdominal obesity, hypertriglyceridemia, high blood pressure, and low serum high-density lipoprotein (HDL) levels are the major components of MetS (1). Epidemiological studies suggest that the incidence of type 2 diabetes mellitus (T2DM) and cardiovascular disease (CVD) is increased by 5- and 2-folds, respectively in individuals with MetS (2, 3). The results of a systematic review and meta-analysis showed a 30.4% prevalence of MetS in the Iranian population (4). According to the national study of MetS prevalence in Iran, prevalence rates ranged from 32 to 47.6%, depending on the criteria used (5). Furthermore, the Bandare-Kong Non-Communicable Diseases (BKNCD) Cohort Study revealed a 34.5% MetS prevalence (6).
Evidence suggests that the traditional MetS criteria cannot accurately predict the risk of cardiometabolic disorders due to racial and ethnic differences and are not applicable to high-risk individuals (7–15). Moreover, MetS has always been categorized using binary criteria, which deny that the risk associated with MetS is likely to exist as a continuum (16, 17). Furthermore, it may be difficult to monitor changes in MetS status over time since its dichotomous status might vary based on whether the component cut-offs are satisfied at each follow-up (16, 18, 19). This study aimed to determine MetS severity score formulas in a southern Iranian population in light of the increasing prevalence of chronic diseases such as T2DM and CVD and the limitations of traditional criteria.
Methods
Participants
The BKNCD provided the data for this cross-sectional study (20). The study included 4,063 individuals aged 35 to 70 recruited from Hormozgan province in southern Iran from 2016 to 2018 as part of the Prospective Epidemiological Research Studies in IrAN (PERSIAN). Pregnant women, individuals with diabetes, and individuals taking antihyperlipidemic, antihypertensive, or antidiabetic medications were not included, leaving a total of 2,735 participants for the final analysis.
Study design
The Ethics Committee of the Hormozgan University of Medical Sciences approved this study (ethics code: IR.HUMS.REC.1399.514), which is in compliance with the statements of the Declaration of Helsinki. Informed consent was provided by all subjects. Sociodemographic data were collected using face-to-face interviews by trained interviewers.
A standard mechanical scale was used for weight measurement (to the nearest 0.5 kg), while subjects wore no shoes and very little clothing. Height measurements were performed while subjects were barefoot and with relaxed shoulders. The average of two waist circumference (WC) measurements were recorded for each subject. WC was measured as the circumference approximately midway the inferior border of the last detectable rib and top of the iliac crest in the mid-axillary line parallel to the floor. A mercury sphygmomanometer with a suitable cuff-size was used for blood pressure (BP) measurements (21), which was done after at least a 5-min rest and while the subject was sitting with his/her arms at the level of the heart and feet on the floor. The measurements were repeated for each subject with at least a 5-min interval and the average was recorded.
Venous blood samples taken after an 8-h overnight fasting were used for fasting plasma glucose (FPG) measurements by the glucose oxidase technique. Venous blood samples taken after a 12-h overnight fasting were used to measure triglyceride (TG) and HDL levels with an enzymatic method. The reason for a longer fasting period for the measurement of these lipid components was to prevent their overestimation (22). According to the Iranian obesity association guidelines, WC ≥95 cm was defined as central obesity. The Iranian National Committee on Obesity has recommended the following MetS criteria and cut-off values, based on the National Cholesterol Education Program (NCEP) criteria, with a person qualifying for MetS if they met at least three of the five components (23):
1. WC ≥ 95 cm.
2. FPG ≥ 100 mg/dl or drug treatment for elevated blood glucose.
3. HDL < 40 mg/dl in men, <50 mg/dl in women, or drug treatment for low HDL.
4. TG ≥ 150 mg/dl or taking lipid-lowering agents.
5. BP ≥ 130/85 mmHg or taking antihypertensive medications.
Data analysis
The SPSS (IBM Corp. 2017. IBM SPSS Statistics for Windows, Version 25. Armonk, NY: IBM Corp) software was used for statistical analyses, the EQS (Bentler, P. M. 2006. EQS 6 Structural Equations Program. Encino, CA: Multivariate Software, Inc.) was used for confirmatory factor analysis (CFA).
A CFA approach was used to calculate MetS severity scores for all standard MetS components to determine each component's weighted contribution to a latent age- and sex-specific MetS factor. Systolic blood pressure (SBP) was used to represent BP. TG had a skewed distribution; therefore, the log-transformed variable of TG was used in the analysis. We used inversed HDL to achieve higher factor loading in order to be interpreted similar to other variables. Standardization was performed on the entire sample [mean = 0; standard deviation (SD) = 1].
CFA was designed as a one-factor model, with the assumption that the errors of measurement were not correlated among the five components. Factor loadings illustrated the strength of association between the underlying MetS factor and each component. Factor loadings >0.3 were considered clinically significant.
The maximum likelihood method was used to estimate the model parameters. Since the χ2 test is sensitive to large sample sizes and is significant in most cases; other fit indices were examined, such as the goodness of fit index (GFI, ≥0.90 indicates a good fit), the Beetle-Browed normed fit index (NFI, ≥0.90 indicates a good fit), and the McDonald fit index (MFI, ≥0.90 indicates a good fit). Additionally, the comparative fit index (CFI, ≥0.90 indicates a good fit), root means squared error of approximation (RMSEA, <0.05 indicates a good fit, values around 0.08 represent good fit), and the standardized root mean square residual (SRMR, ≤0.08 indicates good fit) were measured for model assessment.
Based on standardized factor coefficients from the model, MetS severity scores were calculated for each individual. By taking appropriate linear combinations of the variables in the analysis, factor scores (estimates of an individual's latent factor) can be calculated. The factor score and MetS severity scores were estimated by back-transforming the five components to the unstandardized forms. The estimated MetS severity score can be interpreted as a Z-score, with higher scores indicating increased MetS risk. In order to test the MetS severity Z-score's ability to discriminate against Iranian NCEP criteria for MetS, a receiver operating characteristic (ROC) curve was drawn.
Due to the large sample size, all reported Chi-square tests were significant. Plus, it was not considered as a criterion of model fitting. GFI, adjusted GFI, MFI, and SRMR ranged between 0.96–0.98, 0.90–0.98, 0.95–0.98, and 0.042–0.071, respectively, indicating good model fitting. However, CFI, NFI, and RMSEA failed to reach acceptable cutoff values except for females aged 35–44 years. Therefore, based on the indices mentioned, each sex/age group's resulting pattern was considered a reasonable model for the studied sample.
Results
After applying the exclusion criteria, 2,735 individuals were finally selected for CFA. The CFA of MetS components in this study resulted in producing a model that perfectly fits the data (Table 1).
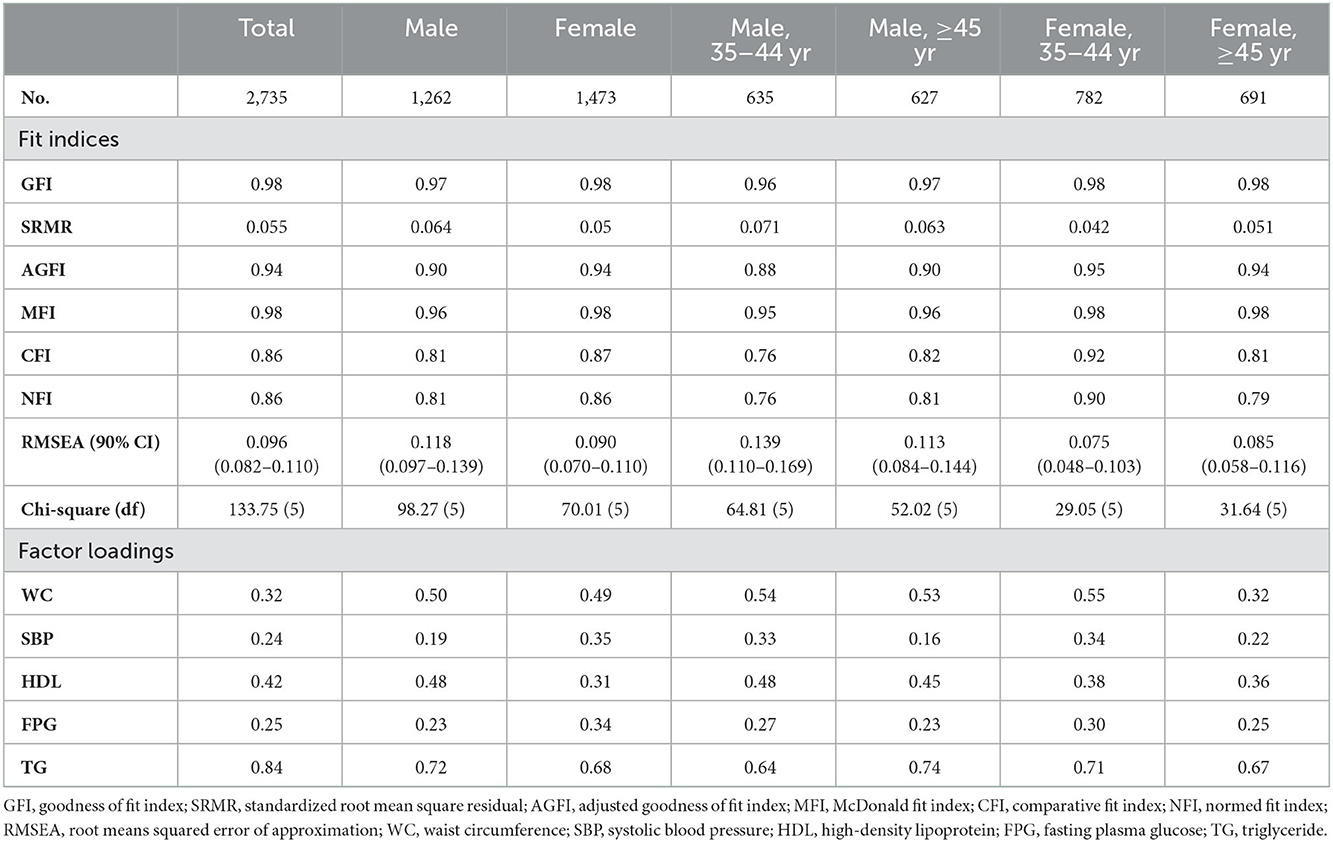
Table 1. Confirmatory factor analysis.
The factor loading of TG ranged from 0.64 to 0.74 among all sex-age categories, as shown in Table 1. In contrast, FPG and SBP had the lowest factor loadings. In both sexes aged ≥45 years, the factor loading of SBP was <0.3; this component had less importance in determining the MetS severity score in these groups. Also, FPG had factor loadings <0.3 across all age-sex groups.
Equations for calculating MetS severity Z-score
Table 2 provides the equations for calculating the severity Z-score for MetS based on clinical components. These formulas are based on actual values rather than standardized measures, produced by back-transformation of coefficients from standardized factor analysis. Table 2 compares the MetS severity Z-score formulas based on different age- and sex-specific categories. Based on these equations, MetS severity score in the population could be calculated.
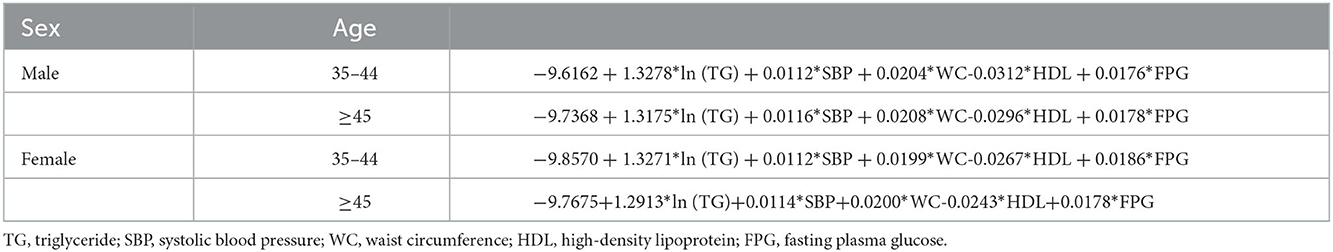
Table 2. Equations for sex- and age-specific metabolic syndrome risk Z-score.
ROC analysis of the resulting risk score was excellent to predict Iranian NCEP classification (Figure 1). The area under the curve (AUC) values of MetS severity score ROC curves were ≥0.91 for every age-sex group.
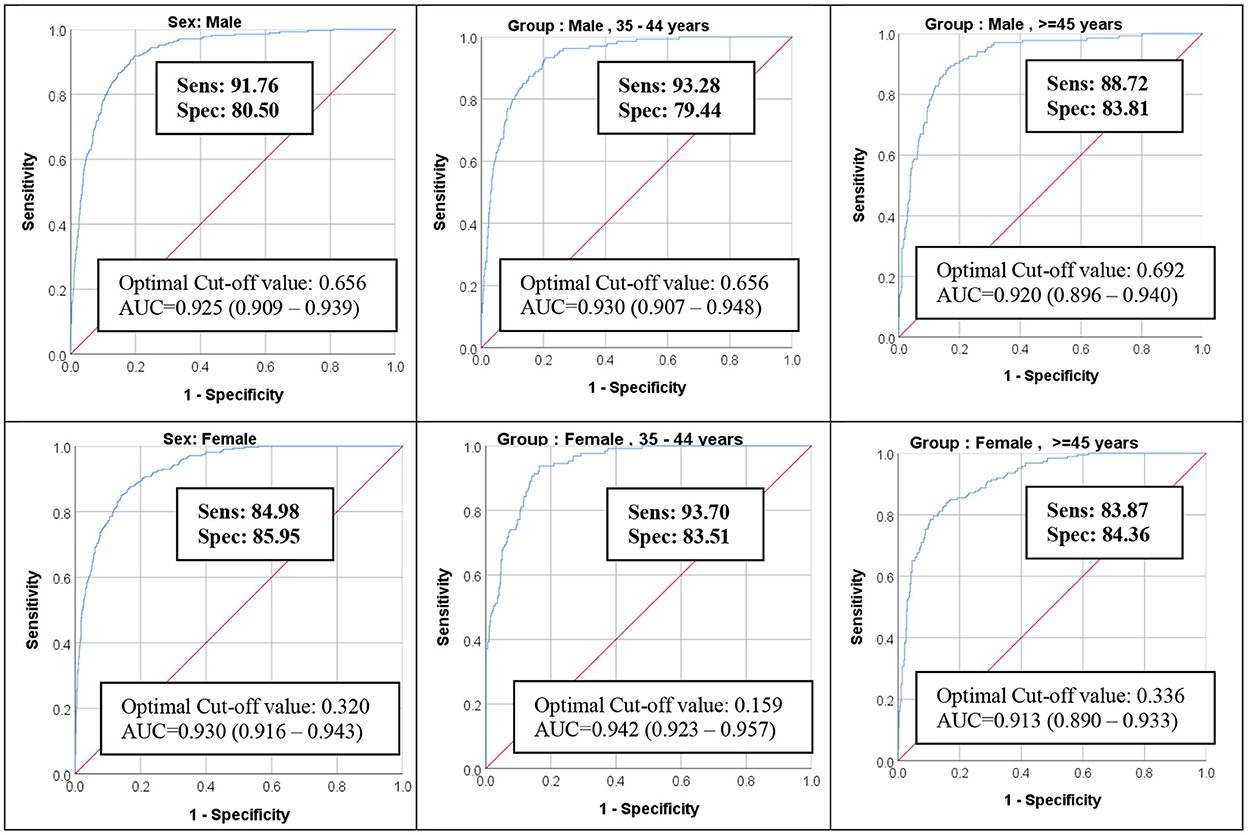
Figure 1. ROC Curve of MetS severity Z-score for predicting MetS NCEP Criteria for the Iranian population. ROC, receiver operating characteristic; MetS, metabolic syndrome; AUC, area under the curve.
Discussion
The present study used CFA to calculate MetS severity scores for the middle-aged and elderly population who participated in the BKNCD cohort study. The results indicated that TG had the highest, while SBP and FPG had the lowest factor loadings for calculating MetS severity scores. Among males and females aged ≥45 years, factor loading of the SBP component had less importance in determining the MetS severity score. Compared to other age and sex groups, FPG had a minor factor loading effect among males and females aged 35–44 years.
Studies have shown that traditional MetS criteria alone cannot accurately predict the risk of progression to major non-communicable diseases such as CVD and T2DM. For instance, non-Hispanic and Hispanic whites exhibit a higher prevalence of MetS compared to non-Hispanic blacks; however, the black population has higher insulin resistance rates, T2DM, and CVD mortality rates. Consequently, there is a concern regarding the potential applicability of traditional MetS criteria to determine the cardiometabolic risk and predict the risk of CVD and T2DM. Essentially, the traditional criteria could only identify individuals with three or more abnormal elements of MetS that are not even necessarily risk factors for CVD and T2DM. Therefore, it is likely that individuals with MetS measurements below the threshold in all five components will be at greater risk than those with measurements just above the threshold in three MetS components but low or normal measurements in the other two (7–16, 24).
Furthermore, it is impossible to follow individuals over time in terms of changes in MetS status using the traditional criteria (18, 19). A study conducted in the US assessed the traditional criteria for MetS with regard to sex and different racial-ethnic groups in order to calculate MetS severity. According to this study, insulin resistance and other biomarkers, including high sensitivity C-reactive protein and uric acid, were associated with MetS severity scores. It is important to note that even though the prevalence of MetS by traditional criteria in non-Hispanic black men with diabetes was reported low, this group scored highly on the severity of MetS. This highlights the limitations of the old method for identifying high-risk individuals and demonstrates the effectiveness of the newly developed method for assessing MetS. According to that study, a clinically-accessible and interpretable measure of MetS was provided by the equations designed to score MetS severity, which may prove useful in detecting adults at higher risk of MetS-associated diseases and measuring changes within individuals over time (25, 26). Furthermore, the effectiveness of this method has been evaluated in Australia, South Korea, and Singapore (27–29).
A major strength of this study was that it was based on data obtained from a well-designed, population-based cohort study. A primary focus was also on verifying the scoring system from this study using the modified NCEP criteria for Iranians in the definition of MetS. This study had some limitations: the sample size was not very large, and the study population was restricted to southern Iranians. Additionally, confirmatory factor analysis was conducted on a relatively healthy group of individuals without medication usage to ensure that MetS-related measures would not be affected. Also, this study did not include individuals under 35 and over 70 years of age. Therefore, the results could not be generalized to all age groups.
Conclusion
MetS severity scores might more accurately identify at-risk individuals than the existing MetS criteria. There is a need to conduct a prospective study with a large population of participants to evaluate the accuracy and validity of the MetS severity score for predicting cardiometabolic diseases.
Data availability statement
The raw data supporting the conclusions of this article will be made available by the authors, without undue reservation.
Ethics statement
The studies involving human participants were reviewed and approved by Ethics Committee of Hormozgan University of Medical Sciences, Bandar Abbas, Iran. The patients/participants provided their written informed consent to participate in this study.
Author contributions
AG performed a comprehensive statistical analysis. MK designed and wrote the manuscript. FY wrote the manuscript. AN supervised the study. AR and AA revised the manuscript. MS interpreted the data. All authors read and approved the final manuscript.
Funding
The Iranian Ministry of Health and Medical Education has contributed to the funding used in the PERSIAN Cohort through Grant Number 700/534.
Acknowledgments
BKNCD is a member of PERSIAN national cohort. We would like to appreciate Professor Reza Malekzadeh, Deputy of Research and Technology at the Ministry of Health and Medical Education of Iran and Director of the PERSIAN cohort, and also Dr. Hossein Poustchi, Executive Director of the PERSIAN cohort, for all their supports during the design and running of BKNCD.
Conflict of interest
The authors declare that the research was conducted in the absence of any commercial or financial relationships that could be construed as a potential conflict of interest.
Publisher's note
All claims expressed in this article are solely those of the authors and do not necessarily represent those of their affiliated organizations, or those of the publisher, the editors and the reviewers. Any product that may be evaluated in this article, or claim that may be made by its manufacturer, is not guaranteed or endorsed by the publisher.
Abbreviations
AUC, area under the curve; BKNCD, Bandare-Kong Non-Communicable Diseases; BP, blood pressure; CFA, confirmatory factor analysis; CFI, comparative fit index; CVD, cardiovascular disease; DBP, diastolic blood pressure; FPG, fasting plasma glucose; GFI, goodness of fit index; HDL, high-density lipoprotein; MetS, Metabolic Syndrome; MFI, McDonald fit index; NCEP, National Cholesterol Education Program; NFI, normed fit index; PERSIAN, Prospective Epidemiological Research Studies in IrAN; RMSEA, root means squared error of approximation; ROC, receiver operating characteristic; SBP, systolic blood pressure; SD, standard deviation; SRMR, standardized root mean square residual; T2DM, type 2 diabetes mellitus; TG, triglyceride; WC, waist circumference.
References
1. Alberti KGMM, Eckel RH, Grundy SM, Zimmet PZ, Cleeman JI, Donato KA, et al. Harmonizing the metabolic syndrome: a joint interim statement of the International Diabetes Federation Task Force on Epidemiology and Prevention; National Heart, Lung, and Blood Institute; American Heart Association; World Heart Federation; International Atherosclerosis Society; and International Association for the Study of Obesity. Circulation. (2009) 120:1640–5. doi: 10.1161/CIRCULATIONAHA.109.192644
2. Mente A, Yusuf S, Islam S, McQueen MJ, Tanomsup S, Onen CL, et al. Metabolic syndrome and risk of acute myocardial infarction: a case-control study of 26,903 subjects from 52 countries. J Am Coll Cardiol. (2010) 55:2390–8. doi: 10.1016/j.jacc.2009.12.053
3. O'Neill S, O'Driscoll L. Metabolic syndrome: a closer look at the growing epidemic and its associated pathologies. Obesity Reviews. (2015) 16:1–12. doi: 10.1111/obr.12229
4. Farmanfarma KK, Kaykhaei MA, Adineh HA, Mohammadi M, Dabiri S, Ansari-Moghaddam A. Prevalence of metabolic syndrome in Iran: a meta-analysis of 69 studies. Diabetes Metab Syndr. (2019) 13:792–9. doi: 10.1016/j.dsx.2018.11.055
5. Tabatabaei-Malazy O, Saeedi Moghaddam S, Rezaei N, Sheidaei A, Hajipour MJ, Mahmoudi N, et al. A nationwide study of metabolic syndrome prevalence in Iran; a comparative analysis of six definitions. PLoS ONE. (2021) 16:e0241926. doi: 10.1371/journal.pone.0241926
6. Zoghi G, Kheirandish M. Prevalence of type 2 diabetes, obesity, central obesity, and metabolic syndrome in a South Coastal Region, Iran, the PERSIAN Bandare Kong cohort study: a brief report. Hormozgan Medical Journal. (2020) 25:42–4. doi: 10.34172/hmj.2021.109599
7. Arslanian S, Suprasongsin C. Differences in the in vivo insulin secretion and sensitivity of healthy black versus white adolescents. J Pediatr. (1996) 129:440–3. doi: 10.1016/S0022-3476(96)70078-1
8. Arslanian S, Suprasongsin C, Janosky JE. Insulin secretion and sensitivity in black versus white prepubertal healthy children. J Clin Endocrinol Metab. (1997) 82:1923–7. doi: 10.1210/jc.82.6.1923
9. Cowie CC, Rust KF, Byrd-Holt DD, Gregg EW, Ford ES, Geiss LS, et al. Prevalence of diabetes and high risk for diabetes using A1C criteria in the US population in 1988–2006. Diabetes Care. (2010) 33:562–8. doi: 10.2337/dc09-1524
10. DeBoer MD. Underdiagnosis of metabolic syndrome in non-Hispanic black adolescents: a call for ethnic-specific criteria. Curr Cardiovasc Risk Rep. (2010) 4:302–10. doi: 10.1007/s12170-010-0104-x
11. Ford ES, Li C, Cook S, Choi HK. Serum concentrations of uric acid and the metabolic syndrome among US children and adolescents. Circulation. (2007) 115:2526–32. doi: 10.1161/CIRCULATIONAHA.106.657627
12. McNeill AM, Rosamond WD, Girman CJ, Golden SH, Schmidt MI, East HE, et al. The metabolic syndrome and 11-year risk of incident cardiovascular disease in the atherosclerosis risk in communities study. Diabetes Care. (2005) 28:385–90. doi: 10.2337/diacare.28.2.385
13. Mozaffarian D, Benjamin EJ, Go AS, Arnett DK, Blaha MJ, Cushman M, et al. Heart disease and stroke statistics-−2016 update: a report from the American Heart Association. Circulation. (2016) 133:e38–e360. doi: 10.1161/CIR.0000000000000350
14. Sumner AE. Ethnic differences in triglyceride levels and high-density lipoprotein lead to underdiagnosis of the metabolic syndrome in black children and adults. J Pediatr. (2009) 155:S7-e7–11. doi: 10.1016/j.jpeds.2009.04.049
15. Walker SE, Gurka MJ, Oliver MN, Johns DW, DeBoer MD. Racial/ethnic discrepancies in the metabolic syndrome begin in childhood and persist after adjustment for environmental factors. Nutrition, Metabolism and Cardiovascular Diseases. (2012) 22:141–8. doi: 10.1016/j.numecd.2010.05.006
16. DeBoer MD, Gurka MJ. Clinical utility of metabolic syndrome severity scores: considerations for practitioners. Diabetes, metabolic syndrome and obesity: targets and therapy. (2017) 10:65. doi: 10.2147/DMSO.S101624
17. Dimitrov BD, Bahchevanov KM, Atanassova PA, Mitkov MD, Massaldjieva RI, Chompalov KA, et al. Metabolic syndrome severity score: range and associations with cardiovascular risk factors. Arch Med Sci Atheroscler Dis. (2016) 1:90–7. doi: 10.5114/amsad.2016.62137
18. Gustafson JK, Yanoff LB, Easter BD, Brady SM, Keil MF, Roberts MD, et al. The stability of metabolic syndrome in children and adolescents. J Clin Endocrinol Metab. (2009) 94:4828–34. doi: 10.1210/jc.2008-2665
19. Li C, Ford ES, Huang TTK, Sun SS, Goodman E. Patterns of change in cardiometabolic risk factors associated with the metabolic syndrome among children and adolescents: the Fels Longitudinal Study. J Pediatr. (2009) 155:S5–e9. doi: 10.1016/j.jpeds.2009.04.046
20. Poustchi H, Eghtesad S, Kamangar F, Etemadi A, Keshtkar A-A, Hekmatdoost A, et al. Prospective epidemiological research studies in Iran (the PERSIAN Cohort Study): rationale, objectives, and design. Am J Epidemiol. (2018) 187:647–55. doi: 10.1093/aje/kwx314
21. James PA, Oparil S, Carter BL, Cushman WC, Dennison-Himmelfarb C, Handler J, et al. 2014 evidence-based guideline for the management of high blood pressure in adults: report from the panel members appointed to the Eighth Joint National Committee (JNC 8). JAMA. (2014) 311:507–20. doi: 10.1001/jama.2013.284427
22. Rifai N, Merrill JR, Holly RG. Postprandial effect of a high fat meal on plasma lipid, lipoprotein cholesterol and apolipoprotein measurements. Ann Clin Biochem. (1990) 27:489–93. doi: 10.1177/000456329002700512
23. Azizi F, Khalili D, Aghajani H, Esteghamati A, Hosseinpanah F, Delavari A, et al. Appropriate waist circumference cut-off points among Iranian adults: the first report of the Iranian National Committee of Obesity. Arch Iran Med. (2010) 13:243–4.
24. Aguilar M, Bhuket T, Torres S, Liu B, Wong RJ. Prevalence of the metabolic syndrome in the United States, 2003-2012. JAMA. (2015) 313:1973–4. doi: 10.1001/jama.2015.4260
25. Gurka MJ, Ice CL, Sun SS, DeBoer MD. A confirmatory factor analysis of the metabolic syndrome in adolescents: an examination of sex and racial/ethnic differences. Cardiovasc Diabetol. (2012) 11:1–10. doi: 10.1186/1475-2840-11-128
26. Gurka MJ, Lilly CL, Oliver MN, DeBoer MD. An examination of sex and racial/ethnic differences in the metabolic syndrome among adults: a confirmatory factor analysis and a resulting continuous severity score. Metabolism. (2014) 63:218–25. doi: 10.1016/j.metabol.2013.10.006
27. Huh JH, Lee JH, Moon JS, Sung KC, Kim JY, Kang DR. Metabolic syndrome severity score in Korean adults: analysis of the 2010–2015 Korea National Health and Nutrition Examination Survey. J Korean Med Sci. (2019) 34:e48. doi: 10.3346/jkms.2019.34.e48
28. Low S, Khoo KCJ, Wang J, Irwan B, Sum CF, Subramaniam T, et al. Development of a metabolic syndrome severity score and its association with incident diabetes in an Asian population—results from a longitudinal cohort in Singapore. Endocrine. (2019) 65:73–80. doi: 10.1007/s12020-019-01970-5
Keywords: metabolic syndrome, metabolic syndrome severity score, Prospective Epidemiological Research Studies in IrAN (PERSIAN), middle-age, adult
Citation: Ghanbarnejad A, Kheirandish M, Yousefzade F, Rahimi A, Azarbad A, Nejatizadeh A and Shahmoradi M (2023) Metabolic syndrome severity score in the middle-aged and elderly Iranian population: A cross-sectional survey of Bandare-Kong Cohort Study (the findings of PERSIAN Cohort Study). Front. Public Health 10:1010735. doi: 10.3389/fpubh.2022.1010735
Received: 04 August 2022; Accepted: 15 December 2022;
Published: 06 January 2023.
Edited by:
Nikolai Paul Pace, University of Malta, MaltaReviewed by:
Majid Mardaniyan Ghahfarrokhi, Shahrekord University, IranMahdi Vajdi, Isfahan University of Medical Sciences, Iran
Copyright © 2023 Ghanbarnejad, Kheirandish, Yousefzade, Rahimi, Azarbad, Nejatizadeh and Shahmoradi. This is an open-access article distributed under the terms of the Creative Commons Attribution License (CC BY). The use, distribution or reproduction in other forums is permitted, provided the original author(s) and the copyright owner(s) are credited and that the original publication in this journal is cited, in accordance with accepted academic practice. No use, distribution or reproduction is permitted which does not comply with these terms.
*Correspondence: Masoumeh Kheirandish,  a2hlaXJhbmRpc2htQHlhaG9vLmNvbQ==