 Zanrong Zhou
 Xiangjing Gao
 Yiyao Cao
 Hua Zou
 Yulan Jin
- 1Institute of Occupational Health and Radiation Protection, Zhejiang Center for Disease Control and Prevention, Hangzhou, China
- 2Hangzhou Hospital of Zhejiang Medical and Health Group, Hangzhou, China
Background: The hazards of kitchen particles have attracted social attention, but their distribution characteristics and risk assessment are rarely reported.
Objective: To explore the temporal and spatial distribution characteristics of kitchen particles, analyze the variations in characteristics of number concentration (NC), mass concentration (MC), surface area concentration (SAC), and particle size distribution, provide reference indexes for evaluating worker exposure, evaluate the risk of kitchen particles, as well as suggest improvements and control measures.
Patients and methods: Different cooking posts in a Chinese hotel kitchen were selected to monitor exposure to particles, explore the temporal and spatial distribution characteristics of NC, MC, and SAC of particles in the cooking post, analyze changes in the particle size, compare the individual exposure of particles between the cooking and steaming posts, and analyze the correlation between NC, MC, and SAC. Risk assessment of kitchen ultrafine particles was performed using a Nanotool.
Results: The sizes and fluctuation ranges of NC10 − 500nm at cooking posts during lunch preparation and at peak periods were significantly higher than those at the end of the lunch period. The mean values of MC10 − 500nm during the lunch preparation peak and ending periods were 0.149, 0.229, and 0.151 mg m−3, respectively. The mean values of SAC10 − 500nm were 225, 961, and 466 μm2·cm−3, respectively. The mode diameter of exposed particles at the cooking post [(34.98 ± 2.33) nm] was higher than that at the steaming post [(30.11 ± 2.17) nm] (P < 0.01). The correlation between SAC10 − 500nm and NC10 − 500nm (r = 0.703) was the strongest. Nanotool gave a hazard rating ratio, exposure rating ratio, and risk ratio of 0.75.
Conclusion: The sizes of the NC, MC, and SAC of the particles at the cooking post were related to the kitchen operations. Since kitchen particles are of high exposure and risk levels, protective measures should be formulated and implemented to deal with them safely.
Introduction
Catering-related kitchen fume pollution is increasing in severity. It is now one of the main air pollutants in indoor living environments. Kitchen oil fumes are aerosols composed of gas, solids, and liquids (1), which can float in the air for a long time, and contain many ultrafine particles smaller than 0.1 μm. Ultrafine particles are generally defined as aerodynamic, geometric, or having migration diameters < 100 nm, and are marked by particularity, diversity, and potential harm (2). The new physical and chemical characteristics of ultrafine particles lead to complex exposure characteristics and different biological effects (3). Results from in vitro and animal experiments have shown that ultrafine particles have greater toxicological effects than large particles of parent materials (4). The health risks caused by the characteristics and widespread existence of ultrafine particles have attracted extensive attention, but there is a lack of population exposure data. The direct reason is that there is no perfect method for the exposure assessment of ultrafine particles in China or elsewhere. One reason for the lack of exposure assessment methods is that people do not know much about the exposure characteristics of ultrafine particles in the workplace. This paper mainly studied the distribution characteristics of particulate matter in Chinese kitchens, the relationship between Sac, Mc and Nc, and risk assessment methods, focusing on the relationship between SAC, MC and NC, which is the difference between related studies (5).
Currently, there is not much literature in China and worldwide on the harm of kitchen oil fume particles to the human body and how to control the amount of oil fume particles (6, 7). Studies have shown that kitchen oil fume particles can cause cardiovascular and cerebrovascular diseases, cancer, skin damage, respiratory diseases and so on (8). Researchers have reported the induced damage of kitchen oil fume particles to DNA (9), the source of indoor ultrafine particles (10), the differences in the number of particles produced by different cooking methods (11), the impact of different energy heating methods on particles in the kitchen (12), and differences in the number of particles produced by variations in oil heating. Few studies have examined the distribution and exposure characteristics of oil fume particles and assessed the risks of kitchen particles. However, assessment methods and improvements that should be made and adopted still need to be discussed. Similarly, due to their unique nature and specific size, these particles may cause different health hazards than other dust materials. Therefore, the method for evaluating their exposure concentrations and risk should be different from that for other dust material counterparts. The toxicity of ultrafine particles may be due to their small size, high surface activity, charge, and dissolution rate. Kitchen particles have high surface activity, which can promote the ability of nanoparticles to enter cells, resulting in damage to the cells, proteins, and genes in the lungs, as well as the cardiovascular and nervous systems (13). Kitchen oil fumes contain a large number of free radicals with large molecular weight and high stability, which can generate reactive oxygen free radicals and lipid peroxides when entering the body, an important cause of lung cancer, tracheitis, pneumonia, and emphysema (14).
Thus far, the existing studies cannot clarify their damage to the body. Moreover, the international standard of exposure limit has not yet been determined. Due to the potential toxic effect of kitchen particles on human health, it is very important to conduct a risk assessment of these particles. The impact of kitchen particles on human health is a research field worthy of discussion. Thus, we used existing data to evaluate the risk of occupational exposure to kitchen particles, as well as to establish a comprehensive and systematic kitchen particles database. This study examined the number concentration (NC), mass concentration (MC), surface area concentration (SAC), and size distribution of particles in a Chinese kitchen. It also explored the temporal and spatial distribution characteristics of each index and focusing on the correlations between MC, NC, and SAC, which is the difference between related studies (5). This study is expected to preliminarily clarify the exposure characteristics of particles in kitchen fumes, suggest better indicators for the exposure assessment of kitchen workers, provide a basis for the health risk management of exposed people, and lay an experimental foundation for future studies on the health effects of kitchen fumes.
Materials and methods
Kitchen selection
A Chinese hotel kitchen was selected as the survey site. The kitchen is set on the second floor of the north side of the hotel, which connects to the outside world only by the smoke exhaust duct. The kitchen has an area of 5 m × 16 m, and is divided into a storage room, preparation area, and cooking area. There were vegetables, frozen food, and other food materials in the storage room, from which they were taken out by the food preparation personnel in that order during preparation. The preparation area was the operation area for cold dish preparation, cleaning, and chopping food materials. The cooking area was an operation area for cooking food materials. The hood ventilation facilities were set above the front of the five cooking stoves in the operation area, but there was only one hood ventilation system in this kitchen. During operation, the air velocity at the capture point was about 0.8 m · s−1. The chef did not wear protective masks or noise-proof earplugs, and lunchtime was mainly from 10 a.m. to 2 p.m. The preparation area was adjacent to the cooking area. Therefore, both work areas were exposed to the oil fumes generated during cooking.
Measurement indicators and instruments
The measurement indices were divided into exposure concentration and particle size distribution. The exposure concentration indices were MC, NC, and SAC (referring to the sum of all particle surface areas in unit volume), and the particle size distribution index was the particle size distribution of NC. In addition, the auxiliary measurement indicators include air temperature, air pressure and wind speed in meteorological conditions. Table 1 shows the main instruments and parameters. The instruments used included the aerosol monitor Dusttrak 8533, the ultrafine particle counter 3007, the nanoparticle aerosol monitor Aero Trak 9000, the scanning electromigration particle size meter SMPS 3034, the optical particle sizer OPS 3330, the meteorological condition meter 9565 (TSI, USA), and the nanoparticle analyzer Discmini (Testo, range 10–700 nm, Germany). All instruments are returned annually to the original factory for calibration.
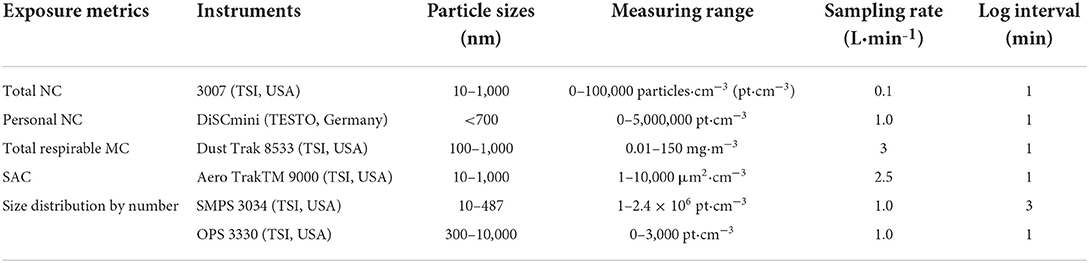
Table 1. The main instruments and parameters.
Sampling scheme
Firstly, through on-site investigation and pre-detection of the workplace with 3007, the emission source of particles at the detection posts was determined, as well as the sampling time. The specific detection scheme was as follows: (15) ① Background concentration measurement: the concentration of particles in the air in the kitchen between 9 and 9:59 am before cooking on the same day was selected as the background concentration. When detecting the background concentration, there were no workers or other particle release sources. ② Particle detection based on operation activities: the detection location was based on the early field investigation data and pre-detection, and the influences of the chef's operation mode, instruments, and equipment on the chef's operation were considered. The main cooking methods included stir-frying, pan-frying, and deep-frying, which were generally operate under rapid high-heat conditions. There were also steaming posts, which were usually operated under continuous heating. The combination of fixed-point sampling and individual sampling was adopted within the same day at different times, and individual samples were collected for different indicators. The temporal and spatial distributions of particles in cooking posts were analyzed by fixed-point sampling (180 groups of data were collected throughout the preparation, peak, and ending periods). An individual sampling method was used to analyze the particle exposure characteristics of different posts (133 groups of data were collected during the preparation and peak periods). For individual sampling, the instrument was hung on the chef, and the sampling air inlet was clamped at the breathing belt position on the chef's collar. During fixed-point sampling, the sampling and testing instrument was placed at the downwind side of the testing post. The instrument and equipment were as close to the chef as possible without affecting his operation. The point distribution position is shown in Figure 1. The detection height was the worker's respiratory belt level. The detection time was from the beginning of preparation to the end of operation activities. The detection period was 10:45–13:44. Simultaneously, the background value in the kitchen during non-working hours before lunch was detected, and the detection period was 9:00–9:59. Table 2 illustrates the detailed events of each stage.
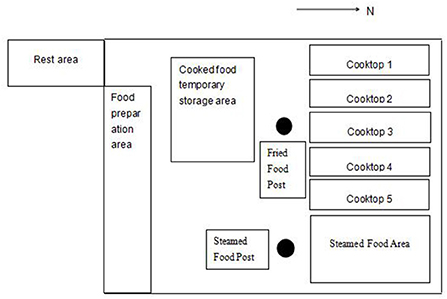
Figure 1. Locations of monitoring sites. •: Detection point.
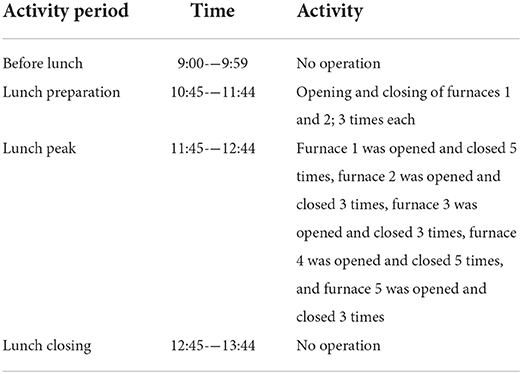
Table 2. Record of activities in each lunch period.
Risk assessment method
According to previous studies (16), the Nanotool (http://www.controlbanding.net/) is suitable for nanoparticles and has comprehensive advantages in risk assessment; thus, it was selected for use in this study. It was developed by Paik and Zalk at Lawrence Livermore National Laboratory in the United States. The Nanotool uses a scoring system to allocate risk and exposure levels, as well as combines the risk and exposure levels to obtain the risk level in the two-dimensional decision matrix, followed by dividing them into four levels on average. Table 3 shows the hazard and exposure input parameters. Hazards were determined based on particle shape, concentration, surface activity, and toxicity (including carcinogenicity, mutagenicity, and reproductive toxicity). Exposure levels were determined by substance emission potential, activity emission potential, and exposure control.
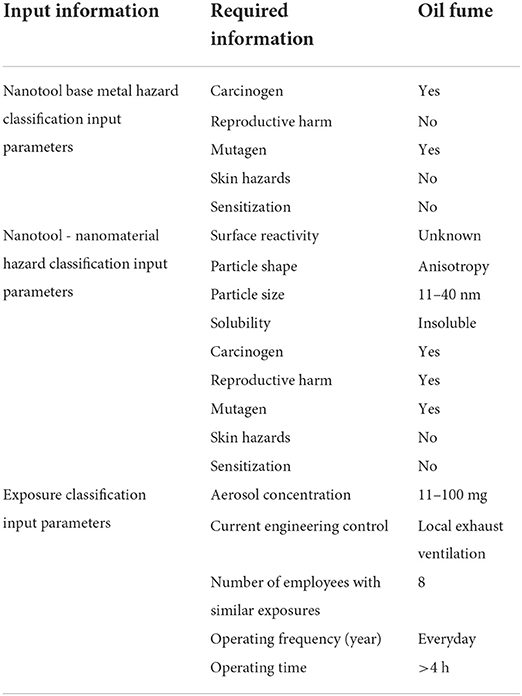
Table 3. Hazard parameters and exposure scenario parameters of oil fume.
Statistical analysis
The comparison of NC and the background concentration of particles exposed to different cooking posts and the comparison of the SAC of particles under different modes were analyzed using one-way ANOVAs. The pairwise comparison was performed using the Least-SignificantDifference (LSD)method when the variances were homogeneous. The pattern diameter of particles, or the particle diameter corresponding to the maximum NC of the particles at lunch peak, exposed to different cooking posts was analyzed using a one-way ANOVA with repeated data. The Pearson correlation method was used to analyze the correlations between NC, MC, and SAC. The significance level was set at α = 0.05.
Results
Time-concentration particle changes at the fried food post
As shown in Figures 2, 4, the sizes and fluctuation ranges of NC10 − 500nm during the lunch preparation and peak periods were significantly higher than those during the lunch ending period. These were related to operational activities. The lunch preparation period was 10:45–11:44, which mainly focused on vegetable preparation, as well as cooking and heating preparation, with no cooking activities. The average NC10 − 500nm particle value was ~106·pt·cm−3. The lunch peak period was 11:45–12:44. Cooking activities were frequent during this stage, and the average NC10 − 500nm value was about 9.8 × 10⁵ ·pt·cm−3. There was no significant difference between lunch preparation and lunch peak NC10 − 500nm. Lunch ended at 12:45–13:44. There were a few cooking activities from 12:45 to 13:00, after which there were none. The average value of NC10 − 500nm was 4.2 × 10⁵·pt·cm−3, which was lower than that during the preparation and peak period (P < 0.01), but higher than the background value (about 0.4 × 10⁵ ·pt·cm−3; P < 0.01).
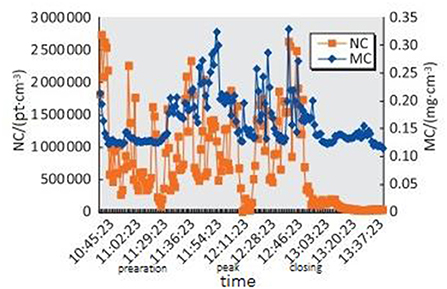
Figure 2. Distribution of NC10 − 500nm and MC10 − 500nm of fried food posts in the Chinese kitchen in different time periods.
MC10 − 500nm fluctuated less than NC10 − 500nm throughout the whole process. The mean values of MC10 − 500nm during the lunch preparation, peak, and closing periods were 0.149, 0.229, and 0.151mg · m−3, respectively. MC10 − 500nm in the peak period was higher than that in the preparation and closing periods (P < 0.05); however, there was no difference in MC10 − 500nm between the lunch preparation and closing periods (P > 0.05).
As shown in Figures 3, 4, the mean values of SAC10 − 500nm during the lunch preparation, peak, and closing periods were 225, 961, and 466 μm2 · cm−3, respectively. The SAC10 − 500nm value was higher during the peak period than during the preparation and ending periods and was higher during the ending period than during the preparation period (P < 0.05).
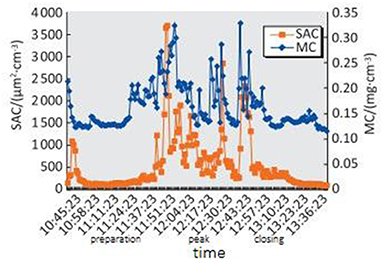
Figure 3. Distribution of SAC10~500nm and MC10~500nm of particles at fried food posts in the Chinese kitchen in different time periods.
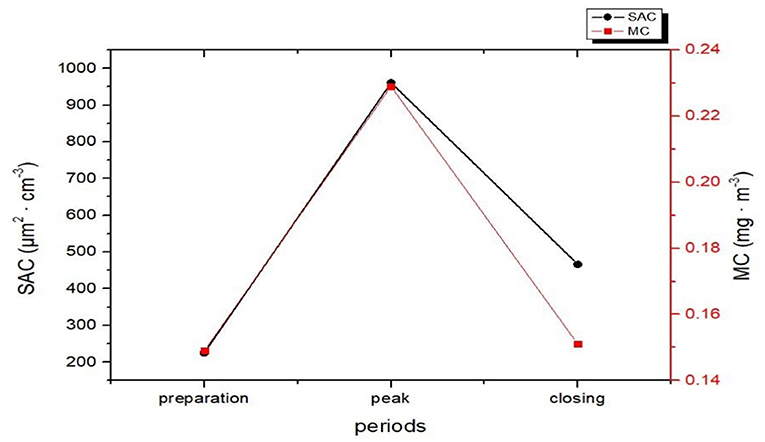
Figure 4. Mean values of SAC10~500nm and MC10~500nm of particles at fried food posts in the Chinese kitchen in different periods.
Particle size characteristics for the fried food posts
During the lunch peak, the number of particles was distributed from large to small, as shown in Figure 5: within 100nm, > 100–200nm, > 200–300nm, > 300–400nm, and > 400–500nm. The proportion of particles with a particle size less than 100nm and less than 200nm was 94.67% and 98.38%, respectively. When the particle size was less than 200 nm, the NC of the particles of 19nm was the largest, so the mode diameter at the lunch peak was 19nm.

Figure 5. Percentages of particle number distribution with different particle size at lunch peak.
Individual particle exposure levels at different cooking posts
The NC10 − 700nm [(1,032,352 ± 158,231), (668,771 ± 23,623) pt·cm−3] of the particles exposed to the cooking and steaming posts was higher than the background value (42,485 pt·cm−3) (P < 0.01). The NC10 − 700nm of the cooking posts was higher than that of the steaming posts (P < 0.01), and the mode diameter of the particles exposed to the cooking posts [(34.98 ± 2.33) nm] was higher than that of the steaming posts [(30.11 ± 2.17) nm] (P < 0.01), as shown in Table 4.
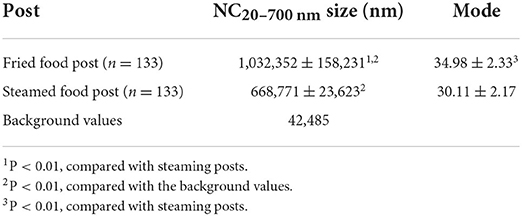
Table 4. Analysis of variance of NC20 − 700nm and mode diameter of particles in different posts (n = 133).
Correlations between MC, NC, and SAC
The correlation between NC10 − 500nm and SAC10 − 500nm was the strongest, with a correlation coefficient of 0.703 (P < 0.01). The correlation coefficients of NC10 − 500nm and MC10 − 500nm, as well as SAC10 − 500nm and MC10 − 500nm were 0.412 and 0.351, respectively (P < 0.05), as shown in Table 5.
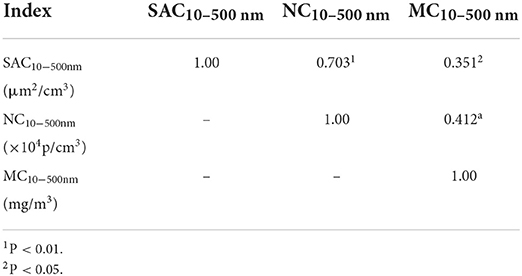
Table 5. Correlation Analysis between MC10 − 500nm, NC10 − 500nm and SAC10 − 500nm (n = 180).
Risk assessment of kitchen particles and control measures to be improved
Table 6 shows the risk assessment results of the control classification tool and the preventive measures recommended by the National Institute for Occupational Safety and Health (NIOSH) regulations. Nanotool's hazard and exposure level ratios were 0.75, and the risk ratio was 0.75, suggesting high exposure and risk levels and indicating that protective measures should be formulated and implemented for kitchen oil fumes. According to NIOSH regulations, the prevention and control of ultrafine particles include five elimination steps: replacement, engineering control, administrative control, and personal protective equipment (PPE). Since it is impossible to eliminate and substitute ultrafine particles during cooking, the following control levels should be adopted: engineering control, administrative control, and PPE. Table 5 lists the current control measures and other control measures that need improvement.
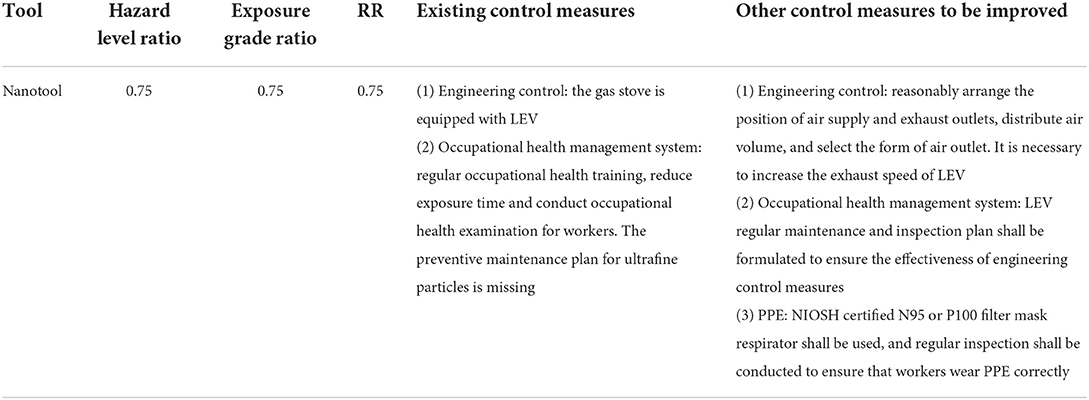
Table 6. Risk assessment and control measures.
Discussion
The NC10 − 500nm values and particle fluctuations during the lunch preparation and peak periods were greater than those of the background value. However, there was no difference between the preparation and the peak periods. The kitchen operation during preparation is mainly the pretreatment of some dishes, and a small amount of cooking operation will also produce soot particles. The above factors will increase the exposure of NC10 − 500nm during lunch preparation (17).
SAC10 − 500nm was different in the three lunch periods, with peak period > ending period > preparation (P < 0.05). The particle SAC10 − 500nm in the peak period of operation was higher than that of the preparation and ending periods, which was related to the particle NC10 − 500nm in the peak period. Thus, the value in the ending period was higher than that in the preparation period, which may be related to the presence of many particles floating in the air during the ending period (18). This study also found a correlation between SAC10 − 500nm and MC10 − 500nm, consistent with the results from a study by Zou et al. (19).
The focus of this study was mainly ultrafine particles within the 100 nm limit. When analyzing the composition of particles according to size, we also analyzed particles with other sizes. Particles above 500 nm have a short residence time in the air and low concentration, which is difficult for the sampling instrument to capture. Regarding composition, the number of particles < 100 nm accounted for over 94%, occupying an absolute advantage, which may be related to the agglomeration effect of ultrafine particles (20).
When studying the NC10 − 700nm exposure characteristics of individual particles at the cooking and steaming posts, we found that the NC10 − 700nm exposure values of the two posts were both statistically significant according to a one-way ANOVA (P < 0.01). Considering that the components of particles in contact with the cooking and steaming posts were not the same, it can be inferred that the cooking post was mainly exposed to a large amount of grease. In contrast, the steaming post was exposed to a large amount of steam. Therefore, the harm of particle exposure at the cooking post may be much greater than that at the steaming post.
Correlation analysis showed that the correlation between SAC10 − 500nm and NC10 − 500nm was higher than that between SAC10 − 500nm and MC10 − 500nm, which is consistent with the results of a study by Heitbrink et al. (21). Toxicological studies have also shown a strong dose-response relationship between the surface area dose of very low solubility fine particles and ultrafine particles and inflammatory lung response (22). Moreover, epidemiological studies have shown a correlation between SAC and population health risk (23). Further, there was no linear correlation between the measurement results of daily air pollution with MC as the index and death (24). However, by applying the same detection index and converting MC data into SAC analysis, we found a linear correlation between the SAC of particles in the ambient air and death data, indicating that SAC may be more suitable as an air exposure index (25). These studies suggest that MC alone cannot replace NC or SAC indicators.
Although we had selected the most common Chinese hotel kitchen in this study, it is still a case report. The sampling results of ultrafine particles were closely related to sampling location, distance, wind direction, air inlet direction, operation conditions, and protective measures (26, 27). The wind speed in the kitchen environment was relatively stable. Still, the movement of operators as well as equipment interfered with the wind speed and direction, leading to changes in the distribution of ultrafine particles. Therefore, this study recorded the activity events and meteorological conditions of the sampling process in detail. According to the characteristics of kitchen operation posts, the components of kitchen oil fumes (28) are complex, mainly including over 200 kinds of aldehydes, ketones, hydrocarbons, fatty acids, alcohols, aromatic compounds, esters, lactones, and heterocyclic compounds, most of which are toxic or even strong carcinogens (such as benzopyrene, and heterocyclic amines). The workers were tracked and sampled during a complete lunch cycle. The results showed that a slight change in the surrounding environment had different effects on different detection instruments, however, specific reasons need to be further discussed. Since the physical and chemical characteristics of ultrafine particles are different from those of general particles (29), eliminating the influence of background mixing and external interference in the workplace environment on the results is a problem that needs to be addressed in future research.
The exposure, hazard level, and risk ratios for this scenario given by the Nanotool model were all 0.75, which is high. The revealed high proportion of carcinogens in cooking smoke supports the results of high-risk levels obtained from control banding tools, and the results of NC, MC, SAC, and individual NC confirm the high exposure risk.
Epidemiological studies reported that cooking fumes contain many carcinogens and exposure to them increases cancer risk, which provides evidence for the high-risk nature of such air pollution. Controlling occupational hazard exposure is the primary method for protecting workers with high-risk exposure. According to NIOSH regulations, a series of controls, including elimination, substitution, engineering, administrative, and PPE, have been used to implement feasible and effective controls. For the restaurant investigated in this study, elimination, and substitution were not feasible, and instead, the best way to control kitchen fumes was to use engineering control. Results of the risk assessment showed that prevention and control measures should include local exhaust ventilation (LEV), indicating that the effectiveness of the existing LEV of the restaurant was insufficient, the air velocity at the capture point should be at least 1.2 m · s−1 (30). The reasons for this may include insufficient wind speed, the unreasonable position of the exhaust hood, and rising airflow in response to high temperatures. The following prevention and control measures should be added to the existing measures to protect workers in similar restaurants: (1) The capture efficiency of LEV needs to be improved. (2) A preventive maintenance plan should be formulated to ensure the effectiveness of engineering control measures. (3) NIOSH certified N95 or P100 filter mask respirators should be used, and regular inspection should be conducted to ensure that workers wear PPE correctly.
Data availability statement
The raw data supporting the conclusions of this article will be made available by the authors, without undue reservation.
Author contributions
ZZ contributed to the conceptualization, data curation, investigation, funding acquisition, supervision, and writing of the original draft. XG contributed to the investigation, data curation, methodology, funding acquisition, and formal analysis. YC contributed to the investigation and funding acquisition. HZ and YJ contributed to the conceptualization, funding acquisition, review, and editing of the manuscript. All authors contributed to the article and approved the submitted version.
Funding
This study was supported by the Zhejiang Medical and Health Science and Technology Plan Project in 2021 (2021431152).
Acknowledgments
The authors would like to acknowledge the hotel chef and related staff.
Conflict of interest
The authors declare that the research was conducted in the absence of any commercial or financial relationships that could be construed as a potential conflict of interest.
Publisher's note
All claims expressed in this article are solely those of the authors and do not necessarily represent those of their affiliated organizations, or those of the publisher, the editors and the reviewers. Any product that may be evaluated in this article, or claim that may be made by its manufacturer, is not guaranteed or endorsed by the publisher.
Abbreviations
Abbreviations: NC, number concentration; MC, mass concentration; SAC, surface area concentration; NIOSH, National Institute for Occupational Safety and Health; PPE, personal protective equipment; LEV, local exhaust ventilation; LSD, least-significant difference.
References
1. Li S, Gao J, He Y, Cao L, Li A, Mo S, et al. Determination of time- and size-dependent fine particle emission with varied oil heating in an experimental kitchen. J Environ Sci. (2017) 51:157–64. doi: 10.1016/j.jes.2016.06.030
2. Gomes JF, Albuquerque PC, Miranda RM, Santos TG, Vieira MT. Comparison of deposited surface area of airborne ultrafine particles generated from two welding processes. Inhal Toxicol. (2012) 24:774–81. doi: 10.3109/08958378.2012.717648
3. Elihn K, Berg P. Ultrafine particle characteristics in seven industrial plants. Ann Occup Hyg. (2009) 53:475–84. doi: 10.1093/annhyg/mep033
4. Cheng Z, Liang X, Liang S, Yin N, Faiola F. A human embryonic stem cell-based in vitro model revealed that ultrafine carbon particles may cause skin inflammation and psoriasis. J Environ Sci. (2020) 87:194–204. doi: 10.1016/j.jes.2019.06.016
5. Gao X, Zhang M, Zou H, Zhou Z, Yuan W, Quan C, et al. Characteristics and risk assessment of occupational exposure to ultrafine particles generated from cooking in the Chinese restaurant. Sci Rep. (2021) 11:15586. doi: 10.1038/s41598-021-95038-y
6. Pan CH, Shih TS, Chen CJ, Hsu JH, Wang SC, Huang CP, et al. Reduction of cooking oil fume exposure following an engineering intervention in Chinese restaurants. Occup Environ Med. (2011) 68:10–5. doi: 10.1136/oem.2009.049767
7. Wang L, Zheng X, Stevanovic S, Wu X, Xiang Z, Yu M, et al. Characterization particulate matter from several Chinese cooking dishes and implications in health effects. J Environ Sci. (2018) 72:98–106. doi: 10.1016/j.jes.2017.12.015
8. Li H, Wang L, Guan S, Zhou S, Chen Y. In vitro and in vivo low-dose exposure of simulated cooking oil fumes to assess adverse biological effects. Sci Rep. (2022) 12:15691. doi: 10.1038/s41598-022-19558-x
9. Valavanidis A, Fiotakis K, Vlachogianni T. Airborne particulate matter and human health: toxicological assessment and importance of size and composition of particles for oxidative damage and carcinogenic mechanisms. J Environ Sci Health C Environ Carcinog Ecotoxicol Rev. (2008) 26:339–62. doi: 10.1080/10590500802494538
10. Wallace LA, Ott WR, Weschler CJ. Ultrafine particles from electric appliances and cooking pans: experiments suggesting desorption/nucleation of sorbed organics as the primary source. Indoor Air. (2015) 25:536–46. doi: 10.1111/ina.12163
11. See SW, Balasubramanian R. Physical characteristics of ultrafine particles emitted from different gas cooking methods. Aerosol Air Qual Res. (2006) 6:82–92. doi: 10.4209/aaqr.2006.03.0007
12. Wallace L, Wang F, Howard-Reed C, Persily A. Contribution of gas and electric stoves to residential ultrafine particle concentrations between 2 and 64 nm: size distributions and emission and coagulation remission and coagulation rates. Environ Sci Technol. (2008) 42:8641–7. doi: 10.1021/es801402v
13. Horie M, Nishio K, Fujita K, Kato H, Nakamura A, Kinugasa S, et al. Ultrafine NiO particles induce cytotoxicity in vitro by cellular uptake and subsequent Ni(II) release. Chem Res Toxicol. (2009) 22:1415–26. doi: 10.1021/tx900171n
14. Sjaastad AK, Svendsen K. Exposure to mutagenic aldehydes and particulate matter during panfrying of beefsteak with margarine, rapeseed oil, olive oil or soybean Oil. Ann Occup Hyg. (2008) 52:739–45. doi: 10.1093/annhyg/men060
15. Gao X, Zou H, Xu X, Zhou L, Tang S, Yuan W, et al. Developing a guideline for measuring the total number concentration of engineering nanomaterials in workplaces in China. J Occup Health. (2019) 61:197–202. doi: 10.1002/1348-9585.12044
16. Zalk DM, Paik SY, Chase WD, A. Quantitative validation of the control banding nanotool. Ann Work Expo Health. (2019) 68:898–917. doi: 10.1093/annweh/wxz057
17. Tseng LC, Chen CC. Effect of flow characteristics on ultrafine particle emissions from range hoods. Ann Occup Hyg. (2013) 57:920–33. doi: 10.1093/annhyg/met006
18. Yang S, Subramanian S, Singleton D, Schroeder C, Schroeder W, Gundersen MA, et al. First results on transient plasma-based remediation of nanoscale particulate matter in restaurant smoke emissions. Environ Res. (2019) 178:108635. doi: 10.1016/j.envres.2019.108635
19. Zou H, Zhang Q, Xing M, Gao X, Zhou L, Tollerud DJ, et al. Relationships between number, surface area, and mass concentrations of different nanoparticles in workplaces. Environ Sci Process Impacts. (2015) 17:1470–81. doi: 10.1039/C5EM00172B
20. Brand P, Lenz K, Reisgen U, Kraus T. Number size distribution of fine and ultrafine fume particles from various welding processes. Ann Occup Hyg. (2013) 57:305–13. doi: 10.1093/annhyg/mes070
21. Heitbrink WA, Evans DE, Ku BK, Maynard AD, Slavin TJ, Peters TM. Relationships among particle number, surface area, and respirable mass concentrations in automotive engine manufacturing. J Occup Environ Hyg. (2009) 6:19–31. doi: 10.1080/15459620802530096
22. Yang J, Kim YK, Kang TS, Jee YK, Kim YY. Importance of indoor dust biological ultrafine particles in the pathogenesis of chronic inflammatory lung diseases. Environ Health Toxicol. (2017) 32:e2017021. doi: 10.5620/eht.e2017021
23. Moshammer H, Neuberger M. The active surface of suspended particles as a predictor of lung function and pulmonary symptoms in Austrian school children. Atmos Environ. (2003) 37:1737–44. doi: 10.1016/S1352-2310(03)00073-6
24. Schwartz J, Marcus A. Mortality and air pollution in London: a time series analysis. Am J Epidemiol. (1990) 131:185–94. doi: 10.1093/oxfordjournals.aje.a115473
25. Maynard AD, Maynard RL. A derived association between ambient aerosol surface area and excess mortality using historic time series data. Atmos Environ. (2002) 36:5561–7. doi: 10.1016/S1352-2310(02)00743-4
26. Methner M, Beaucham C, Crawford C, Hodson L, Geraci C. Field application of the Nanoparticle Emission Assessment Technique (NEAT): task-based air monitoring during the processing of engineered nanomaterials (ENM) at four facilities. J Occup Environ Hyg. (2012) 9:543–55. doi: 10.1080/15459624.2012.699388
27. Kuhlbusch TA, Asbach C, Fissan H, Göhler D, Stintz M. Nanoparticle exposure at nanotechnology workplaces: a review. Part Fibre Toxicol. (2011) 8:22. doi: 10.1186/1743-8977-8-22
28. Zhang Q, Gangupomu RH, Ramirez D, Zhu Y. Measurement of ultrafine particles and other air pollutants emitted by cooking activities. Int J Environ Res Public Health. (2010) 7:1744–59. doi: 10.3390/ijerph7041744
29. Xing M, Zou H, Gao X, Chang B, Tang S, Zhang M. Workplace exposure to airborne alumina nanoparticles associated with separation and packaging processes in a pilot factory. Environ Sci Process Impacts. (2015) 17:656–66. doi: 10.1039/C4EM00504J
Keywords: particles, quantity concentration, mass concentration, surface area concentration, risk assessment
Citation: Zhou Z, Gao X, Cao Y, Zou H and Jin Y (2022) Exposure characteristics and risk assessment of air particles in a Chinese hotel kitchen. Front. Public Health 10:1019563. doi: 10.3389/fpubh.2022.1019563
Received: 15 August 2022; Accepted: 10 October 2022;
Published: 25 October 2022.
Edited by:
Dongming Wang, Huazhong University of Science and Technology, ChinaReviewed by:
Francesca Borghi, University of Insubria, ItalyRui Chen, Beijing Academy of Science and Technology, China
Copyright © 2022 Zhou, Gao, Cao, Zou and Jin. This is an open-access article distributed under the terms of the Creative Commons Attribution License (CC BY). The use, distribution or reproduction in other forums is permitted, provided the original author(s) and the copyright owner(s) are credited and that the original publication in this journal is cited, in accordance with accepted academic practice. No use, distribution or reproduction is permitted which does not comply with these terms.
*Correspondence: Hua Zou, aHpvdUBjZGMuemouY24=; Yulan Jin, MjIxODY0Mjc1NkBxcS5jb20=