 Nazrul Anuar Nayan1,2*†
 Choon Jie Yi1†
 Mohd Zubir Suboh1†
 Nur-Fadhilah Mazlan3†
 Petrick Periyasamy4†Muhammad Yusuf Zawir Abdul Rahim4†Shamsul Azhar Shah5†
- 1Faculty of Engineering and Built Environment, Universiti Kebangsaan Malaysia, Bangi, Malaysia
- 2Institute Islam Hadhari, Universiti Kebangsaan Malaysia, Bangi, Malaysia
- 3Institute for Environment and Development, Universiti Kebangsaan Malaysia, Bangi, Malaysia
- 4UKM Medical Centre, Hospital Canselor Tuanku Muhriz, Cheras, Malaysia
- 5Faculty of Medicine, UKM Medical Centre, Cheras, Malaysia
At present, COVID-19 is spreading widely around the world. It causes many health problems, namely, respiratory failure and acute respiratory distress syndrome. Wearable devices have gained popularity by allowing remote COVID-19 detection, contact tracing, and monitoring. In this study, the correlation of photoplethysmogram (PPG) morphology between patients with COVID-19 infection and healthy subjects was investigated. Then, machine learning was used to classify the extracted features between 43 cases and 43 control subjects. The PPG data were collected from 86 subjects based on inclusion and exclusion criteria. The systolic-onset amplitude was 3.72% higher for the case group. However, the time interval of systolic-systolic was 7.69% shorter in the case than in control subjects. In addition, 12 out of 20 features exhibited a significant difference. The top three features included dicrotic-systolic time interval, onset-dicrotic amplitude, and systolic-onset time interval. Nine features extracted by heatmap based on the correlation matrix were fed to discriminant analysis, k-nearest neighbor, decision tree, support vector machine, and artificial neural network (ANN). The ANN showed the best performance with 95.45% accuracy, 100% sensitivity, and 90.91% specificity by using six input features. In this study, a COVID-19 prediction model was developed using multiple PPG features extracted using a low-cost pulse oximeter.
Introduction
The most recent threat to global health is the ongoing outbreak of the respiratory disease since 2019, namely, Coronavirus disease 2019 (COVID-19), which originates from the initial cases reported in Wuhan, China (1–3). This novel disease is the seventh member of the family of coronaviruses that can infect humans (4, 5). Patients with COVID-19-infection typically exhibit symptoms such as fever, dry cough, and shortness of breath. Severe COVID-19 infection could progress to pneumonia, respiratory failure, and acute respiratory distress syndrome (6, 7). The highly contagious nature and unavailability of a specific cure for COVID-19 infection have led to various detection methods over the past 3 years.
Apart from reverse transcription-PCR (RT-PCR) confirmation, researchers have utilized X-ray and CT imaging methods for COVID-19 screening or diagnostic purposes. To date, many researchers have developed automated X-ray imaging to detect pneumonia, distinguish it from non-COVID-19 pneumonia, and predict its severity and progression (8–12). Automated CT imaging has been studied to detect not only lesions but also pneumonia. It recognizes pneumonia symptoms and distinguishes it from influenza-A viral pneumonia and healthy patient (13–16).
The reading of vital signs, such as oxygen saturation (SpO2), heart rate (HR), blood pressure, body temperature, respiration rate (RR), and glucose concentration, as an initial diagnostic measure is vital in identifying medical issues (17–19). A Wi-COVID, a home-based Wi-Fi monitoring, has been developed to monitor the RR of patients at home. Although it allows real-time monitoring, the application was limited to home environment setting only (20). In another research, a deep learning-Raspberry Pi integration was based on cough detection of a patient with COVID-19. However, this study only displayed the contact tracing solution as an extension to conventional presence detection and person identification systems. It does not help recognize the COVID-19 cough immediately from a potentially infected person (21). A contact tracing app with Bluetooth low-energy compatible devices has been evaluated for COVID-19 proximity detection by considering the signal strength caused by the human body and other factors. Nonetheless, received signal strength measurements are easily influenced, i.e., they fluctuate substantially depending on the absorption by the human body, relative handset orientation, and radio signal absorption or reflection in buildings and trains (22).
Wearable devices have gained popularity as they allow remote COVID-19 detection, contact tracing, and monitoring, for example, home, medical ambulance, ambulatory, emergency, workplace, and hospital (18). An IoT-based sensor to identify and monitor isolated asymptotic patients has been reported. However, the proposed system lacks clinical data for comparison using actual COVID-19 samples (23). A headset has been used in combination with a mask, such as a thermistor being embedded in the earphone, whereas an HR sensor equipped with the ear clip has been devised. Even though the principle was based on a simple and low-cost component, the mask is no longer mandatory in public following the implementation of the vaccination program, and long-term use could cause skin problems such as mask acne or maskne (24, 25). The smart helmet based on the thermal imaging system for real-time monitoring of body temperature and global positioning system via face recognition and mobile phones has been developed. As fever is one of the common COVID-19 symptoms, other viral infections can also exhibit high body temperature and are hardly distinguishable (26, 27).
Photoplethysmogram (PPG), has been utilized widely because of its non-invasiveness, simplicity, and affordability (28, 29). This technique is advantageous in measuring blood volume changes per pulse optically at the skin surface (30). The optical measurement comprises red and infrared lights as a light source and a photodetector, which mechanically indicates the heart activity (31, 32). Therefore, as a non-invasive and convenient technique, PPG can play a significant role in health monitoring systems to continuously provide various health parameters such as HR, RR, and SpO2 (33). In the case of COVID-19, the use of PPG is paramount in reducing widespread infection during health monitoring of patients by promoting lesser skin contact and abolishing the need to collect their bodily fluids invasively from time to time for checking progress. Currently, fingertip pulse oximeters are widely used by medical practitioners to measure SpO2 in patients with COVID-19 owing to their portability and inexpensiveness (34). Moreover, pulse oximeters are easily accessible with no hassle in designing a new device or further addition of an extra layer to enable detection.
People doing COVID-19 screening at hospitals are also at risk of being exposed to the virus, especially when there is a new strain outbreak which usually causes overcrowding of hospitals. Nevertheless, the commercially available self-diagnostic kits require specialized collection tubes that are non-reusable and expensive, which can be burdensome in the long run. Therefore, there is a need for accurate, rapid, portable, reusable, and easy-to-administer diagnostic tools to help communities manage local outbreaks and assess the spread of disease. In this study, the correlation of PPG morphology between patients with COVID-19-positive and negative was investigated. The PPG signals were pre-processed using a Fourier transform technique and significantly extracted features were fed to machine learning algorithms for COVID-19 classification purposes.
Methodology
PPG Data Acquisition
For the case group, the inclusion criteria were as follows: RT-PCR-positive subjects, categories 3 and 4 of infection, admitted to a ward, and aged between 18 and 65 years old. Meanwhile, the inclusion criteria for the control group were as follows: RT-PCR-negative subjects with ages ranging from 18 to 65 years old. For both groups, the exclusion criteria were as follows: pregnant, smoking, and having cardiovascular-related diseases.
This study used a case-control design whereby only a one-time measurement for each sample was performed. The subjects were recruited until the number shown in the sample size calculation was achieved. A simple way to determine the sample size is by referring to a nomogram where standardized difference and power calculation indicate the sample size (35). The system aimed to achieve at least 95% sensitivity (SN) with a CI (W) of 0.15. The COVID-19 prevalence among the Malaysian population by January 31st, 2022, is 9.4% (P), which was based on the calculation of 3,042,780 infected patients. As shown in Equations (1), (2), the estimated total number of samples was 86; thus, 43 subjects were involved in each case and control group, respectively.
Where:
TP = true positive
FN = false negative
Z = standard score
W = confidence interval
P = prevalence
Figure 1 shows the methodology for developing a COVID-19 prediction model by utilizing PPG. Before PPG signal measurement, 43 case subjects were in a supine position where they lay down horizontally with the face and torso facing up in a relaxed condition. By contrast, the 43 control subjects were in a sitting position and had quiet manners. All data were collected from the index finger of the right hand during a 10-min resting period (Figure 2). Data collection was performed using a pulse oximeter (CMS50D+, Contec, China) at a sampling frequency of 100 Hz. A trained medical officer recorded data collection from case samples by pushing the start button on the pulse oximeter and laptop after placing the pulse oximeter on the right index finger. The same method was also used for 43 healthy samples of the control group, where data collection was performed outside of Hospital Canselor Tuanku Muhriz, Universiti Kebangsaan Malaysia (HCTM, UKM). All researchers involved wore a PPE set during data collection. A thorough sanitization using a pulse oximeter and laptop was performed after each collection.
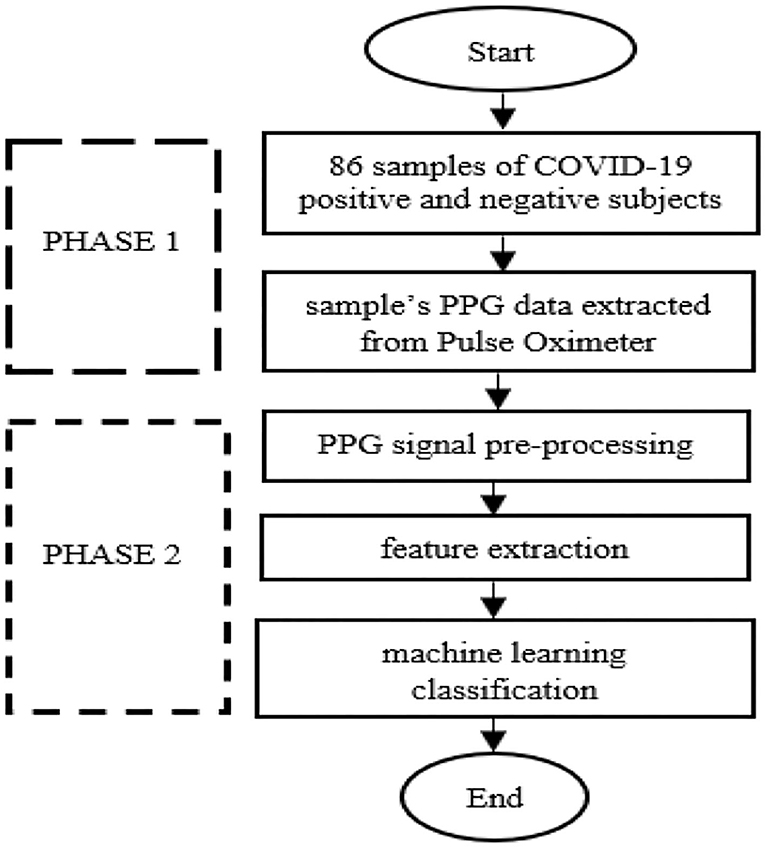
Figure 1. Methodology in developing COVID-19 prediction model by utilizing photoplethysmogram.
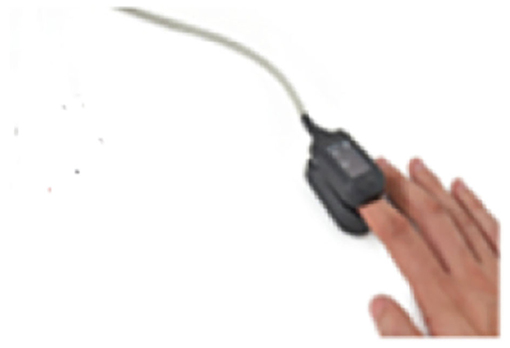
Figure 2. PPG data taken from the index finger of the right hand during a 10-min resting period.
Pre-processing and Signal Quality Indexing
Photoplethysmogram signal pre-processing algorithm consists of baseline and high-frequency removal and signal quality indexing (SQI). All PPG data were processed offline in MATLAB. In this step, a fast Fourier transform technique was used as a band-pass filter with a cut-off frequency of 0.5–10.0 Hz. Based on the collected PPG signals, a frequency above 10 Hz was considered high-frequency noise, and that below 0.5 Hz was attributed to baseline wander. Amplitude offset was found using filtering. Auto-offsetting was used to bring back any y-axis below zero value to a positive value to address this problem. It was performed by offsetting the signal by the difference between zero-amplitude and the prominent negative value.
Then, the filtered PPG signal underwent SQI in determining reliable signals. This step is crucial because only a high-quality signal is processed for the next phase. This type of signal is referred to as a stable signal within a period of time, in which the three conditions proposed by (36) are achieved as follows: (1) the extrapolated 10-s PPG signal must be between 40 and 180 bpm; (2) the PPG pulse-peak gap must not exceed 3 s to avoid missing more than one beat; and (3) the ratio of the maximum and minimum beat-beat interval within a sample must be less than 2.2. Figure 3 shows poor and good-quality PPG signals after SQI, as illustrated in red and blue colors, respectively.
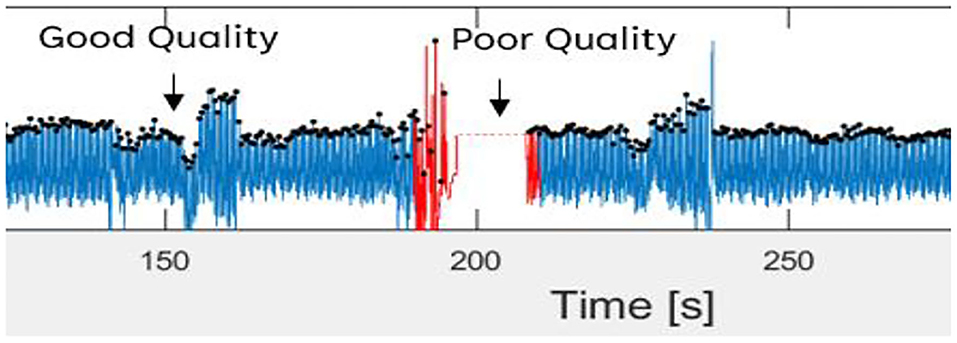
Figure 3. Good and poor quality of PPG signal as defined in blue and red color signal, respectively.
Feature Extraction
Delineator (37) and bp_annotate (38) algorithms were applied to detect the fiducial points in the PPG signals. These points include pulse onset “o,” systolic peak “s,” dicrotic notch “n,” and diastolic peak “d” (Figure 4). Both algorithms were compared manually in detecting fiducial points toward our PPG data. The delineator algorithm accurately detects the o and s, and bp annotate is good at detecting the peaks of n and d. The determination of pulse onset related to the zero-crossing point before maximum inflection and the s peak was defined as the zero-crossing point after inflection (37). Table 1 shows the features used in the proposed method. o2s represents onset-systolic, and this nomenclature applies to all other fiducial points. hr expresses the amplitude, and wt refers to the time interval measured in seconds.
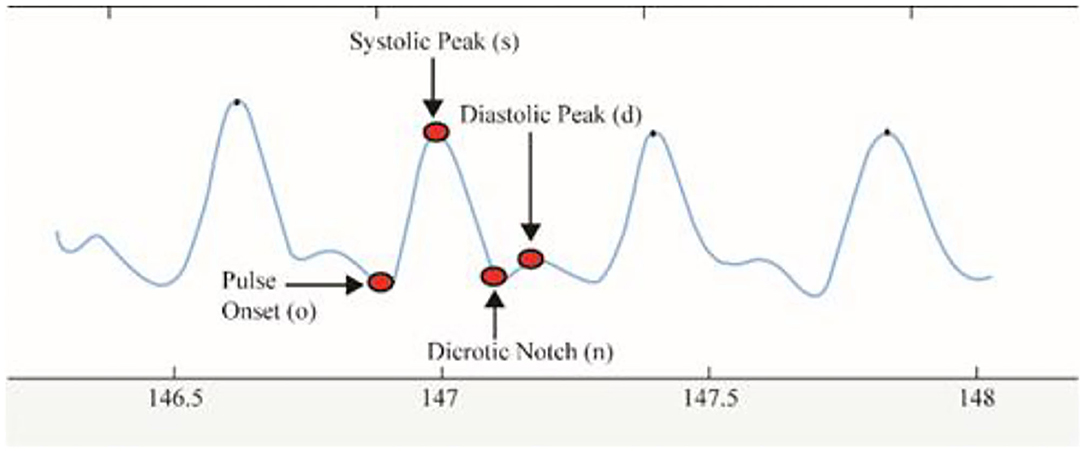
Figure 4. PPG signal showing all the fiducial points.
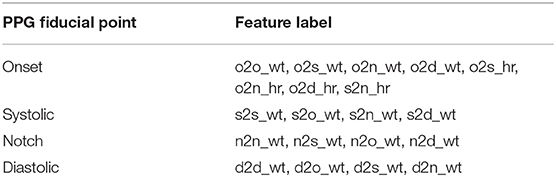
Table 1. PPG fiducial points and the features.
Statistical Analysis
A total of 20 features were obtained from PPG. Descriptive statistics in ranking the features based on the P value was applied by analyzing the mean values from both case and control data. The normality of the distribution was assessed using the Kurtosis and Skewness tests by combining case and control groups for each feature. The value of asymmetry, that is, Skewness and Kurtosis between −2 and +2, was considered acceptable to prove normal univariate distribution (39). Non-normally distributed features underwent Mann–Whitney U or Wilcoxon rank-sum test by using MATLAB to find the significant difference between patients with COVID-19-positive and negative, by comparing the median between the two groups. An independent t-test was also performed for normally distributed features using MATLAB where means were compared between the two groups. The features were then sorted by the lowest to the highest P values with a CI of 95%. This step enhances the accuracy rate of the classifiers (40). Significant features (P < 0.05) were used as inputs for ML classification.
Features with a P value <0.05 were evaluated using a correlation matrix for feature selection. Similarities among features of each group were determined using the Pearson correlation co-efficient, and r was calculated using Equation (3). The r value shows the correlation Co-efficient between two variables, where a value near 0 indicates no correlation, whereas a value near 1 or −1 indicates a strong correlation, positively or negatively, between the two variables. If two features have high correlation strength with absolute correlation Co-efficient, then |r| > 0.8; both features share similar information. This result could increase the complexity of ML training and reduce its performance. Thus, only the features with high correlation strength were selected for analysis.
Where:
x = first feature variables
y = second feature variables or group variables
= mean of feature x
ŷ = mean of feature y or mean of group y
N = number of samples
Machine Learning
The final phase of the proposed method aimed to design an effective decision boundary to classify two groups of case and control. Supervised ML techniques such as discriminant analysis (DA), k-nearest neighbor (KNN), decision tree (DT), support vector machine (SVM), and artificial neural network (ANN) were used in this study because they are the commonly used classifiers for biomedical signal analysis (41, 42).
Discriminant analysis (DA) is commonly selected as the first classifier because it is fast and easy to interpret. Linear and quadratic types of DA were used in this study. KNN is another simple and early classification algorithm (43). The algorithm counts the nearest neighbors (k), and classification is performed in a “vote” form. The k value was set from 1 to 100 because different k could produce different classification results. Euclidean distance measurement was used. Meanwhile, DT is a notable algorithm where decision logics are performed based on the outcomes in a tree-like structure, from the beginning nodes (root) down to the leaf node. Gini's diversity index was used in this study, and the split number was set from 1 to 100.
Apart from DA, KNN, and DT, SVM can supervise classification problems because of its generalization capability (44). SVM optimizes the decision boundary, that is, hyperplane, to obtain a significant separating margin in a higher feature dimension. In this study, SVM with four different kernel functions was tested with fixed hyperplane parameters. The selected kernels include linear and radial basis functions, and third and fourth-order polynomial kernels. On the contrary, ANN is well known for pattern recognition and classification. Three layers of a feed-forward multilayer perceptron network were constructed with different hidden nodes at each hidden layer. The Levenberg–Marquardt training algorithm was applied during training using “log-sigmoid” and “purelin” activation functions.
These ML models were trained with 64 train data of around 75% of total data, and the other 22 were used as test data. The data were randomly divided and stratified into groups. Features obtained from correlation analysis with P < 0.05 were selected as the input for the ML model. Features were cumulatively fed one by one starting with the least P value. The target was set in binary of “0” and “1” for the control and case groups, respectively. The training was validated using fivefold cross-validation, where a subfold of 13 from the 64-train data was used to validate the model. The performance of each model was measured based on mean squared error (MSE), specificity (SP), SN, and accuracy (ACC). A comparison of the suitable ML model on each technique was performed using receiver operating characteristic curves (ROC), where the false positive rate (FPR) and true positive rate (TPR) of the trained model were recorded with a discriminant threshold of 0–1. The area under the curve of the ROC was compared, where an area under the curve (AUC) value closer to 1 indicated a better predictor model.
The performance evaluators are shown in Figure 5 where true positive (TP) = number of positive COVID-19 was accurately detected as the case group, true negative (TN) = number of negative COVID-19 as the control group, false negative (FN) = number of positive COVID-19 as the control group, and false positive (FP) = number of negative COVID-19 as the case group. This study was conducted in accordance with the Declaration of Helsinki, in which the protocol was approved by the Research and Ethics Committee of the HCTM with a registration number of UKM PPI/111/8/JEP-2020-828.
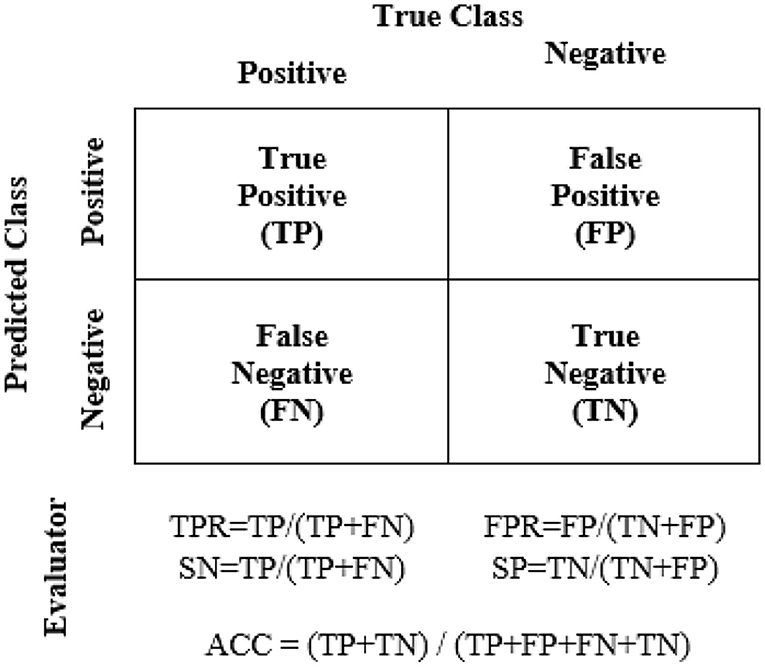
Figure 5. Performance evaluators for ML-trained models.
Result and Discussion
PPG Data Acquisition
A total of 43 case subjects from HCTM and 43 control subjects from the public volunteered for data collection. The demographic information of 86 subjects was categorized (Table 2). The study population involved 86 subjects (46 men and 40 women), with two different groups of subjects: case and control. All volunteers submitted their informed consent before data collection. A questionnaire form consisting of the health status of the subjects was provided.
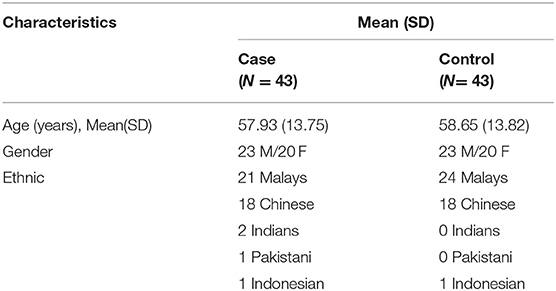
Table 2. Descriptive characteristics of the subjects (N = 86).
In the case group, two stages of patients with COVID-19 were involved, stages 3 and 4. A total of 72% of subjects had comorbidities, such as diabetes mellitus, hypertension, and chronic kidney disease. Most of the case subjects with COVID-19 had comorbidities. The data of the case group were recorded from 23 male and 20 female patients of different ethnic groups consisting of 21 Malays, 18 Chinese, two Indians, one Pakistani, and one Indonesian with ages ranging from 29 to 89 years old with a mean age of 57.93 (SD = 13.75).
Meanwhile, the control group data were recorded from 23 men and 20 women of different ethnic groups, namely, 24 Malays, 18 Chinese, and one Indonesian, aged 29–87 years old with a mean age of 58.65 (SD = 13.82). Filtering from 86 sets of high-quality PPG signals resulted in 20 extracted features with 10-min recording per subject. These extracted features were based on four fiducial points mentioned in the Methodology section.
Pre-processing and Signal Quality Indexing
Figure 6 shows the comparison of the PPG signal between case and control subjects. For the PPG signal of case subjects as shown in Figure 6A, the inflection points of o, s, n, and d peaks are smaller. By contrast, for control subjects (Figure 6B), the inflection points of o, s, n, and d signals were normal, clear, and significant. The s2o_hr is 3.72% higher in case subjects than in control subjects. The time interval of s2s_wt was 7.69% shorter in case subjects than in control subjects.
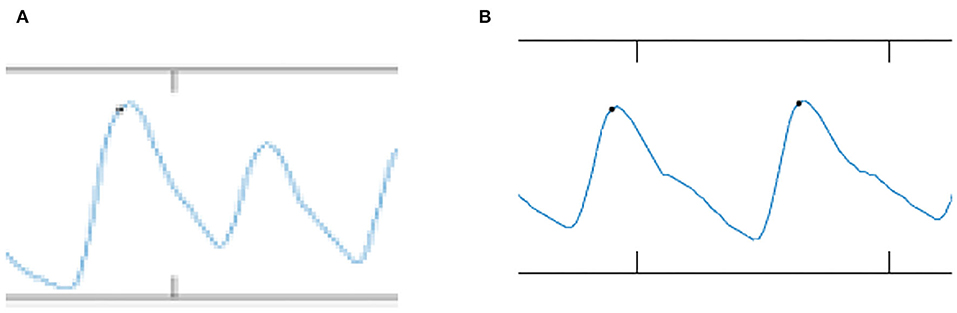
Figure 6. Comparison of PPG signal between (A) case and (B) control group.
Feature Extraction
These 20 features were extracted by using MATLAB and recorded in Table 3, where significant P-values are written in bold. As shown in Table 3, 12 out of 20 features were identified with a significant P value < 0.05 and were fed as inputs for the ML algorithm. The features with the highest P-value included d2s_wt, o2n_hr, and s2o_wt. The features were fed to machine learning models, namely, DA, KNN, DT, SVM, and ANN.
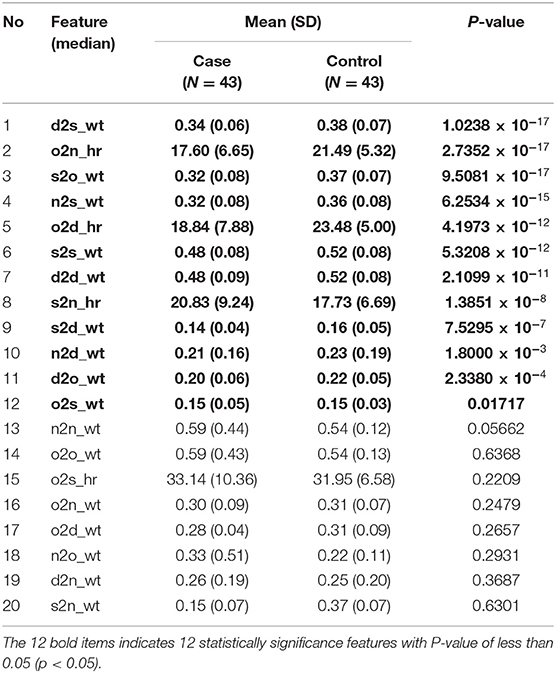
Table 3. Feature extraction of case and control ranked based on the P value.
Statistical Analysis
Normality tests such as Kurtosis and Skewness are shown in Table 4 with normally distributed features written in bold.
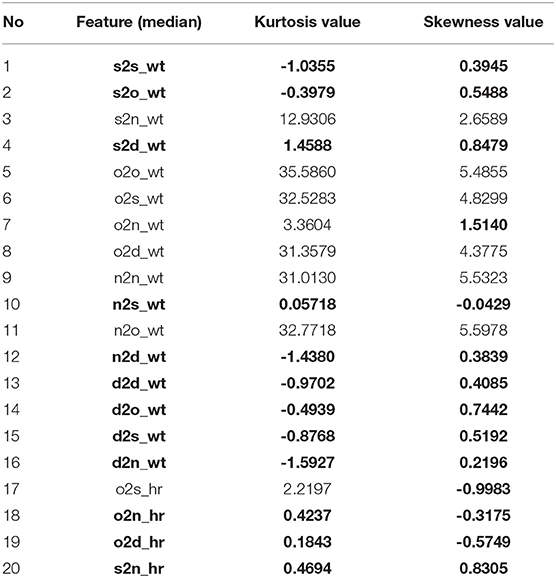
Table 4. Normality tests of kurtosis and skewness.
Figure 7 shows the correlation matrix among features and classification groups, as illustrated in heatmap format. Dark red, dark blue, and lighter colors indicate strongly positive, strongly negative, and weak or no correlation among the observed variables, for example, feature or group. In this figure, median-s2s-wt, median-d2d-wt, and median-d2o-wt features have a strong correlation with median-d2s-wt. Hence, only median-d2s-wt was selected because it has the highest correlation strength with the classification group.
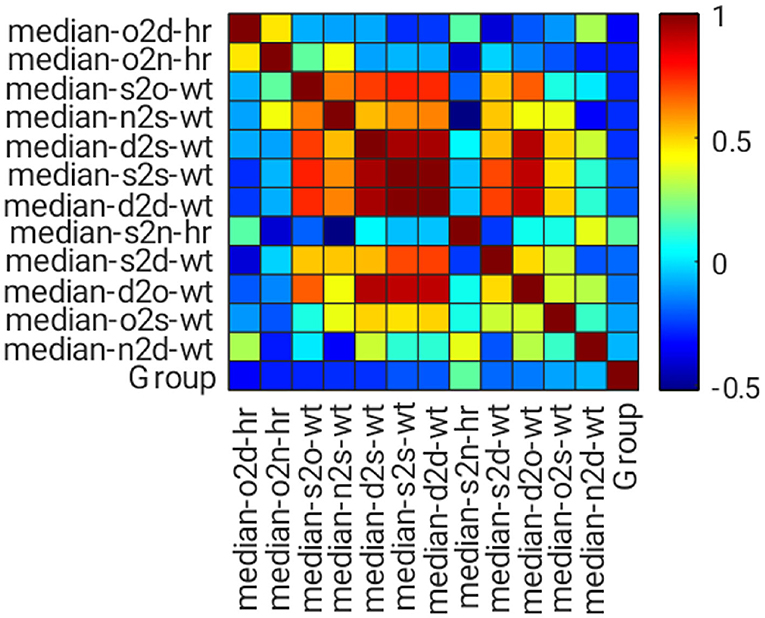
Figure 7. Heatmap of the correlation matrix for feature selection.
A total of nine features were short-listed (Figure 8), with the highest correlation strength found in the classification group, which was sorted from the bottom bar. The top three features include o2d_hr, o2n_hr, and s2o_wt. These features have a low correlation. However, their correlation with the classification group is generally weak, where at least five of them have |r| > 0.2, although they are statistically significant (P < 0.05). Thus, ML is genuinely needed.
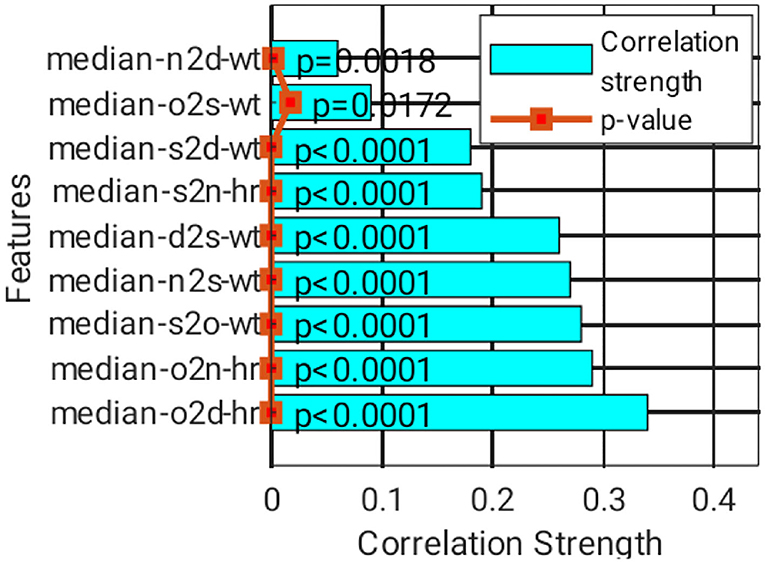
Figure 8. Correlation strength and P value of the selected features.
Machine Learning
Classification of ACC for the trained model of each classifier with a number of features is illustrated in Figure 9. In general, ACC increased as more features were added, at least up to cumulative fourth features. KNN, DT, and ANN can classify negative and positive classes of COVID-19 with the highest ACC of 95.45%. SN of ANN and DT was 100%, whereas KNN achieved 100% SP. A detailed comparison of the best model performance for each ML is listed in Table 5.
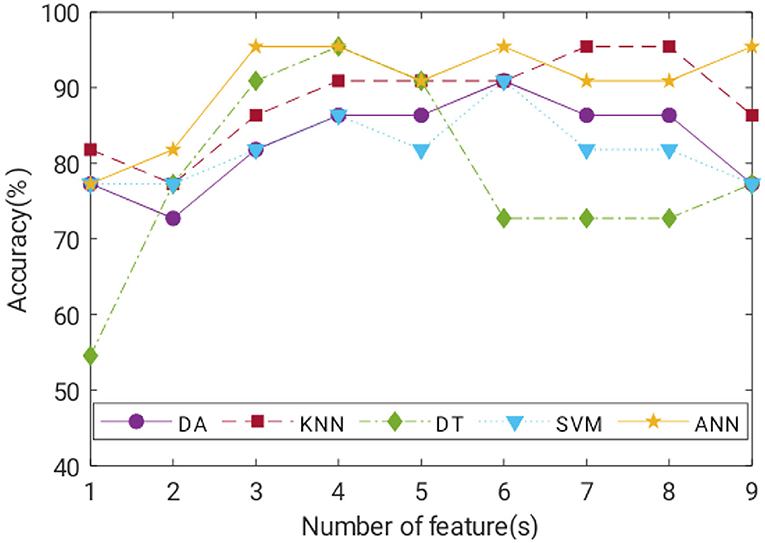
Figure 9. Accuracy of the best-trained model for all ML with increasing input features.
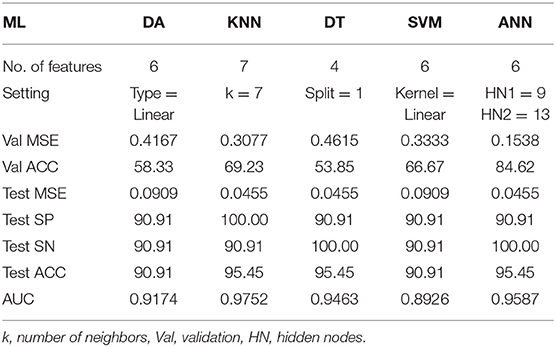
Table 5. Performance comparison of the best-trained model for all ML.
Satisfactory COVID-19 prediction performance was achieved using DA and SVM, where both classifiers produced 90.91% for ACC, SN, and SP using six input features. DT performed well on the test data but not on the validation data. It has the lowest validation ACC and the highest validation MSE compared with other ML models. ANN performance was excellent, where it used six features, and it had the lowest MSE, highest validation ACC, and comparable AUC to the KNN model (Figure 10). According to Figure 9, ANN performed relatively the best in six different combination features. Thus, ANN is selected as the best predictor model for COVID-19 classification.
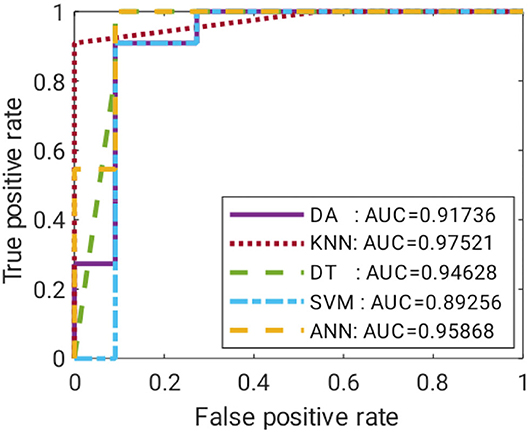
Figure 10. ROC curves for the best-trained model of all ML.
The prediction of COVID-19 infection through PPG morphology is limited by solely using the pulse oximeter as the data recording device. Using the proposed algorithms could further develop a mobile application connected to the pulse oximeters to function as a primary diagnostic tool where the test data can be stored in a cloud for further analysis.
Conclusion
This work pioneered the study of the relationship between COVID-19 and PPG features. ML algorithms of DA, KNN, DT, SVM, and ANN were applied for COVID-19 prediction, in which the ANN model performed remarkably to achieve 95.45% ACC, 100% SN, and 90.91% SP, using six significant features. A COVID-19 prediction method was developed using multiple PPG features extracted from a low-cost pulse oximeter.
Data Availability Statement
The original contributions presented in the study are included in the article/supplementary files, further inquiries can be directed to the corresponding author/s.
Ethics Statement
The studies involving human participants were reviewed and approved by Jawatankuasa Etika Penyelidikan, Universiti Kebangsaan Malaysia. The patients/participants provided their written informed consent to participate in this study.
Author Contributions
All authors listed have made a substantial, direct, and intellectual contribution to the work and approved it for publication.
Funding
This work was supported in part by the Institute Islam Hadhari under grant of Kursi Syeikh Abdullah Fahim RH-2020-007.
Conflict of Interest
The authors declare that the research was conducted in the absence of any commercial or financial relationships that could be construed as a potential conflict of interest.
Publisher's Note
All claims expressed in this article are solely those of the authors and do not necessarily represent those of their affiliated organizations, or those of the publisher, the editors and the reviewers. Any product that may be evaluated in this article, or claim that may be made by its manufacturer, is not guaranteed or endorsed by the publisher.
References
1. Lin WL, Hsieh CH, Chen TS, Chen J, Lee JL, Chen WC. “Apply IOT technology to practice a pandemic prevention body temperature measurement system: a case study of response measures for COVID-19.” Int J Distrib Sens Netw. (2021) 5:15501477211018126. doi: 10.1177/15501477211018126
2. Baskaran K, Baskaran P, Rajaram V, Kumaratharan N. “IoT based COVID preventive system for work environment.” In: 2020 Fourth International Conference on I-SMAC (IoT in Social, Mobile, Analytics and Cloud)(I-SMAC), Palladam; New York, NY: IEEE. (2020). p. 65–71. doi: 10.1109/I-SMAC49090.2020.9243471
3. Wu JT, Leung K, Leung GM. “Nowcasting and forecasting the potential domestic and international spread of the 2019-nCoV outbreak originating in Wuhan, China: a modeling study.” Lancet. (2020) 395:689–97. doi: 10.1016/S0140-6736(20)30260-9
4. Li Q, Guan X, Wu P, Wang X, Zhou L, Tong Y, et al. “Early transmission dynamics in Wuhan, China, of novel coronavirus-infected pneumonia.” N Engl J Med. (2020) 382:1199–207. doi: 10.1056/NEJMoa2001316
5. Zhu N, Zhang D, Wang W, Li X, Yang B, Song J, et al. “A novel coronavirus from patients with pneumonia in china, 2019.” N Engl J Med. (2020) 382:727–33. doi: 10.1056/NEJMoa2001017
6. Yang JW, Yang L, Luo RG, Xu JF. “Corticosteroid administration for viral pneumonia: COVID-19 and beyond.” Clin Microbiol Infect. (2020) 26:1171–7. doi: 10.1016/j.cmi.2020.06.020
7. Yang HJ, Zhang YM, Yang M, Huang X. Predictors of mortality for patients with COVID-19 pneumonia caused by SARS-CoV-2. Eur Respir J. (2020) 56:2–4. doi: 10.1183/13993003.02961-2020
8. Apostolopoulos ID, Mpesiana TA. “Covid-19: automatic detection from x-ray images utilizing transfer learning with convolutional neural networks.” Phys Eng Sci Med. (2020) 43:635–40. doi: 10.1007/s13246-020-00865-4
9. Gozes O, Frid-Adar M, Greenspan H, Browning PD, Zhang H, Ji W, et al. Rapid AI development cycle for the coronavirus (COVID-19) pandemic: initial results for automated detection & patient monitoring using deep learning ct image analysis. arXiv [Preprint]. (2020). arXiv: 2003.05037. doi: 10.48550/ARXIV.2003.05037
10. Islam MZ, Islam MM, Asraf A. “A combined deep CNN-LSTM network for the detection of novel coronavirus (COVID-19) using X-ray images.” Inform Med Unlocked. (2020) 20:100412. doi: 10.1016/j.imu.2020.100412
11. Loey M, Smarandache F, Khalifa MNE. “Within the lack of chest COVID-19 X-ray dataset: a novel detection model based on GAN and deep transfer learning.” Symmetry. (2020) 12:651. doi: 10.3390/sym12040651
12. Salman FM, Abu-Naser SS, Alajrami E, Abu-Nasser BS, Alashqar BD. “Covid-19 detection using artificial intelligence.” IJAER. (2020) 4:18–25.
13. Hassan A, Shahin I, Alsabek MB. “Covid-19 detection system using recurrent neural networks.” In: 2020 International conference on communications, computing, cybersecurity, and informatics (CCCI), Sharjah; New York, NY: IEEE. (2020). p. 1–5. doi: 10.1109/CCCI49893.2020.9256562
14. Jin C, Chen W, Cao Y, Xu Z, Tan Z, Zhang X, et al. “Development and evaluation of an artificial intelligence system for COVID-19 diagnosis.” Nat Commun. (2020) 11:1–14. doi: 10.1038/s41467-020-18685-1
15. Wang X, Deng X, Fu Q, Zhou Q, Feng J, Ma H, et al. “A weakly-supervised framework for COVID-19 classification and lesion localization from chest CT.” IEEE Trans Med Imaging. (2020) 39:2615–25. doi: 10.1109/TMI.2020.2995965
16. Xu X, Jiang X, Ma C, Du P, Li X, Lv S, et al. “A deep learning system to screen novel coronavirus disease 2019 pneumonia.” Engineering. (2020) 6:1122–9. doi: 10.1016/j.eng.2020.04.010
17. Kesavadev J, Misra A, Saboo B, Aravind SR, Hussain A, Czupryniak L, et al. “Blood glucose levels should be considered as a new vital sign indicative of prognosis during hospitalization.” Diabetes Metab Syndr: Clin Res Rev. (2021) 15:221–7. doi: 10.1016/j.dsx.2020.12.032
18. Massaroni C, Nicolò A, Lo Presti D, Sacchetti M, Silvestri S, Schena E. “Contact-based methods for measuring respiratory rate.” Sensors. (2019) 19:908. doi: 10.3390/s19040908
19. Hasan MK, Ghazal TM, Alkhalifah A, Bakar KAA, Omidvar A, Nafi NS, et al. “Fischer linear discrimination and quadratic discrimination analysis–based data mining technique for internet of things framework for Healthcare.” Public Health Front. (2021) 9:737149. doi: 10.3389/fpubh.2021.737149
20. Li F, Valero M, Shahriar H, Khan RA, Ahamed SI. “Wi-COVID: a COVID-19 symptom detection and patient monitoring framework using Wi-Fi.” Smart Health. (2021) 19:100147. doi: 10.1016/j.smhl.2020.100147
21. Petrović N, Kocić D. “IoT for COVID-19 indoor spread prevention: cough detection, air quality control and contact tracing.” In: 2021 IEEE 32nd International Conference on Microelectronics (MIEL), Nis; New York NY: IEEE. (2021). p. 297–300. doi: 10.1109/MIEL52794.2021.9569099
22. Leith DJ, Farrell S. “Coronavirus contact tracing: evaluating the potential of using bluetooth received signal strength for proximity detection.” ACM Sigcomm Comp Com. (2020) 50:66–74. doi: 10.1145/3431832.3431840
23. Kumar NVR, Arun M, Baraneetharan E, Prakash JSJ, Kanchana A, Prabu S. Detection and monitoring of the asymptotic COVID-19 patients using IoT devices and sensors. Int J Pervasive Comput Commun. (2020) 1–12. doi: 10.1108/IJPCC-08-2020-0107. [Epub ahead of print].
24. Stojanović R, Škraba A, Lutovac B. “A headset like wearable device to track COVID-19 symptoms.” In: 2020 9th Mediterranean Conference on Embedded Computing (MECO), Budva; New York, NY: IEEE. (2020). p. 1–4. doi: 10.1109/MECO49872.2020.9134211
25. Teo WL. “Diagnostic and management considerations for “Maskne” in the era of COVID-19. J Am Acad Dermatol.” (2021) 84:520–1. doi: 10.1016/j.jaad.2020.09.063
26. Mohammed MN, Syamsudin H, Al-Zubaidi S, Sairah AK, Yusuf E. “Novel COVID-19 detection and diagnosis system using IOT based smart helmet.” Int J Psychosoc Rehabilitation. (2020) 24:2296–303. doi: 10.37200/IJPR/V24I7/PR270221
27. Haussner W, DeRosa AP, Haussner D, Tran J, Torres-Lavoro J, Kamler J, et al. “COVID-19 associated myocarditis: a systematic review.” Am J Emerg Med. (2022) 51:150–5. doi: 10.1016/j.ajem.2021.10.001
28. Hasan MA, Thiyab MN, Keream SS, Salaman UH. “An evaluation of the accelerometer output as a motion artifact signal during photoplethysmograph signal processing control.” Indones J Electr Eng Comput Sci. (2020) 20:125–31. doi: 10.11591/ijeecs.v20.i1.pp125-131
29. Praveen BDS, Sandeep DVN, Raghavendra IVV, Yuvaraj M, Sarath S. “Non-invasive machine learning approach for classifying blood pressure using PPG signals in COVID situation.” In: 2021 12th International Conference on Computing Communication and Networking Technologies (ICCCNT), Kharagpur; New York, NY: IEEE. (2021). p. 1–7.
30. Alemohammad MM, Stroud JR, Bosworth BT, Foster MA. “High-speed all-optical Haar wavelet transform for real-time image compression.” Opt Express. (2017) 25:9802–11. doi: 10.1364/OE.25.009802
31. Castaneda D, Esparza A, Ghamari M, Soltanpur C, Nazeran H. “A review on wearable photoplethysmography sensors and their potential future applications in health care.” Int J Biosens Bioelectron. (2018) 4:195. doi: 10.15406/ijbsbe.2018.04.00125
32. Mousavi SS, Firouzmand M, Charmi M, Hemmati M, Moghadam M, Ghorbani Y. “Blood pressure estimation from appropriate and inappropriate PPG signals using a whole-based method.” Biomed Signal Process Control. (2019) 47:196–206. doi: 10.1016/j.bspc.2018.08.022
33. Biswas A, Roy MS, Gupta RR. “Motion artifact reduction from finger photoplethysmogram using discrete wavelet transform.” In: Bhattacharyya S, Mukherjee A, Bhaumik H, Das S, Yoshida K, editors. Recent Trends in Signal and Image Processing. Singapore: Springer (2019). p. 89–98. doi: 10.1007/978-981-10-8863-6_10
34. Quaresima V, Ferrari M. “COVID-19: EFFICACY of pre-hospital pulse oximetry for early detection of silent hypoxemia.” Crit Care. (2020) 24:1–2. doi: 10.1186/s13054-020-03185-x
35. Jones SR, Carley S, Harrison M. “An introduction to power and sample size estimation.” Emerg Med J. (2003) 20:453–8. doi: 10.1136/emj.20.5.453
36. Orphanidou C, Bonnici T, Charlton P, Clifton D, Vallance D, Tarassenko L. “Signal-quality indices for the electrocardiogram and photopelthysmogram: derivation and applications to wireless monitoring.” IEEE J Biomed Health Inform. (2014) 19:832–8. doi: 10.1109/JBHI.2014.2338351
37. Li BN, Dong MC, Vai MI. “On an automatic delineator for arterial blood pressure waveforms.” Biomed Signal Process Control. (2010) 5:76–81. doi: 10.1016/j.bspc.2009.06.002
38. Laurin A. “Implementation of a Feature Detection Algorithm for Arterial Blood Pressure” (2020). Available online at: https://mathworks.com/matlabcentral/fileexchange/60172-bp_annotate (accessed April 15, 2022).
39. George D, Mallery M. SPSS for Windows Step by Step: A Simple Guide and Reference, 17, 0. Update. 10th ed. Boston, MA: Pearson Allyn & Bacon (2010).
40. Yap BW, Sim CH. “Comparison of various types of normality tests.” J Stat Comput Simul. (2011). 81:2141–55. doi: 10.1080/00949655.2010.520163
41. Subasi A. “Biomedical signal analysis and its usage in healthcare.” In: Paul S, editors. Biomedical Engineering and its Applications in Healthcare. Singapore: Springer (2019). p. 423–52. doi: 10.1007/978-981-13-3705-5_18
42. Ghazal TM, Hasan MK, Alshurideh MT, Alzoubi HM, Ahmad M, Akbar SS, et al. “IoT for smart cities: machine learning approaches in smart healthcare—a review.” Future Internet. (2021) 13:218. doi: 10.3390/fi13080218
43. Uddin S, Khan A, Hossain ME, Moni MA. “Comparing different supervised machine learning algorithms for disease prediction.” BMC Med Inform Decis Mak. (2019) 19:1–16. doi: 10.1186/s12911-019-1004-8
Keywords: COVID-19, photoplethysmogram, machine learning, non-invasive, diagnostic, prediction
Citation: Nayan NA, Jie Yi C, Suboh MZ, Mazlan N-F, Periyasamy P, Abdul Rahim MYZ and Shah SA (2022) COVID-19 Prediction With Machine Learning Technique From Extracted Features of Photoplethysmogram Morphology. Front. Public Health 10:920849. doi: 10.3389/fpubh.2022.920849
Received: 15 April 2022; Accepted: 31 May 2022;
Published: 19 July 2022.
Edited by:
Rashid A. Saeed, Taif University, Saudi ArabiaReviewed by:
Yasuhiro Takahashi, Gifu University, JapanSaneera Hemantha Kulathilake, Rajarata University of Sri Lanka, Sri Lanka
Copyright © 2022 Nayan, Jie Yi, Suboh, Mazlan, Periyasamy, Abdul Rahim and Shah. This is an open-access article distributed under the terms of the Creative Commons Attribution License (CC BY). The use, distribution or reproduction in other forums is permitted, provided the original author(s) and the copyright owner(s) are credited and that the original publication in this journal is cited, in accordance with accepted academic practice. No use, distribution or reproduction is permitted which does not comply with these terms.
*Correspondence: Nazrul Anuar Nayan, bmF6cnVsQHVrbS5lZHUubXk=
†These authors have contributed equally to this work and share first authorship