 Natália Oliveira
 Daniela Silva Canella
- 1Postgraduate Program in Food, Nutrition and Health, Rio de Janeiro State University, Rio de Janeiro, Brazil
- 2Institute of Nutrition, Rio de Janeiro State University, Rio de Janeiro, Brazil
The consumption of ultra-processed beverages, including sugar-sweetened and artificially sweetened ones, is associated with several health problems, which is different considering minimally processed beverages. The objective of this study was to assess the trends in the volume of minimally and ultra-processed beverages purchased for consumption in Brazilian households and their relationship with the proportion of dietary energy derived from ultra-processed foods and beverages. Drawing on data from the nationwide 2002–03, 2008–09, and 2017–18 Household Budget Surveys, the daily volume of beverages purchased per capita (milligrams) was investigated. The minimally processed beverages purchased declined over the period [2002–2003: 156.5 ml (95%CI: 148.3–164.8); 2017–2018: 101.6 ml (95%CI: 98.1–105.1)] and ultra-processed beverages were stable [2002–03: 117.9 ml (95%CI: 108.1–127.7); 2017–18: 122.8 (95%CI: 111.2–134.4)]. The most purchased beverage in 2002–2003 was milk [: 154.7 ml (95%CI: 146.4–162.9)], while in 2017–2018 regular soft drinks were the most purchased [: 110.7 ml (95%CI: 99.2–122.2)]. There was a decrease in the purchase of whole and skimmed milk and an increase in the purchase of other ultra-processed beverages between the periods. With the increase in the proportion of ultra-processed foods and beverages in the diet, the volume of ultra-processed beverage purchases rose and minimally processed beverages declined. The monitoring of beverage consumption and the implementation of public policies, such as taxation on ultra-processed beverages, are essential to promote improvements in health and curbing non-communicable diseases.
Introduction
Beverage consumption, considering alcoholic or non-alcoholic and caloric or non-caloric ones, can be considered a topic of interest to public health due to their association with health outcomes. Among non-alcoholic beverages, there are minimally processed beverages, such as milk, water, and natural juices, and ultra-processed beverages, such as sugar- and artificially sweetened beverages (1). Sweetened beverages include sugar and artificially sweetened beverages (2). Sugar-sweetened beverages (SSB) are defined as all types of beverages that contain free sugars (e.g., carbonated soft drinks; non-carbonated drinks; artificial juices; liquid and powder concentrates; ready-to-drink tea; flavored dairy drinks, and others) (2, 3), while artificially sweetened beverages are those that use artificial sweeteners in their composition to replace sugar (4, 5).
Consumption of sweetened beverages, especially SSB, is associated with weight gain (6, 7), type 2 diabetes (8), high blood pressure (9), and obesity-related cancers (4, 10). Furthermore, evidence suggests that the consumption of artificially sweetened beverages is associated with cancers not related to obesity (11) since their (re)formulation tends to increase the use of food additives (5, 12), which in turn are related to intestinal dysbiosis, colitis, and metabolic syndrome (13, 14). This adverse relationship is not observed for minimally processed beverages, such as milk (1, 15).
SSB is one of the main sources of sugar in the Brazilian diet (16–18). In 2008–2009, the average energy share of added sugar was around 16%, a value that exceeds by almost 60% of the maximum consumption limit recommended by the World Health Organization (19). It is noteworthy that in 1987–1988, the fraction of household availability of sugar from soft drinks represented 5.6%, and in 2008–2009, it increased to 15.5% (18).
Although the proportion of energy in the diet derived from ultra-processed foods and beverages, henceforth called ultra-processed foods (UPF), has increased in Brazil and in 2017–2018, soft drinks represent one of the food items with the highest average daily consumption per capita (67.1 g/day) (20), as a whole, there has been a general decline in the rate of regular consumption (5 days/week or much) of sweetened beverages in the major Brazilian cities (21, 22). Typically, the energy of UPF is used to determine their dietary contribution and, consequently, diet/light beverages are overlooked in these analyses. However, studies have shown that artificially sweetened beverages are also associated with unfavorable health outcomes (11, 13, 14).
Sweetened beverage consumption in Brazil is subject to monitoring since a reduction in routine consumption is one of the targets defined in the national initiative Strategic Actions Plan for Tackling Chronic Non-Communicable Diseases 2021–2030 (23). Considering the trend of worsening diet quality observed in Brazil and the potential replacement in the kind of beverages consumed, the objective of the present study was to assess the trends in the volume of minimally and ultra-processed beverages purchased for consumption in Brazilian households during the periods 2002–2003 and 2017–2018, and their relationship with the proportion of dietary energy derived from UPF.
Materials and methods
The data used were drawn from the nationwide Household Budget Surveys (HBS) conducted by the Brazilian Institute of Geography and Statistics (IBGE) in 2002–2003, 2008–2009, and 2017–2018 with the Brazilian population. HBS has a representative sample of the Brazilian population and employs a complex clustered sampling procedure, involving geographic and socioeconomic stratification of all census tracts of the country, followed by random selection of tracts in the first stage and of households in the second stage. HBS assesses the structures of consumption, expenditures, income, and the variation in assets of families, offering a profile of the population's living conditions based on the analysis of household budgets. The total sample of households surveyed was 48,470 in 2002–2003, 55,970 in 2008–2009, and 57,920 in 2017–2018, distributed into 443, 550, and 575 sample strata, respectively, homogenous for socioeconomic status and geographic location.
Data collection from all surveys was carried out over 12 months, evenly distributed across strata, ensuring representativeness in the four trimesters of the year. These procedures are detailed in specific publications (20). All data are in the public domain and are available online on the IBGE website (https://www.ibge.gov.br/estatisticas/sociais/populacao/24786-pesquisa-de-orcamentos-familiares-2.html?=&t=microdados). Information contained in the database is confidential, excluding specific data about each family, such as individual identification, address, and telephone number.
Information on the purchases of food and beverage items for home consumption over a period of seven consecutive days was recorded daily by dwellers of the household or by the interviewer in a shared logbook of all purchases made. Due to the relatively short data collection period, sample strata were employed as the unit of study, providing a more accurate picture of annual food purchases. At the strata level, extreme differences between households are attenuated (considering, e.g., households that had no purchases during the 7 days of collection or those that made purchases for the entire month, behaviors characteristic of Brazilian families). Data referring to income and the number of dwellers in the households were also used to calculate the household per capita income.
The total amount of each food and beverage item purchased were converted to express daily grams or volume purchased per individual (grams or milliliters/per capita/day), after the exclusion of non-edible parts and the dilution of powdered beverages. All items were divided into four groups and subgroups of the NOVA classification system (1), with subsequent selection of subgroups of beverages (food group of interest in the present study). As these are acquisition data, natural juices were not evaluated because the fruit is usually acquired to make the juice.
Beverages were grouped into minimally processed beverages (whole milk, including fluid and diluted powdered; skimmed milk, including fluid and diluted powdered; and natural yogurts) and ultra-processed beverages [regular soft drinks; diet/light soft drinks; and other drinks (including dairy drinks without yogurt; regular artificial juices or teas; regular and diet/light soymilk powder; diet/light yogurts; diet/light milk-based drinks; and diet/light artificial juices and teas)].
The total daily per capita amount of each food and beverage item purchased was converted into energy (kcal), using the Brazilian Food Composition Table (TBCA) (24), and then the proportion of energy derived from the UPF group (including foods and beverages) was calculated.
Additionally, households were stratified according to the income level considering quintiles of per capita income and earning of at least the minimum wage, based on the values of January 2003 (R$ 240), 2009 (R$ 465), and 2018 (R$ 954).
Descriptive analyses were carried out through the means and respective 95% confidence intervals (95% CI) of volume (milliliters/per capita/day) of minimally processed and ultra-processed beverages for Brazil overall, and according to quintiles of income and earnings, the minimum wage for the three periods was surveyed (2002–2003; 2008–2009; and 2017–2018). Statistical significance was tested for the variations using linear regression models for the analysis of the temporal trend of estimates. Considering the relationship between food consumption and income (25, 26), based on linear regression models, the expected values (values predicted by the model) were calculated for the means adjusted by income (as a continuous variable). Therefore, means (obtained in the predicted model) and respective 95% CI of volume for all subgroups of minimally processed and ultra-processed beverages were described for the three periods surveyed. The same descriptive analyses were performed according to quartiles of the proportion of energy derived from UPF.
Based on the comparison of 95% CI, significant differences between the survey periods were evident. A lack of overlap between the intervals was assumed as a significant difference, adopting a significance level of 5%.
All analyses were carried out using the statistics package Stata/SE version 16.0 (Stata Corp., College Station, USA) on the survey module, which considers the effects of complex sampling and enables the extrapolation of results for the Brazilian population.
Results
The trend of minimally processed and ultra-processed beverages purchased and their relationship with income is presented in Table 1. The volume of minimally processed beverages purchased declined over the period (p-trend = 0.000), while ultra-processed beverages remained stable (p-trend = 0.553) (Table 1).
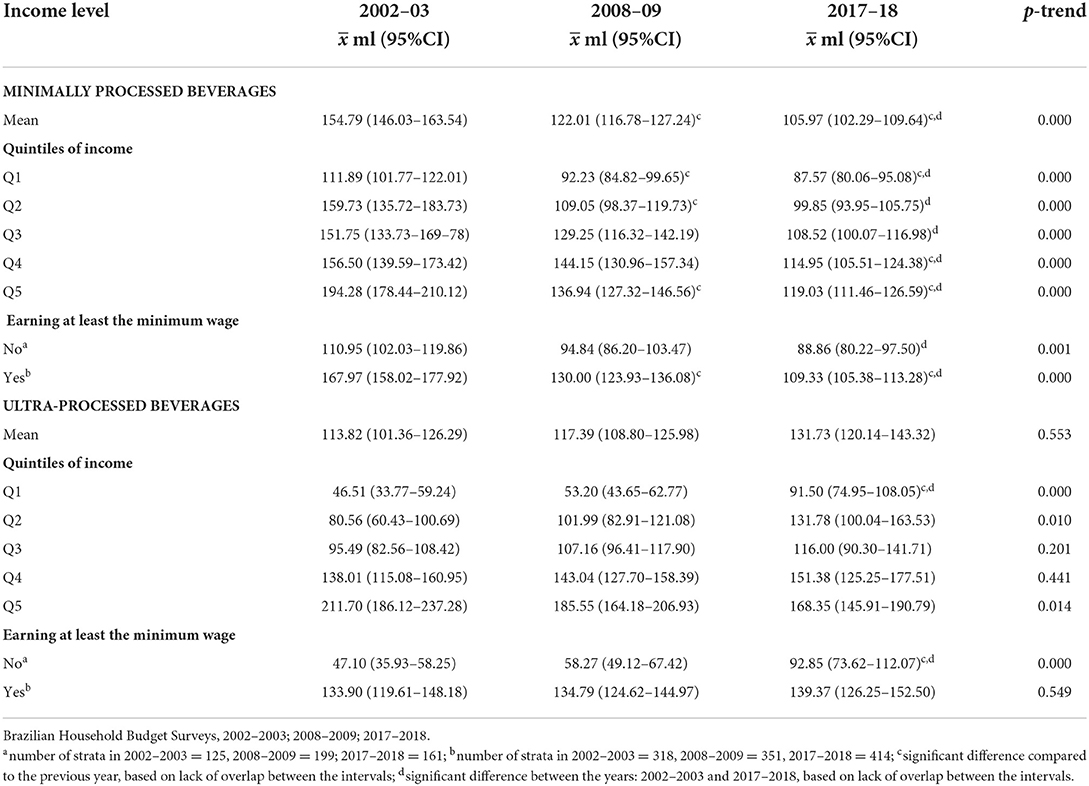
Table 1. Mean and 95% confidence interval of daily per capita purchase of minimally processed and ultra-processed beverages according to income level.
The acquisition of both minimally processed and ultra-processed beverages was influenced by income in all analyzed periods, but the intensity and even the direction of changes over the years were different among income groups. For minimally processed beverages, among households in the first quintile of income level and earning less than one minimum wage, the decrease was slighter than among those wealthier. Furthermore, for Q1, Q2, and Q3 income levels, the acquisition decreased between 2002–2003 and 2008–2009 and remained stable in 2017–2018, while for Q4 and Q5, the average was maintained between 2002–2003 and 2008–2009 and only decreased from 2008–2009 to 2017–2018. For ultra-processed beverages, despite the general stability, households in the first quintile of income level and earning less than one minimum wage almost doubled the acquisition over the years, with a stable volume between 2002–2003 and 2008–2009 and an increase from 2008–2009 to 2017–2018. On the other hand, households in the fifth quintile presented a significant decrease in the volume purchased (Table 1).
Predicted values presented the same trend for minimally processed beverages [2002–2003: 156.5 ml (95%CI: 148.3–164.8); 2008–09: 116.2 ml (95%CI: 111.6–120.8); 2017–18: 101.6 ml (95%CI: 98.1–105.1)] and ultra-processed beverages [2002–2003: 117.9 ml (95%CI: 108.1–127.7); 2008–2009: 105.8 ml (95%CI: 99.2–112.5); 2017–2018: 122.8 (95%CI: 111.2–134.4)]. Milk was the most purchased beverage in volume by Brazilians in 2002–2003 [ 154.7 ml (95%CI: 146.4–162.9)], while regular soft drinks were the most purchased in the last period surveyed [2017–2018: 110.7 ml (95%CI: 99.2–122.2)]. There was a significant reduction in the purchase of milk [2002–2003: 154.7 ml (95%CI: 146.4–162.9); 2008–2009: 105.2 ml (95%CI: 100.7–109.8) and 2017–2018: 94.5 ml (95%CI: 91.1–98.0)] and skimmed milk [2008–2009: 10.9 ml (95% CI: 9.9–11.9) and 2017–18: 7.0 ml (95%CI: 6.3–7.0)]. For ultra-processed beverages, there was a significant increase in the purchase of other drinks between 2002–2003 and 2017–2018 [ 8.6 ml (95%CI: 6.9–10.3); 11.1 ml (95%CI: 10.4–11.8), respectively] (Table 2).
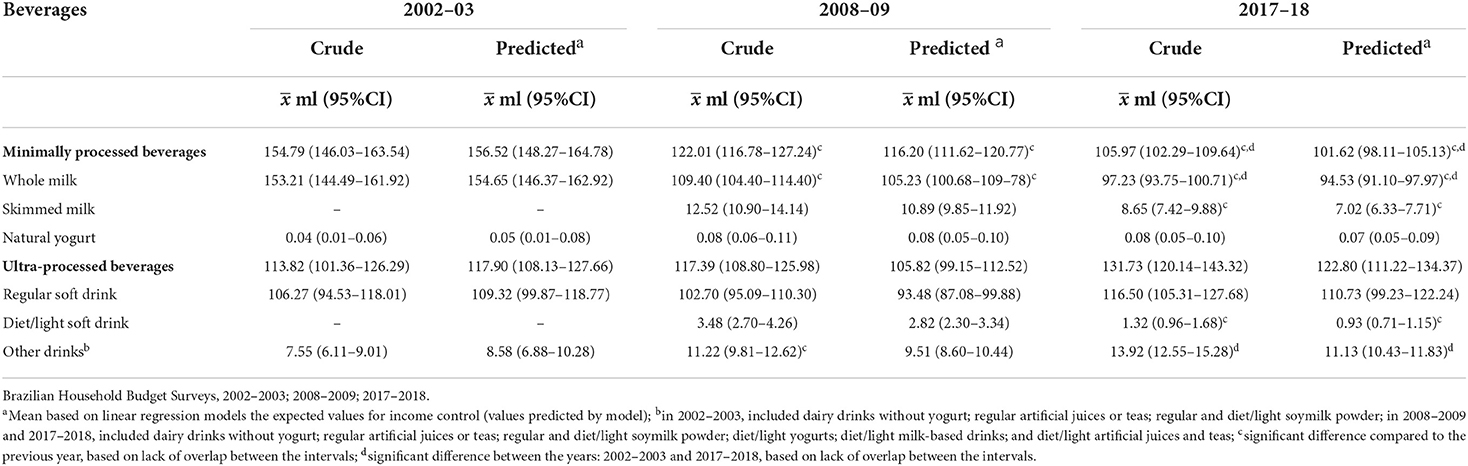
Table 2. Crude and predicted mean and 95% confidence interval of daily per capita purchase of minimally processed and ultra-processed beverages.
Overall, for all years surveyed, there was a decrease in the volume of minimally processed beverages and an increase of ultra-processed beverages purchased proportionally with the increase in the share of UPF in the diet, without significant difference. For regular soft drinks, the values for the fourth quartile almost doubled relative to the first one in 2008–2009 and 2017–2018 [Q1: : 67.9 ml (95%CI: 51.6–84.3); Q4: 138.2 ml (95%CI: 112.9–163.6); Q1: 63.6 ml (95%CI: 45.6–81.7); Q4: 124.7 ml (95%CI: 97.9–151.5), respectively]. In the last period, there is a difference for diet/light soft drinks [2017–2018: Q1: 0.5 ml (95%CI: 0.3–0.8); Q4: 1.9 g/ml (95%CI: 0.8–3.0)] and others drinks [2017-18: Q1: 6.2 g/ml (95%CI: 5.4–7.0); Q4: 19.6 g/ml (95%CI: 16.6–22.5)] (Table 3).
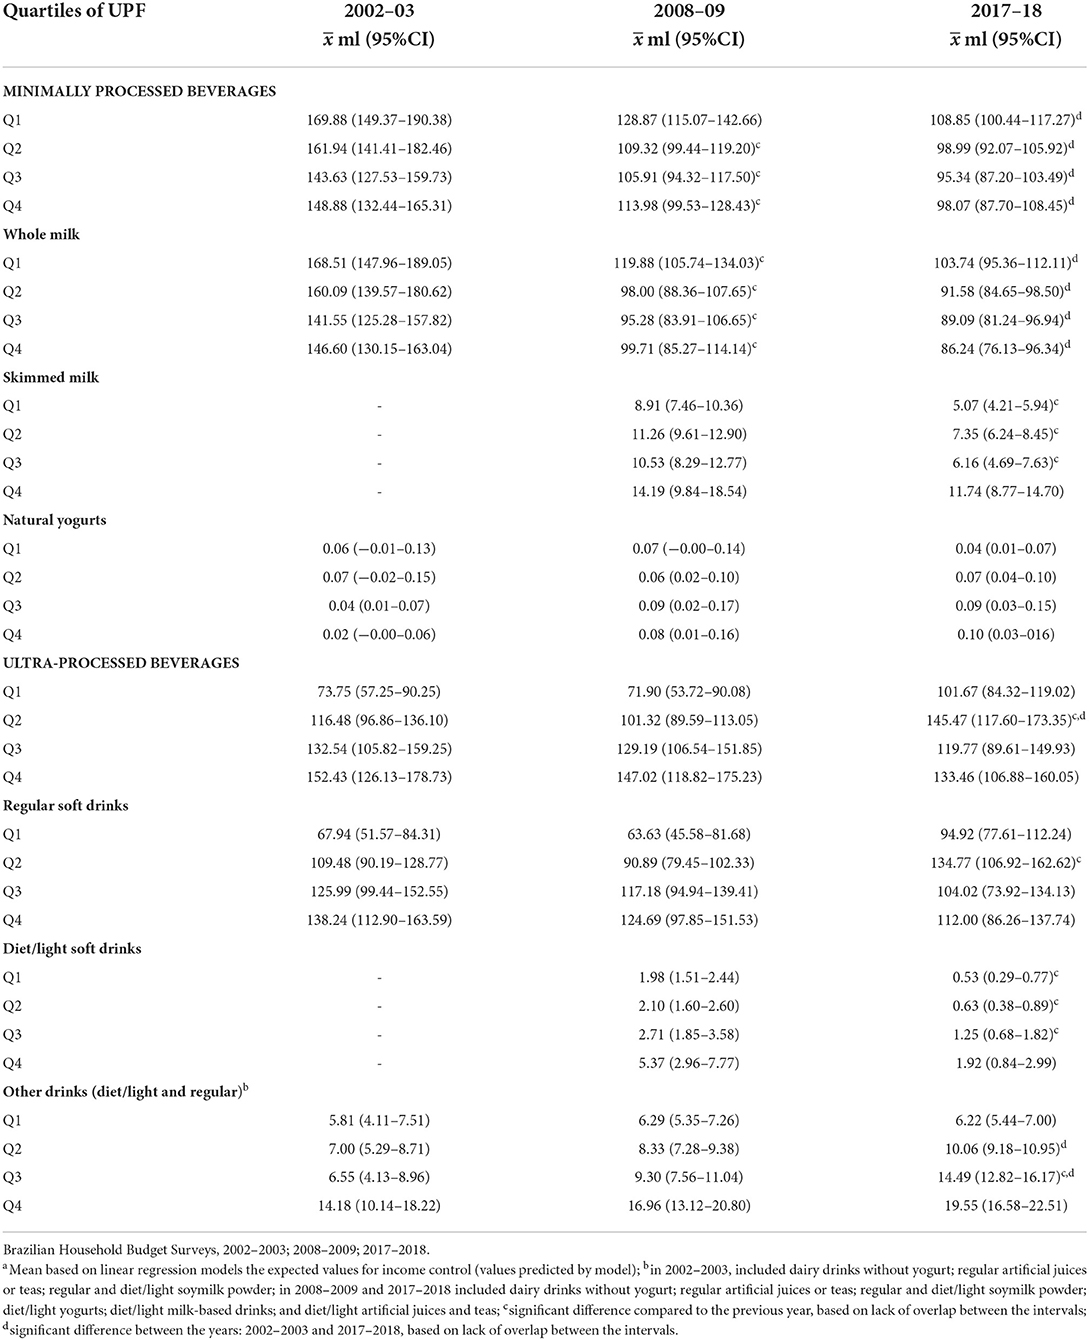
Table 3. Predicted mean and 95% confidence interval of daily per capita purchase of minimally processed and ultra-processed beverages according to quartiles of proportion of energy derived from ultra-processed foods and beverages.
Discussion
The results of the analysis of representative data on Brazilian households revealed a decrease in the acquisition of minimally processed beverages and the stability of ultra-processed beverages over the years. Considering simultaneously the evolution of minimally processed and ultra-processed beverages is relevant to assess a possible replacement behavior, which seemed to happen among lower income level households. In the period analyzed, considering the beverage subgroups, there was a decrease in the purchase of whole and skimmed milk and an increase in the purchase of other ultra-processed drinks. Milk was the most purchased beverage in volume for home consumption in 2002–2003, while regular soft drinks were the most purchased in 2017–2018. Also, there is a greater purchase of regular soft drinks, diet/light soft drinks, and other ultra-processed drinks among households with higher consumption of UPF (fourth quartile), when compared to those with lower consumption (first quartile).
In Brazil, beverages represented 17.1% of total daily energy intake (27). Despite the general stability in the acquisition of ultra-processed beverages verified in the present study, especially considering regular soft drinks, data from the Surveillance of Risk Factors by Telephone Survey (VIGITEL), which evaluates individuals residing in Brazilian capitals and the Federal District, pointed to a reduction in regular consumption (5 days/week or more) and the volume of sweetened beverages consumed (considering soft drinks and artificial juices plus their artificially sweetened versions), with emphasis on sugary drinks, between 2007 and 2016 (21). Despite this reduction in the capital, the same behavior does not seem to have happened in the whole country. Besides the likely different behavior according to the residence locations, one hypothesis for our result is related to possible changes in beverage portion size over the years (28). According to a report by the Pan American Health Organization, between 2000 and 2013, the sales volume of ultra-processed beverages in Brazil had an annual increase of 2.1% from 69.5 to 90.9 kg/year. The average annual increase in Latin America was lower, representing 1.8%, being greatest in Bolivia, Peru, Chile, and the Dominican Republic (29).
Evidence shows that ultra-processed foods, especially sugary drinks, are the main foods consumed out-of-home (30, 31). This study carried out analyses based on food items purchased for consumption at home, which despite not representing the totality of food consumption, continue to be important, as the consumption outside the home is decreasing (30). Therefore, to some extent, our values are underestimated, and the scenario could be more critical.
In addition to the harmful health effects associated with UPF, such as the higher occurrence and/or incidence of obesity, high blood pressure, cancers, and other non-communicable diseases (NCDs) (32–40), the high intake of artificial juices and soft drinks, rich in added sugar, is associated with weight gain and the metabolic syndrome (6, 7, 41, 42), type 2 diabetes (8), arterial hypertension (9), and obesity-related cancers (4, 10). Whereas artificially sweetened beverages are more associated with obesity, intestinal dysbiosis and cancers are not related to obesity (7, 11). Furthermore, the consumption of ultra-processed beverages in general, sugary or artificially sweetened, is associated with a higher incidence of arterial hypertension (43). The findings of this study are worrying, because with the increasing trend in the purchase of other ultra-processed drinks and the high consumption of soft drinks (regular and diet/light) by the population with greater consumption of ultra-processed foods, the risk of developing NCDs—which are considered the most expensive diseases in the world (44)—can be potentiated.
Considering the above and our results, the relevance of the Brazilian Strategic Actions Plan for Tackling Chronic Non-Communicable Diseases 2021–2030 (23) is reinforced to include a goal related to reducing the consumption of sweetened beverages and monitoring the country about this goal by carrying out national representative dietary surveys, such as Household Budget Surveys.
In this sense, effective regulatory public policies related to sweetened beverages should be implemented to reduce their consumption in Brazil. One of the central measures to be taken is the taxation of ultra-processed beverages, especially sugary drinks. Latin American countries such as Mexico and Chile showed satisfactory results in terms of reduced consumption due to the taxation of these beverages (45–47). The regulation of the offering of ultra-processed beverages in schools is also an important axis of the agenda to promote adequate healthy food that needs progress in Brazil (48). Furthermore, considering the problems related to the consumption of ultra-processed foods and beverages, front-of-package warning labeling that simply and informs the quality of food items is of great importance, as it can contribute to the decision-making of individuals (49, 50). In Brazil, a frontal nutrition labeling model was approved, which come into force in October 2022 (51). Despite being advance, this model is not considered the most efficient (52), and still, it does not warn about the use of additives and sweeteners, which are often used in diet/light versions of ultra-processed beverages (53). Additionally, considering the stratification of different populational groups in the monitoring is also relevant since it allows the identification of strategic contexts to reinforce the interventions and public health policies. According to our results, the worst scenario was verified for the most vulnerable households, where the replacement of minimally processed beverages by ultra-processed beverages seemed to be more intense.
The present study has some limitations. Household food purchase data do not allow stratification of the analyses according to individual variables, such as sex and age, which influence food consumption and diet quality, but we included analysis related to income, another variable related to food consumption (54). Food consumption that occurs outside the home is not detailed enough to be included in the analyses and the consumption of ultra-processed foods tends to be higher in this food context (31). However, food consumption outside the home is decreasing in Brazil (30) and household purchase data provide a good prediction of individual consumption (55, 56) and provide information related to all individuals in the household, different from individual consumption data, which assess only those older than 10 years (20).
As strengths of the study, we highlight the innovation in evaluating the trend in the volume of non-alcoholic beverages purchased for consumption at home, categorized according to the NOVA classification (1), which is recognized by international agencies (29, 57) and is adopted in Brazilian Dietary Guidelines (58), and including ultra-processed beverages in their diet/light versions, as these are often “hidden” in consumption analyses because they have low or no energy. Complementing previous analyses related to the frequency of consumption is important to contribute to the monitoring, offering more elements to understand the scenario of consumption.
In conclusion, the results of the analysis of representative data on Brazilian households revealed that the volume of minimally processed beverages purchased declined, while ultra-processed beverages remained stable over 15 years. The acquisition of both minimally processed and ultra-processed beverages was influenced by income with the intensity of changes differing among income groups. The monitoring of beverage consumption by national representative surveys is important and effective public policies regulating these beverages should be implemented to reduce the consumption of ultra-processed beverages, those include taxation, restricted access to these drinks in settings such as schools, and clear nutritional labeling.
Data availability statement
Publicly available datasets were analyzed in this study. This data can be found here: https://www.ibge.gov.br/estatisticas/sociais/populacao/24786-pesquisa-de-orcamentos-familiares-2.html?=&t%25252520=what-is&t=microdados.
Ethics statement
Ethical review and approval was not required for the study on human participants in accordance with the local legislation and institutional requirements. Written informed consent for participation was not required for this study in accordance with the national legislation and the institutional requirements.
Author contributions
NO contributed to the conception, design, data interpretation, performed all statistical analyses, drafted, and critically revised the manuscript. DC contributed to the conception, design, data interpretation, drafted, and critically revised the manuscript. Both authors revised the final version of the manuscript, gave their final approval, and agreed to be accountable for all aspects of the work.
Funding
This study was supported by the following Brazilian research agencies: Coordination for the Improvement of Higher Education Personnel, Brazil (CAPES) (financing code 001 and process number 88881.637476/2021-01) and Carlos Chagas Filho Foundation for Supporting Research in the State of Rio de Janeiro (FAPERJ) (process numbers: E-26-010.100930/2018, E-26/202.667/2018, and E-26/210.064/2021).
Conflict of interest
The authors declare that the research was conducted in the absence of any commercial or financial relationships that could be construed as a potential conflict of interest.
Publisher's note
All claims expressed in this article are solely those of the authors and do not necessarily represent those of their affiliated organizations, or those of the publisher, the editors and the reviewers. Any product that may be evaluated in this article, or claim that may be made by its manufacturer, is not guaranteed or endorsed by the publisher.
References
1. Monteiro CA, Cannon G, Levy RB, Moubarac JC, Louzada ML, Rauber F, et al. Ultra-processed foods: what they are and how to identify them. Public Health Nutr. (2019) 22:936–41. doi: 10.1017/S1368980018003762
2. World Health Organization. Taxes on sugary drinks: Why do it? World Health Organization. (2017). Available online at: https://apps.who.int/iris/bitstream/handle/10665/260253/WHO-NMH-PND-16.5Rev.1-eng.pdf (accessed September 2022).
3. Sousa A, Sych J, Rohrmann S, Faeh D. The importance of sweet beverage definitions when targeting health policies-the case of Switzerland. Nutrients. (2020) 12:1976. doi: 10.3390/nu12071976
4. Chazelas E, Srour B, Desmetz E, Kesse-Guyot E, Julia C, Deschamps V, et al. Sugary drink consumption and risk of cancer: results from NutriNet-Santé prospective cohort. BMJ. (2019) 366:l2408. doi: 10.1136/bmj.l2408
5. Dunford EK, Taillie LS, Miles DR, Eyles H, Tolentino-Mayo L, Ng SW. Non-Nutritive Sweeteners in the Packaged Food Supply-An Assessment across 4 Countries. Nutrients. (2018) 10:E257. doi: 10.3390/nu10020257
6. Morenga LT, Mallard S, Mann J. Dietary sugars and body weight: systematic review and meta-analyses of randomised controlled trials and cohort studies. BMJ. (2013) 346:e7492. doi: 10.1136/bmj.e7492
7. Ruanpeng D, Thongprayoon C, Cheungpasitporn W, Harindhanavudhi T. Sugar and artificially sweetened beverages linked to obesity: a systematic review and meta-analysis. QJM Mon J Assoc Physicians. (2017) 110:513–20. doi: 10.1093/qjmed/hcx068
8. Imamura F, O'Connor L, Ye Z, Mursu J, Hayashino Y, Bhupathiraju SN, et al. Consumption of sugar sweetened beverages, artificially sweetened beverages, and fruit juice and incidence of type 2 diabetes: systematic review, meta-analysis, and estimation of population attributable fraction. BMJ. (2015) 351:h3576. doi: 10.1136/bmj.h3576
9. Kim Y, Je Y. Prospective association of sugar-sweetened and artificially sweetened beverage intake with risk of hypertension. Arch Cardiovasc Dis. (2016) 109:242–53. doi: 10.1016/j.acvd.2015.10.005
10. Hodge AM, Bassett JK, Milne RL, English DR, Giles GG. Consumption of sugar-sweetened and artificially sweetened soft drinks and risk of obesity-related cancers. Public Health Nutr. (2018) 21:1618–26. doi: 10.1017/S1368980017002555
11. Bassett JK, Milne RL, English DR, Giles GG, Hodge AM. Consumption of sugar-sweetened and artificially sweetened soft drinks and risk of cancers not related to obesity. Int J Cancer. (2020) 146:3329–34. doi: 10.1002/ijc.32772
12. Scrinis G, Monteiro CA. Ultra-processed foods and the limits of product reformulation. Public Health Nutr. (2018) 21:247–52. doi: 10.1017/S1368980017001392
13. Chassaing B, Koren O, Goodrich JK, Poole AC, Srinivasan S, Ley RE, et al. Dietary emulsifiers impact the mouse gut microbiota promoting colitis and metabolic syndrome. Nature. (2015) 519:92–6. doi: 10.1038/nature14232
14. Ruiz-Ojeda FJ, Plaza-Díaz J, Sáez-Lara MJ, Gil A. Effects of sweeteners on the gut microbiota: a review of experimental studies and clinical trials. Adv Nutr Bethesda Md. (2019) 10:S31–48. doi: 10.1093/advances/nmy037
15. Thorning TK, Raben A, Tholstrup T, Soedamah-Muthu SS, Givens I, Astrup A. Milk and dairy products: good or bad for human health? An assessment of the totality of scientific evidence. Food Nutr Res. (2016) 60:32527. doi: 10.3402/fnr.v60.32527
16. Bray GA, Popkin BM. Dietary sugar and body weight: have we reached a crisis in the epidemic of obesity and diabetes?: health be damned! Pour on the sugar Diabetes Care. (2014) 37:950–6. doi: 10.2337/dc13-2085
17. Rosinger A, Herrick K, Gahche J, Park S. Sugar-sweetened Beverage Consumption Among U.S. Adults, 2011-2014. NCHS Data Brief . (2017) 270:1–8. Available online at: https://www.cdc.gov/nchs/data/databriefs/db270.pdf (accessed September 2022).
18. Canella DS, Levy RB, Claro RM, Monteiro CA. Food consumption: too much sugar (1987-2009). In: Monteiro CA, Levy RB. Old and New Illnesses Health In Brazil Geisel a Dilma (2015). Book written in Portuguese. Available online at: https://repositorio.usp.br/item/002743613 (accessed September 2022).
19. World Health Organization. Guideline: Sugars Intake for Adults and Children. (2015) World Health Organization. Available online at: https://apps.who.int/iris/handle/10665/149782 (accessed September 2022).
20. Brazil. Brazilian Institute of Geography and Statistics. Household Budget Surveys 2017: analysis of personal food consumption in Brazil. IBGE. Brazilian official documents written in Portuguese. (2020). Available online at: http://biblioteca.ibge.gov.br/index.php/biblioteca-catalogo?view=detalhes&id=2101742 (accessed September 2022).
21. Brazil. Ministry of Health. Vigitel Brasil 2006-2020: nutritional status and food consumption. Surveillance of risk and protective factors for chronic diseases by telephone survey: estimates on frequency and sociodemographic distribution of nutritional status and food consumption in the capitals of the 26 Brazilian states and in the Federal District between 2006 and 2020 Ministry of Health. Brazilian official documents written in Portuguese. (2022). Available online at: https://www.gov.br/saude/pt-br/centrais-de-conteudo/publicacoes/publicacoes-svs/vigitel/vigitel-brasil-2006-2020-estado-nutricional-e-consumo-alimentar.pdf/view (accessed September 2022).
22. Figueiredo N, Maia EG, Silva LES da, Granado FS, Claro RM. Trends in sweetened beverages consumption among adults in the Brazilian capitals, 2007–2016. Public Health Nutr. (2018) 21:3307–17. doi: 10.1017/S1368980018002161
23. Brazil. Ministry of Health. Strategic Action Plan to Combat Chronic Diseases and Non-Communicable Diseases in Brazil 2021-2030. Ministry of Health. Brazilian official documents written in Portuguese. (2021). Available online at: https://www.gov.br/saude/pt-br/centrais-de-conteudo/publicacoes/publicacoes-svs/doencas-cronicas-nao-transmissiveis-dcnt/09-plano-de-dant-2022_2030.pdf/view
24. University of São Paulo. Brazilian Food Composition Table (TBCA). University of São Paulo (USP), Food Research Center (FoRC), Versão 7,0. (2019). Available online at: http://www.fcf.usp.br/tbca
25. Simões B. dos S, Barreto SM, Molina M del CB, Luft VC, Duncan BB, Schmidt MI, et al. Consumption of ultra-processed foods and socioeconomic position: a cross-sectional analysis of the Brazilian Longitudinal Study of Adult Health. Cad Saúde Pública. (2018) 34:e00019717. doi: 10.1590/0102-311x00019717
26. French SA, Tangney CC, Crane MM, Wang Y, Appelhans BM. Nutrition quality of food purchases varies by household income: the SHoPPER study. BMC Public Health. (2019) 19:231. doi: 10.1186/s12889-019-6546-2
27. Pereira RA, Souza AM, Duffey KJ, Sichieri R, Popkin BM. Beverages consumption in Brazil: results from the first National Dietary Survey. Public Health Nutr. (2015) 18:1164–72. doi: 10.1017/S1368980014001657
28. Young LR, Nestle M. Portion sizes of ultra-processed foods in the United States, 2002 to 2021. Am J Public Health. (2021) 111:2223–6. doi: 10.2105/AJPH.2021.306513
29. PAHO. Ultra-processed food and drink products in Latin America: Trends, impact on obesity, policy implications. (2018). Available online at: https://iris.paho.org/handle/10665.2/7699
30. Bezerra IN, Vasconcelos TM, Cavalcante JB, Yokoo EM, Pereira RA, Sichieri R. Evolution of out-of-home food consumption in Brazil in 2008–2009 and 2017–2018. Rev Saúde Pública. (2021) 55. doi: 10.11606/s1518-8787.2021055003221
31. Andrade GC, Gombi-Vaca MF, Louzada ML da C, Azeredo CM, Levy RB. The consumption of ultra-processed foods according to eating out occasions. Public Health Nutr. (2020) 23:1041–8. doi: 10.1017/S1368980019002623
32. Blanco-Rojo R, Sandoval-Insausti H, López-Garcia E, Graciani A, Ordovás JM, Banegas JR, et al. Consumption of ultra-processed foods and mortality: a national prospective cohort in Spain. Mayo Clin Proc. (2019) 94:2178–88. doi: 10.1016/j.mayocp.2019.03.035
33. Canella DS, Levy RB, Martins APB, Claro RM, Moubarac JC, Baraldi LG, et al. Ultra-processed food products and obesity in Brazilian households (2008-2009). PLoS ONE. (2014) 9:e92752. doi: 10.1371/journal.pone.0092752
34. Fiolet T, Srour B, Sellem L, Kesse-Guyot E, Allès B, Méjean C, et al. Consumption of ultra-processed foods and cancer risk: results from NutriNet-Santé prospective cohort. BMJ. (2018) 360:k322. doi: 10.1136/bmj.k322
35. Popkin BM. Relationship between shifts in food system dynamics and acceleration of the global nutrition transition. Nutr Rev. (2017) 75:73–82. doi: 10.1093/nutrit/nuw064
36. Schnabel L, Kesse-Guyot E, Allès B, Touvier M, Srour B, Hercberg S, et al. Association between ultraprocessed food consumption and risk of mortality among middle-aged adults in France. JAMA Intern Med. (2019) 179:490–8. doi: 10.1001/jamainternmed.2018.7289
37. Silva FM, Giatti L, de Figueiredo RC, Molina MDCB, de Oliveira Cardoso L, Duncan BB, et al. Consumption of ultra-processed food and obesity: cross sectional results from the Brazilian Longitudinal Study of Adult Health (ELSA-Brasil) cohort (2008-2010). Public Health Nutr. (2018) 21:2271–9. doi: 10.1017/S1368980018000861
38. Smaira FI, Mazzolani BC, Peçanha T, Dos Santos KM, Rezende DAN, Araujo ME, et al. Ultra-processed food consumption associates with higher cardiovascular risk in rheumatoid arthritis. Clin Rheumatol. (2020) 39:1423–8. doi: 10.1007/s10067-019-04916-4
39. Vandevijvere S, Jaacks LM, Monteiro CA, Moubarac JC, Girling-Butcher M, Lee AC, et al. Global trends in ultraprocessed food and drink product sales and their association with adult body mass index trajectories. Obes Rev. (2019) 20:10–9. doi: 10.1111/obr.12860
40. Lane MM, Davis JA, Beattie S, Gómez-Donoso C, Loughman A, O'Neil A, et al. Ultraprocessed food and chronic noncommunicable diseases: a systematic review and meta-analysis of 43 observational studies. Obes Rev. (2021) 22: e13146. doi: 10.1111/obr.13146
41. Sundborn G, Thornley S, Merriman TR, Lang B, King C, Lanaspa MA, et al. Are liquid sugars different from solid sugar in their ability to cause metabolic syndrome? Obesity. (2019) 27: 879–87. doi: 10.1002/oby.22472
42. Welsh JA, Wang Y, Figueroa J, Brumme C. Sugar intake by type (added vs. naturally occurring) and physical form (liquid vs. solid) and its varying association with children's body weight, NHANES 2009-2014. Pediatr Obes. (2018) 13:213–21. doi: 10.1111/ijpo.12264
43. Monge A, Canella DS, López-Olmedo N, Lajous M, Cortés-Valencia A, Stern D. Ultraprocessed beverages and processed meats increase the incidence of hypertension in Mexican women. Br J Nutr. (2021) 126:600–11. doi: 10.1017/S0007114520004432
44. Hajat C, Stein E. The global burden of multiple chronic conditions: a narrative review. Prev Med Rep. (2018) 12:284–93. doi: 10.1016/j.pmedr.2018.10.008
45. Caro JC, Corvalán C, Reyes M, Silva A, Popkin B, Taillie LS. Chile's 2014 sugar-sweetened beverage tax and changes in prices and purchases of sugar-sweetened beverages: an observational study in an urban environment. PLoS Med. (2018) 15:e1002597. doi: 10.1371/journal.pmed.1002597
46. Cuadrado C, Dunstan J, Silva-Illanes N, Mirelman AJ, Nakamura R, Suhrcke M. Effects of a sugar-sweetened beverage tax on prices and affordability of soft drinks in Chile: a time series analysis. Soc Sci Med. (2020) 245:112708. doi: 10.1016/j.socscimed.2019.112708
47. Sánchez-Romero LM, Canto-Osorio F, González-Morales R, Colchero MA, Ng SW, Ramírez-Palacios P, et al. Association between tax on sugar sweetened beverages and soft drink consumption in adults in Mexico: open cohort longitudinal analysis of Health Workers Cohort Study. BMJ. (2020) 369:m1311. doi: 10.1136/bmj.m1311
48. Azeredo CM, Leite MA, Rauber F, Ricardo CZ, Levy RB. Are laws restricting soft drinks sales in Brazilian schools able to lower their availability? Rev Saúde Pública. (2020) 54:42. doi: 10.11606/s1518-8787.2020054001227
49. Roberto CA, Ng SW, Ganderats-Fuentes M, Hammond D, Barquera S, Jauregui A, et al. The influence of front-of-package nutrition labeling on consumer behavior and product reformulation. Annu Rev Nutr. (2021) 41:529–50. doi: 10.1146/annurev-nutr-111120-094932
50. Jáuregui A, Vargas-Meza J, Nieto C, Contreras-Manzano A, Alejandro NZ, Tolentino-Mayo L, et al. Impact of front-of-pack nutrition labels on consumer purchasing intentions: a randomized experiment in low- and middle-income Mexican adults. BMC Public Health. (2020) 20:463. doi: 10.1186/s12889-020-08549-0
51. Brazil. Normative Instruction n° 75, October 8, 2020. Establishes the technical requirements for the declaration of nutrition labeling on packaged foods. Brazilian official documents written in Portuguese. (2020). Available online at: https://www.gov.br/agricultura/pt-br/assuntos/inspecao/produtos-vegetal/legislacao-1/biblioteca-de-normas-vinhos-e-bebidas/instrucao-normativa-no-75-de-8-de-outubro-de-2020.pdf/view (accessed September 2022).
52. Khandpur N, Mais LA, de Morais Sato P, Martins APB, Spinillo CG, Rojas CFU, et al. Choosing a front-of-package warning label for Brazil: a randomized, controlled comparison of three different label designs. Food Res Int. (2019) 121:854–61. doi: 10.1016/j.foodres.2019.01.008
53. Sambra V, López-Arana S, Cáceres P, Abrigo K, Collinao J, Espinoza A, et al. Overuse of non-caloric sweeteners in foods and beverages in Chile: a threat to consumers' free choice? Front Nutr. (2020) 7:69. doi: 10.3389/fnut.2020.00068
54. Rodrigues, R M et al. Most consumed foods in Brazil: evolution between 2008-2009 and 2017-2018. Revista de Saúde Pública. (2021) 55:1 doi: 10.11606/s1518-8787.2021055003406
55. Naska A, Vasdekis V, Trichopoulou A, A. preliminary assessment of the use of household budget survey data for the prediction of individual food consumption. Public Health Nutr. (2001) 4:1159–65. doi: 10.1079/PHN2001237
56. LouzadaM L C, et al. Validating the usage of household food acquisition surveys to assess the consumption of ultra-processed foods: evidence from Brazil. Food Policy. (2017) 72:112–20 doi: 10.1016/j.foodpol.2017.08.017
57. Food Agriculture Organization of the United Nations. Guidelines on the Collection of Information on Food Processing Through Food Consumption Surveys. (2015). Available online at: http://www.fao.org/3/a-i4690e.pdf (accessed September 2022).
58. Brazil. Ministry of Health. Dietary Guidelines for the Brazilian Population. Ministry of Health. 2nd ed. (2014). Available online at: https://bvsms.saude.gov.br/bvs/publicacoes/dietary_guidelines_brazilian_population.pdf (accessed September 2022).
Keywords: sugar-sweetened beverages, artificially sweetened beverages, ultra-processed foods, ultra-processed beverages, population health, diet quality, trends
Citation: Oliveira N and Canella DS (2022) Trend of minimally processed and ultra-processed beverages purchased in Brazilian households: Less milk and much soft drink (2002–2003 to 2017–2018). Front. Public Health 10:956142. doi: 10.3389/fpubh.2022.956142
Received: 29 May 2022; Accepted: 10 October 2022;
Published: 03 November 2022.
Edited by:
Bartira Gorgulho, Federal University of Mato Grosso, BrazilReviewed by:
Ana Paula Alves De Souza, Federal University of Mato Grosso, BrazilIlana Bezerra, Government of the State of Ceará, Brazil
Copyright © 2022 Oliveira and Canella. This is an open-access article distributed under the terms of the Creative Commons Attribution License (CC BY). The use, distribution or reproduction in other forums is permitted, provided the original author(s) and the copyright owner(s) are credited and that the original publication in this journal is cited, in accordance with accepted academic practice. No use, distribution or reproduction is permitted which does not comply with these terms.
*Correspondence: Daniela Silva Canella, ZGFuaWVsYS5jYW5lbGxhQHVlcmouYnI=