- 1School of Finance and Taxation, Shandong University of Finance and Economics, Jinan, China
- 2School of Economics and Management, Binzhou University, Binzhou, China
- 3School of Economic Information Engineering, Southwestern University of Finance and Economics, Chengdu, China
There has been a growing trend in health spending and renewable energy consumption in China over the past few decades, which has positive implications for health outcomes, such as life expectancy. Therefore, the main objective of this study is to empirically analyze the impact of health expenditures and renewable energy on life expectancy in China. We used the time series data from 2000Q1 to 2020Q4 and applied the VECM approach for the data analysis. The results of this study suggest a long run association between health spending, life expectancy and renewable energy. The increase in health spending improves life expectancy, while renewable energy consumption also positively affects life expectancy in China. Therefore, the government should allocate sufficient funding to the health sector in order to attain higher life expectancy in the country. In addition, the government should also provide incentives for the consumption and production of renewable energy, which could help to achieve the sustainable development goal and life expectancy.
Introduction
Health spending and health outcomes have been extensively discussed in the literature. However, less attention is given to essential factors such as renewable energy. Academicians, policymakers, and the general public have devoted considerable attention to rising healthcare expenditures (1). Health spending may affect the productivity of labor, and the traditional endogenous growth theories assume that human capital accumulation could significantly improve the long run output per worker. People in good health are more productive, and higher public health spending is associated with improved health outcomes, such as high life expectancy (2, 3). Most of the studies related to health outcomes and health spending followed by the production function using health care spending as the explanatory variable while health outcomes such as mortality and life expectancy are taken as dependent variables (4). Health spending may improve life expectancy in the long run and could lead to higher earnings in short run (5). Akinci et al. (6) reported that in Middle East and North Africa (MENA) region, efficient healthcare spending increases life expectancy. Countries with the best health outcomes allocate a large portion of their budgets to healthcare spending (7). Sufficient health spending improves the outcomes. However, insufficient spending on healthcare may create impediments for the poor public to get basic health care facilities.
The economic development in China's post industrialization has increased the energy demand, which has serious concern for public health and sustainable development. Conventional fossil fuel energy could lead to environmental degradation and have negative implications for life expectancy (8). The UN Environment Conference reported that seven million people worldwide died from air pollution each year (9). The energy produced from fossil fuels may produce harmful emissions, for example, carbon monoxide (CO) and carbon dioxide (CO2). The energy production from fuel leads to air pollution and increases CO2 emissions, which affect environmental quality. Consequently, it leads to global warming, and many living species may become extinct. Increasing global temperatures can also have a negative effect on people since it increases the chance of certain diseases, such as cancer and mental illness, which leads to a shorter life expectancy (10). Therefore, it is essential to switch from non-renewable energy sources to renewable energy sources such as solar and biomass in order to reduce overall environmental degradation, which expectedly, to improve life expectancy. Although human health is associated with many factors that have been discussed in the literature, however, less attention is given to the relationship between renewable energy and life expectancy (11). China made socioeconomic improvements by investing in social sectors such as health, education, environmental management, sanitation, and sustainability. China's rising per capita income and industrialization has led to rise the healthcare expenditures. Over the past few decades, there has been a significant reduction in the prevalence of poverty, as well as improvements in adult literacy, access to safe drinking water, nutrition and nutrition, all of which are likely to contribute in the increase of life expectancy (12). Government spending on healthcare has an increasing trend in China, and globalization increases the real income of the people, which raises energy consumption.
Renewable energy consumption has significant implications for the environment and human health (13, 14). Renewable energy provides clean energy and a clean environment, which could improve human health and life expectancy. Both public health spending and renewable energy consumption could prolong the life expectancy in China. Furthermore, less attention has been given to the renewable energy and life expectancy relationship in literature. Therefore, to fill this research gap, this paper explores the linkages between health spending, renewable consumption and life expectancy in China. This paper contributes to the literature from the following aspects: First, we attempt to link life expectancy with renewable energy and health in China; Second, we use the cointegration methodology to explore long run association between life expectancy, renewable energy, and health spending. Third, we use the case of China, which is an emerging developing country. The recent economic development in the post trade liberation brings a significant improvement in people's income and quality of life in China. Therefore, this study considers the post trade and industrial development period for analysis, which provides a clear policy direction and implications of recent economic development in China for life expectancy. The rest of the paper is organized as follows: Section Health spending, life expectancy, and renewable energy consumption in China shows development facts of the health spending, renewable energy and life expectancy in China; Section Literature review gives the literature review; Section Methodology and Results and discussion show the methodology and results; Section Conclusion shows the conclusion of the study.
Health spending, life expectancy, and renewable energy consumption in China
This section provides information related to renewable health spending in China. Various health reforms have been introduced in China to promote public health. China initiated a comprehensive health-care reform in 2009 and committed to providing all residents equal access to basic health care facilities. The reform in the first phase was focused on increasing social health care coverage for the public and upgrading the infrastructure of the health care system. In the second phase, government reforms mainly focused on the delivery of health, such as the implementation of systemic reform of government hospitals by reducing mark-up for medicine sales and changing fee schedules, and fee for the patients in hospitals (15). In the past few decades, China has made significant progress in expanding equal access to healthcare and improved financial protection, particularly for those with a lower economic class. However, there are still concerns about the quality of care, the prevention and treatment of non-communicable diseases (NCDs), the effectiveness of health care delivery, the management of health care costs, and the level of public satisfaction. Health spending has a continual increasing trend in China from 1990 to 2000, while there is a moderate decrease in health spending from 2000 to 2001. The increasing trend continues from 2001 to 2021 (except for 2016 and 2017). The increasing trend of health spending indicates that the GDP of China is significantly growing over period and leads to an increase in health spending. The overall expenditure on healthcare per capita in China increased from 319 yuan in 2000 to 1888 yuan in 2011 and its representing an average yearly growth rate of 17.4 percent. Between 2000 and 2011, government and social health expenditures per capita rose fast, with an average yearly growth of 22.9 percent, from 56 yuan to 554 yuan, and with an average yearly growth of 18.8 percent, from 92 yuan to 625 yuan, respectively (16). The life expectancy also increased from 1990 to 2021, which implies that due to high spending and steady GDP growth boosted health quality and increased the life expectancy in China. The development of life expectancy and health spending can be seen in Figure 1.
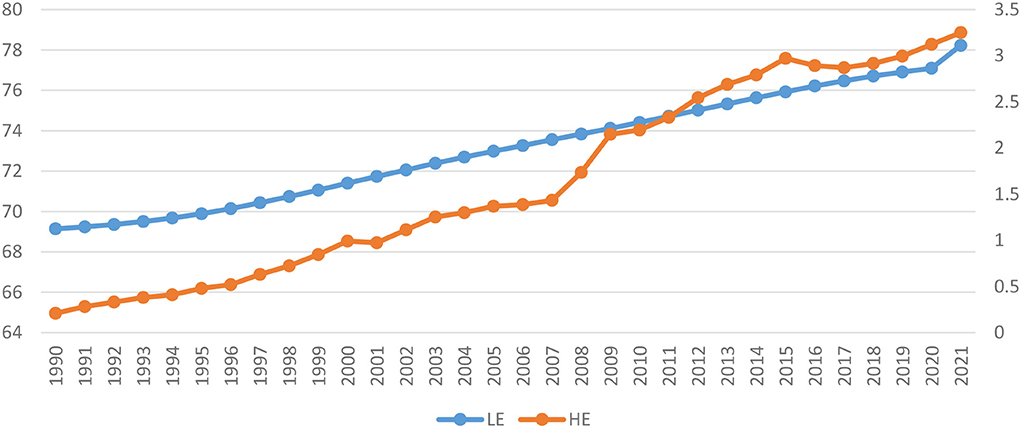
Figure 1. Life expectancy (LE) and Health spending (HE) in China (1990–2021). Source: World Bank Development Indicators.
China has been rapidly moving toward a more sustainable and low-carbon future in the past few decades. Carbon-based fuels are gradually being replaced with renewable sources, and clean air laws contribute to a healthy environment and sustainable development in both direct and indirect ways. China already leads in terms of renewable energy output, and becomes the world's largest producer of solar and wind energy, as well as the leading domestic and foreign investor in renewable energy. In 2016, Chinese corporations signed four of the world's top five renewable energy agreements. Investments in renewable energy is the top priority by the Chinese government because they can help the country overcome environmental and socioeconomic challenges. To reduce overall air pollution, the Chinese government actively promotes renewable energy use. According to the National People's Congress (NPC) Environmental Committee report, the production and consumption of energy produced from fossil fuels are responsible for 90 percent of sulfur dioxide emissions in China. The effect of air pollution on health and economy has been extensively studied. RAND Corporation estimates that in 2012, labor productivity losses caused by air pollution cost $535 billion, or 6.5 percent of its GDP in China. Currently, China is actively involved in producing green energy, and its 13th Five Year Plan aims to reduce fossil fuel energy usage and increase the production of renewable energy from 35 to 39% by 2020. China is expected to reach one fifth of its electricity consumption from non-fossil fuel sources by 2030. The International Energy Agency reports that over the next 5 years, China will produce 36% and 40% of the world's solar and wind energy, respectively. Figure 2 represents renewable energy generation in China from 1990 to 2021. Hydro energy is a major source of renewable energy production, in the year 1990 Hydro produced 54.0 GWh, which continuously increased. The second main contributor is the Wind energy; which grew drastically in 2005 and in 2020 wind energy produced 471,175 GWh. Solar energy comes as the third larger contributor to renewable energy, and there is also an increasing trend; however, solar energy started a significant contribution in 2005 and onward. In 1990 it only produced 2.0 GWh, which grew significantly, and it reached 269,718 GWh in 2020.
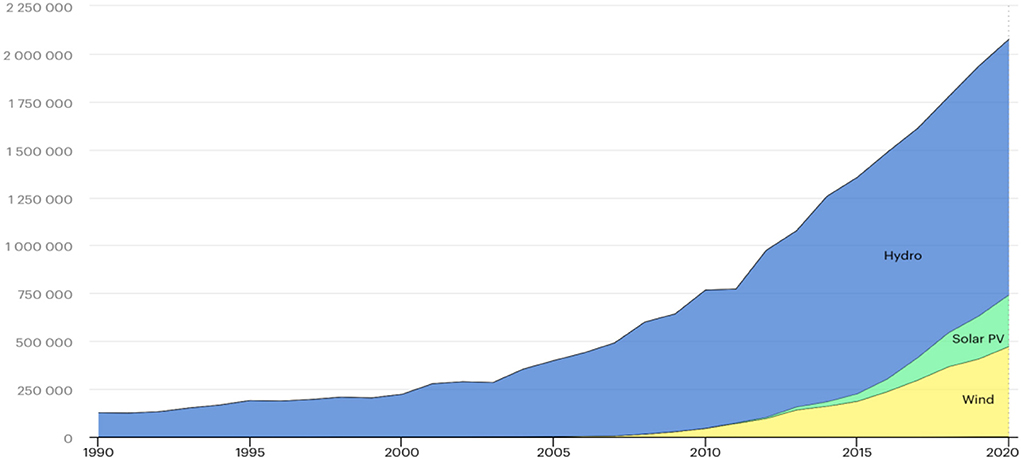
Figure 2. Renewable energy production. Source: (17).
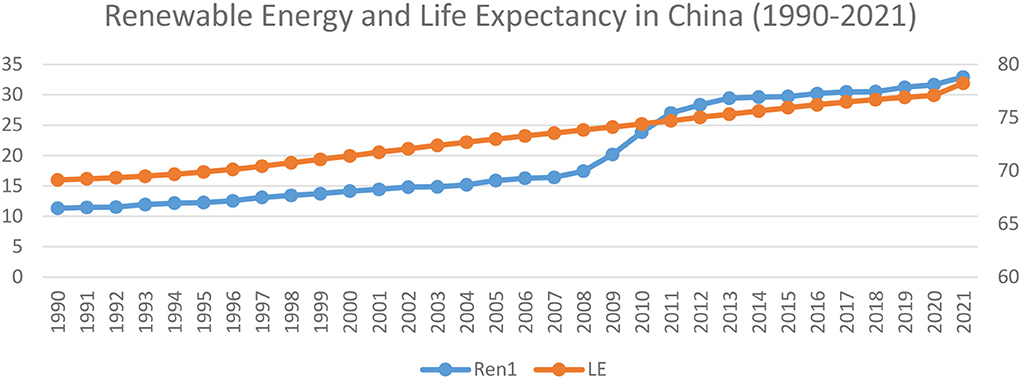
Figure 3 shows the trend between life expectancy and renewable energy; overall, there is a close association between life expectancy and renewable energy consumption. This implies that, along with other factors, renewable energy is the main factor responsible for the life expectancy in China. According to a study conducted at UC Berkeley, fossil fuel energy has serious health concerns. As a result, air pollution accounts for around 17 percent of all deaths in China. A University of Chicago study estimated that suspended particles in northern China cause half a billion people to lose 5 years of their life expectancy. The Chinese government ranked air pollution as their top priority, and air pollution is the second biggest concern for Chinese citizens. Nevertheless, several participants have less hope, and many participants think air pollution will worsen over the next 5 years. The renewable energy source may become a prominent source of energy in the future that will contribute to sustainable development and the improvement of life expectancy.
Literature review
In this section we review the literature, which discusses the relationship between health expenditures and health outcomes, e.g., life expectancy, but less attention has been given to the relationship between renewable energy and life expectancy. Lubitz et al. (18) investigated the implications of health spending for elderly people. The elderly with good health live longer as compared to those who did not have good health, assuming the accumulative health spending was the same for both category people. It was possible to improve the health and life expectancy of the elderly without increasing health care spending if promotion efforts were directed toward those under the age of 65. Zeeshan et al. (19) explored the asymmetric relationship between CO2 emissions, environmental pollution, and household-level health spending using the case of China. Their results showed an asymmetric relationship between CO2 emissions and health spending, argued that an increase in environmental pollution could raise health spending. Owumi and Eboh (20) studied the health spending on life expectancy in Nigeria. They found that life expectancy improved significantly as a result of domestic and external health expenditures during the period of 2000–2017. In addition, government spending could improve life expectancy, and results reported that 1% increase in Nigeria's general government health expenditure would improve life expectancy by 6%. An increase in out-of-pocket health care expenses of 1% would result in improving life expectancy by 63%. In addition, a 1% increase in external health spending would rise in life expectancy by 11%. Shahbaz et al. (21) analyzed the determinants of life expectancy under the role of economic misery using the case of Pakistan. Their results showed that, among the other factors, health spending improved life expectancy. The study of Van den Heuvel and Olaroiu (22) explored the relationship between life expectancy and health spending using the case of European countries. They used cross-sectional data for the 31 European countries. They found that health spending was not the main factor affecting life expectancy, but rather social protection spending could improve life expectancy. The results showed that high spending on social protection could increase life expectancy in Europe. Kabir (12) studied determinants of life expectancy in developing countries; the results indicate that among the different factors such as per capita income, education and safe water, however, health spending is the main factor. Jakovljevic et al. (23) examined long run association between health spending and life expectancy in Eastern Europe. The outcomes suggested a positive relationship between life expectancy and health spending in EU members. Anderson and Poullier (24) studied health spending, access, and outcomes trends in industrialized countries. Their finding reported that health spending significantly increased in industrialized countries. Giang (25) analyzed the relationship between life expectancy and private health spending for EU-15. They applied multiple regression analysis for data and their results indicated a positive association between private health expenditures and life expectancy. They also mentioned that GDP per capita and employment also determined health expectancy.
Less attention has been given to explore the relationship between life expectancy and renewable energy in the literature. Caruso et al. (11) studied the relationship between renewable energy consumption, social factors, and health in Europe. They applied Panel Vector Auto Regression (PVAR) technique for the data analysis. Some factors such as modernization and industrialization significantly affected human health in Europe. In contrast, environmental degradation induced by fossil energy might have a negative effect on human health. Fossil fuel energy could be replaced with renewable energy. Their findings showed the growth of renewable energy use and its impact on other social aspects, rather than the existence of causal linkages between health and renewable energy. Shah et al. (26) analyzed the FDI inflow, mortality and renewable energy consumption in China for the period 1998–2020. They reported that a significant amount of FDI inflow had occurred in the last few decades. This FDI inflow improved the economic growth and development in the country, but on the other hand, it brought environmental degradation in terms of higher CO2 emissions. They applied nonlinear ARDL approach and used the data for the period 1998–2020. Their findings showed a significant association between renewable energy, mortality and FDI in China. In addition, they found that renewable energy reduces mortality in China. Ibrahim et al. (27) analyzed the non-renewable energy consumption on quality of life for sub-Saharan African countries. Their findings showed that an increase in non-renewable energy reduced life expectancy in sub-Saharan African countries. Shah et al. (8) studied the linkages between trade, CO2 emissions and life expectancy in China. Their findings reported that trade increased CO2 emissions, which reduced life expectancy in China. They suggested that renewable energy may provide a clean environment and improve life expectancy. Some literature such as Cheng et al. (28) discussed health spending and health outcomes with different variables, including fiscal decentralization, trade and FDI. However, renewable energy and health association has been analyzed little in the literature. Therefore, this research contributes to the literature by adding the renewable energy implication for life expectancy, with the case of China.
Methodology
Model
We use the following model for the data analysis
Where LE shows the life expectancy, HE represents the health spending, GDP is the per capita income, Pop is the population, and REN shows the renewable energy consumption. The β1, β2, β3… βnrepresent the coefficients of the relevant variables and ε is the error term, which expected to be uncorrelated with the variable. Life expectancy determines by several factors such as per capita income (GDP), health spending (HE) and Renewable energy (REN). Therefore, we use life expectancy as dependent variable, while GDP, HE and REN are taken as explanatory variables. The population used as control variable in the model. The data for the relevant variables are obtained from the World Bank Development, the data is available in annual frequency, which has been converted into Quarter frequency using the Eviews software.
Methodology
The study adopts the Vector Error Correction Model, which assumes that all variables have same order of integration. The estimation of VECM performs under VAR framework, VAR analyzes the interrelationship between included variables in the system by taking lag values of the variables. Since we are using the long run time series data, it's essential to check the unit root properties of the variables. Unit root tests are usually used to find out if the variables are stationary, which could lead to spurious results. In time series, if the variance and mean of a variable remain constant over time, the series is referred to as stationary (i.e., it is not a random walk and does not have a unit root). Alternatively, the series is defined as non-stationary, which means that it has a unit root. There are different techniques used to test the unit root, Augment Ducky Fuller (AFD) and Ducky Fuller (DF) methods are used to estimate the stationary status of the variable. The Augumnetd Dickey and Fuller (ADF) (29) test of unit root is a modified form of Ducky Fuller (DF)(30). Following regression equations are used to test the unit root
These equations are estimated for the parameter value of γ, Yt is considered to be unit root or nonstationary. Dickey and Fuller (30) estimated H0: 0 by using the (trace) statistics critical value for hypothesis testing. In addition, error term in Dicky Fuller (DF) is assumed to be uncorrelated; however, if this assumption does hold and the error term is autocorrelated, then Dicky Fuller (DF) will be invalid and we may use Augmented Dicky Fuller (ADF) test, which augments the above equation by including the dependent variable's lag value. Furthermore, ADF test holds that Y is subject to an AR (n) process and assigned a (n)lag difference value of the response variable.
In the ADF unit root test, parameter Yt − 1 is tested by using Mackinnon's critical and t(tau) statistics values, if it becomes zero, it indicates the presence of unit root, indicating nonstationary in variable, and vice versa. Following to test the order of integration, we proceed to test the evidence of a long run relationship. The key requirement for testing Johansen cointegration is that all variables have integrated at the initial difference I(1). There are several ways for cointegration, including Engle and Granger (31) unit root test and Johansen (32, 33). However, Johansen cointegration provides several advantages as compared to Engel and Granger because Engel and Granger's method does not specify the number of vector(s), but Johansen tests provide information about the numbers of cointegration vectors. The Johansen test is calculated as follows:
In Johansen techniques, the error term is required to estimate likelihood ratios (LR) to determine the cointegrating vectors of Yt in the system. The first test is based on the hypothesis that the rank is equal to or smaller than the cointegrating vector (r), whereas the second is based on trace statistics.
The second test in cointegration provides a maximal Eigen value that tests the null hypothesis for the number of cointegrating vectors as follows:
Because the cointegration test is performed in a VAR setting, we use the Akike and Shward criterion to estimate the suitable lag length. If cointegration is detected, we can proceed to identify the short run deviation from the long run equation known as Error correction model(ECM) for the vectors.
β1,β2,β3….βn shows the short run coefficient of the variables included in the model, ECM lag presents the long causality. The short run causality can be estimated by imposing restrictions on the short run parameters under the Wald Test. In addition, we will use impulse response function and variance decomposition analysis to see the variations of included variables.
Results and discussion
This section provides the results and discussion of this paper. Since we're using long-term time series data, we are estimating the long association between the variables, therefore we used the Vector Error Correction Model (VECM) for our long-term analysis. Cointegration is a prerequisite for the VECM application, but before estimating the cointegration, we must analyze the order of integration. The ADF unit root test is applied for the order of integration. The ADF results are shown in Table 1.
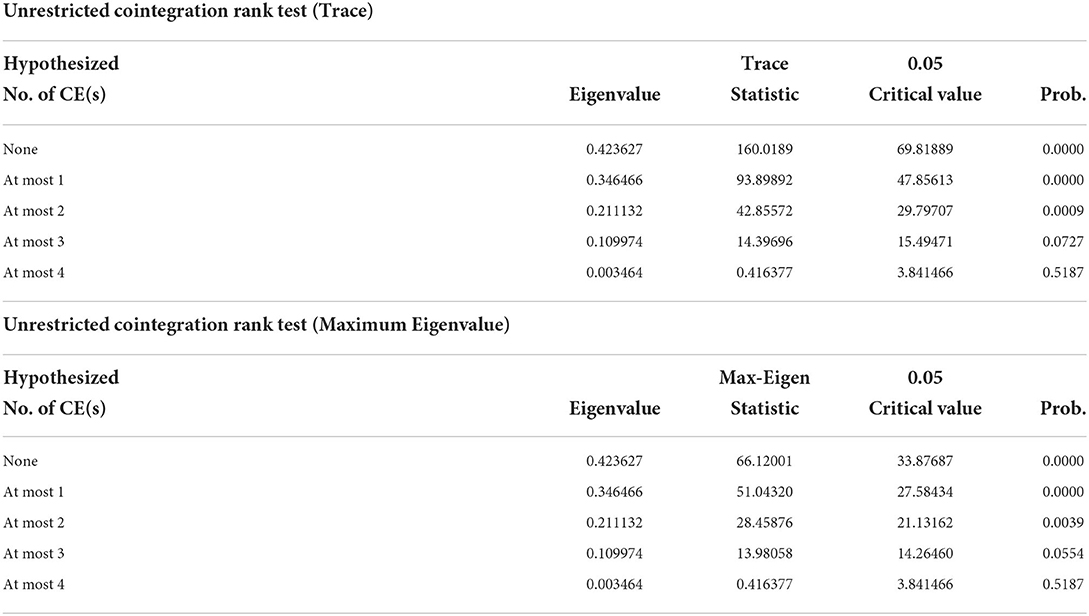
Table 1 shows the ADF estimations both at first level and at first difference. The outcomes indicate that all variables are non-integration at the first level, while after taking the first difference, it becomes stationary. This implies that all variables have the same order of integration; this fulfills the essential requirement of cointegration. The cointegration requires the selection of optimal lag length; we select the Schwarz information criterion (SC) and Akaike information criterion (AIC) to choose the optimal lag length. In Tables 2 and 3, the trace statistics and maximum eigenvalue both shows two cointegration vectors in the system. This means the existence of long run association between LE, HE, GDP, Pop and Renewable Energy consumption in China. It suggests that in the long run, health spending and renewable energy consumption determine the life expectancy in China.
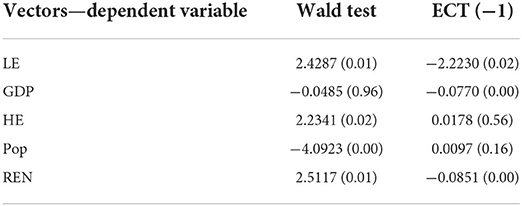
After cointegration test, we estimate the error correction model. Wald test estimations present the short run causality, while the lag value of ECT shows the long run causality. The ECM value is negative and significant in first model, where LE is the dependent variable while HE, GDP, POP and REN are independent variables. This implies that health spending improves life expectancy, and an increase in health spending improves life expectancy in China. This suggests the in the long run Chinese government increases life expectancy by increasing health spending. The short run finding also indicates that health spending also improves life expectancy. Similarly, renewable energy also increases life expectancy both in the short run and in the long run, which indicates that renewable energy consumption improves the quality of the environment, thus improving life expectancy both in short run and in the long run. The GDP could also improve life expectancy both in the short run and in the long run, which indicates that a rise in per capita income increases life expectancy. People with good income can access healthcare facilities that improve their health and life expectancy. The population also has long run and short run association with health spending.
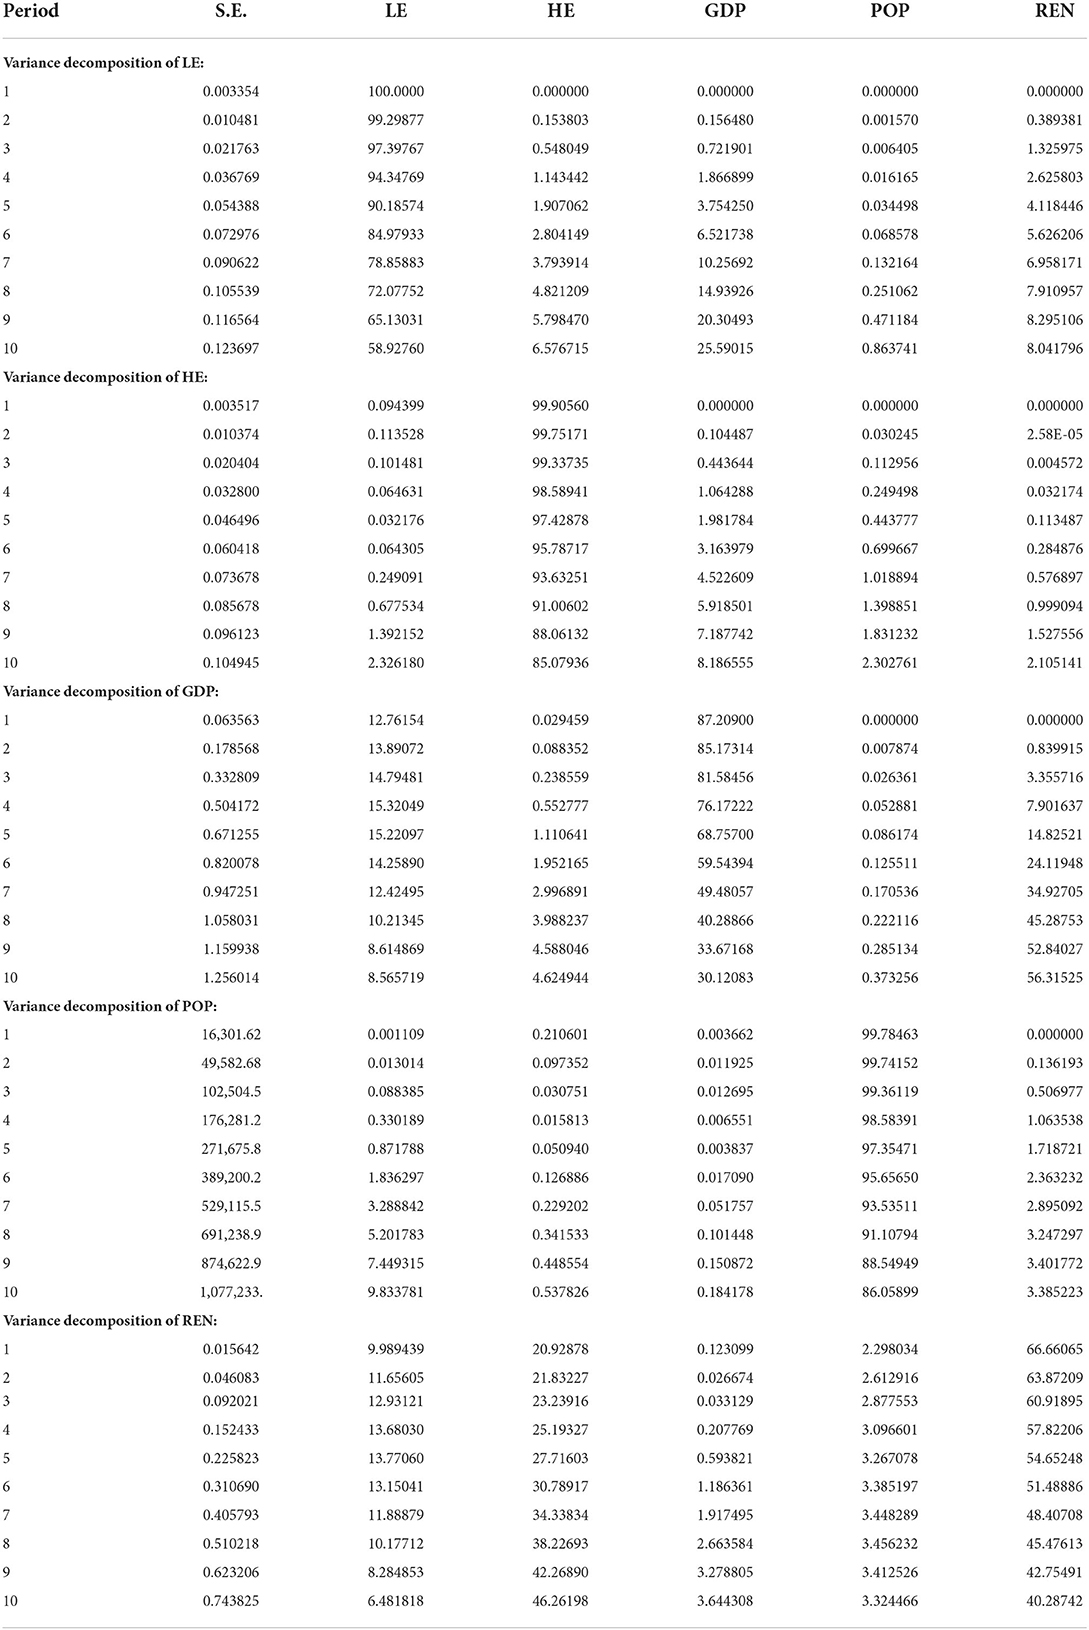
Table 4 presents the variance decomposition analysis, which shows a percentage of the error variation in the prediction for all variables. These variations arise from variable's own shocks as well as shocks in other variables within the system. The variance decomposition analysis of LE for the period 1-10 indicates that most variations in LE come from its own shocks. The second major contributor to the variations in LE is the GDP, in the 2nd period, it produces 0.15 variations in LE and gradually increases in the subsequent period, for example, in 10th period, GDP produces 25 percent of the variation in LE. HE variance decomposition findings show that in 2nd period it produces 0.15 percent of variations and gradually increases in the consequent periods for example, in the 10th period, it reaches 6.57 percent of variations. The RE contributes variations in LE and in the 2nd period, it produces 0.38 variations in LE, which gradually increase in the proceeding periods and in the 10th period it produces 8.29 variations in LE. The population produces a lower rate of variation and in 10th period, it only contributes 0.86, which is very low as compared to the other variables in the system.
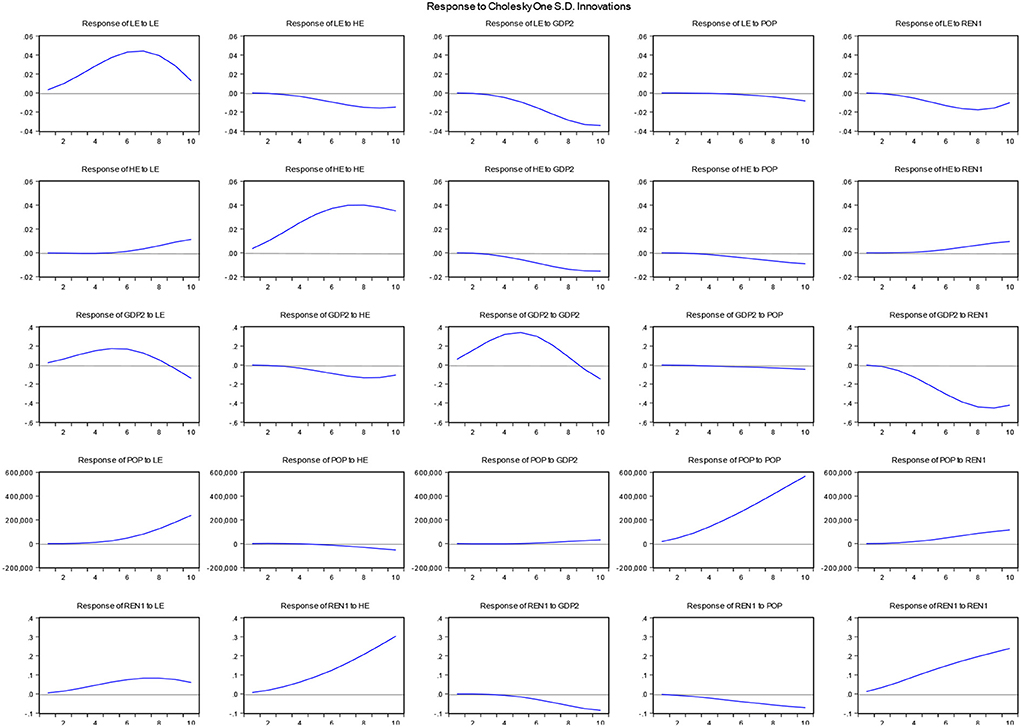
Variance decompositions do not provide information regarding the direction of variations in the system, but the impulse response can provide the direction information of the shocks, which is shown in Figure 4. The impulse response function (IRF) illustrates how a change in one variable's standard deviation affects the variations in other variables in the system. It predicts the ith variable innovation (residual) increase by one standard deviation at time t. The graph shows that HE has no effect or minor effect on the LE from 1-5 period; however, from 6th to 10th period HE holds a significant positive impact on LE. And one percent increase in standard deviation in LE has positive and increasing effect on the LE. The variation in GDP shows positive implications for LE from 1st to 8th period; however it become negative in the period of 8th-10th, this negative association may happen due to higher GDP growth increases environmental pollution mainly to industrialization and economic development, which increases the pollution and reduces LE. Population has positive implications for LE from 4th period to 10th period. The REN shows a positive effect on LE from 2nd period to 10th period. This validates the initial results, and it confirms that renewable energy leads to clean environment and improves life expectancy.
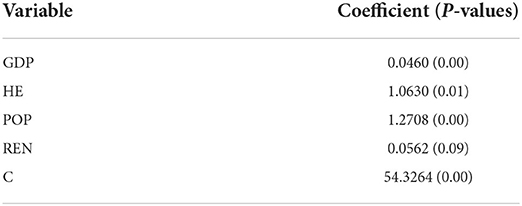
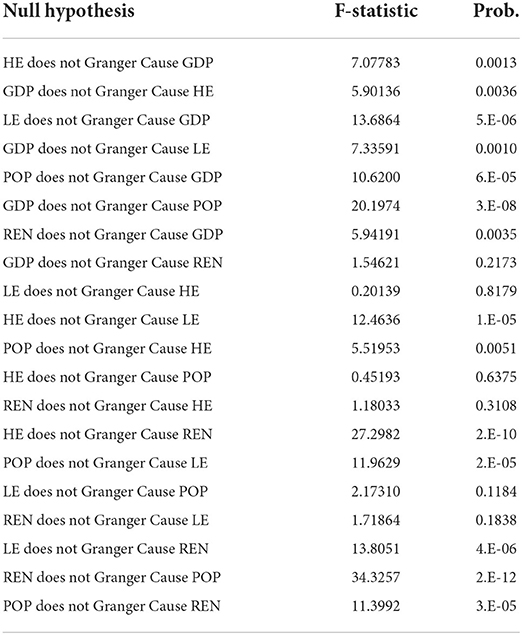
Tables 5, 6 represents the dynamic OLS and Granger Causality Test, which are used as robustness tests. The dynamic OLS model provides regression results regardless of existence of cointegration. The results show the positive and significant implications for the life expectancy. Health spending also has positive and significant implication for the life expectancy, while renewable energy has determine the life expectancy at 10 percent level. The granger causality test estimates bivariate, single variate, or no causality among the variables. The outcomes show that GDP, HE and REN causes LE. Both dynamic OLS and Granger Causality test validate the initial VECM findings. The results of this study support the past studies outcomes such as Kabir (12), Van den Heuvel and Olaroiu (22), Shah et al. (26) and Rodriguez-Alvarez (34).
Conclusion
The paper analyzes nexus between renewable energy, health spending and life expectancy in China for the period 2000–2020. We applied Vector Error Correction Method for empirical estimations. The life expectancy is used as dependent variable while health spending, GDP per captia, population growth and renewable energy as independent variables. The results of this study have some significant implications for public policy. Our results suggest long run association between health spending, renewable energy, GDP per capita and population. Government can improve life expectancy by increasing health spending in China both in the short run and in the long run. The unidirectional causality reports that government spending causes life expectancy in China both in the short run and in the long run. Therefore, the findings of this study suggest that government should increase health spending in order to improve life expectancy in China. The government may increase healthcare facilities such as setting up new healthcare unites especially in remote and rural areas to make sure that more people have access to the healthcare facilities. In addition, government may provide health insurance to the public and give people easier access to get the healthcare facilities. In addition, renewable energy could have positive implications on life expectancy. The renewable energy consumption has both short-run and long-run association with life expectancy. The consumption of renewable energy could provide clean environment and improve the life expectancy. It suggests that government should raise the production of the renewable energy production and provide incentives to increase renewable energy consumption. Furthermore, Investment in renewable energy consumption should be encouraged and Chinese government should provide subsides interest rate on loan to raise the investment in the renewable energy. The per capita income also improves life expectancy; therefore, economic development is an essential factor for higher life expectancy. Besides, government should make laws for the control of the air pollution to make people turn to renewable energy consumption. Government should provide subsidies on medicine to reduce the pocket heath expenses.
Finally, there are several directions for our study in the future. First, since we used the data for 2000–2020 period in this paper, and it can be expanded by more data with availability in the future. Second, we may use different countries for the data analysis in the subsequent studies. Third, we can consider the social changes and demographic changes in medical care that may affect the health status of the country.
Data availability statement
The original contributions presented in the study are included in the article/supplementary material, further inquiries can be directed to the corresponding authors.
Author contributions
Writing—original draft: HL. Review and editing: KZ. Both authors contributed to the article and approved the submitted version.
Conflict of interest
The authors declare that the research was conducted in the absence of any commercial or financial relationships that could be construed as a potential conflict of interest.
Publisher's note
All claims expressed in this article are solely those of the authors and do not necessarily represent those of their affiliated organizations, or those of the publisher, the editors and the reviewers. Any product that may be evaluated in this article, or claim that may be made by its manufacturer, is not guaranteed or endorsed by the publisher.
References
1. Gallet CA, Doucouliagos H. The impact of healthcare spending on health outcomes: a meta-regression analysis. Soc Sci Med. (2017) 179:9–17. doi: 10.1016/j.socscimed.2017.02.024
2. Han M, Rizzo, J. The Health Returns to Medical Expenditures: Does Age Matter. (2017) Available online at: http://www.hec.ca/iea/seminaires/121113_john_rizzo.pdf.
3. Kim TK, Lane SR. Government health expenditure and public health outcomes: a comparative study among 17 countries and implications for US health care reform. Am Int J Contemp. (2013) 3:8–13. Available online at: https://www.researchgate.net/publication/271525637_Government_health_expenditure_and_public_health_outcomes
4. Ullah I, Ullah A, Ali S, Poulova P, Akbar A, Shah MH, et al. Public health expenditures and health outcomes in Pakistan: evidence from quantile autoregressive distributed lag model. Risk Manag Healthc Policy. (2021) 14:3893. doi: 10.2147/RMHP.S316844
5. Ali A, Ahmad K. The impact of socio-economic factors on life expectancy for sultanate of Oman: an empirical analysis. Middle East J Sci Res. (2014) 22:218–24. Available online at: http://www.healthfinancejournal.com/~junland/index.php/johcf/article/view/6
6. Akinci F, Hamidi S, Suvankulov F, Akhmedjonov A. Examining the impact of health care expenditures on health outcomes in the middle East and N. Africa. J Health Care Finance. (2014) 41. Available online at: http://www.healthfinancejournal.com/~junland/index.php/johcf/article/view/6
7. Poullier JP, Hernandez P, Kawabata K, Savedoff W. Patterns of global health expenditures: results for 191 countries. In:Murray CJ, Evans DB, , eds. Health Systems Performance Assessment: Debates, Methods, and Empricism. Geneva: World Health Organisation. (2003) p. 195–203.
8. Shah MI, Ullah I, Xingjian X, Haipeng H, Rehman A, Zeeshan M, et al. Modeling trade openness and life expectancy in China. Risk Manag Healthc Policy. (2021) 14:1689. doi: 10.2147/RMHP.S298381
9. Sung B, Park S-D. Who drives the transition to a renewable-energy economy? Multi-actor perspective on social innovation. Sustainability. (2018) 10:448. doi: 10.3390/su10020448
10. Murthy U, Shaari MS, Mariadas PA, Abidin NZ. The relationships between CO 2 emissions, economic growth and life expectancy. J Asian Finance, Econ Busi. (2021) 8:801–8.
11. Caruso G, Colantonio E, Gattone SA. Relationships between renewable energy consumption, social factors, and health: a panel vector auto regression analysis of a cluster of 12 EU countries. Sustainability. (2020) 12:2915. doi: 10.3390/su12072915
12. Kabir M. Determinants of life expectancy in developing countries. J Dev Areas. (2008) 41:185–204. doi: 10.1353/jda.2008.0013
13. Ullah I, Ali S, Shah MH, Yasim F, Rehman A, Al-Ghazali BM. Linkages between trade, CO2 emissions and healthcare spending in China. Int J Environ Res Public Health. (2019) 16:4298. doi: 10.3390/ijerph16214298
14. Ullah I, Rehman A, Khan FU, Shah MH, Khan F. Nexus between trade, CO2 emissions, renewable energy, and health expenditure in Pakistan. Int J Health Plann Manage. (2020) 35:818–31. doi: 10.1002/hpm.2912
15. Yip W, Fu H, Chen AT, Zhai T, Jian W, Xu R, et al. 10 years of health-care reform in China: progress and gaps in universal health coverage. Lancet. (2019) 394:1192–204. doi: 10.1016/S0140-6736(19)32136-1
16. Long Q, Xu L, Bekedam H, Tang S. Changes in health expenditures in China in 2000s: has the health system reform improved affordability. Int J Equity Health. (2013) 12:1–8. doi: 10.1186/1475-9276-12-40
17. International Energy Association. (2020). Available online at: https://www.iea.org/fuels-and-technologies/renewables
18. Lubitz J, Cai L, Kramarow E, Lentzner H. Health, life expectancy, and health care spending among the elderly. N Engl J Med. (2003) 349:1048–55. doi: 10.1056/NEJMsa020614
19. Zeeshan M, Han J, Rehman A, Ullah I, Afridi FEA. Exploring asymmetric nexus between CO2 emissions, environmental pollution, and household health expenditure in China. Risk Manag Healthc Policy. (2021) 14:527. doi: 10.2147/RMHP.S281729
20. Owumi BE, Eboh A. An assessment of the contribution of healthcare expenditure to life expectancy at birth in Nigeria. J Public Health. (2021). doi: 10.1007/s10389-021-01546-6
21. Shahbaz M, Loganathan N, Mujahid N, Ali A, Nawaz A. Determinants of life expectancy and its prospects under the role of economic misery: a case of Pakistan. Soc Indic Res. (2016) 126:1299–316. doi: 10.1007/s11205-015-0927-4
22. Van den Heuvel WJ, Olaroiu M. How important are health care expenditures for life expectancy? A comparative, European analysis. J Am Med Dir Assoc. (2017) 18:276. e9–276. e12. doi: 10.1016/j.jamda.2016.11.027
23. Jakovljevic MB, Vukovic M, Fontanesi J. Life expectancy and health expenditure evolution in Eastern Europe—DiD and DEA analysis. Expert Rev Pharmacoecon Outcomes Res. (2016) 16:537–46. doi: 10.1586/14737167.2016.1125293
24. Anderson GF, Poullier J-P. Health spending, access, and outcomes: trends in industrialized countries: even with managed care and government efforts to control growth, US health spending per capita grew more rapidly in the 1990s than did spending in the average industrialized country. Health Aff. (1999) 18:178–92. doi: 10.1377/hlthaff.18.3.178
25. Giang TT. Impact of Public Private Health Spending on Life Expectancy in the European Union. (2015) Available online at: https://www.academia.edu/download/45666406/03_Life_Expectancy.pdf
26. Shah MH, Salem S, Ahmed B, Ullah I, Rehman A, Zeeshan M, et al. Nexus between foreign direct investment inflow, renewable energy consumption, ambient air pollution, and human mortality: a public health perspective from non-linear ARDL Approach. Frontiers in Public Health. (2022) 9:814208. doi: 10.3389/fpubh.2021.814208
27. Ibrahim RL, Julius OO, Nwokolo IC, Ajide KB. The role of technology in the non-renewable energy consumption-quality of life nexus: insights from sub-Saharan African countries. Econ Change Restructur. (2022) 55:257–84. doi: 10.1007/s10644-020-09312-6
28. Cheng L, Liu H, Zhang Y, Shen K, Zeng Y. The impact of health insurance on health outcomes and spending of the elderly: evidence from China's new cooperative medical scheme. Health Econ. (2015) 24:672–91. doi: 10.1002/hec.3053
29. Dickey DA, Fuller WA. Likelihood ratio statistics for autoregressive time series with a unit root. Econometrica. (1981) 1057–72. doi: 10.2307/1912517
30. Dickey DA, Fuller WA. Distribution of the estimators for autoregressive time series with a unit root. J Am Stat Assoc. (1979) 74:427–31. doi: 10.1080/01621459.1979.10482531
31. Engle RF, Granger CW. Co-integration and error correction: representation, estimation, and testing. Econometrica. (1987) 251–76. doi: 10.2307/1913236
32. Johansen S. Estimation and hypothesis testing of cointegration vectors in Gaussian vector autoregressive models. Econometrica. (1991) 59:1551–80. doi: 10.2307/2938278
33. Johansen S. Identifying restrictions of linear equations with applications to simultaneous equations and cointegration. J Econom. (1995) 69:111–32. doi: 10.1016/0304-4076(94)01664-L
Keywords: health spending, China, VECM approach, life expectancy, renewable energy
Citation: Liu H and Zhong K (2022) Relationship between health spending, life expectancy and renewable energy in China: A new evidence from the VECM approach. Front. Public Health 10:993546. doi: 10.3389/fpubh.2022.993546
Received: 13 July 2022; Accepted: 05 September 2022;
Published: 20 October 2022.
Edited by:
Suleman Sarwar, Jeddah University, Saudi ArabiaReviewed by:
Muhammad Zeeshan, Liaoning Technical University, ChinaIrfan Ullah, Nanjing University of Information Science and Technology, China
Copyright © 2022 Liu and Zhong. This is an open-access article distributed under the terms of the Creative Commons Attribution License (CC BY). The use, distribution or reproduction in other forums is permitted, provided the original author(s) and the copyright owner(s) are credited and that the original publication in this journal is cited, in accordance with accepted academic practice. No use, distribution or reproduction is permitted which does not comply with these terms.
*Correspondence: Hui Liu, bGl1aHVpMjAyMjA3MDVAMTYzLmNvbQ==; Kaiyang Zhong, emhvbmdreUBzbWFpbC5zd3VmZS5lZHUuY24=
 Hui Liu
 Kaiyang Zhong