 Elvira Mauz1*†
 Lena Walther1†
 Stephan Junker1
 Christina Kersjes1
 Stefan Damerow1Sophie Eicher1Heike Hölling1Stephan Müters1
 Diana Peitz1Susanne Schnitzer2Julia Thom1
- 1Department of Epidemiology and Health Monitoring, Robert Koch Institute, Berlin, Germany
- 2Institute of Medical Sociology and Rehabilitation Science, Charité-Universitätsmedizin, Berlin, Germany
Background: Times of crisis such as the COVID-19 pandemic are expected to compromise mental health. Despite a large number of studies, evidence on the development of mental health in general populations during the pandemic is inconclusive. One reason may be that representative data spanning the whole pandemic and allowing for comparisons to pre-pandemic data are scarce.
Methods: We analyzed representative data from telephone surveys of Germany's adults. Three mental health indicators were observed in ~1,000 and later up to 3,000 randomly sampled participants monthly until June 2022: symptoms of depression (observed since April 2019, PHQ-2), symptoms of anxiety (GAD-2), and self-rated mental health (latter two observed since March 2021). We produced time series graphs including estimated three-month moving means and proportions of positive screens (PHQ/GAD-2 score ≥ 3) and reports of very good/excellent mental health, as well as smoothing curves. We also compared time periods between years. Analyses were stratified by sex, age, and level of education.
Results: While mean depressive symptom scores declined from the first wave of the pandemic to summer 2020, they increased from October 2020 and remained consistently elevated throughout 2021 with another increase between 2021 and 2022. Correspondingly, the proportion of positive screens first decreased from 11.1% in spring/summer 2019 to 9.3% in the same period in 2020 and then rose to 13.1% in 2021 and to 16.9% in 2022. While depressive symptoms increased in all subgroups at different times, developments among women (earlier increase), the youngest (notable increase in 2021) and eldest adults, as well as the high level of education group (both latter groups: early, continuous increases) stand out. However, the social gradient in symptom levels between education groups remained unchanged. Symptoms of anxiety also increased while self-rated mental health decreased between 2021 and 2022.
Conclusion: Elevated symptom levels and reduced self-rated mental health at the end of our observation period in June 2022 call for further continuous mental health surveillance. Mental healthcare needs of the population should be monitored closely. Findings should serve to inform policymakers and clinicians of ongoing dynamics to guide health promotion, prevention, and care.
1. Introduction
The COVID-19 pandemic poses a serious threat to mental health. Shortly after the World Health Organization declared the SARS-CoV-2 outbreak a global pandemic on March 11, 2020 (1), alarms were sounded over a potential concomitant mental health crisis (2–4). A secondary pandemic in the form of a “tsunami of mental disorders” was expected, for example by the British Psychiatric Association (5). These assumptions were based on empirical evidence of population-wide increases in mental health risks associated with previous infectious outbreaks such as Ebola, influenza, and SARS (6–8), natural disasters (9), and economic crises (10, 11). Stressors accompanying infectious outbreaks include the experience of uncertainty and anxiety, threats or damage to physical health, and potentially traumatic experiences such as the loss of loved ones. In addition to effects of the disease itself, nonpharmaceutical interventions (NPIs) to mitigate the spread of infections are discussed as contributing to mental health deterioration. As NPI-associated risk factors in the COVID-19 pandemic, the literature highlights isolation and quarantine (12, 13), an increase in domestic violence (14), and a lack of social connectedness during contact restrictions (15). Moreover, NPIs may lead to the loss of protective factors for mental health such as social and recreational activities and access to healthcare (16). In addition to these individual-level factors, societal-level mental health risks such as economic strain resulting in increased unemployment and the risk of widening social inequality are likely to arise from the pandemic (16–18). Against this background, the COVID-19 pandemic is considered a multidimensional and now chronic stressor continuously putting the mental health of populations at risk (16, 19).
Like most countries, Germany has been hit by multiple waves of rising COVID-19 incidence and mortality as well as NPIs in response, which might relate to mental health dynamics temporally. Taking various epidemiological, healthcare- and policy-related parameters into account, the course of the pandemic in Germany can retrospectively be divided into eight phases (see Figure 1) (20–24). After the first confirmed SARS-CoV-2 infection on 27th January, 2020, a nationwide first wave of infections followed (March to May 2020). NPIs were put in place, resulting in an extensive lockdown which comprised travel and contact restrictions (gatherings of more than 2 people not permitted), working from home, closed leisure facilities, childcare facilities, schools, shops and restaurants (25). A milder interim period of low case numbers referred to as a “summer plateau” (20, 23) followed from May to September 2020. From October 2020 to February 2021 a second, more severe wave with a peak in deaths (highest in the whole pandemic thus far) and hospitalizations (highest in this study's observation period) (26) unfolded, again met by several NPIs and the beginning of the vaccination campaign (24). A second “partial” shutdown from the beginning of November 2020 (27) was initially less restrictive than the first (e.g., contact with one other household, leisure time facilities closed, restaurants closed). Measures were intensified in mid-December, with closed shops, childcare facilities, and schools, and working from home where possible (28). This shutdown went on until March 2021, when a stepwise reopening was decided upon (29). After a brief period of declining case numbers, a third wave emerged from March to June 2021, albeit with fewer hospitalizations and far fewer deaths. During this time, NPIs varied substantially between federal states (30). Another short summer plateau in 2021 (June to July) was followed by a fourth wave of infections from August to December 2021 (21). With regard to COVID-19 incidence, the fourth wave was the most severe up to that point with a nearly 10-fold number of average cases per day compared to the first wave and a nonstop transition into wave five, which began in December 2021 (21–23) and was characterized by the highly contagious omicron variant with even higher infection rates (22, 25). Data on case numbers shows the largest peak to date in spring 2022 (31), with hospitalizations between about 75 to 95% of those seen in winter 2020/2021 but deaths at only about a fifth to a quarter of this peak (29). NPIs were characterized by restrictions in or mandatory tests for access to shops and leisure facilities as well as general contact restrictions for those who were neither vaccinated nor recovered from COVID-19 from autumn 2021 (32) to spring 2022. From December 2021 to end of January 2022, contact restrictions for vaccinated and recovered individuals were also put in place (33). NPIs were eased between February and March 2022 (34) and largely lifted in most German federal states at the beginning of April 2022 (35). Russia's invasion of Ukraine on 24th February, 2022, marks a further major event in this time and the beginning of another crisis on a global scale that might affect mental health dynamics.
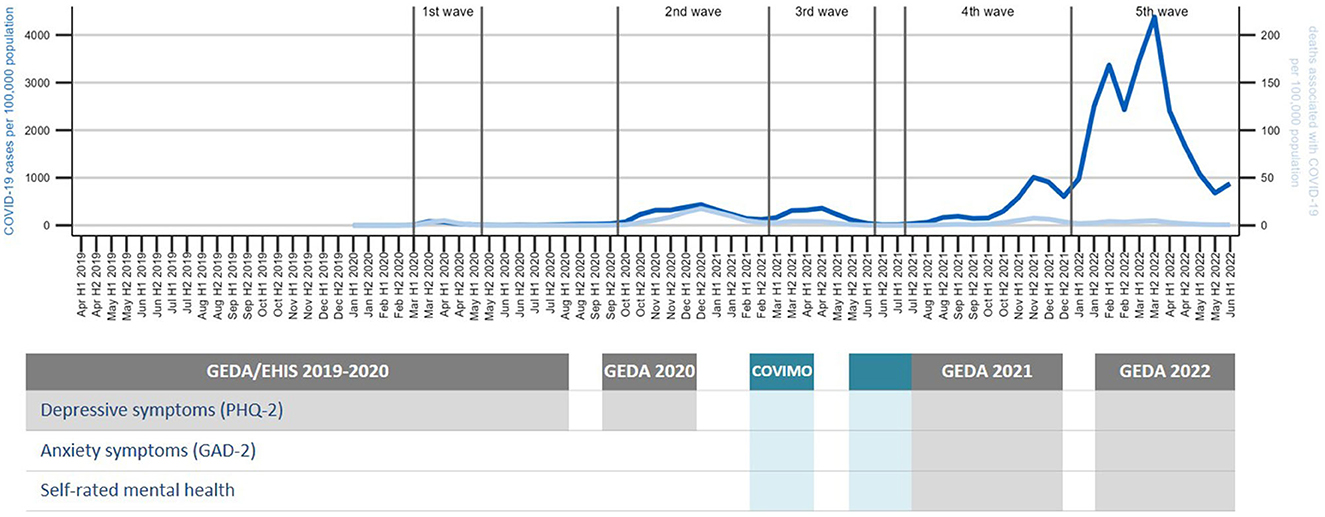
Figure 1. Data sources used in analyses over the course of the COVID-19 pandemic. Sums of COVID-19 cases and associated deaths per 100,000 adults as reported to the Robert Koch Institute by health authorities were calculated per first (H1) and second half (H2) of the month. Data collection periods for surveys and indicators used in study shown as gray (GEDA data) and blue (COVIMO data) bars; hatched area represents overlap in data collection between surveys.
Despite the well-founded expectation of a mental health crisis, evidence on changes in mental health of adults during COVID-19 pandemic is (still) inconclusive. Turning first to international research, reviews point to a broad heterogeneity in current findings. While some reviews conducted early in the pandemic conclude that there was an increase in depressive and anxiety symptoms (36, 37), others found quick subsequent decreases or stable symptoms in general populations (38). A later review and meta-analysis reports no changes (39). One review summarizes a most likely ‘big picture’ (38) emerging from heterogeneous findings: symptom increases compared to pre-pandemic data during first lockdowns followed by declines as restrictions are eased, but not down to pre-pandemic levels (40). As findings accumulate, inconsistencies are growing, while the trajectory of manifest mental disorders remains an open question (41). A recent umbrella review based on 81 systematic reviews on global mental health trends during the pandemic evaluates the current state of research as follows: “Despite high volumes of reviews, the diversity of findings and dearth of longitudinal studies within reviews means clear links between COVID-19 and mental health are not available, although existing evidence indicates probable associations” [(42), p. 2].
The existing literature from Germany prohibits clear conclusions as well. In a rapid review including 68 records published until mid-2021, we found study outcomes to be associated with the suitability of the data used for assessing changes in the general population reliably with regard to sampling methods and comparability of observation periods (43). While studies with particularly suitable research designs showed mixed results on the overall development of mental health in Germany, studies with more bias-prone designs predominantly reported deteriorating mental health. Importantly, two thirds of the reviewed studies are based on data collected during the first wave and the summer plateau of 2020, when COVID-19 incidence was comparatively low in Germany (43). The few studies that address the later course of the pandemic find an elevated frequency of depressive symptoms in the first months of 2021 (44, 45) or of depressive and anxiety symptoms into later 2020 (45, 46) compared to pre-pandemic data and an increase in mental distress (47) but a decrease in depressive and anxiety symptoms (45) in the second wave compared to the first wave. Further results from representative surveys spanning the whole pandemic period and allowing for comparisons to pre-pandemic baseline data are needed in order to adequately assess the mental health impact of the pandemic in the general population in Germany.
Mental health developments in the pandemic may also vary by population subgroups. Although social inequalities in mental health already existed in non-pandemic times (48), there is evidence that they were aggravated by the COVID-19 pandemic (16, 19, 49, 50). As expected, the widely observed gender gap resulting in mental health disadvantages for women compared to men was found to have worsened across a majority of studies [e.g., 49, 51, 52]. A comprehensive meta-analysis on gender equality in the pandemic globally attributes this to unequally distributed pandemic-related risk factors such as an increase in domestic violence, increased childcare responsibilities, and financial losses (53). With regard to age and life stages, concerns have been raised for the mental wellbeing of the elderly due to the increased risk of severe COVID-19 disease progression (16, 19) and increased risk of loneliness and isolation due to a greater need for social distancing (19) in this group. However, increases in psychological distress and symptoms of mental illness have been predominantly reported for the youngest adults in particular (41, 49, 51, 54–57). One potential explanation is a larger impact of restrictions with a stronger disruptive effect in this transitional life phase (58). In Germany, women and younger adults have also been repeatedly observed to be more severely affected than men and other age groups (57, 59–62). By contrast, international empirical findings regarding socioeconomic groups and mental health during the COVID-19 pandemic have been inconsistent despite cumulative risks of individuals with a low socioeconomic status (SES). They face a greater risk of severe infection and death from COVID-19 (49, 50) and economic stressors such as financial insecurity, reduced working hours, and income or job loss (63, 64). Previous studies from different countries have shown mixed results, including low SES as a risk factor for depression and anxiety (65, 66), no association between SES and mental health (67, 68), and individuals with higher SES at a greater risk of worsening mental health in the pandemic (52, 59, 62, 69, 70). These discrepancies may be due to national contextual differences. Also, risk and resilience factors may change over time as circumstances change, calling for Germany-specific results on mental health by subgroup over the course of the pandemic.
The dynamic nature of the COVID-19 pandemic and its high relevance to all areas of public health created specific informational needs with regard to the mental health of the population. Specifically, it calls for a public health surveillance approach (71) involving continuous observation and timely reporting of updated time trends as the basis for planning, implementing, and evaluating interventions to protect and promote the health of the population (72). Accordingly, public health authorities have set up ongoing population surveys in order to monitor mental health trends at high frequency and serve as an early warning system, for example in the US (73) and UK (74). In Germany, pre-pandemic mental health monitoring focused on the estimation of 12-month-prevalences of varying mental health indicators, based on health interview and health examination surveys conducted at perennial intervals [e.g., (75–79)]. In 2019, the Federal Ministry of Health commissioned the Robert Koch Institute (RKI) to establish a national Mental Health Surveillance in order to provide systematic and continuous evidence on the mental health of the population. As a conceptual foundation, core indicators for public mental health were identified (80) and prioritized by national stakeholders (81), integrating international expertise (82). With the onset of COVID-19 pandemic, first indicators from the comprehensive set had already been implemented in the running field work of the survey “German Health Update (GEDA)” (78). As the pandemic progressed, further measures were added to GEDA as well as to “COVID-19 vaccination rate monitoring in Germany (COVIMO)” (83). This representative data from ~1,000 respondents per month, and, as of 2022, 3,000 per month for some indicators, makes tracking the development of several mental health indicators in the German population in high-frequency cross-sectional time series possible, addressing some of the above-mentioned research gaps.
In the present study we analyze month-by-month time series for symptoms of common mental disorders (depressive symptoms and anxiety symptoms) as well as an indicator of positive mental health (self-rated mental health) in order to address the following three research questions: (1) How did depressive symptoms develop between April 2019 and June 2022 in the adult population in Germany? (2) Did developments of depressive symptoms in the observation period differ by gender, age, and level of education? If so, did mental health differences between subgroups vary over time? (3) How did symptoms of anxiety disorders and self-rated mental health develop between March 2021 and June 2022? Importantly, we examine both mean depressive and anxiety symptom scores and proportions of the population screening positive for possible depressive or anxiety disorder. This allows us to distinguish between developments in symptom severity at the population level and changes in the percentage of the population with potentially clinically relevant symptom levels, both of which are important public health indicators (84).
2. Materials and methods
2.1. Data
2.1.1. Surveys
Figure 1 maps the data collection periods for the two surveys and three indicators used in this study onto the phases of the COVID-19 pandemic in Germany. At the start of the COVID-19 pandemic, the third survey wave of the European Health Interview Survey as part of the study “German Health Update” (GEDA 2019/2020-EHIS) for Germany (78) had been in the survey phase conducting telephone interviews since April 2019. This survey included the screening questionnaire PHQ-8 (85), which comprises its abbreviated version PHQ-2 (86), as a measure of depressive symptoms.
The survey was originally not designed for monthly reporting; however, slight adjustments of the sample weighting permitted first analyses of the development of various health indicators in the months preceding the pandemic as well as the first months of the pandemic (87). Given the new informational needs arising from the pandemic, the survey was continued until the beginning of January 2021. After the end of GEDA 2019/2020, short inventories assessing mental health indicators, including the PHQ-2 (86), the GAD-2 (88), and a self-rated mental health (SRMH) item (89) were integrated into a running population-based telephone survey from mid-March to mid-July 2021 with a one-month data collection gap from mid-May to mid-June. This survey, the “COVID-19 vaccination rate monitoring in Germany (COVIMO),” was designed to be sampled on a monthly basis (83). From July 2021 until December 2021 and February until June 2022 (with a data gap in January 2022), continuous monthly interviews were carried out within the frameworks of GEDA 2021 and GEDA 2022 (90), respectively (see Figure 1).
The GEDA surveys and COVIMO were conducted on behalf of the Federal Ministry of Health of Germany. Data was collected by an external market and social research institute (USUMA GmbH). Study design, data collection, and sampling were largely the same across these different surveys, and based on a dual frame approach of mobile and landline numbers. The study population differs between the GEDA surveys and COVIMO, as GEDA targets people aged 15 or older living in private households whose main residence is in Germany (78), whereas COVIMO includes only people aged 18 or older (83). In addition, there is a slight difference in the general content focus of the studies (general health survey in GEDA versus vaccination monitoring in COVIMO). Details of the data pipeline, which cover semi-automated data preparation, data merging, and output creation as well as a description of sample weighting can be found elsewhere (91). We examined potential study-related differences between the GEDA surveys and COVIMO in the indicators of interest: Distributions of outcome variable scores were compared between studies in their one overlapping month using boxplots and violin plots (results not shown). No pronounced differences were detected.
2.1.2. Participants
Across the entire survey period, 45,102 participants aged 18 or older were included in the analyses. The distributions by gender, age, and level of education in the different surveys are shown in Table 1, number of monthly cases are shown in Supplementary Figure A1. The GEDA-EHIS 2019, GEDA 2020, 2021, and COVIMO studies surveyed ~1,000 participants per month. GEDA 2022 provided data for 3,000 participants per month. To reduce data gaps, the second half of each month was combined with the first half of the following month across the observation period.
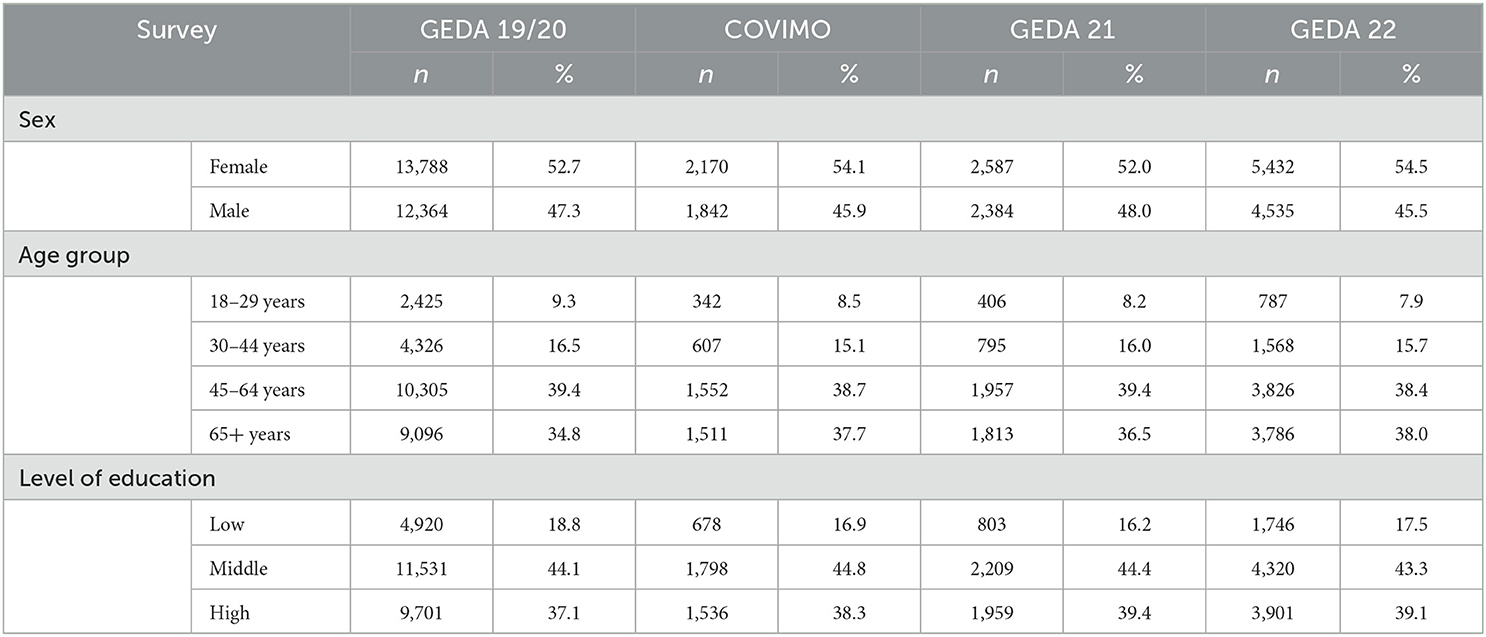
Table 1. Sample composition.
2.2. Indicators of mental health status
2.2.1. Depressive symptoms
Depressive symptoms were observed prior to and during the pandemic using monthly data from beginning of April 2019 until mid-June 2022 (see Figure 1). There were four short data gaps (the largest between January and mid-March 2021). The indicator was measured with the established ultra-brief screening instrument “Patient Health Questionnaire-2” (PHQ-2) (86), which has been found to perform well as a screening tool for depressive disorders in the German general population (92). The PHQ-2 captures the frequencies of two core symptoms of depressive disorders, asking, “Over the last 2 weeks, how often have you been bothered by the following problems?”: (1) “little interest and pleasure in doing things” (2) “feeling down, depressed or hopeless” (possible responses: 0 = “not at all,” 1 = “several days,” 2 = “more than half the days,” 3 = “nearly every day”). The total score of the PHQ-2 ranges from 0 to 6 (“no symptoms” to “severe symptoms”). According to scoring recommendations (92), scores ≥ 3 represent a positive screen for possible depressive disorder and indicate a potential need for further diagnostic assessment. In our analytical sample, the internal consistency of the PHQ-2 is α = 0.73 [standardized alpha coefficient as recommended for two items (93), unstandardized α = 0.72], slightly higher than in a comparable German sample (45). Two measures are reported in the current study: (1) the mean depressive symptom score, which tracks changes in the mean severity of symptoms in the population (73); (2) the proportion of the adult population screening positive for possible depressive disorder.
2.2.2. Symptoms of anxiety
Symptoms of anxiety were observed monthly from mid-March 2021 to mid-June 2022 (see Figure 1) with two short data gaps (mid-May 2021 to mid-June 2021 and January 2022). The indicator was measured with the established ultra-brief screening instrument “Generalized Anxiety Disorder-2” (GAD-2), which has been found to perform well as a screening tool for anxiety disorders in the German general population (88). The GAD-2 captures the frequency of two core symptoms of anxiety disorders, asking, “Over the last 2 weeks, how often have you been bothered by the following problems?”: (1) “feeling nervous, anxious or on edge” (2) “not being able to stop or control worrying” (possible responses: 0 = “not at all,” 1 = “several days,” 2 = “more than half the days,” 3 = “nearly every day”). The total score of the GAD-2 ranges from 0 to 6 (no symptoms to severe symptoms). Scores ≥ 3 represent a positive screen for possible anxiety disorder, including generalized anxiety disorder, panic disorder, social anxiety disorder, and posttraumatic stress disorder (88). In our analytical sample, the internal consistency of the GAD-2 is α = 0.67 (standardized alpha unstandardized α = 0.66), almost the same value as in a comparable German sample (45). Just as with depressive symptoms, two measures are reported: (1) the mean anxiety symptom score and (2) the proportion of the adult population screening positive for possible anxiety disorder.
2.2.3. Self-rated mental health
SRMH was observed monthly from mid-March 2021 to mid-June 2022 (see Figure 1) with two short data gaps (mid-May 2021 to mid-June 2021 and January 2022). It was measured using the question: “How would you describe your overall mental health?” (possible responses: 5 = “excellent,” 4 = “very good,” 3 = “good,” 2 = “fair,” 1 = “poor”). The single item is an established way to measure SRMH in population based surveys (89). SRMH has been found to represent a dimension of mental health that is qualitatively distinct from psychopathology (94). Here and elsewhere (58) it is employed as a measure of positive mental health. Two measures are reported: (1) population mean SRMH score; (2) the proportion of the adult population rating their mental health as “very good” or “excellent,” following previous categorization to identify the presence of positive mental health (58).
2.3. Sociodemographic variables used to measure mental health inequalities
Results are presented separately for women and men. For this purpose, respondents' information on the sex noted in their birth certificate was used. Information on gender could not be used in the present analyses, since the data for the evaluations are adjusted to the marginal distributions of the official reference statistics [source: Microcensus (95)], which lacks information on gender identity.
Four age groups were formed to capture young adulthood, different stages of middle age, and the ages of an increased risk of severe COVID-19 infection: 18–29, 30–44, 45–64, and 65 years and older.
Educational levels according to the CASMIN classification (“Comparative Analyses of Social Mobility in Industrial Nations”) were used as an indicator of socioeconomic status (96). Three groups with low, medium, and high levels of education are distinguished on the basis of school and vocational qualifications.
2.4. Statistical analysis
All analyses were conducted in R version 4.1.2 and Stata /SE 17.0.
2.4.1. Estimation of moving three-month averages and smoothing curves
In order to assess mental health developments over time in the general population and by subgroup, we calculated time series of estimates along with smoothing curves to be represented graphically [for details, see (91)]. Our aim was to achieve high temporal resolution whilst working with sample size restrictions and also to smooth random fluctuations. The estimation procedure described below also ensures that possible fluctuations in distributions of sex, age, and level of education in the sample over time are corrected for and that stratified results are standardized for the other main sociodemographic characteristics.
For each of the three mental health indicators, linear and logistic regressions were used to predict a time series of means and proportions for the adult population in Germany. To handle low cell counts and reduce volatility over time, we estimated centered moving averages rather than monthly averages (97) using weighted data from three-month windows. Some three-month windows only included data from 2 months due to data gaps. The three-month windows move in steps of 1 month. The models for each three-month window regress the mental health indicators on sex, age group, and level of education, and interactions between them. While the linear models include all possible interaction terms, only all possible two-way interactions of the covariates but not the three-way interactions were included in the logistic regression models to avoid problems resulting from empty cells. Nonetheless, there were some empty cells around data gaps, where estimates are based on data from two rather than 3 months, resulting in estimation gaps in the time series of categorical PHQ-2 and GAD-2 estimates.
These regression models are the foundation for standardization for sex, age, and level of education between the three-month windows, which ensures that different distributions of these characteristics between them do not influence the results. For standardization, we calculated averaged predictions in a two-step process. First, we used the models to perform predictions on a standard population. To calculate arithmetic means of mental health indicator scores, we used the model estimates from the linear regressions and predicted the expected values of the indicator in question. To calculate proportions for categorical indicator outcomes, we predicted the expected probabilities. In a second step we averaged over all of the predictions. The standard population was calculated using data from the Microcensus 2018 (95), which approximates Germany's population in 2018.
The calculation of estimates for time series stratified by sex, age, and level of education was similar to the procedure described above. However, in order to exclude different distributions of the respective other two characteristics in different time periods as explanatory factors for temporal developments, stratified results by age group, sex, or level of education were standardized by the remaining two characteristics in the prediction step. For example, the results stratified by age group were standardized for sex and education. This was achieved by making predictions for every subgroup as if all observations in the standard population belonged to this subgroup. The standardization between subgroups means that the subgroup-specific estimates are not representative for the population subgroup. The mathematical and methodological foundations for model-based predictions and standardization can be found elsewhere (98–100).
In order to improve results interpretation by making trends more visible, we additionally estimated smoothed curves using a general additive model (101) with a smoothing spline (102, 103) and curve by factor interaction (104). Values were predicted on the same standard population. The spline was fitted on weekly observations to maximize temporal resolution given sample size. To avoid over- or underfitting, the smoothing parameter was estimated using restricted maximum likelihood. However, we found that for our shorter time series, the curves based on weekly estimates were less smooth than the three-monthly predictions. Therefore, we only used this procedure for the longer time series.
Missing values in the dependent variables were excluded on a case-by-case basis. Observations without information on sex or age were not included in the survey and were treated as non-responses. Missings in education were imputed in accordance with the weighting procedure (66) by assigning the most frequent value, a medium level of education.
The initial interpretation of the times series was descriptive by visual inspection. Conservative criteria such as confidence interval comparisons were not used to evaluate developments over time at this stage because the first aim was to explore the overall trajectory. In addition to visual inspection, we carried out statistical comparisons between different time periods (see section 2.4.2).
2.4.2. Statistical time period comparisons between survey years
For the longer depressive symptoms time series, we conducted statistical comparisons between the three survey years for two periods of months: (1) mid-March to mid-September [calendar week (CW) 11–37] 2019, 2020, 2021, mid-March to mid-June (CW 11–24) 2022, and (2) mid-September to end of December 2019, 2020, 2021 (CW 38–52). For the shorter time series of SRMH and anxiety symptoms, mid-March to mid-September 2021 (CW 11–37) and mid-March to mid-June (CW 11–24) 2022 were compared. These time periods were chosen based on (1) the declaration of a pandemic on March 11 from WHO (1), (2) data gaps for the initial months of each year, and (3) the turning point in the development of depressive symptoms at the end of the summer of 2020, as shown in Figure 3. Small gaps in some of these time periods could not be avoided; for example, there was no data from mid-March to the beginning of April 2019. We tested for two kinds of trends. First, we tested for differences in mean depressive or anxiety symptom score and proportions at or above PHQ-2/ GAD-2 cutoff between corresponding time periods across years for the overall population as well as within the different subgroups. For SRMH we tested for differences in mean and proportions with very good or excellent SRMH. Second, we tested for possible changes in differences in means or proportions between subgroups over the specified time periods.
To conduct these comparisons, we again used linear and logistic regression models to produce averaged predictions as described above. However, here we calculated estimates for the defined time periods by including a set of dummy variables indicating these periods in the survey year. Furthermore, all possible interactions of these dummies with age group, sex, and level of education were included. The specification of the linear and the logistic regression models again differed with regard to level of interaction. In the logistic regression only, three-way interactions were included, whereas the linear model also included four-way interactions. After model estimation, the standard population was used for prediction of the means of the specified time periods. Contrasts between the time periods and the differences between the subgroups between the time periods were estimated. We used Stata's “margins, contrast” command (105) for estimation and statistical testing using Wald tests, applying a significance level of (p < 0.05).
Before running these contrasts, we conducted joint tests or omnibus tests in order to control for multiple comparisons and reduce the likelihood of false significant results by using protected tests (106). We only performed pairwise comparisons between time periods if the hypothesis that all possible differences were zero could be rejected. To assess the permissibility of pairwise comparisons within subgroups, we jointly tested if the differences within all subgroups defined by sex, age group or level of education, respectively, were zero. To address the question of whether differences between subgroups changed over time, we conducted joint tests including all possible differences, i.e., a test for interaction of time and sociodemographic characteristic.
3. Results
Results of joint tests for differences between time periods in the general population were significant across indicators with the exception of proportions of positive PHQ-2 screen comparisons between years for the September-December time period (see Supplementary Table A1). Joint tests for differences in symptoms of depression in this same time period (CW 38–52) between years stratified by sex, age, and level of education were not significant for mean PHQ-2 scores, and only significant for age for proportion of positive screens. Because none of the joint tests for interactions between time periods and sociodemographic characteristics except for the interaction between mean anxiety score and age yielded significant results, we did not examine the question of changes in differences further. Results for individual pairwise comparisons are reported below only in case of significant joint test results.
3.1. Time trends of depressive symptoms in the adult general population
Symptoms of depression were observed from April 2019 to June 2022 and overall showed an initial decline followed by two increases in the observed pandemic time window (Figure 2, Tables 2–5):
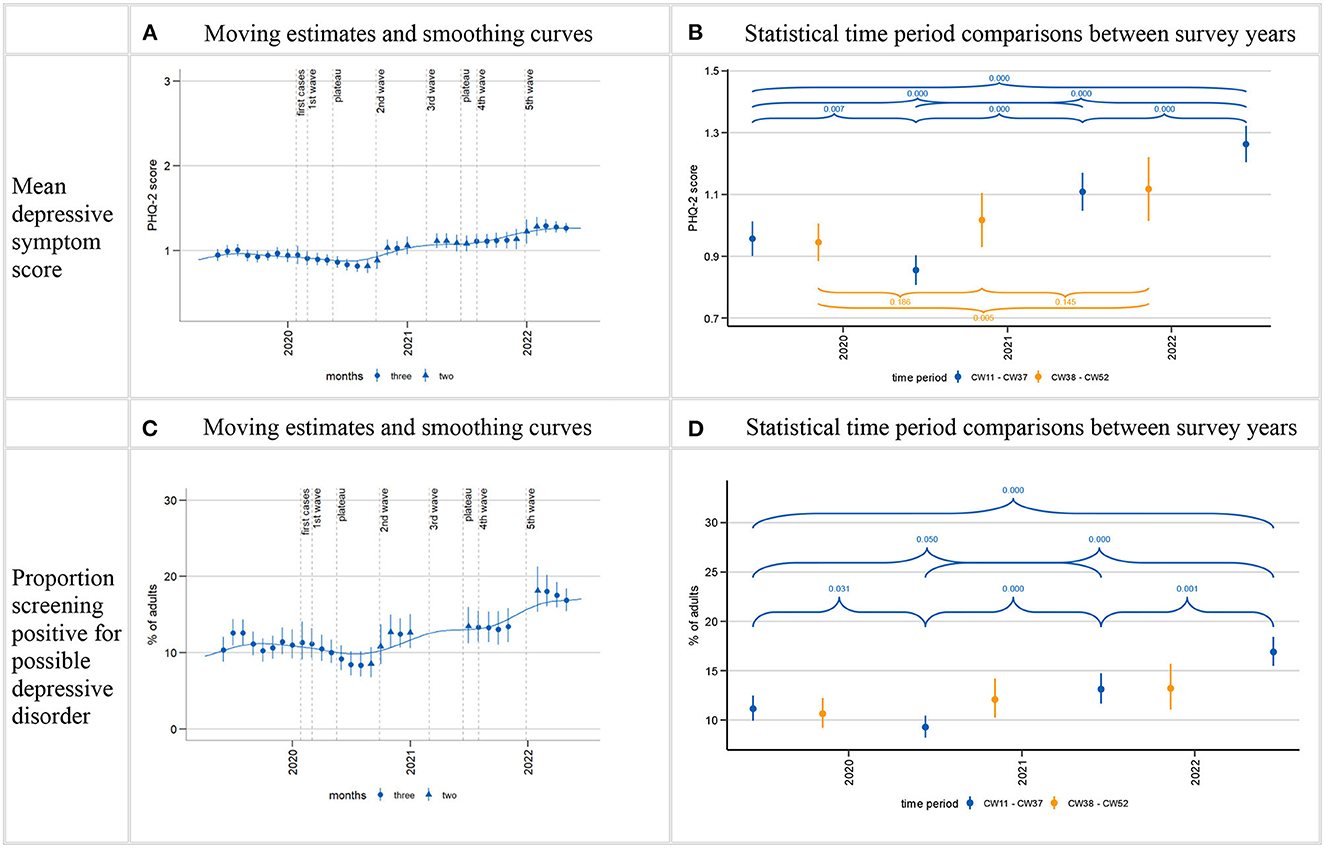
Figure 2. Time trends in depressive symptoms (PHQ-2). Time series starting from estimate centered on April/May 2019 and ending on estimate centered on April/May 2022. Calculation of three-month moving estimates and smoothing curves shown in (A, C) detailed in section 2.4.1 in Methods. Calculation of estimates for CW11-37 (mid-March to mid-September; CW11-24 in 2022) and CW38-CW52 (mid-September to end December) as well as p-values for comparisons between time periods shown in (B, D) detailed in section 2.4.2 in Methods. Gaps in the time series shown in (A, C) are due to data gaps. Larger gaps arise in the time series for proportion of positive screens (C) due to empty cells (absence of positive screens within certain sex, age, and level of education interaction cells in the regression model). p-values for comparisons between CW38-52 time period between years not shown for proportion of positive screens (D) due to non-significant joint tests, see Supplementary Table A1.
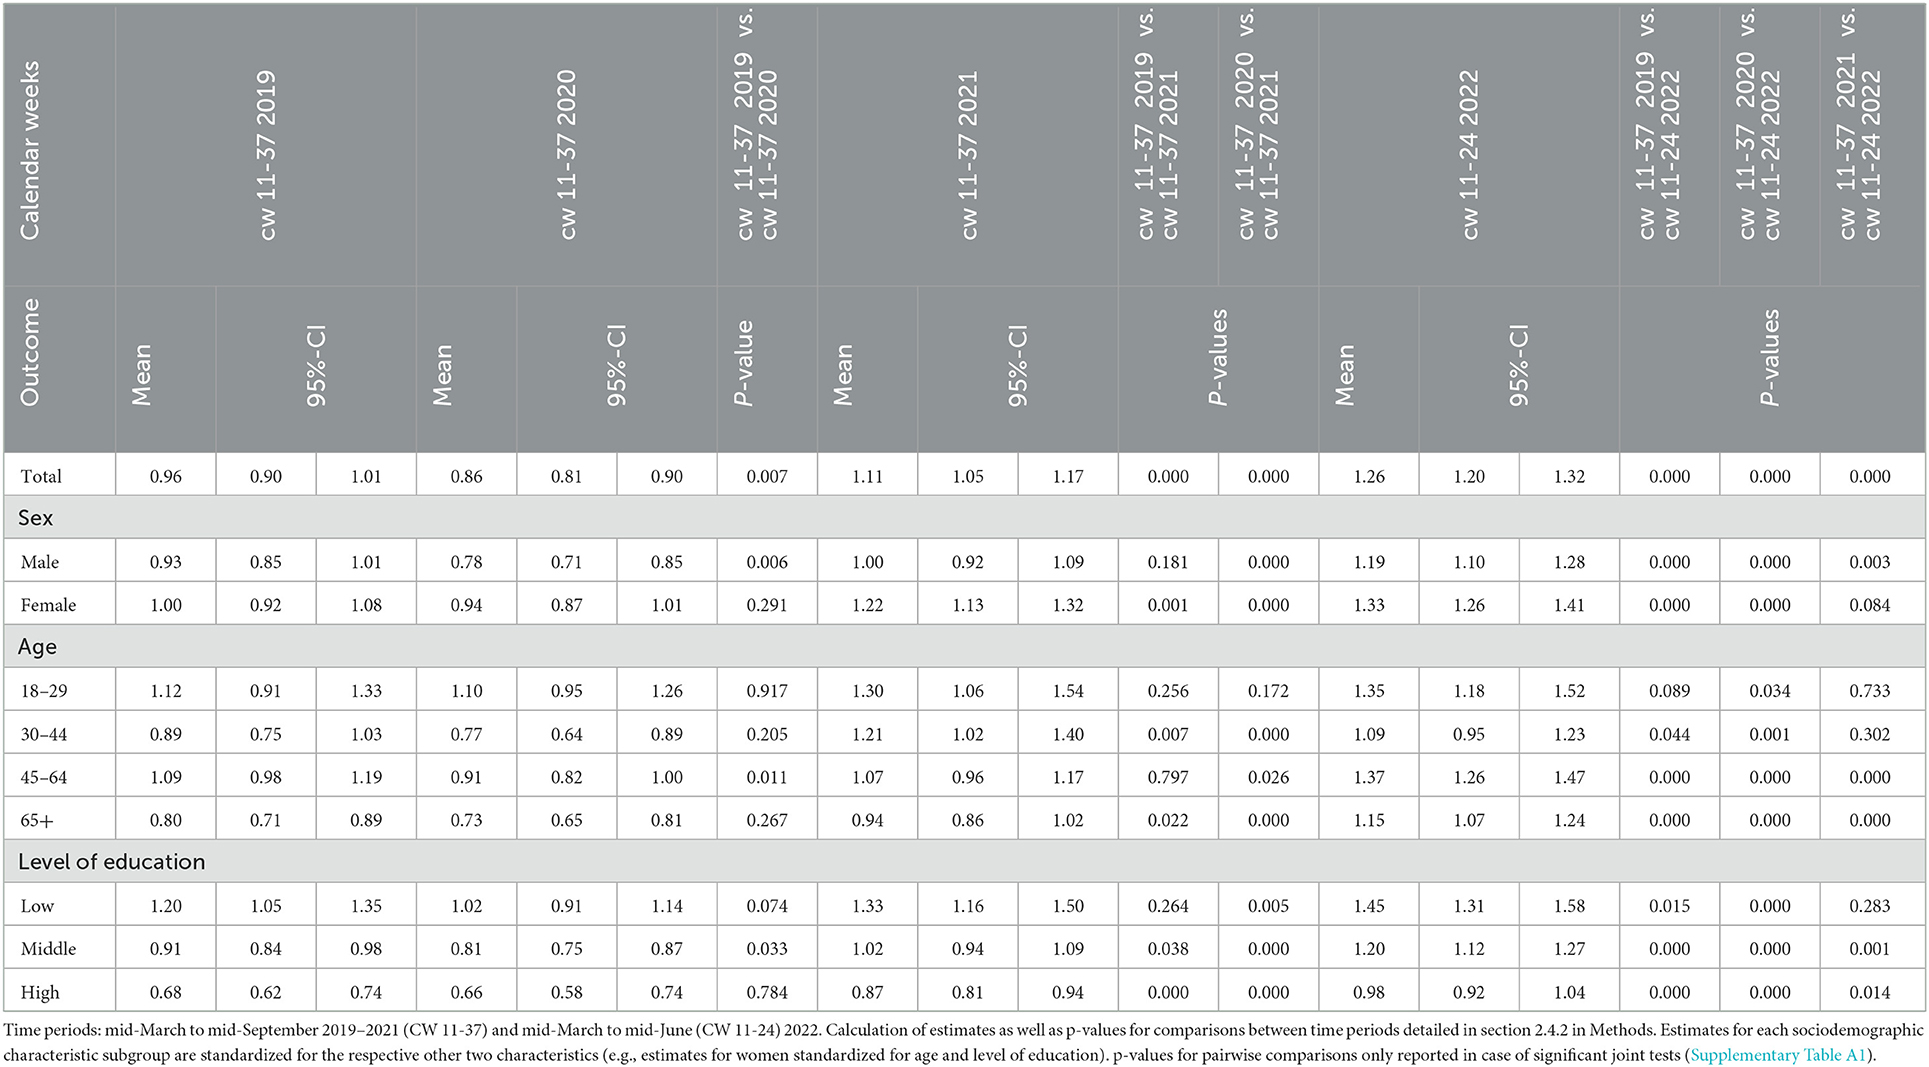
Table 2. Comparison of estimated mean depressive symptom scores (PHQ-2) for mid-March to mid-September 2019–2022.
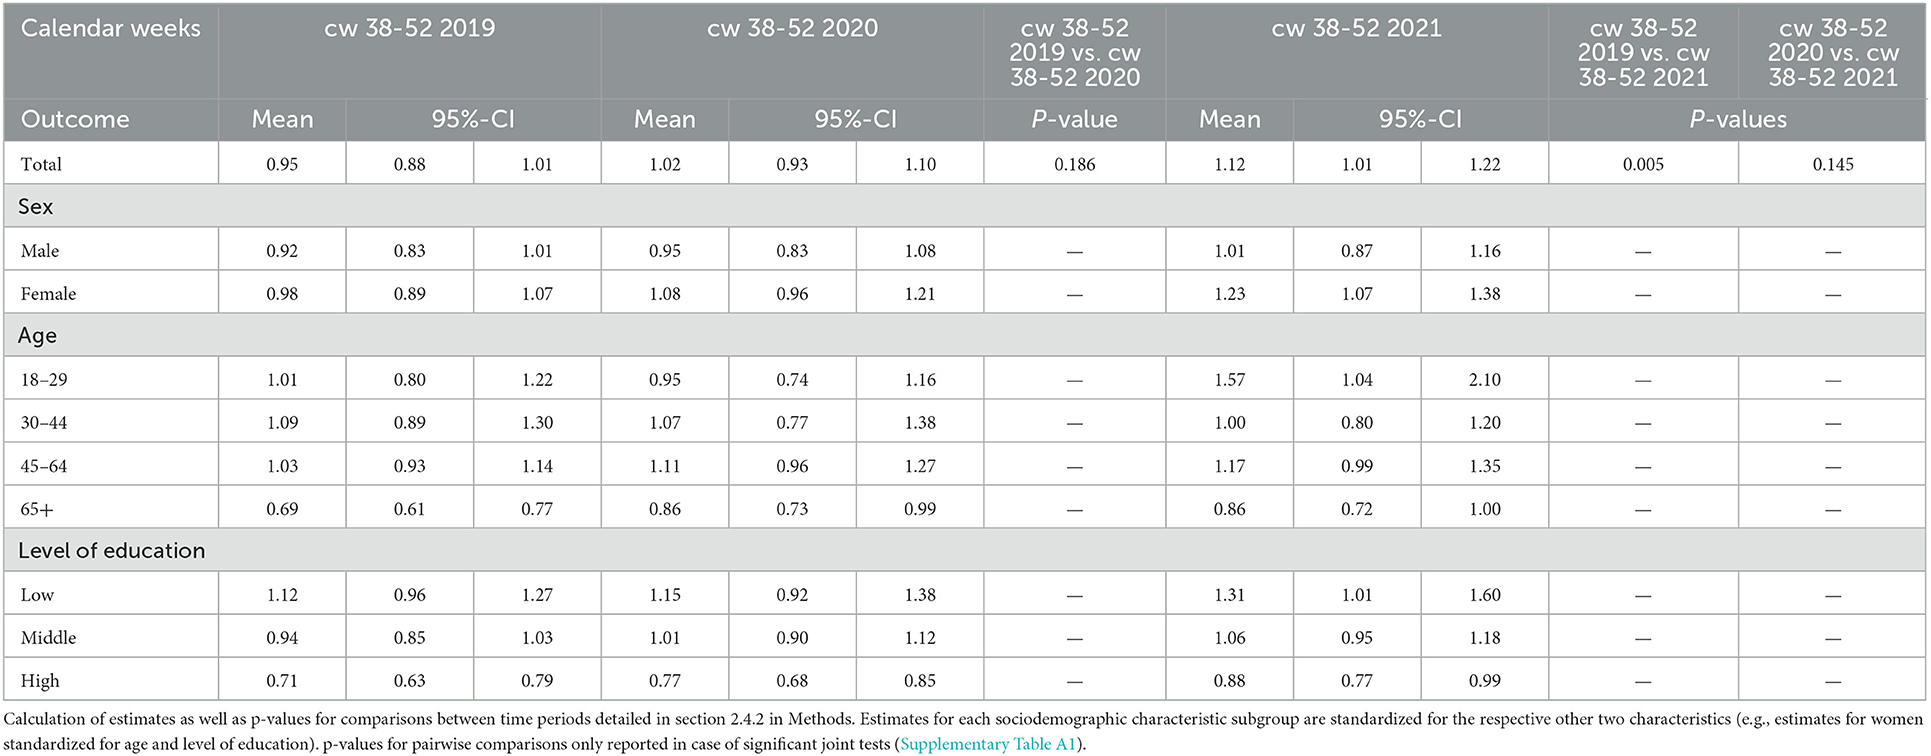
Table 3. Comparison of estimated mean depressive symptom scores (PHQ-2) for mid-September to end-December 2019–2021.
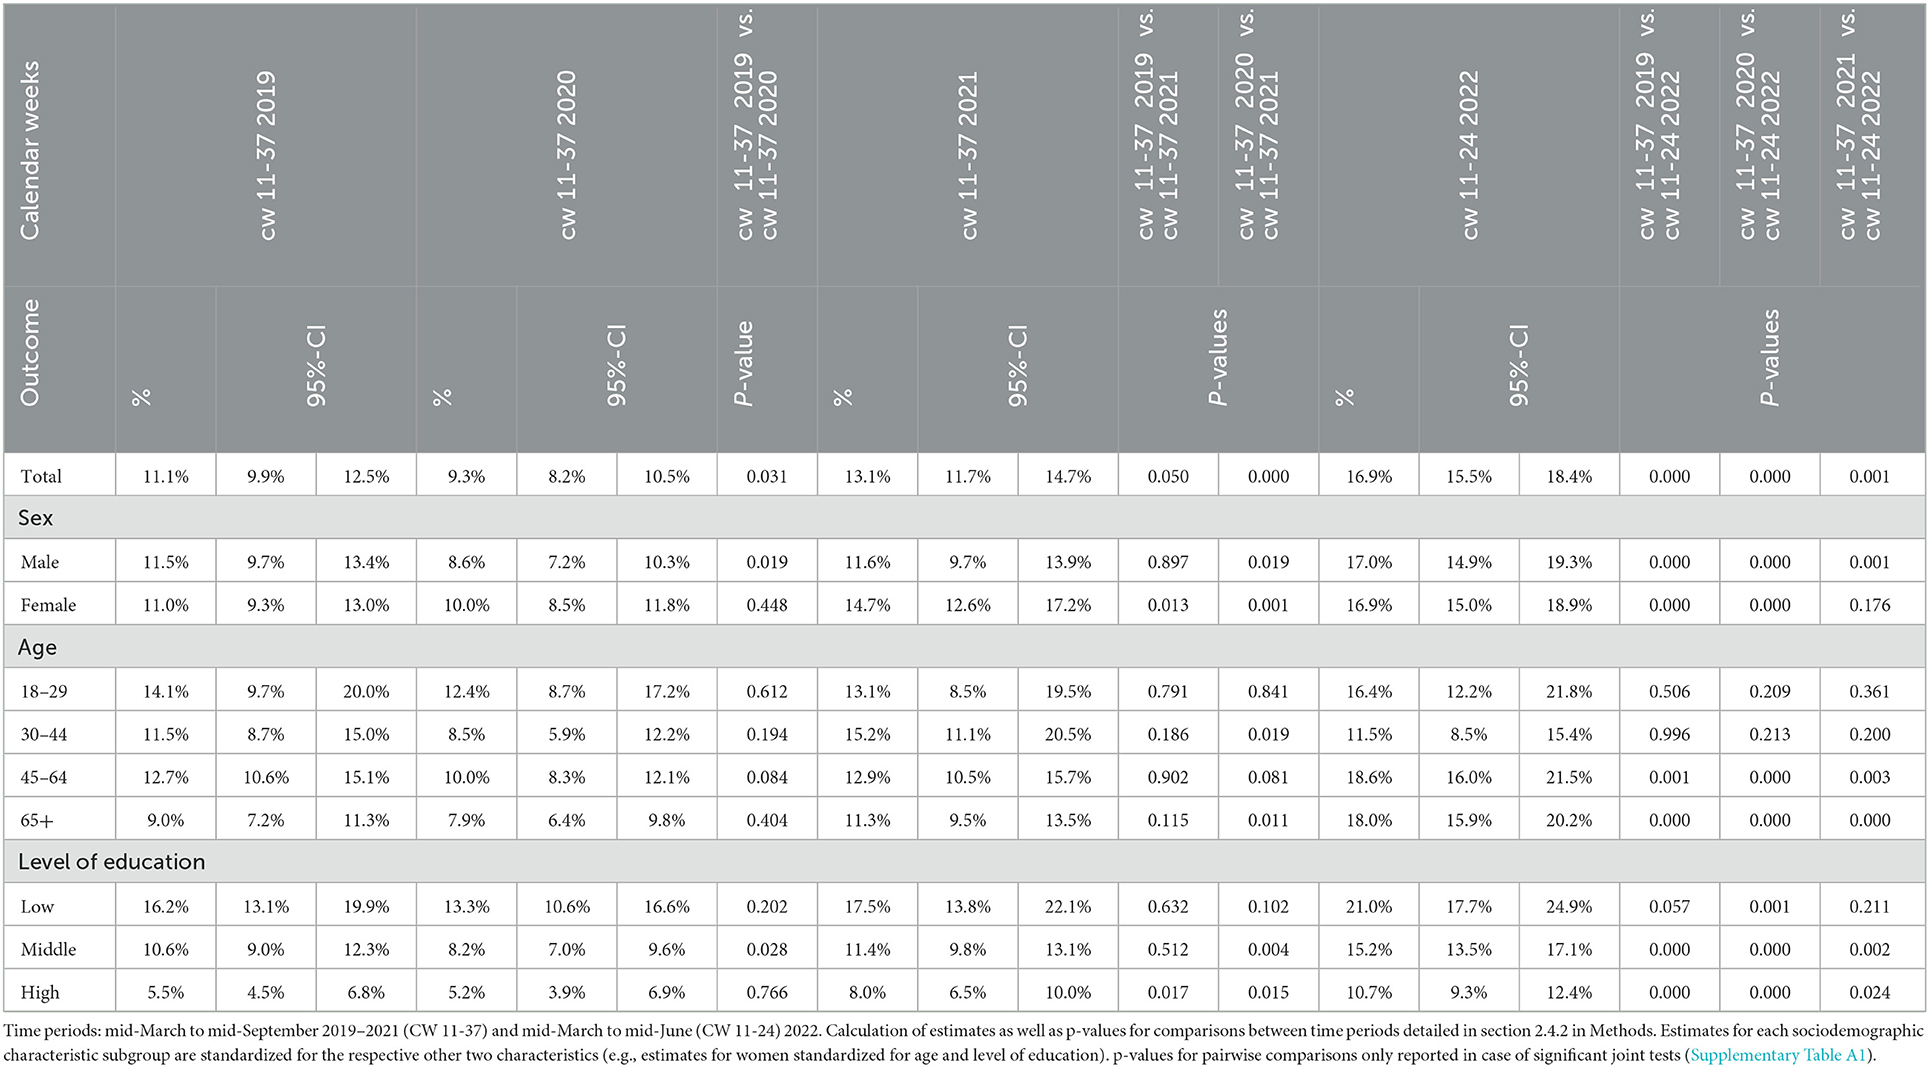
Table 4. Comparison of estimated percentages of positive screens for possible depression (PHQ-2 score > 2) for mid-March to mid-September 2019–2022.
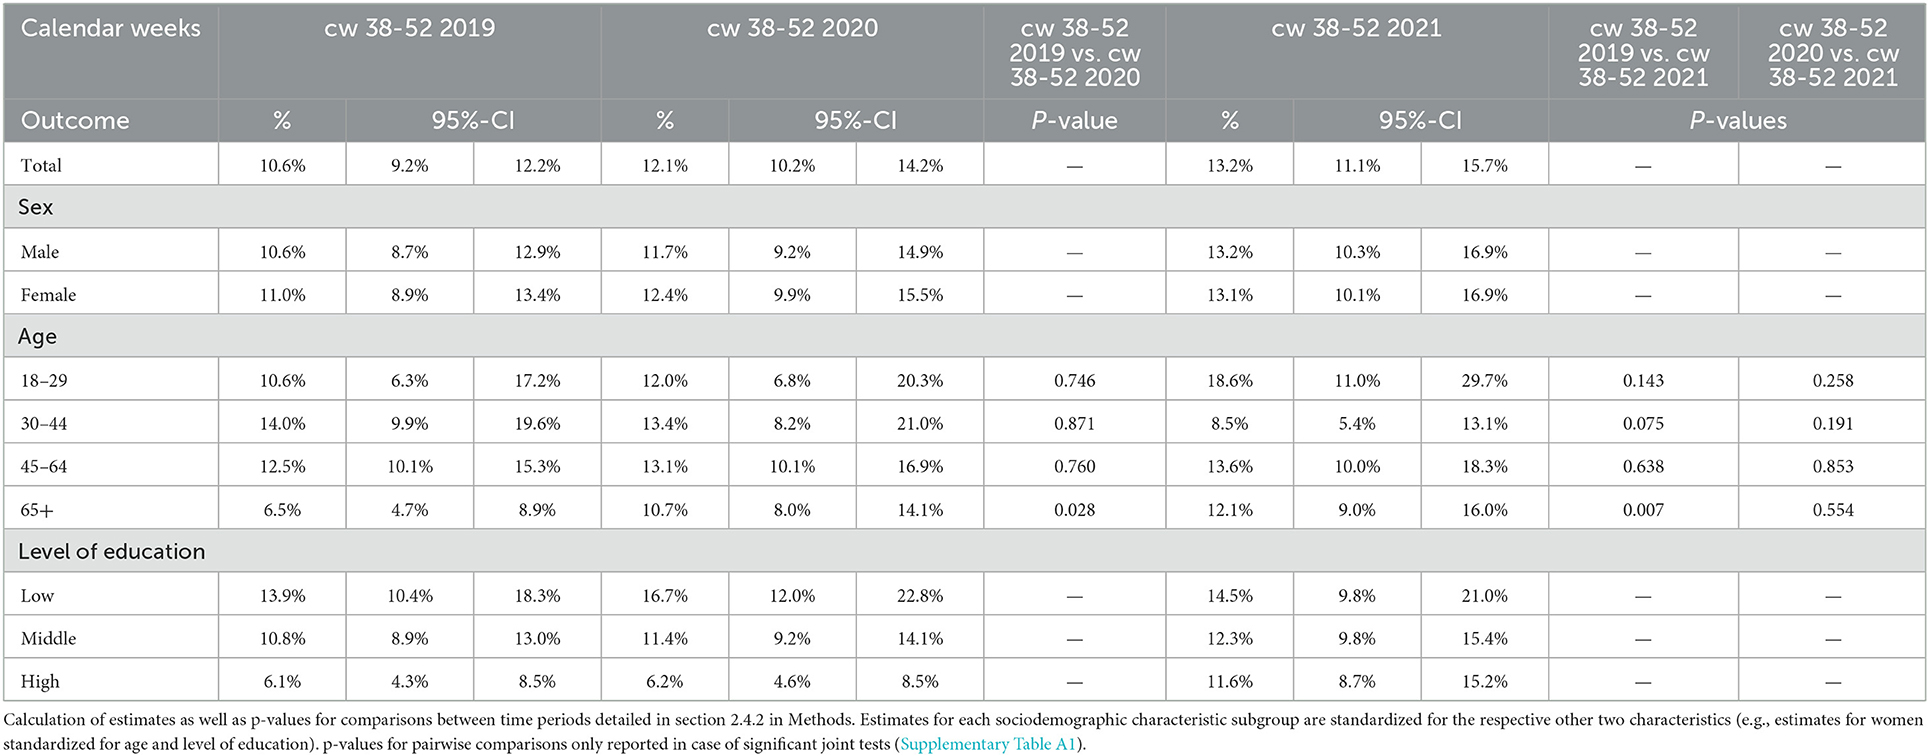
Table 5. Comparison of estimated percentages of positive screens for possible depression (PHQ-2 score > 2) for mid-September to end-December 2019–2021.
Mean depressive symptom scores as well as the proportion of the population with a positive screen decreased during the first wave of the pandemic and the first summer plateau (March-September) in 2020, resulting in lower levels than in the same period in 2019.
After the first summer plateau, the time series are characterized by two increases: Both PHQ-2 measures (means and positive screens) first increased between the beginning of the second wave in autumn 2020 and the beginning of the third wave in spring 2021. They reached relatively steady levels above those of 2019 from spring 2021 (p-values for comparisons of CW 38–52 period cannot be reported for proportions of positive screens due to non-significant joint tests). Both then showed further increases from late 2021 to early 2022 and remained elevated until the end of the observation period. March-June 2022 depressive symptom levels were significantly higher than in March-September in all three previous years.
This overall trajectory manifests in the following development of time period estimates for the spring/summer months over the 4 years observed (Tables 2, 4): The mean depressive symptom score in the population first decreased from 0.96 in 2019 to 0.86 in 2020 and then increased to 1.11 in 2021 and to 1.26 in 2022. The proportion of the population with a positive screen first decreased from 11.1% in 2019 to 9.3% in 2020. It then increased to 13.1% in 2021 and 16.9% in 2022.
3.2. Time trends of depressive symptoms stratified by sociodemographic characteristics
The results reported below can be found in Figure 3 and Tables 2–5. The reported subgroup estimates are standardized values. They should not be taken as population estimates for these groups.
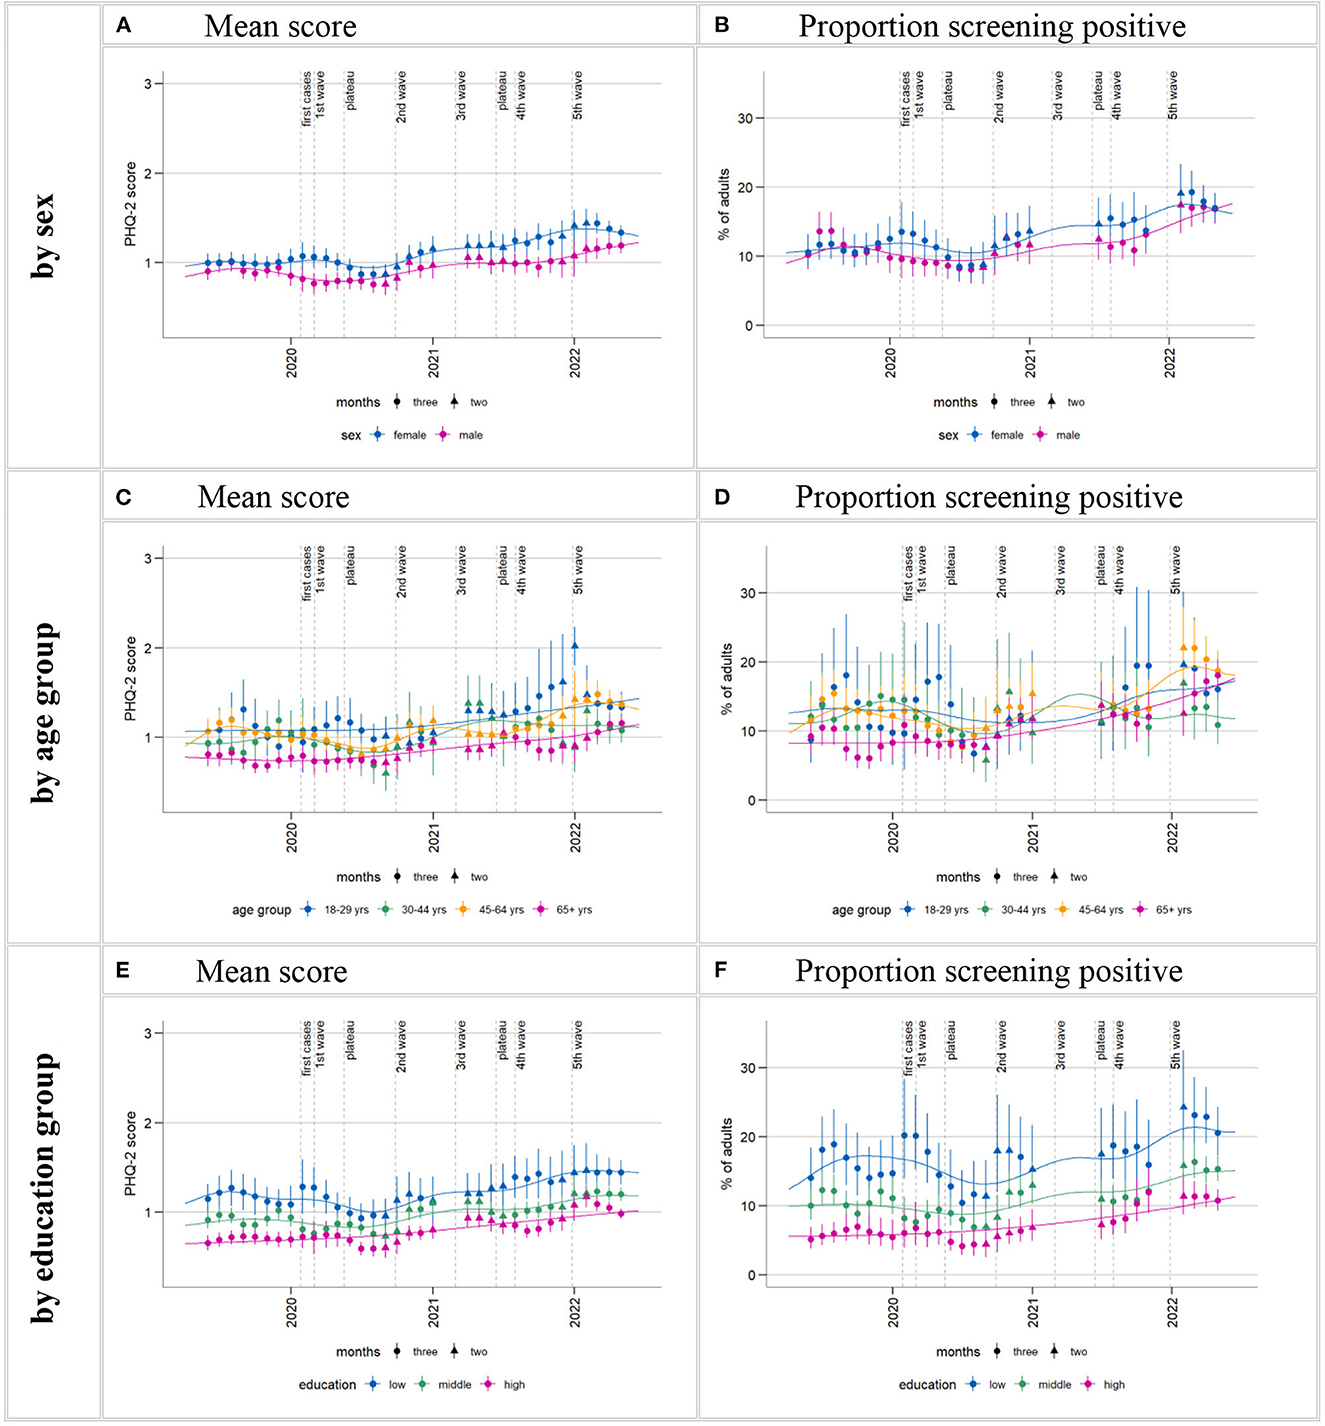
Figure 3. Time trends in depressive symptoms (PHQ-2) by subgroups. Time series starting from estimate centered on April/May 2019 and ending on estimate centered on April/May 2022. Calculation of three-month moving estimates and smoothing curves detailed in section 2.4.1 in Methods. Estimates for each sociodemographic characteristic subgroup are standardized for the respective other two characteristics (e.g., estimates for women standardized for age and level of education). Gaps in the time series are due to data gaps. Larger gaps arise in the time series for proportion of positive screens (B, D, F) due to empty cells (absence of positive screens within certain sex, age, and level of education interaction cells in the regression model). Supplementary Figure A2 shows these time series in a separate plot for each age group.
3.2.1. Time trends of depressive symptoms by sex
Time series plots suggest that throughout most of the observation period, mean depressive symptom scores were higher in women than in men (Figure 3A). Likewise, percentages of positive screens for possible depressive disorder appear to be higher in women than in men for the most part, although the overlap was greater than for mean scores (Figure 3B). The overall shape of the plotted time series stratified by sex roughly matches that of the whole population: initial symptom declines followed by two increases. However, women experienced less relief in the early phases of the pandemic and earlier symptom increases in the later phases:
Declines in both mean symptom scores and proportion of positive screens in the early phases of the pandemic are seen in both sexes, but limited to the summer plateau in women. Statistical comparisons between spring/summer 2019 and 2020 only show significant declines in men (Tables 2, 4). The plotted time series suggest two increases in both measures in both sexes, the first between autumn 2020 and spring 2021, the second at the end of 2021/beginning of 2022. Statistical comparisons reveal significant increases above 2019 levels in spring/summer 2021 for women but not for men (p-values for CW 38–52 cannot be reported due to non-significant joint tests). Men's depressive symptom levels surpass 2019 levels for the first time in 2022, also rising significantly above 2021 levels. In women, this second visible symptom level increase does not result in levels significantly above 2021 levels.
Over the course of the observation period, mean scores and the percentage of positive screens among women standardized by age and level of education increased by 0.33 points (from 1.00) and 5.9 percentage points (from 11%) between spring/summer 2019 and spring/summer 2022; among men, by 0.26 points (from 0.93) and 5.5 percentage points (from 11.5%) (Tables 2, 4).
3.2.2. Time trends of depressive symptoms by age
Time series plots show a tendency for lower mean symptom scores among those aged 65+ years and, less consistently, higher mean symptom scores among 18–29-year-olds compared to the other age groups in the observation period (all age groups standardized by sex and education; Figure 3C). This pattern is less pronounced in the proportions of positive screens time series (Figure 3D). Supplementary Figure A2 shows these time series in a separate plot for each age group.
While no declines in depressive symptom levels are visible among those aged 65+ for the early stages of the pandemic, plotted time series show decreasing means and proportions of positive screens from the beginning of the outbreak among the middle age groups and among the youngest in summer 2020. However, these declines resulted in a significant difference between means in spring/summer 2019 and 2020 only for those aged 45–64 years (Table 2).
At different times between the second wave and the end of the observation period, every age group then showed increases in depressive symptom levels beyond pre-pandemic levels:
Among 18- to 29-years-olds, means and positive screens rose very markedly compared to other groups from autumn 2021 to the end of the year. The standardized proportion of positive screens reached 18.6% in September-December 2021, representing an 8 percentage point-increase from the same period in 2019, and means rose from 1.01 to 1.57. However, statistical uncertainty is fairly high in this group, and this increase did not reach significance compared to pre-pandemic levels (Table 5; p-values for means cannot be reported due to non-significant joint tests). Following the sharp increase at the end of 2021, symptoms returned to lower levels numerically but not statistically significantly above 2019 levels in 2022.
30- to 44-year-olds showed a temporary increase in both PHQ-2 measures in spring/summer 2021. Standardized mean symptom scores increased significantly from 2019 in this time and markedly compared to other groups (from 0.89 in 2019 to 1.21 in 2021, Table 2). The temporary increase of 3.7 percentage points (from 11.5% in 2019) in the standardized proportion of positive screens did not reach statistical significance (Table 4). Mean symptom scores (but not proportions) again significantly surpassed 2019 levels in spring/summer 2022, but not 2021 levels. However, this increase does not stand out in magnitude.
45- to 64-year-olds exhibited an increase in depressive symptom levels above pre-pandemic levels later than the other age groups. The time series graphs show increases from about mid-2021. Both PHQ-2 measures significantly surpassed 2019 levels for the first time in 2022 (Tables 2, 4), also surpassing 2021 levels, resulting in a 5.9 percentage point increase (from 12.7%) in the standardized proportion of positive screens between spring/summer 2019 and the same period in 2022.
Smoothing curves suggest an overall continuous increase in symptoms of depression from autumn 2020 among 65+-year-olds. Statistical time period comparisons also point to a particularly steady trend of increase in this age group, with significant differences compared to 2019 in proportion of positive screens as early as end of 2020 and again end of 2021 (Table 5; p-values for comparisons of means in CW 38–52 cannot be reported due to non-significant joint tests) and significant differences compared to 2019 levels in means from spring/summer 2021 (Table 2). The marked increase in symptom levels within 2022 (significantly surpassing 2021 levels) also stands out in this group. The standardized proportion of positive screens reached 18.0% in spring/summer 2022–A 9% point increase from the same period in 2019 (Table 4).
3.2.3. Time trends of depressive symptoms by level of education
A social gradient is apparent throughout the observation period, with higher mean scores and proportions of positive screens for possible depression in those with the lowest levels of education, followed by the middle and high-level groups (all standardized by sex and age; Figures 3E, F). Just like with stratification by sex, the overall shape of the plotted time series stratified by level of education roughly matches that of the whole population: initial symptom declines followed by two increases.
However, the declines in means and positive screens in the first pandemic spring and summer result in statistically significant differences between 2019 and 2020 only in the middle level of education group (Tables 2, 4).
Smoothing curves suggest that the subsequent increases between autumn 2020 and spring 2021 as well as end of 2021 to beginning of 2022 amount to a particularly steady increasing trend in the high level of education group. Indeed, statistical time period comparisons show significant increases beyond 2019 levels in spring/summer 2021 in the high level group but not in the other two groups (p-values for CW 38–52 cannot be reported due to non-significant joint tests). Comparisons between 2022 and corresponding 2019 and 2021 time windows show significant increases compared to both years in both the high and medium level of education groups. In the low level of education group, means also increased significantly beyond 2019 (but not 2021) levels in 2022, and a p-value of 0.057 suggests a possible increase in the proportion of positive screens as well.
Looking at the whole observation period, the standardized proportions of those with a positive screen rose by 5.2 percentage points (from 5.5%) in the high level of education group, 4.6 (from 10.6%) in the middle group, and 4.8 percentage points (from 16.2%) in the low level of education group (not significant) between spring/summer 2019 and 2022 (Table 4).
3.3. Time trends of symptoms of anxiety and self-rated mental health
Symptoms of anxiety were observed from March 2021 to June 2022 and overall increased in this time (Figure 4, Table 6). Looking only at 2021, the moving averages suggest a possible increase in mean anxiety score in the population from spring into autumn, flattening out by the end of the year. This development is hardly reflected in the proportion of those exceeding the cut-off value for possible anxiety disorder. However, empty cells (no positive screens within certain sex, age, and level of education interaction cells in the regression model) around the two data gaps made it impossible to calculate the first and last estimates of 2021, as well as a CW 38–52 estimate, for the categorical outcome (Figure 4, Table 6).
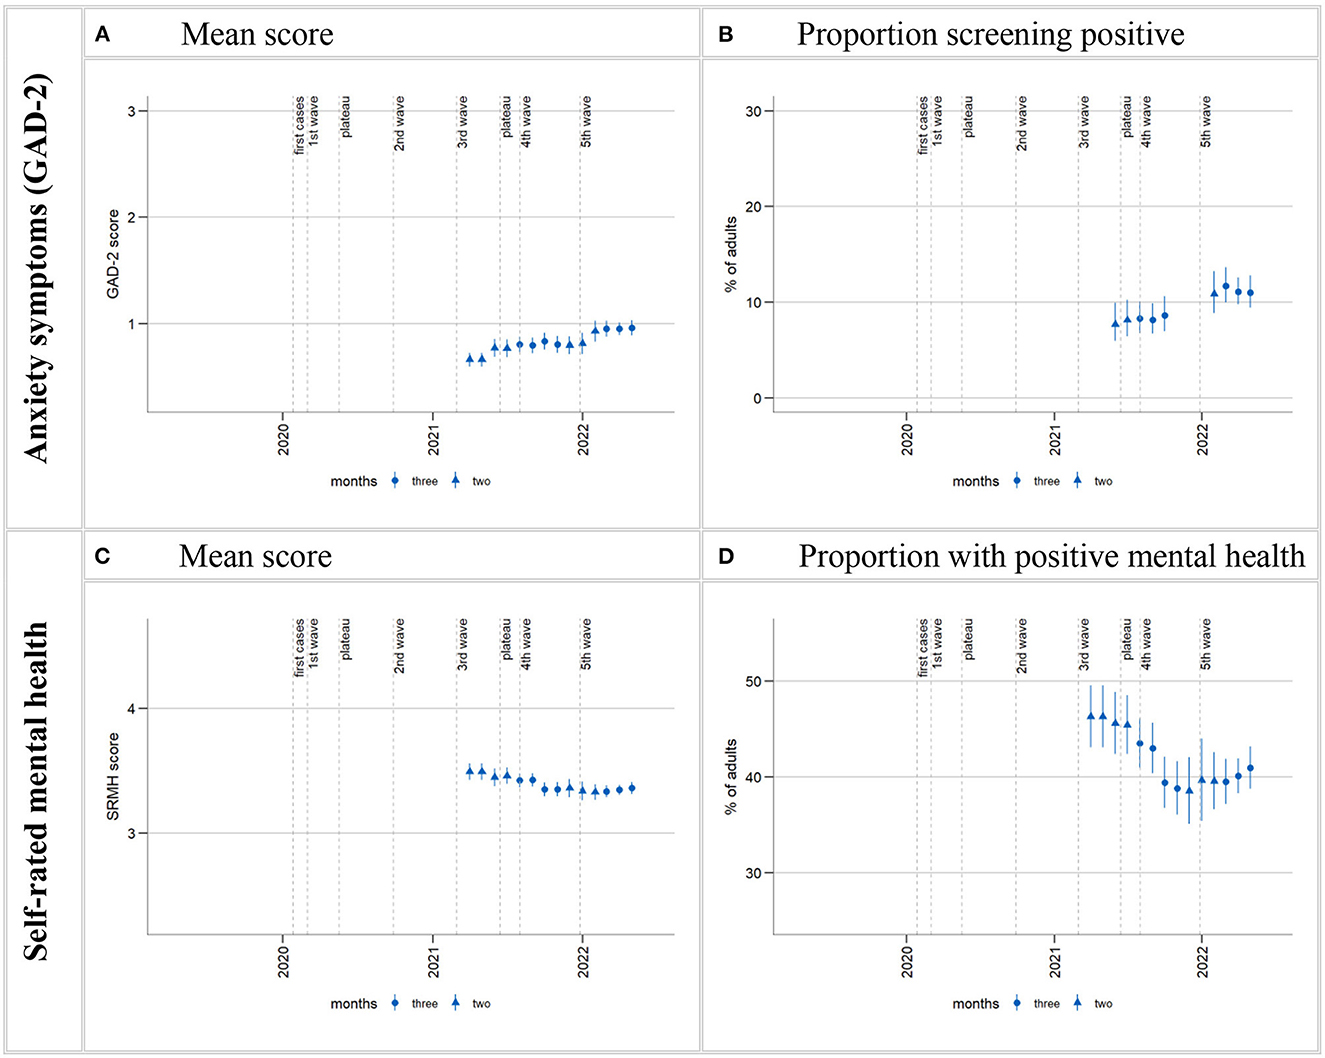
Figure 4. Time trends in anxiety symptoms and SRMH in the total population. Time series starting from estimate centered on March/April 2021 and ending on estimate centered on April/May 2022. Calculation of 3-month moving estimates detailed in section 2.4.1 in Methods. Gaps in the time series in (B) (including two missing estimates at the start of the time series) are due to empty cells (absence of positive screens within certain sex, age, and level of education interaction cells in the regression model) arising from data gaps. “Proportion with positive mental health” (D) is the proportion who rated their mental health as “very good” or “excellent”.
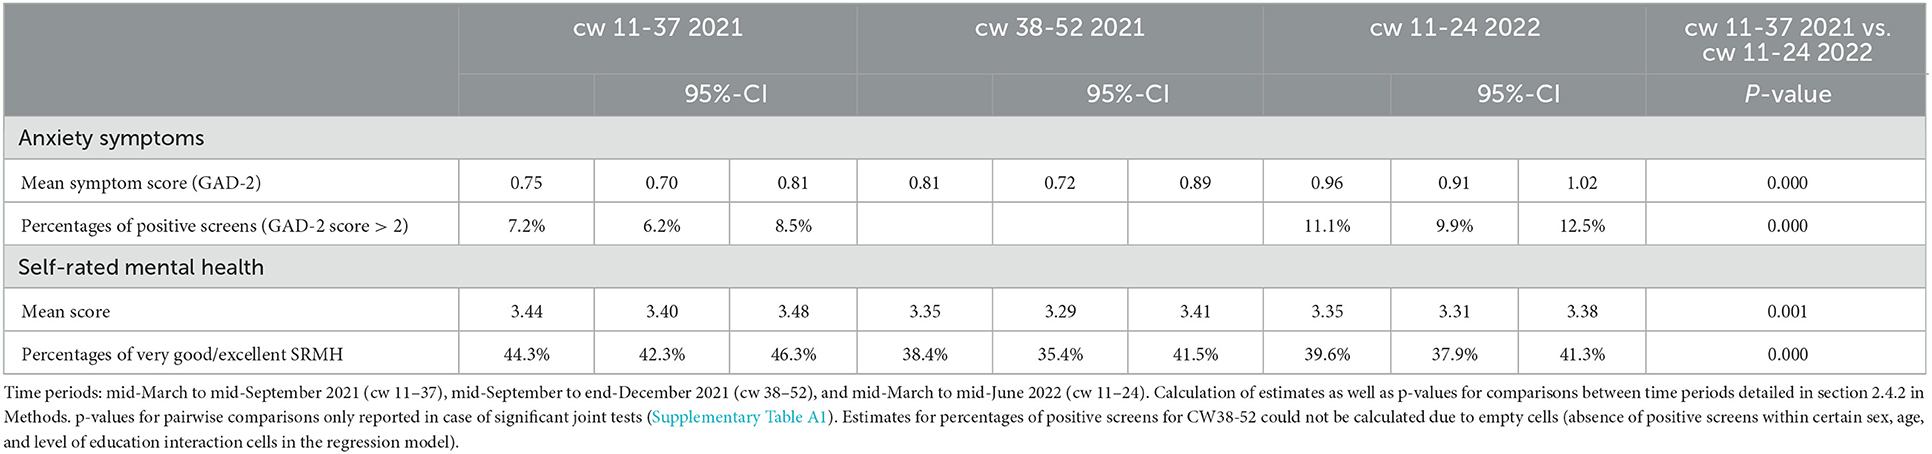
Table 6. Anxiety symptoms and self-rated mental health in different time periods: mean values, percentages and p-values for statistical comparisons.
Both measures of anxiety then show a marked increase from the first estimates of 2022 and consistently elevated levels until the end of the observation period. Time period comparisons confirm an increase in symptoms of anxiety between spring/summer 2021 and 2022: the population mean score increased from 0.75 in 2021 to 0.96 in 2022, and the proportion of positive screens increased from 7.2% in 2021 to 11.1% in 2022. Increases between 2021 and 2022 are found in both females and males, all age groups except those aged 30–44 years (just as with depressive symptoms, plot shows strong anxiety symptom increase end of 2021 for 18–29-year-olds), and in the medium and high level of education groups, but does not quite reach statistical significance in the low level of education group (Supplementary Figures A3, A4, Supplementary Table A2).
SRMH was observed from March 2021 to June 2022 and overall declined in this time (Figure 4, Table 6): Mean SRMH declined steadily between spring and autumn 2021 and then remained at a fairly constant level for the rest of the observation period. The percentage of those with very good or excellent SRMH, on the other hand, continued to decline until the end of 2021 and then increased slightly in 2022. The overall declines in both means and percentages in the course of the observation period were confirmed by statistical comparisons between spring/summer 2021 (mean: 3.44; percentage very good or excellent SRMH: 44.3%) and spring/summer 2022 (mean: 3.35 and percentage: 39.6%). Declines between 2021 and 2022 were found in both females and males, in those aged 45 and older, and in those with a low or high level of education (Supplementary Figures A5, A6, Supplementary Table A3).
4. Discussion
4.1. Summary
The present study investigated how depressive symptoms developed month-by-month between April 2019 and June 2022 in the adult population in Germany and whether trajectories differ by sex, age, and level of education. Moreover, it explored how symptoms of anxiety and SRMH developed in the shorter time window of March 2021 to June 2022. We found:
(1) Mean population depressive symptom scores as well as proportions of the population screening positive for possible depressive disorder showed a decline in the first wave of the pandemic and into the first summer plateau compared to the same months the year prior. Percentages of positive screens declined from about 11% in spring/summer 2019 to 9% in 2020. During the second wave starting in October 2020, this proportion as well as mean scores increased and remained consistently elevated throughout most of 2021, even during the summer months. Late 2021 until early spring 2022 saw another increase in both measures and sustained higher levels until the end of the observation period. By spring/summer 2021, the prevalence of those screening positive increased to 13%, between March and June 2022, it reached ~17%.
(2) The observed overall trends in the development of depressive symptoms are, for the most part, evident across the examined subgroups. However, declines and increases are more pronounced in some groups than in others and vary in time course. The reduction in depressive symptoms in 2020 is particularly pronounced in men, among the two middle age groups, and the middle level of education group. Increases in depressive symptoms from autumn 2020 onward were found in all groups. However, numerically striking or statistically significant increases compared to pre-pandemic periods in 2019 were reached at different times. Women showed earlier symptom level increases than men, the youngest experienced particularly marked increases in 2021, and the eldest adults as well as the high level of education group stand out for earlier and more continuous increases than found in their respective comparison groups. The social gradient in symptom levels by level of education remained unchanged by these developments. No significant interactions between sociodemographic characteristic and time period, i.e., no evidence for changes in differences between subgroups, were found in the observation period.
(3) In keeping with these developments in depressive symptoms, SRMH decreased and anxiety symptoms increased between spring/summer 2021 and 2022. While both symptoms of depression and anxiety showed marked increases between the final estimates of 2021 and the first estimates of 2022 and remained elevated, SRMH showed no marked changes at this time.
4.2. Reduction in symptoms of depression in the first phases of the pandemic
Contrary to warnings of a potential mental health crisis at the start of the pandemic (2–5), our depressive symptom time series using the PHQ-2 show an initial reduction in both mean depressive symptom scores and proportions of individuals with a positive screen among adults in Germany during a first wave of infections. This first wave was mild in Germany compared to some other countries (107), and in the first pandemic summer, restrictions were eased and case numbers very low (20, 25). Analyses using the longer PHQ-8 in the same GEDA-EHIS data also showed a temporary reduction in symptoms of depression in the population between April 2020 and August 2020 in a month-by-month time series of the proportion of positive screens (108).
Findings on mental health in the early pandemic from other data sources and other countries are very mixed. This might be due to heterogeneity in observation and comparison periods and national contextual differences [e.g., 38, 43]. In contrast to our results, international reviews and meta-analyses conclude that many studies did find increases in psychological distress and symptoms of mental illness in the earliest phases of the pandemic (37, 38, 40, 109, 110), including symptoms of depression (40, 109, 111). While many studies with longer observation periods reported a decline back to or almost back to pre-pandemic levels in the summer months of 2020 (38, 40, 110), symptoms of depression were sometimes found to remain elevated for longer than symptoms of anxiety (40, 111). Also contradicting our results, a large population-based cohort study in Germany found an intra-individual increase in PHQ-9 scores during the first wave of the pandemic among those under the age of 60 (61) and in population-level means and proportions of positive PHQ-9 screens from 7.1% at baseline to 9.5% between May and November 2020 (46). Likewise, a longitudinal study based on representative household panel data found an increase in proportions of positive PHQ-2 screens from April to June 2020 (13.8%) compared to the year 2019 (9.6%) (45). These differences in findings may be due to differences in survey design such as the panel structure in the other studies in contrast to the monthly random samples in the present study and switches in survey mode from face-to-face to telephone interviews during the pandemic in one of the surveys (45). Differences in overall survey focus and framing (e.g., general health survey vs. surveys with a special focus on the pandemic) as well as the institutions conducting the survey also cannot be ruled out as contributing factors. A representative regional study also using single-stage random sampling found no changes in psychopathological symptoms during the first wave compared to a pre-pandemic baseline (112), and another nationwide study found no changes within the weeks of the first lockdown compared to the weeks before (113). Further in keeping with a picture of resilient populations in the first wave, continuous reductions in symptoms of depression within the first months of the pandemic were reported in a large-scale study in the UK (114), and an Irish population-based study found a significantly lower proportion of positive screens for depression in March to April 2020 than in February 2019 (115).
Our analyses do not permit conclusions about causal associations between pandemic developments and mental health developments, much less on possible reasons for any putative associations between the two. However, the context within which mental health developments take place and their temporal coincidence with societal developments warrant discussion. Possible benefits of a general and novel deceleration of life during lockdown in the relatively mild first wave and relief from a relatively quick return to near-normalcy in the first pandemic summer could be taken into consideration as potential factors playing into the dynamics we find. Benefits of deceleration as a potential explanation is supported by the fact that analyses based on the same data examining all depressive symptoms included in the PHQ-8 found a particular reduction in fatigue, loss of energy, and concentration difficulties, which are all closely linked to chronic stress (87, 108).
Stratification by subgroups shows that while there is evidence of symptom reduction in the first pandemic summer in all groups except adults aged 65 years and older, lower symptom levels in the first wave and statistically significant reductions in spring/summer 2020 compared with spring/summer 2019 were found in groups that may have experienced a particular deceleration of life: the middle-aged, who are typically particularly busy with the demands of paid and unpaid work, and men, who, for example, took on less additional childcare than women when childcare facilities closed, particularly in high-income countries (53). The middle level of education group and, somewhat less markedly, the low level of education group also exhibit this pattern. Several workplace-related factors may have played a mediating role in a possible association between educational attainment and mental health, e.g., significantly reduced working hours with or without financial compensation vs. increased working hours or job loss and working from home (46).
4.3. Declines in mental health from the second wave onward
4.3.1. Declines in mental health from the second wave onward in the general population
While most studies on mental health in the COVID-19 pandemic in Germany examine its first months only (43), our results shed light on the development of symptoms of depression in the adult population until June 2022 and reveal two increases. Consistent with our finding of increased mean depressive symptom scores as well as positive screens between the last months of 2020 and spring 2021, i.e., during the second wave of infections, a German study reports lower subjective psychological wellbeing measured using a screening tool for depression in December 2020 compared to May and September 2020 (116). Also in keeping with our findings, a representative survey of the German resident adult population showed that a far larger percentage of the population found the overall situation “depressing” in the second lockdown than in the first (47).
A significantly higher proportion of positive PHQ-2 screens (45) and mean symptoms scores (59) in early 2021 compared to 2019 were also found in the German representative panel study (the “Socio-Economic Panel”). However, in contrast to our finding that symptoms of depression first increased in the second wave following an initial decline in the first pandemic months, scores and percentages were actually found to be lower in January/February 2021 than in April through June 2020 in the SOEP. Despite this discrepancy, the January/February 2021 proportion of positive screens in this other study is 12%, very similar to the September-December 2020 levels (12.1%) in our study (we do not have data from January and February 2021).
While we have no data on symptoms of anxiety and SRMH from before the pandemic or in its early stages, our findings of a potential increase in symptoms of anxiety and a clear decrease in SRMH between March 2021 and the end of 2021 are in keeping with the picture of worsening mental health following the onset of the second wave.
These changes occurred in the context of a second wave of infections much larger than the first, followed very quickly by a third wave and a fourth, very severe wave with only short periods of lower infection rates in between. Although vaccinations began at the end of 2020, measures to slow transmission were in place for much of this time, mortality rates were high, and hospitals were reported to have come dangerously close to their limits (20, 21, 23–25). While, again, our results do not allow for conclusions on causal relationships between infection rates, mortality, NPIs, or other pandemic factors and mental health, associations between mean PHQ-4 scores and “pandemic intensity” have been reported in a meta-analysis (117).
The sheer increased duration of the cumulative pandemic stressors may also explain potential pandemic-related changes in mental health later on (author?) (19). A resilient response is more likely in the face of brief stressors than in the face of more chronic stress (18). In general, longer-term experiences of lack of control and helplessness threaten mental health and may be particularly related to depressive symptoms (16). Reductions in protective factors such as social contact, leisure activities (19), and access to the full spectrum of health services (16) may also grow more harmful with longer durations. Finally, most mental disorders take time to develop and manifest with a prodromal phase (118, 119). While our study does not address the prevalence of any mental disorders, the individual symptoms that comprise these disorders might be subject to the same dynamics.
Our findings of a further increase in symptoms of depression and symptoms of anxiety between late 2021 and early 2022 resulting in by far the highest levels in our over three-year observation period lend further support to the assumption of a potential build-up of pressure on mental health. The pandemic context at this time was a fifth wave of infections driven by the omicron variant immediately following the fourth wave and reaching the largest ever peak in new infections in April 2022 (21, 22), and yet a suspension of most NPIs from the beginning of April (35). Another major and acute population-wide stressor in the final 4 months of our observation period was the war in the Ukraine beginning on February 24th, 2022. It is of note that symptoms of depression and anxiety increased rather markedly in the January/February-centered estimate of 2022, which includes data until mid-March 2022, suggesting potential mental health impacts of the war (120) and emerging economic developments (11, 18). The fact that subsequent estimates remained elevated raises the possibility of developments beyond a short-lived reaction to a discrete event.
The absence of a decline in SRMH between late 2021 and early 2022 following its decline within 2021 suggests that increases in depressive and anxiety symptoms did not translate to people reporting worse overall mental health within this specific time window. Importantly, the temporal reference frame of these measures is very different: while the PHQ-2 and GAD-2 ask about the previous 2 weeks, SRMH has no reference time. Perhaps SRMH shows different dynamics in this particular time window as a more global and less acute measure. Also, mental health problems are known not to necessarily translate into poor SRMH in general (121). The present observation period is too short for conclusions about differences in dynamics between these indicators, but this would be interesting to analyze in longer time series.
4.3.2. Declines in mental health from the second wave onward by subgroup
Turning to subgroups, stratification by sex, age, and level of education in our uniquely long and continuous time series revealed increases in depressive symptom levels at different times after the onset of the second wave of infections in all groups. Increases in symptom levels were more pronounced in women than in men until the end of 2021. This finding is as expected based on previous literature [e.g., 41, 52, 53, 109] and considering factors such as a greater burden from increased care work among women (53) and increases in domestic violence (14, 16, 53). In 2022, however, men also showed a significant increase above 2019 levels, as well as above 2020 and 2021 levels (and, just like women, also increases in anxiety and declines in SRMH). This later increase may be due to new stressors or simply a delay in negative mental health developments.
While the sexes and the level of education groups all showed relatively similar overall trajectories, age groups differ in the shape of their time series after the onset of the second wave, suggesting that stressors and protective factors may differ by age in particular. In keeping with previous findings of mental health vulnerabilities among young adults in the pandemic (41, 49, 54–57), the youngest age group stands out in our study for its steep increase in depressive symptoms (and also symptoms of anxiety) at the end of 2021. Vulnerabilities in this group could be related to the transitional nature of young adulthood, the particularly great importance of social contact with peers when leaving the parental home (19, 51), and an overall greater disruption of life in this group (58) during the pandemic. On the other end of the age spectrum, those aged 65+ years stand out for early significant increases beyond pre-pandemic levels and a particularly constant trend of increase throughout the observation period from 9% positive screens in spring/summer 2019 to 18% in 2022 (standardized estimates). While most studies highlight risks among younger adults, a German study using primary care data found early increases of mental health diagnoses among those aged 80 and over (122), consistent with our results. A greater risk of severe disease and death from COVID-19 (16) may have resulted in greater stress and isolation throughout the pandemic (19) in this age group, with less relief from temporary suspensions of NPIs. While 45-64-year-olds do show worsening mental health, but only late 2021/early 2022, 30-44-years-olds stand out for somewhat steadier levels across indicators (except for one temporary increase in depressive symptoms), suggesting they may have been more resilient in the observation period.
The feared widening of disparities in mental health (16, 19, 50) by SES in the pandemic was not evident in our study, which looks at educational differences as one of the dimensions of SES. We found a similar overall trend in all education level groups, with an increase of about five percentage points in each group between spring/summer 2019 and spring/summer 2022. The high level of education group stands out for the greatest relative increase given baseline levels and in terms of how early and continuous increases are across the observation period. Previous international studies from other countries in the Organization for Economic Co-operation and Development (OECD) have also found greater increases in psychological distress in higher SES groups (52, 56, 69, 70). In Germany, for example, greater declines in life satisfaction during the pandemic have been reported for higher income individuals (57, 123). Discussed reasons include more working from home in this group (124), which has been shown to be linked to mental health declines in the pandemic (46). Moreover, this group may have experienced a more substantial change in lifestyle more generally (56), perhaps with concomitant greater expectations for the constant availability of resources (70). However, a complex set of risk factors is likely to be at play in all education groups. Occupational and financial difficulties were identified as particularly crucial for an increase in depressive and anxiety symptoms in Germany (46). Importantly, the established social gradient in the risk of depressive symptoms remains unchanged until the end of the observation period in our study, with twice the percentage of positive screens in the low as in the high level of education group in spring/summer 2022.
4.4. Strengths and limitations
4.4.1. Strengths
Three features of the study should be highlighted as strengths: (1) Continuous, representative data spanning 1 year before the outbreak of COVID-19 and over 2 years of the pandemic: While most of the existing literature on mental health developments during the COVID-19 pandemic in Germany covers limited time periods and focuses on the early phases of the pandemic only, we present results on the whole course of the pandemic until June 2022, including pre-pandemic data for depressive symptoms. (2) Development of a method for assessing trends at higher temporal resolution: A method for deriving robust month-by-month results from relatively small samples was developed. Using graphical representations of monthly moving estimates, multiple adjustments of the sample, and smoothing spline curves, we were able to produce graphic time series for the visual identification of trends which were nearly all verified by statistical time period comparisons. This demonstrates the feasibility of this approach to high-frequency mental health surveillance. (3) Examining developments over time both in mean scores and using scale cutoffs: The relevance of population means for public mental health in connection to Geoffrey Rose's ideas about prevention and health promotion at the population level has been previously discussed (84). Changes in the population symptom level are of interest irrespective of whether they result in more positive screens. The additional examination of positive screens permits conclusions on whether changes manifest in increases or reductions in cases of potential immediate clinical significance.
4.4.2. Limitations
Limitations in the interpretation and evaluation of our findings include: (1) Time periods of observation and comparison: Because the time series on anxiety symptoms and SRMH span only about 16 calendar months during the pandemic and include no pre-pandemic data, observed developments cannot be contextualized temporarily and are more difficult to interpret than the longer time series for depressive symptoms (11 months pre-pandemic, 27 months during the pandemic). However, even for depressive symptoms, 11 months of pre-pandemic data are not sufficient to control for seasonal trends and long-term secular trends. By providing more context, longer time series would also facilitate our understanding of how meaningful the observed magnitudes of change are. (2) Gaps in data collection: Data collection was interrupted four times for depressive symptoms and twice for anxiety symptoms and SRMH. Also, for some months the number of observations was low. These monthly periods with fewer than 1,000 observations were minimized by using months ranging from the middle of one calendar month to the following calendar month. Additionally, predictions on a three-month window were still made when only 2 months were included. Thus, results assigned to the central months might be biased toward the first or the third months in the window or just averages of the first and the third month. Also, one gap in the GEDA study was filled with data from the COVIMO study, which had a comparable design but a different overall framing and focus. However, we checked for and did not find systematic, study-related differences. (3) Representativity of the sample for the general population and statistical power for subgroups: The response to population-based telephone surveys typically varies systematically by sociodemographic factors (125). In particular, younger individuals and those with lower levels of education are underrepresented in our study. We used weighting factors to account for population structure, but the small number of cases in these groups may mean that possible changes over time within a group and differences from other groups might not be detected. In order to reliably achieve statistical significance in the subgroup analyses, larger sample sizes within certain subgroups would be required. Mentally ill and especially severely mentally ill individuals may also be less likely to participate (126, 127), a bias for which we cannot correct. Similarly, we cannot rule out the possibility that willingness to participate in a survey conducted by a governmental public health institute during the pandemic was related to subjective pandemic-related psychological distress. (4) Measurement and scaling: Using short versions of screeners to measure depressive and anxiety symptoms results in a restricted range of scores compared to the full questionnaires. This might have decreased the likelihood of detecting changes compared to the respective long versions with more items. Additionally, the PHQ-2 and the GAD-2 as well as its long versions PHQ-8, PHQ-9, and GAD-7 measure the severity of depressive and anxiety symptoms on an ordinal scale. However, validation supports the interpretation as a metric scale (86, 128). According to this assumption, distributions of PHQ-based measures are commonly described by means of sum scores [e.g., 46, 57, 73, 114]. Furthermore, information based on self-report can be subject to recall-bias and social desirability (129). While telephone surveys have the advantage of not limiting the sample to those who are able to complete a survey online or via an app, social desirability may represent more of a confound with this survey mode (130).
4.5. Conclusion and implications
The main implications of our findings derive from the observation of a two-stage substantial decline in mental health in later phases of the pandemic. While the clinical significance of the changes observed in population mean depressive symptom scores is unclear, the increase in depressive symptoms cannot solely be attributed to elevated symptom levels below the clinical screening threshold. Instead, it resulted in an increase in the proportion of the population screening positive for possible depressive disorder by ~5–6% points when comparing estimates for CW 11–37 in 2019 with almost the same weeks (CW 11–24) in 2022. Our findings of increasing symptoms of anxiety and decreasing SRMH between 2021 and 2022 are consistent with this picture of a deterioration of mental health in the population. Continued surveillance will show whether this deterioration was temporary or part of a more sustained development. Research using more extensive screening instruments and diagnostic tools as well as research looking at trajectories of mental healthcare needs is also required for a full assessment of longer-term changes and their clinical meaning. However, our results as they stand call for vigilance with regard to possible changes in mental healthcare needs ranging from an increased need for diagnostic clarification and sub-clinical prevention measures to a greater need for secondary prevention. In addition, they point to a great need for mental health promotion and health in all policies approaches (131).
Evidence on vulnerable groups can provide guidance in the allocation of measures of mental health promotion and prevention. Overall, none of the examined sociodemographic groups prove to be consistently resilient. An effective public health response thus faces the challenge of addressing the entire population and cannot target clearly identifiable risk groups. However, in keeping with many other studies, a particular focus on women and young adults, but also the eldest adults, may be warranted. The final months in our time series, which saw the introduction of a new major societal-level stressor, indicates that mental health developments of men and adults in later middle age should also be observed closely. They show that vulnerabilities may be subject to change over time, demanding continued observation and reporting to increase awareness and flexibility in public health policy and mental health practitioners. As was the case before the pandemic, there is still a high need for mental health support for individuals of low socioeconomic status. Despite our finding of particularly early and continued increases in depressive symptoms among the high level of education group, the social gradient of lower mental health in the low level of education groups clearly persists across our time series.
Particularly with regard to current circumstances, mental health trends in the population should be observed and evaluated continuously and systematically. Further temporal dynamics in mental health seem very likely in view of a wide range of potential contributing factors and ongoing crises. These include the continued dynamic development of the pandemic and public health measures in response (132), the risk of chronification of stress reactions due to the persistence of stressors or loss of resources (16, 19), and the emergence of further mental health risk factors such as a long-term economic recession (11, 18) as well as other crises not related to the pandemic. It is possible that recent events such as the war in the Ukraine may have contributed to 2022 mental health declines (120). The exacerbation of the global climate crisis (133, 134) represents another major ongoing contextual factor. All of these crises taken together might also contribute to increased experiences of multiple disasters, which can exert a specific impact on public health (135). Fundamentally, the psychological impact of crises is likely to vary over time. For the pandemic, we can assume overlapping effects of immediate fear, followed by responses to adversities, consequences of insufficient mental health support, and long-term implications of recession or uncertainty (110). Because mental disorders frequently develop over a longer period of time during which multiple stressors exceed individual resources and interact with individual vulnerability, the possibility of delayed and substantial rises in the prevalence of mental disorders cannot be ruled out.
A continuation of mental health surveillance made possible by uninterrupted data collection is also needed in less tumultuous times to safeguard crisis preparedness. Our results show that mental health trends in the general population can change suddenly, supporting the utility of an early warning system. Sufficiently long time series of mental health indicators are required in order for high-frequency surveillance to help inform public health policy by identifying changes, assessing their significance and relevance against the backdrop of previous dynamics, and evaluating the impact of public health interventions effectively. In addition to this fundamental need for continuous mental health data, future studies should expand findings to the whole life span by including the observation of children and adolescents. Moreover, they should go beyond the use of screening instruments to measure symptoms in assessing the prevalence of mental disorders and include longitudinal designs in order to better understand mechanisms of vulnerability and resilience in the face of individual as well as collective determinants of mental health.
Data availability statement
The data set cannot be made publicly available because informed consent from study participants did not cover public deposition of data. The population-based data from the German health monitoring program that was used in this study is available from the Robert Koch Institute (RKI) but restrictions apply to the availability of this data, which was used under license for the current study. A minimal data set is archived in the Health Monitoring Research Data Centre at the RKI and can be accessed by all interested researchers. On-site access to the data set is possible at the Secure Data Centre of the RKI's Health Monitoring Research Data Centre. Requests should be submitted to the Health Monitoring Research Data Centre, Robert Koch Institute, Berlin, Germany (email: ZmR6QHJraS5kZQ==).
Ethics statement
GEDA and COVIMO are subject to strict compliance with the data protection provisions set out in the EU General Data Protection Regulation (GDPR) and the Federal Data Protection Act (BDSG). Participation in the study was voluntary. The participants were informed about the aims and contents of the study and about data protection. Informed consent was obtained verbally. In the case of GEDA 2019/2020, the Ethics Committee of the Charité–Universitätsmedizin Berlin assessed the ethics of the study and approved the implementation of the study (application number EA2/070/19).
Author contributions
EM and LW wrote most sections of the manuscript, integrating drafts for specific sections from co-authors. EM developed the main conceptual ideas and coordinated the research process as a senior researcher. EM, LW, SJ, SD, CK, and SM developed the specific research questions and discussed the analytical approach. SJ performed the statistical analyses, worked with SD to develop the statistical methods, and produced the results graphs. Together they drafted the analysis section of the manuscript. LW and EM interpreted the results. CK primarily contributed to the interpretation of educational disparities, assisted by SM as senior researcher in the area of health inequalities. JT, as project leader of the Mental Health Surveillance, contributed to all content discussions and by drafting some sections of the Introduction and Discussion. SE contributed information on the existing relevant literature for Germany. DP and SS contributed to the manuscript with comments and suggestions, as did HH as the head of the Unit of Mental Health at the RKI. All authors gave crucial input on drafts of the manuscript and read and approved the final version.
Funding
The “MHS–Establishment of a National Mental Health Surveillance at Robert Koch-Institute” project is funded by the Federal Ministry of Health (Grant Number: ZMI5-2519FSB402). CK collaboration on social inequalities in mental health during the pandemic was funded by the German Research Foundation (Project Number: 458531028).
Acknowledgments
We would like to thank all colleagues in Unit 21: Epidemiological Data Center of the Department RKI who provides us with quality-assured data on a monthly basis. In particular, Jennifer Allen as project manager of the GEDA surveys has collaborated continuously.
Conflict of interest
The authors declare that the research was conducted in the absence of any commercial or financial relationships that could be construed as a potential conflict of interest.
The handling editor WR declared a shared affiliation with the author SS at the time of review.
Publisher's note
All claims expressed in this article are solely those of the authors and do not necessarily represent those of their affiliated organizations, or those of the publisher, the editors and the reviewers. Any product that may be evaluated in this article, or claim that may be made by its manufacturer, is not guaranteed or endorsed by the publisher.
Supplementary material
The Supplementary Material for this article can be found online at: https://www.frontiersin.org/articles/10.3389/fpubh.2023.1065938/full#supplementary-material
Abbreviations
COVIMO, COVID-19 vaccination rate monitoring in Germany; CW, calendar week; GAD-2, Generalized Anxiety Disorder Questionnaire (2 items); GEDA, German Health Update; EHIS, European Health Interview Survey; PHQ-2/8/9, Patient Health Questionnaire (2/8/9 items); RKI, Robert Koch Institute; SES, Socio-economic status; SRMH, Self-rated mental health.
References
1. World Health Organization. Timeline of WHO's Response to COVID-19. (2020). Available online at: https://www.who.int/news-room/detail/29-06-2020-covidtimeline (accessed May 27, 2022).
2. United Nations. Policy Brief: COVID-19 and the Need for Action on Mental Health. 2020. New York: United Nations. Available online at: https://unsdg.un.org/resources/policy-brief-covid-19-and-need-action-mental-health (accessed May 30, 2022).
3. Choi KR, Heilemann MV, Fauer A, Mead M. A second pandemic: mental health spillover from the novel coronavirus (COVID-19). J Am Psychiatr Nurses Assoc. (2020) 26:340–3. doi: 10.1177/1078390320919803
4. Holmes EA, O'Connor RC, Perry VH, Tracey I, Wessely S, Arseneault L, et al. Multidisciplinary research priorities for the COVID-19 pandemic: a call for action for mental health science. Lancet Psychiatry. (2020) 7:547–60. doi: 10.1016/S2215-0366(20)30168-1
5. Royal College of Psychiatrists. Psychiatrists See Alarming Rise in Patients Needing Urgent and Emergency Care and Forecast a ‘Tsunami’ of Mental Illness. (2020). Available online at: https://www.rcpsych.ac.uk/news-and-features/latest-news/detail/2020/05/15/psychiatrists-see-alarming-rise-in-patients-needing-urgent-and-emergency-care (accessed June 13, 2021).
6. IASC Reference Group on Mental Health Psychosocial Support in Emergency Settings. Interim Briefing Note: Adressing Mental Health and Psychosocial Aspects of Covid-19 Outbreak. Version 1.5. 2020. Inter-Agency Standing Committee. Available online at: https://interagencystandingcommittee.org/iasc-reference-group-mental-health-and-psychosocial-support-emergency-settings/interim-briefing-note-addressing-mental-health-and-psychosocial-aspects-covid-19-outbreak (accessed March 19, 2020).
7. Perrin PC, McCabe OL, Everly GS, Links JM. Preparing for an influenza pandemic: mental health considerations. Prehosp Disaster Med. (2009) 24:223–30. doi: 10.1017/S1049023X00006853
8. Shultz JM, Baingana F, Neria Y. The 2014 ebola outbreak and mental health: current status and recommended response. JAMA. (2015) 313:567–8. doi: 10.1001/jama.2014.17934
9. North C, Pfefferbaum B. Mental health response to community disasters a systematic review. JAMA. (2013) 310:507–18. doi: 10.1001/jama.2013.107799
10. Frasquilho D, Matos MG, Salonna F, Guerreiro D, Storti CC, Gaspar T, et al. Mental health outcomes in times of economic recession: a systematic literature review. BMC Public Health. (2016) 16:115. doi: 10.1186/s12889-016-2720-y
11. Backhaus I, Hoven H, Di Tecco C, Iavicoli S, Conte A, Dragano N. Economic change and population health: lessons learnt from an umbrella review on the Great Recession. BMJ Open. (2022) 12:e060710. doi: 10.1136/bmjopen-2021-060710
12. Brooks SK, Webster RK, Smith LE, Woodland L, Wessely S, Greenberg N, et al. The psychological impact of quarantine and how to reduce it: rapid review of the evidence. Lancet. (2020) 395:912–20. doi: 10.1016/S0140-6736(20)30460-8
13. Hossain MM, Sultana A, Purohit N. Mental health outcomes of quarantine and isolation for infection prevention: a systematic umbrella review of the global evidence. Epidemiol Health. (2020) 42:e2020038. doi: 10.4178/epih.e2020038
14. Kofman YB, Garfin DR. Home is not always a haven: the domestic violence crisis amid the COVID-19 pandemic. Psychol Trauma. (2020) 12:S199–201. doi: 10.1037/tra0000866
15. Morina N, Kip A, Hoppen TH, Priebe S, Meyer T. Potential impact of physical distancing on physical and mental health: a rapid narrative umbrella review of meta-analyses on the link between social connection and health. BMJ Open. (2021) 11:e042335. doi: 10.1136/bmjopen-2020-042335
16. Brakemeier EL, Wirkner J, Knaevelsrud C, Wurm S, Christiansen H, Lueken U, et al. Die COVID-19-Pandemie als Herausforderung für die psychische Gesundheit: Erkenntnisse und Implikationen für die Forschung und Praxis aus Sicht der Klinischen Psychologie und Psychotherapie. Zeitschrift für Klinische Psychologie und Psychotherapie. (2020) 49:1–31. doi: 10.1026/1616-3443/a000574
17. Pak A, Adegboye OA, Adekunle AI, Rahman KM, McBryde ES, Eisen DP. Economic consequences of the COVID-19 outbreak: the need for epidemic preparedness. Front Public Health. (2020) 8:241. doi: 10.3389/fpubh.2020.00241
18. Brenner MH, Bhugra D. Acceleration of Anxiety, Depression, and Suicide: Secondary Effects of Economic Disruption Related to COVID-19. Front Psychiatry. (2020) 11(1422). doi: 10.3389/fpsyt.2020.592467
19. Gruber J, Prinstein MJ, Clark LA, Rottenberg J, Abramowitz JS, Albano AM, et al. Mental health and clinical psychological science in the time of COVID-19: challenges, opportunities, and a call to action. Am Psychol. (2021) 76:409–26. doi: 10.1037/amp0000707
20. Schilling J, Buda S, Fischer M, Goerlitz L, Grote U, Haas W, et al. Retrospektive Phaseneinteilung der COVID-19-Pandemie in Deutschland bis Februar 2021. Epidemiol Bull. (2021) 3–12.
21. Schilling J, Buda S, Tolksdorf K. Zweite Aktualisierung der “Retrospektiven Phaseneinteilung der COVID-19- Pandemie in Deutschland”. Epidemiol Bull. (2022) 3–5.
22. Tolksdorf K, Loenenbach A, Buda S. Dritte Aktualisierung der “Retrospektiven Phaseneinteilung der COVID-19- Pandemie in Deutschland”. Epidemiol Bull. (2022) 3–6.
23. Tolksdorf K, Buda S, Schilling J. Aktualisierung zur “Retrospektiven Phaseneinteilung der COVID-19-Pandemie in Deutschland”. Epidemiol Bull. (2021) 3–4.
24. Schilling J, Tolksdorf K, Marquis A, Faber M, Pfoch T, Buda S, et al. Die verschiedenen phasen der COVID-19-pandemie in deutschland: eine deskriptive analyse von Januar 2020 bis Februar 2021. Bundesgesundheitsblatt Gesundheitsforschung Gesundheitsschutz. (2021) 64:1093–106. doi: 10.1007/s00103-021-03394-x
25. Ethikrat D. Vulnerabilität und Resilienz in der Krise–Ethische Kriterien für Entscheidungen in einer Pandemie. (2022). Available online at: https://www.ethikrat.org/fileadmin/Publikationen/Stellungnahmen/deutsch/stellungnahme-vulnerabilitaet-und-resilienz-in-der-krise.pdf (accessed April 29, 2022).
26. Bauer J, Blickle P, Endt C, Engmann R, Erdmann E, Grefe-Huge C, et al. Corona-Zahlen in Deutschland: Coronavirus in Deutschland – alle aktuellen Zahlen auf einer Karte 2022. (2022). Available online at: https://www.zeit.de/wissen/aktuelle-corona-zahlen-karte-deutschland-landkreise (accessed December 21, 2022).
27. Bundesregierung. Videokonferenz der Bundeskanzlerin mit den Regierungschefinnen und Regierungschefs der Länder am 28. (2020). Videokonferenz der Bundeskanzlerin mit den Regierungschefinnen und Regierungschefs der Länder am 28 (accessed December 21, 2022).
28. Bundesregierung. Einzelhandel geschlossen, Supermärkte bleiben offen 2020. (2020). Available online at: https://www.bundesregierung.de/breg-de/themen/coronavirus/bundesweiter-lockdown-1829134 (accessed December 21, 2022).
29. ZDF. Öffnungen, Notbremse, Tests: Shutdown wird verlängert - mit Lockerungen 2021. (2021). Available online at: https://www.zdf.de/nachrichten/politik/corona-lockerungen-oeffnung-notbremse-100.html
30. Bundesgesundheitsministerium. Chronik zum Coronavirus SARS-CoV-2 2022. (2022). Available online at: https://www.bundesgesundheitsministerium.de/coronavirus/chronik-coronavirus.html (accessed September 21, 2022).
31. Bundesregierung. Coronavirus in Deutschland. Covid-19-Fallzahlen in Deutschland. (2022). Available online at: https://www.bundesregierung.de/breg-de/themen/coronavirus (accessed August 5, 2022).
32. Bundesregierung. Videoschaltkonferenz der Bundeskanzlerin mit den Regierungschefinnen und Regierungschefs der Länder am 18. (2021). Available online at: https://www.bundesregierung.de/resource/blob/974430/1982598/defbdff47daf5f177586a5d34e8677e8/2021-11-18-mpk-data.pdf?download=1 (accessed December 21, 2022).
33. Bundesregierung. Videoschaltkonferenz des Bundeskanzlers mit den Regierungschefinnen und Regierungschefs der Länder am 21. (2021). Available online at: https://www.bundesregierung.de/resource/blob/974430/1990312/5aded0cbf837124818e6af8feceb15c7/2021-12-21-mpk-beschluss-data.pdf?download=1 (accessed December 21, 2022).
34. Bundesregierung. Videoschaltkonferenz des Bundeskanzlers mit den Regierungschefinnen und Regierungschefs der Länder am 16. (2022). Available online at: https://www.bundesregierung.de/resource/blob/974430/2005140/c4b34f495b329f74f43616dd7ccd7d7c/2022-02-16-mpk-beschluss-data.pdf?download=1 (accessed December 21, 2022).
35. Deutschlandfunk. Corona-Pandemie. Die meisten bundesweiten Maßnahmen sind weggefallen. (2022). Available online at: https://www.deutschlandfunk.de/-debatte-um-neufassung-infektionsschutzgesetz-coronamassnahmen-ende-maskenpflicht-100.html (accessed December 21, 2022).
36. Vindegaard N, Benros ME. COVID-19 pandemic and mental health consequences: Systematic review of the current evidence. Brain Behav Immun. (2020) 89:531–42. doi: 10.1016/j.bbi.2020.05.048
37. Aknin LB, De Neve JE, Dunn EW, Fancourt DE, Goldberg E, Helliwell JF, et al. Mental health during the first year of the COVID-19 pandemic: a review and recommendations for moving forward. Perspect Psychol Sci. (2022) 17:915–36. doi: 10.1177/17456916211029964
38. Richter D, Riedel-Heller S, Zuercher S. Mental health problems in the general population during and after the first lockdown phase due to the SARS-CoV-2 pandemic: rapid review of multi-wave studies. Epidemiol Psychiatr Sci. (2021) 30:1–17. doi: 10.1017/s2045796021000160
39. Sun Y, Wu Y, Bonardi O, Krishnan A, He C, Boruff JT, et al. Comparison of mental health symptoms prior to and during COVID-19: evidence from a living systematic review and meta-analysis. medRxiv. (2021). doi: 10.1101/2021.05.10.21256920
40. Robinson E, Sutin AR, Daly M, Jones A. A systematic review and meta-analysis of longitudinal cohort studies comparing mental health before versus during the COVID-19 pandemic in 2020. J Affect Disord. (2022) 296:567–76. doi: 10.1016/j.jad.2021.09.098
41. Wirkner J, Christiansen H, Knaevelsrud C, Lüken U, Wurm S, Schneider S, et al. Mental Health in Times of the COVID-19 Pandemic. Eur Psychol. (2021) 26:310–22. doi: 10.1027/1016-9040/a000465
42. Bower M, Smout S, Donohoe-Bales A, Teesson L, Lauria E, Boyle J, et al. A hidden pandemic? an umbrella review of global evidence on mental health in the time of COVID-19. PsyArXiv. (2022). doi: 10.31234/osf.io/bzpvw
43. Mauz E, Eicher S, Peitz D, Junker S, Hölling H, Thom J. Mental Health of the Adult Population in Germany During the COVID-19 Pandemic. Rapid Review. Robert Koch-Institut. (2022). 2022(S7):1–63. doi: 10.25646/9537
44. Riepenhausen A, Veer IM, Wackerhagen C, Reppmann ZC, Köber G, Ayuso-Mateos JL, et al. Coping with COVID: risk and resilience factors for mental health in a German representative panel study. Psychol Med. (2022) 1–11. doi: 10.1017/S0033291722000563
45. Hettich N, Entringer TM, Kroeger H, Schmidt P, Tibubos AN, Braehler E, et al. Impact of the COVID-19 pandemic on depression, anxiety, loneliness, and satisfaction in the German general population: a longitudinal analysis. Soc Psychiatry Psychiatr Epidemiol. (2022). doi: 10.1007/s00127-022-02311-0
46. Dragano N, Reuter M, Berger K. Increase in mental disorders during the COVID-19 pandemic—the role of occupational and financial strains. Dtsch Arztebl Int. (2022) 119:179–87. doi: 10.1093/eurpub/ckac129.028
47. Stiftung Deutsche Depressionshilfe. Deutschland-Barometer Depression 2021: COVID-19 und die Folgen für die psychische Gesundheit. (2021). Available online at: https://www.deutsche-depressionshilfe.de/forschungszentrum/deutschland-barometer-depression/id-2021 (accessed June 21, 2021).
48. Lund C, Brooke-Sumner C, Baingana F, Baron EC, Breuer E, Chandra P, et al. Social determinants of mental disorders and the sustainable development goals: a systematic review of reviews. Lancet Psychiatry. (2018) 5:357–69. doi: 10.1016/S2215-0366(18)30060-9
49. Gibson B, Schneider J, Talamonti D, Forshaw M. The impact of inequality on mental health outcomes during the COVID-19 pandemic: a systematic review. Can Psychol. (2021) 62:101–26. doi: 10.1037/cap0000272
50. Purtle J. COVID-19 and mental health equity in the United States. Soc Psychiatry Psychiatr Epidemiol. (2020) 55:969–71. doi: 10.1007/s00127-020-01896-8
51. Santomauro DF, Mantilla Herrera AM, Shadid J, Zheng P, Ashbaugh C, Pigott DM, et al. Global prevalence and burden of depressive and anxiety disorders in 204 countries and territories in 2020 due to the COVID-19 pandemic. Lancet. (2021) 398:1700–12. doi: 10.1016/S0140-6736(21)02143-7
52. Patel K, Robertson E, Kwong ASF, Griffith GJ, Willan K, Green MJ, et al. Psychological distress before and during the COVID-19 pandemic among adults in the United Kingdom based on coordinated analyses of 11 longitudinal studies. JAMA Netw Open. (2022) 5:e227629–e. doi: 10.1001/jamanetworkopen.2022.7629
53. Flor LS, Friedman J, Spencer CN, Cagney J, Arrieta A, Herbert ME, et al. Quantifying the effects of the COVID-19 pandemic on gender equality on health, social, and economic indicators: a comprehensive review of data from March, 2020, to September, 2021. Lancet. (2022) 399:2381–97. doi: 10.1016/S0140-6736(22)00008-3
54. Daly M, Sutin AR, Robinson E. Depression reported by US adults in 2017-2018 and March and April 2020. J Affect Disord. (2021) 278:131–5. doi: 10.1016/j.jad.2020.09.065
55. Pedersen MT, Andersen TO, Clotworthy A, Jensen AK, Strandberg-Larsen K, Rod NH, et al. Time trends in mental health indicators during the initial 16 months of the COVID-19 pandemic in Denmark. BMC Psychiatry. (2022) 22:25. doi: 10.1186/s12888-021-03655-8
56. Butterworth P, Schurer S, Trinh TA, Vera-Toscano E, Wooden M. Effect of lockdown on mental health in Australia: evidence from a natural experiment analysing a longitudinal probability sample survey. Lancet Public Health. (2022) 7:e427–36. doi: 10.1016/S2468-2667(22)00082-2
57. Entringer T, Kröger H. Weiterhin einsam und weniger zufrieden – Die Covid-19-Pandemie wirkt sich im zweiten Lockdown stärker auf das Wohlbefinden aus. DIW aktuell 67 Berlin. (2021). Available online at: https://www.diw.de/documents/publikationen/73/diw_01.c.820781.de/diw_aktuell_67.pdf (accessed February 1, 2023).
58. Capaldi CA, Liu L, Dopko RL. Positive mental health and perceived change in mental health among adults in Canada during the second wave of the COVID-19 pandemic. Health Promot Chronic Dis Prev Can. (2021) 41:359–77. doi: 10.24095/hpcdp.41.11.05
59. Entringer T, Kröger H. Psychische Gesundheit im zweiten Covid-19 Lockdown in Deutschland. In: SOEP Papers on Multidisciplinary Panel Data Research 1136. (2021). Available online at: https://www.diw.de/de/diw_01.c.819603.de/publikationen/soeppapers/2021_1136/psychische_gesundheit_im_zweiten_covid-19_lockdown_in_deutschland.html (accessed February 1, 2023).
60. Gilan D, Röthke N, Blessin M, Kunzler A, Stoffers-Winterling J, Müssig M, et al. Psychomorbidity, resilience, and exacerbating and protective factors during the SARS-CoV-2 pandemic. Dtsch Arztebl Int. (2020) 117:625–30. doi: 10.3238/arztebl.2020.0625
61. Peters A, Rospleszcz S, Greiser KH, Dallavalle M, Berger K. The Impact of the COVID-19 Pandemic on Self-Reported Health. Dtsch Arztebl Int. (2020) 117:861–7. doi: 10.3238/arztebl.2020.0861
62. Entringer T, Kröger H, Schupp J, Kühne S, Liebig S, Goebel J, et al. Psychische Krise durch Covid-19? Sorgen sinken, Einsamkeit steigt, Lebenszufriedenheit bleibt stabil. In: SOEP Papers on Multidisciplinary Panel Data Research 1087. (2020). Available online at: https://www.diw.de/de/diw_01.c.791364.de/publikationen/soeppapers/2020_1087/psychische_krise_durch_covid-19__sorgen_sinken__einsamkeit_steigt__lebenszufriedenheit_bleibt_stabil.html (accessed February 1, 2023).
63. Holst H, Fessler A, Niehoff S. Covid-19, social class and work experience in Germany: inequalities in work-related health and economic risks. Eur Soc. (2021) 23:S495–512. doi: 10.1080/14616696.2020.1828979
64. Witteveen D, Velthorst E. Economic hardship and mental health complaints during COVID-19. Proc Nat Acad Sci. (2020) 117:27277. doi: 10.1073/pnas.2009609117
65. Luo M, Guo L, Yu M, Jiang W, Wang H. The psychological and mental impact of coronavirus disease 2019 (COVID-19) on medical staff and general public - a systematic review and meta-analysis. Psychiatry Res. (2020) 291:113190. doi: 10.1016/j.psychres.2020.113190
66. Wang Y, Kala MP, Jafar TH. Factors associated with psychological distress during the coronavirus disease 2019 (COVID-19) pandemic on the predominantly general population: A systematic review and meta-analysis. PLoS ONE. (2020) 15:e0244630. doi: 10.1371/journal.pone.0244630
67. Reme BA, Wörn J, Skirbekk V. Longitudinal evidence on the development of socioeconomic inequalities in mental health due to the COVID-19 pandemic in Norway. Sci Rep. (2022) 12:3837. doi: 10.1038/s41598-022-06616-7
68. Findlay LC, Arim R, Kohen D. Understanding the Perceived Mental Health of Canadians During the COVID-19 Pandemic. Health Rep. (2020) 31:22–7. doi: 10.25318/82-003-x202000400003-eng
69. Daly M, Sutin AR, Robinson E. Longitudinal changes in mental health and the COVID-19 pandemic: evidence from the UK Household Longitudinal Study. Psychol Med. (2020) 52:2549–58. doi: 10.1017/S0033291720004432
70. Wanberg CR, Csillag B, Douglass RP, Zhou L, Pollard MS. Socioeconomic status and well-being during COVID-19: a resource-based examination. J Appl Psychol. (2020) 105:1382–96. doi: 10.1037/apl0000831
71. Lee LM, Teutsch SM, Thacker SB, St Louis ME. Principles and Practice of Public Health Surveillance. 3 ed. Oxford: Oxford University Press (2010).
72. Choi BC. The past, present, and future of public health surveillance. Scientifica (Cairo). (2012) 2012:875253. doi: 10.6064/2012/875253
73. Jia H, Guerin RJ, Barile JP, Okun AH, McKnight-Eily L, Blumberg SJ, et al. National and state trends in anxiety and depression severity scores among adults during the COVID-19 pandemic - United States, 2020–2021. In: US Department of Health and Human Services/Centers for Disease Control and Prevention. Morbidity and Mortality Weekly Report (MMWR). (2021). 70:1427–32. doi: 10.15585/mmwr.mm7040e3externalicon
74. Office for Health Improvement and Disparities. Wider Impacts of COVID-19 on Health (WICH) Monitoring Tool. Mental Health and Wellbeing: Office for Health Improvement and Disparities. (2022). Available online at: https://analytics.phe.gov.uk/apps/covid-19-indirect-effects/# (accessed September 15, 2022).
75. Jacobi F, Mack S, Gerschler A, Scholl L, Hofler M, Siegert J, et al. The design and methods of the mental health module in the German Health Interview and Examination Survey for Adults (DEGS1-MH). Int J Methods Psychiatr Res. (2013) 22:83–99. doi: 10.1002/mpr.1387
76. Jacobi F, Wittchen HU, Müller N, Hölting C, Sommer S, Lieb R, et al. Estimating the prevalence of mental and somatic disorders in the community: aims and methods of the German national health interview and examination survey. Int J Methods Psychiatr Res. (2002) 11:1–19. doi: 10.1002/mpr.118
77. Scheidt-Nave C, Kamtsiuris P, Gößwald A, Hölling H, Lange M, Busch MA, et al. German health interview and examination survey for adults (DEGS) - design, objectives and implementation of the first data collection wave. BMC Public Health. (2012) 12:1–16. doi: 10.1186/1471-2458-12-730
78. Allen J, Born S, Damerow S, Kuhnert R, Lemcke J, Müller A, et al. German Health Update (GEDA 2019/2020-EHIS) – Background and Methodology. J Health Monitor. (2021) 6:66–79. doi: 10.25646/8559
79. Lange C, Finger JD, Allen J, Born S, Hoebel J, Kuhnert R, et al. Implementation of the European health interview survey (EHIS) into the German health update (GEDA). Arch Public Health. (2017) 75:40. doi: 10.1186/s13690-017-0208-6
80. Peitz D, Kersjes C, Thom J, Hölling H, Mauz E. Indicators for public mental health: a scoping review. Front Public Health. (2021) 9:714497. doi: 10.3389/fpubh.2021.714497
81. Thom J, Mauz E, Peitz D, Kersjes C, Aichberger M, Baumeister H, et al. Establishing a mental health surveillance in Germany: development of a framework concept and indicator set. J Health Monit. (2021) 6:34–63. doi: 10.25646/8861
82. Thom J, Peitz D, Kersjes C, Hölling H, Mauz E. Proceedings of the international workshop “integration of international expertise in the development of a mental health surveillance system in Germany”. BMC Proce. (2020) 14(S4):1–5. doi: 10.1186/s12919-020-00186-0
83. Robert Koch-Institut & Usuma Markt- und Sozialforschung. COVIMO - COVID-19 Impfquoten-Monitoring in Deutschland. Bundesweite Bevölkerungsbefragung im Rahmen der Durchführung von telefonischen Ad-hoc-Befragungen für das Robert Koch-Institut. Methodenbericht. (2022). Available online at: https://www.rki.de/DE/Content/InfAZ/N/Neuartiges_Coronavirus/Projekte_RKI/COVIMO_Reports/covimo_methodenbericht.pdf?__blob=publicationFile (accessed September 5, 2022).
84. Reininghaus U, Schomerus G, Hölling H, Seidler A, Gerhardus A, Gusy B, et al. “Shifting the Curve”: Neue Entwicklungen und Herausforderungen im Bereich der Public Mental Health. Psychiatr Prax. (2022) 49:1–5. doi: 10.1055/a-1823-5191
85. Kroenke K, Strine TW, Spitzer RL, Williams JBW, Berry JT, Mokdad AH. The PHQ-8 as a measure of current depression in the general population. J Affect Disord. (2009) 114:163–73. doi: 10.1016/j.jad.2008.06.026
86. Löwe B, Kroenke K, Gräfe K. Detecting and monitoring depression with a two-item questionnaire (PHQ-2). J Psychosom Res. (2005) 58:163–71. doi: 10.1016/j.jpsychores.2004.09.006
87. Damerow S, Rommel A, Prütz F, Beyer AK, Hapke U, Schienkiewitz A, et al. Developments in the health situation in Germany during the initial stage of the COVID-19 pandemic for selected indicators of GEDA 2019/2020-EHIS. J Health Monit. (2020) 5:3–20. doi: 10.25646/7172
88. Kroenke K, Spitzer RL, Williams JBW, Monahan PO, Löwe B. Anxiety disorders in primary care: prevalence, impairment, comorbidity, and detection. Ann Intern Med. (2007) 146:317–25. doi: 10.7326/0003-4819-146-5-200703060-00004
89. Ahmad F, Jhajj AK, Stewart DE, Burghardt M, Bierman AS. Single item measures of self-rated mental health: a scoping review. BMC Health Serv Res. (2014) 14:398. doi: 10.1186/1472-6963-14-398
90. Robert Koch-Institut. Gesundheit in Deutschland Aktuell (GEDA). (2022). Available online at: https://www.geda-studie.de/gesundheitsstudie.html (accessed September 5, 2022).
91. Junker S, Damerow S, Walther L, Mauz E. Infrastructure and statistical methods for a high frequency mental health surveillance in Germany. Front Public Health. Manuscript in Preperation (2023).
92. Spangenberg L, Brähler E, Glaesmer H. Wie gut eignen sich verschiedene Versionen des Depressionsmoduls des Patient Health Questionnaires zur Identifikation depressiver Personen in der Allgemeinbevölkerung? Zeitschrift für Psychosomatische Medizin und Psychotherapie. (2012) 58:3–10. doi: 10.13109/zptm.2012.58.1.3
93. Eisinga R. Grotenhuis Mt, Pelzer B. The reliability of a two-item scale: pearson, Cronbach, or Spearman-Brown? Int J Public Health. (2013) 58:637–42. doi: 10.1007/s00038-012-0416-3
94. Levinson D, Kaplan G. What does self rated mental health represent. J Public Health Res. (2014) 3:287. doi: 10.4081/jphr.2014.287
95. RDC of the Federal Statistical Office and Statistical Offices of the Federal States. Microcensus, Own Calculations. doi: 10.21242/12211.2018.00.00.3.1.1
96. Brauns H, Scherer S, Steinmann S. The CASMIN Educational Classification in International Comparative Research. In:Hoffmeyer-Zlotnik JHP, Wolf C, , editors. Advances in Cross-National Comparison: A European Working Book for Demographic and Socio-Economic Variables. Boston, MA: Springer US. (2003). p. 221–44.
97. Hyndman RJ. Moving averages. In:Lovric M, , editor. International Encyclopedia of Statistical Science. Berlin, Heidelberg: Springer. (2011). p. 866–9.
98. Graubard BI, Korn EL. Predictive margins with survey data. Biometrics. (1999) 55:652–9. doi: 10.1111/j.0006-341X.1999.00652.x
99. Lane PW, Nelder JA. Analysis of covariance and standardization as instances of prediction. Biometrics. (1982) 38:613–21. doi: 10.2307/2530043
100. Muller CJ, MacLehose RF. Estimating predicted probabilities from logistic regression: different methods correspond to different target populations. Int J Epidemiol. (2014) 43:962–70. doi: 10.1093/ije/dyu029
101. Hastie T, Tibshirani R. Generalized Additive Models. Stat Sci. (1986) 1:297–310, 14. doi: 10.1214/ss/1177013604
102. Wood SN. Thin plate regression splines. J Roy Stat Soc. (2003) 65:95–114. doi: 10.1111/1467-9868.00374
103. Wood SN. Generalized Additive Models: An Introduction with R. 2 ed Boca Raton, Florida: Chapman and Hall/CRC. (2017).
104. Coull BA, Ruppert D, Wand MP. Simple incorporation of interactions into additive models. Biometrics. (2001) 57:539–45. doi: 10.1111/j.0006-341X.2001.00539.x
106. Meier U. A note on the power of Fisher's least significant difference procedure. Pharm Stat. (2006) 5:253–63. doi: 10.1002/pst.210
107. John Hopkins University of Medicine. Coronavirus Ressource Center - New COVID-19 Cases Worldwide. In: Maps and Trends. (2022). Available online at: https://coronavirus.jhu.edu/data/new-cases (accessed September 28, 2022).
108. Damerow S, Rommel A, Beyer AK, Hapke U, Schienkiewitz A, Starker A, et al. Health situation in Germany during the COVID-19 pandemic. Developments Over Time for Selected Indicators of GEDA 2019/2020 – An update. J Health Monit. (2022) 7:2–19. doi: 10.25646/9880
109. Kunzler AM, Röthke N, Günthner L, Stoffers-Winterling J, Tüscher O, Coenen M, et al. Mental burden and its risk and protective factors during the early phase of the SARS-CoV-2 pandemic: systematic review and meta-analyses. Glob Health. (2021) 17:34. doi: 10.1186/s12992-021-00670-y
110. Helliwell JF, Layard R, Sachs J, De Neve JE, Aknin LB, Wang S. World Happiness Report 2021. New York: Sustainable Development Solutions Network. (2021). Available online at: https://happiness-report.s3.amazonaws.com/2021/WHR+21.pdf
111. Twenge JM, Joiner TEUS. Census bureau-assessed prevalence of anxiety and depressive symptoms in 2019 and during the 2020 COVID-19 pandemic. Depress Anxiety. (2020) 37:954–6. doi: 10.1002/da.23077
112. Kuehner C, Schultz K, Gass P, Meyer-Lindenberg A, Dressing H. Mental health status in the community during the covid-19-pandemic. Psychiat Prax. (2020) 47:361–9. doi: 10.1055/a-1222-9067
113. Sachser C, Olaru G, Pfeiffer E, Brähler E, Clemens V, Rassenhofer M, et al. The immediate impact of lockdown measures on mental health and couples' relationships during the COVID-19 pandemic - results of a representative population survey in Germany. Soc Sci Med. (2021) 278:113954. doi: 10.1016/j.socscimed.2021.113954
114. Fancourt D, Steptoe A, Bu F. Trajectories of anxiety and depressive symptoms during enforced isolation due to COVID-19 in England: a longitudinal observational study. Lancet Psychiatry. (2021) 8:141–9. doi: 10.1016/S2215-0366(20)30482-X
115. Hyland P, Shevlin M, Murphy J, McBride O, Fox R, Bondjers K, et al. A longitudinal assessment of depression and anxiety in the Republic of Ireland before and during the COVID-19 pandemic. Psychiatry Res. (2021) 300:113905. doi: 10.1016/j.psychres.2021.113905
116. Tsai F-Y, Schillok H, Coenen M, Merkel C, Jung-Sievers C. Group obotCS. The Well-Being of the German Adult Population Measured with the WHO-5 over Different Phases of the COVID-19 Pandemic: An Analysis within the COVID-19 Snapshot Monitoring Study (COSMO). Int J Environ Res Public Health. (2022) 19:3236. doi: 10.3390/ijerph19063236
117. Aknin LB, Andretti B, Goldszmidt R, Helliwell JF, Petherick A, De Neve JE, et al. Policy stringency and mental health during the COVID-19 pandemic: a longitudinal analysis of data from 15 countries. Lancet Public Health. (2022) 7:e417–26. doi: 10.1016/S2468-2667(22)00060-3
118. Benasi G, Fava GA, Guidi J. Prodromal symptoms in depression: a systematic review. Psychother Psychosom. (2021) 90:365–72. doi: 10.1159/000517953
119. Cosci F, Fava GA. Staging of mental disorders: systematic review. Psychother Psychosom. (2013) 82:20–34. doi: 10.1159/000342243
120. Jawaid A, Gomolka M, Timmer A. Neuroscience of trauma and the Russian invasion of Ukraine. Nat Hum Behav. (2022) 6:748–9. doi: 10.1038/s41562-022-01344-4
121. McAlpine DD, McCreedy E, Alang S. The meaning and predictive value of self-rated mental health among persons with a mental health problem. J Health Soc Behav. (2018) 59:200–14. doi: 10.1177/0022146518755485
122. Bohlken J, Kostev K, Riedel-Heller S, Hoffmann W, Michalowsky B. Effect of the COVID-19 pandemic on stress, anxiety, and depressive disorders in German primary care: a cross-sectional study. J Psychiatr Res. (2021) 143:43–9. doi: 10.1016/j.jpsychires.2021.08.016
123. Entringer T, Kröger H. Einsam, aber resilient –Die Menschen haben den Lockdown besser verkraftet als vermutet. DIW aktuell 46 Berlin. (2020). Available online at: https://www.diw.de/de/diw_01.c.791408.de/publikationen/diw_aktuell/2020_0046/einsam__aber_resilient_____die_menschen_haben_den_lockdown_besser_verkraftet_als_vermutet.html (accessed February 5, 2021).
124. Schröder C, Entringer T, Goebel J, Grabka M, Graeber D, Kroh M, et al. Erwerbstätige sind vor dem Covid-19-Virus nicht alle gleich. SOEPPapers on Multidisciplinary Panel Data Research 1080. (2021). Available online at: https://www.diw.de/documents/publikationen/73/diw_01.c.789529.de/diw_sp1080.pdf (accessed September 15, 2021).
125. Häder S, Sand M. Telefonstichproben. In: Häder S, Häder M, Schmich P. Telefonumfragen in Deutschland. Wiesbaden: Springer Fachmedien. (2019). p. 113–51.
126. Haapea M, Miettunen J, Läära E, Joukamaa MI, Järvelin MR, Isohanni MK, et al. Non-participation in a field survey with respect to psychiatric disorders. Scand J Public Health. (2008) 36:728–36. doi: 10.1177/1403494808092250
127. Pierce M, McManus S, Jessop C, John A, Hotopf M, Ford T, et al. Says who? The significance of sampling in mental health surveys during COVID-19. Lancet Psychiatry. (2020) 7:567–8. doi: 10.1016/S2215-0366(20)30237-6
128. Stochl J, Fried EI, Fritz J, Croudace TJ, Russo DA, Knight C, et al. On Dimensionality, measurement invariance, and suitability of sum scores for the PHQ-9 and the GAD-7. Assessment. (2022) 29:355–66. doi: 10.1177/1073191120976863
129. Schmidt-Atzert L, Amelang M, Fydrich T, Moosbrugger H. Psychologische Diagnostik. Berlin, Heidelberg: Springer. (2012).
130. Zhang X, Kuchinke L, Woud ML, Velten J, Margraf J. Survey method matters: Online/offline questionnaires and face-to-face or telephone interviews differ. Comput Human Behav. (2017) 71:172–80. doi: 10.1016/j.chb.2017.02.006
131. The Helsinki Statement on Health in All Policies. Health Promot Int. (2014) 29:i17–i8. doi: 10.1093/heapro/dau036
132. Sønderskov KM, Dinesen PT, Santini ZI, Østergaard SD. Increased psychological well-being after the apex of the COVID-19 pandemic. Acta Neuropsychiatr. (2020) 32:277–9. doi: 10.1017/neu.2020.26
133. Cianconi P, Betrò S, Janiri L. The Impact of climate change on mental health: a systematic descriptive review. Front Psychiatry. (2020) 11:74. doi: 10.3389/fpsyt.2020.00074
134. Sauerborn R, Ebi K. Climate change and natural disasters: integrating science and practice to protect health. Glob Health Action. (2012) 5:1–7. doi: 10.3402/gha.v5i0.19295
Keywords: mental health surveillance, depressive symptoms, anxiety symptoms, COVID-19 pandemic, time trends, general population, Germany
Citation: Mauz E, Walther L, Junker S, Kersjes C, Damerow S, Eicher S, Hölling H, Müters S, Peitz D, Schnitzer S and Thom J (2023) Time trends in mental health indicators in Germany's adult population before and during the COVID-19 pandemic. Front. Public Health 11:1065938. doi: 10.3389/fpubh.2023.1065938
Received: 10 October 2022; Accepted: 26 January 2023;
Published: 23 February 2023.
Edited by:
Wulf Rössler, Charité Universitätsmedizin Berlin, GermanyReviewed by:
Rachel Dale, Danube University Krems, AustriaHong Cai, University of Macau, China
Tengteng Fan, Peking University, China
Copyright © 2023 Mauz, Walther, Junker, Kersjes, Damerow, Eicher, Hölling, Müters, Peitz, Schnitzer and Thom. This is an open-access article distributed under the terms of the Creative Commons Attribution License (CC BY). The use, distribution or reproduction in other forums is permitted, provided the original author(s) and the copyright owner(s) are credited and that the original publication in this journal is cited, in accordance with accepted academic practice. No use, distribution or reproduction is permitted which does not comply with these terms.
*Correspondence: Elvira Mauz,  TWF1ekVAcmtpLmRl
†These authors have contributed equally to this work and share first authorship