 Wasiur R. KhudaBukhsh
 Sat Kartar Khalsa2
 Eben Kenah
 Gregorz A. Rempała
- 1School of Mathematical Sciences, The University of Nottingham, Nottingham, United Kingdom
- 2Wexner Medical Center, The Ohio State University, Columbus, OH, United States
- 3Division of Biostatistics, The Ohio State University, Columbus, OH, United States
- 4Division of Biostatistics, Department of Mathematics, The Ohio State University, Columbus, OH, United States
- 5Division of Epidemiology, Department of Mathematics, The Ohio State University, Columbus, OH, United States
Incarcerated individuals are a highly vulnerable population for infection with severe acute respiratory syndrome coronavirus 2 (SARS-CoV-2). Understanding the transmission of respiratory infections within prisons and between prisons and surrounding communities is a crucial component of pandemic preparedness and response. Here, we use mathematical and statistical models to analyze publicly available data on the spread of SARS-CoV-2 reported by the Ohio Department of Rehabilitation and Corrections (ODRC). Results from mass testing conducted on April 16, 2020 were analyzed together with time of first reported SARS-CoV-2 infection among Marion Correctional Institution (MCI) inmates. Extremely rapid, widespread infection of MCI inmates was reported, with nearly 80% of inmates infected within 3 weeks of the first reported inmate case. The dynamical survival analysis (DSA) framework that we use allows the derivation of explicit likelihoods based on mathematical models of transmission. We find that these data are consistent with three non-exclusive possibilities: (i) a basic reproduction number >14 with a single initially infected inmate, (ii) an initial superspreading event resulting in several hundred initially infected inmates with a reproduction number of approximately three, or (iii) earlier undetected circulation of virus among inmates prior to April. All three scenarios attest to the vulnerabilities of prisoners to COVID-19, and the inability to distinguish among these possibilities highlights the need for improved infection surveillance and reporting in prisons.
1. Introduction
The COVID-19 pandemic has demonstrated the tremendous vulnerability of incarcerated individuals to respiratory infections. More than 600,000 COVID-19 cases and close to 3,000 deaths were reported among incarcerated individuals in the United States as of October 2022 (1), and case rates for incarcerated individuals are more than five times higher than for the general population (2). Factors contributing to SARS-CoV-2 transmission in prisons include shared housing, crowding, hygiene challenges, and inability to social distance (3). Outbreak sizes within facilities can be high: infections in more than 80% of prisoners at the Marion Correctional Institution (MCI) in Ohio have been identified (4–7), and similarly high levels of infection have been observed at correctional facilities in other jurisdictions (8, 9). The vulnerability of prisoners and prison staff to COVID-19, the epidemiological connections between prisons and between prisons and surrounding communities, and the potential for prisons to become amplifiers of transmission have been noted by many authors (10–21).
Studies of COVID-19 outbreaks in correctional facilities can help us understand transmission in prisons and jails and identify practices to prevent and control future outbreaks. Research during the COVID-19 pandemic addressed vaccine efficacy and uptake studies among inmates and staff (22, 23), examination of policies by state corrections departments (24), studies of outbreaks started by transfer of infected inmates between prisons (20), quantitative analyses of relationships between correctional facility cases and cases in surrounding communities (18, 19), and analysis of interventions such as decarceration, single-celling, and testing of asymptomatic individuals (25). Analyses of outbreaks in specific facilities include time series analysis (9), assessment of outbreak response in a California state prison (16), and network analyses based upon inmate housing and staff assignments (26). Modeling studies include stochastic simulations of transmission among inmates and staff (27) and fitting compartmental models to case time series data (28). In particular, Puglisi et al. (28) use model fits to estimate the basic reproduction number (R0) for the ancestral strain of SARS-CoV-2 in a large urban jail. Several of these studies point to the need for improved data collection and reporting (21).
Here, we study the COVID-19 outbreak in MCI in the spring of 2020 using publicly available time series data from the Ohio Department of Rehabilitation and Corrections (ODRC). In particular, our main contribution is a rigorous and statistically principled analysis of the results of mass testing conducted at MCI in April 2020. The analysis is based on a compartmental mathematical model of transmission that is fit to data using a statistical approach called the dynamical survival analysis (DSA) (29, 30), which allows the calculation of explicit likelihoods to summarize uncertainty. Our results highlight the explosive potential for transmission of respiratory infections in prisons as well as the critical need for improved monitoring and reporting of infection in correctional facilities.
2. Data and methods
2.1. Case data
Mass RT-PCR testing of all inmates and partial testing of staff at MCI was conducted on April 16, 2020. The total number of inmates and the number of inmates and staff testing positive for SARS-CoV-2 over time were obtained from public ODRC reports (7). Results from early SARS-CoV-2 tests were available with a slight time-lag, so we accumulate the cases reported at MCI over April 16–23, 2020 as a single mass testing data point assigned to April 16, which was the date of mass testing. The mass testing event received significant media coverage and was reported widely in numerous news articles (4–6).
2.2. Mathematical model
We use a compartmental susceptible-exposed-infectious-recovered (SEIR) model of SARS-CoV-2 dynamics in MCI. Such compartmental models have been used extensively in the literature because they tend to provide a good approximation to the process of disease spread (31). Assuming a well-mixed population, under the standard SEIR model, the proportions of individuals in the susceptible (St), exposed (Et), infectious (It), and recovered (Rt) compartments as a function of time t satisfy the following system of differential equations:
where the positive parameters β, α, and γ denote the infection rate, incubation rate, and recovery rate, respectively.
2.3. Statistical analysis
We derive a likelihood function for observing n positives out of N incarcerated individuals on day u as follows: Using the DSA approach of (29, 30, 32, 33), we interpret St as an improper survival function. The mathematical justification for such an interpretation is provided by the Sellke construction by which the function St can be identified as the limiting probability of an initially susceptible individual not getting infected by time t. Note that the function St satisfying (1) is indeed a decreasing function and, when properly scaled, we set S0 = 1. However, unlike proper survival functions that vanish at infinity (i.e., decrease to zero in the limit), the function St → S∞ > 0 as t → ∞ so it is an improper survival function. However, we make it a proper survival function by conditioning on ever being infected. Given observation up to time T > 0, the time TE that an initially susceptible individual becomes infected and enters the E compartment follows the conditional probability density function
where τT = 1 − ST. The time TI to becoming infectious has the conditional density
and the recovery time TR has the conditional density
Note that the random variables TE, TI − TE, and TR − TI are mutually independent and that TI − TE and TR − TI have exponential distributions with rates α and γ, respectively (29). The parameter ρ is the initial proportion of infectious individuals.
Mass testing yields a number of individuals who test positive and a total number of tests administered on the day of mass testing. To use these data, let TN denote the time when virus first becomes undetectable in an individual. We then describe the epidemic process by the pair of random variables (TE, TN). Let ε = TN − TE. Then, the probability of an individual testing positive on the day of the mass testing (at time u) is given by
We fix ε = 21 days, corresponding to detectable virus for 3 weeks following an individual becoming infectious (34, 35). We set 1/α = 5.1/log(2) days [corresponding to a median incubation period of 5.1 days (36)] and assume a mean infectious period 1/γ of 5.6 days (37).
If n out of N individuals test positive on the day of the mass testing u, the log-likelihood function is given by
with the probability of testing positive pu as described in Equation (5). Note that the above likelihood function is a consequence of the functional law of the large numbers for Poisson processes and the Sellke construction.
The crux of the DSA method is that it allows one to interpret functions that describe the large-population limiting proportions of individuals in different compartments as probabilistic quantities, such as survival functions or probability density functions of transfer times from one compartment to another. This change in perspective has a number of statistical advantages. For instance, it makes available the entire toolkit of survival analysis, by virtue of which it can account for censoring, truncation and aggregation of data in a natural way. Variations of the DSA method have been recently applied to analyze not only COVID-19, but also the 2001 foot-and-mouth disease (FMD) outbreak in the United Kingdom (30) and multiple waves of the 2018–2020 Ebola epidemic in the Democratic Republic of Congo (32). It is important to note that the date considered in this article are from the first phase of the pandemic when vaccines were not yet available. Nevertheless, the DSA method is capable to incorporating vaccination regimes. For instance, the method was applied to assess the potential impact of vaccination in Israel in (38). See also Klaus et al. (39) where the method was applied to COVID-19 data in the state of Ohio, USA.
3. Results
3.1. Reported outbreak time course
According to ODRC reports (7), the first identified COVID-19 case at MCI was an infected staff member on March 29. Following this initial case, precautions such as cohorting and modified movement were enacted in order to restrict mixing and reduce transmission. As stated in the publicly available ODRC report from March 30, 2020:
Based on a staff member reporting a positive COVID test, MCI is operating under modified movement and the population is being separated by unit along with other precautionary measures. Every inmate at MCI is monitored daily and has their temperature taken along with a check for symptoms. Currently, there are no inmates symptomatic for COVID-19.
The first COVID-19 case among inmates was identified on April 3. Mass RT-PCR testing of all inmates and partial testing of staff was conducted on April 16. By April 20, SARS-CoV-2 infection had been identified in 79% (1,950/2,453) of inmates and 35% (154/446) of staff. These numbers come directly from data on the ODRC website. We take the May 5, 2020 listing of 2,453 inmates at MCI as the denominator. There is a lag of a few days between when mass testing occurred (April 16) and when jumps in case counts are reported in the ODRC data (April 18–19 for inmates and April 20 for staff), which may reflect delay in data entry. Figure 1 shows a time series of reported COVID-19 cases at MCI.
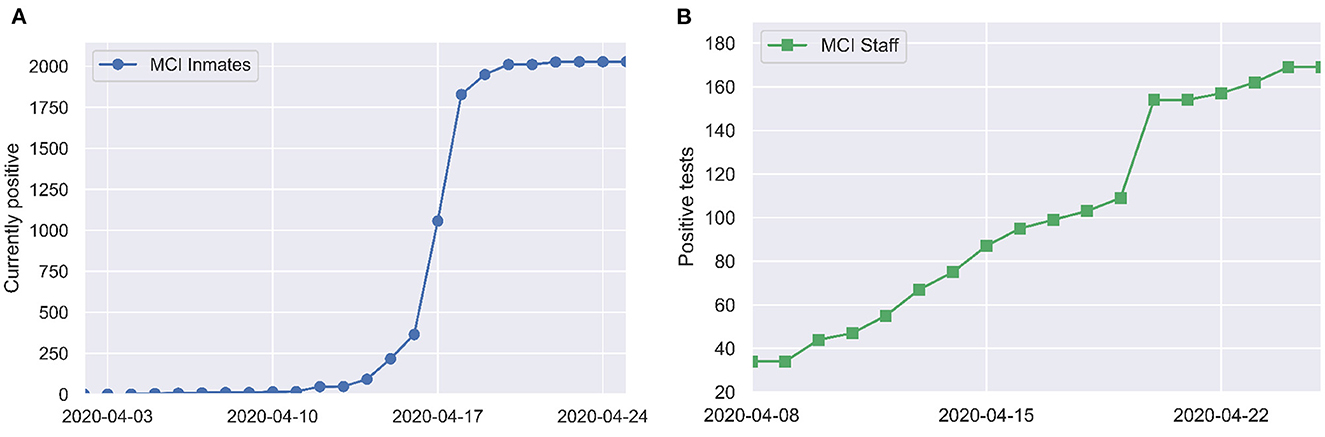
Figure 1. Positive tests over time among (A) inmates and (B) staff at MCI, as reported by the Ohio Department of Corrections and Rehabilitation (7).
3.2. Basic reproduction number and initial exposure size
The basic reproduction number 0 is one of the key parameters in models of infectious diseases (31). It is defined as the expected number of secondary cases generated by an infected individual in a population where all individuals are susceptible to infection. When 0 > 1, disease can spread rapidly and cause a large epidemic with positive probability. When 0 < 1, the spread of disease dies out stochastically and a large epidemic cannot occur. 0 can also be used to calculate the so-called “herd immunity threshold” for interventions like vaccination that effectively reduce the susceptible population.
To examine which values of the basic reproduction number 0 are consistent with the rapid spread of COVID-19 observed at MCI, we use the SEIR model (1). In order for mass screening to identify 80% of the population as positive for COVID-19 on April 16, at least 80% of the population must have been infected by that date. Figure 2 shows the time needed to infect 80% of the population in the SEIR model as a function of 0 and the initial number of exposed individuals (E0). While 0 values of two or larger are able to eventually infect 80% or more of the population, this can take on the order of months for modest values of 0. Reproduction numbers >14 are needed before outbreaks originating from a single exposed individual are able to generate a 3-week cumulative incidence consistent with that reported for MCI.
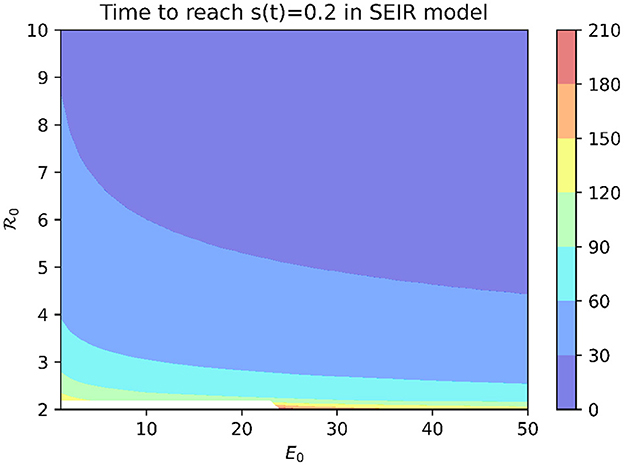
Figure 2. Time to infect 80% of the population in SEIR model with median incubation period of 5.1 days and mean infectious period of 5.6 days.
An alternative explanation is that the outbreak involved more than one initially infected prisoner. Figure 2 shows that, for a fixed 0 value, increasing E0 decreases the time needed to infect 80% of the population. However, an initial condition of E0 > 563 is needed for an outbreak with 0 = 3 to infect 80% of the population within 3 weeks.
3.3. Time of initial outbreak circulation
A third possibility is that SARS-CoV-2 was circulating among prisoners prior to April 3. Figure 3 shows the log-likelihood (6) for observing the mass testing results in MCI according to the SEIR model (1) as a function of 0 and the outbreak onset date, with E0 fixed at one. The outbreak onset date and 0 are unidentifiable from the mass testing data alone, with the “wishbone” shape running diagonally across Figure 3 corresponding to pairs of outbreak onset and 0 that are almost equally likely given the observed data. Outbreak onsets in late March or later correspond to 0 > 10, while earlier outbreak onsets correspond to smaller 0 values. Note that onset dates prior to March are required to give 0 values of less than five.
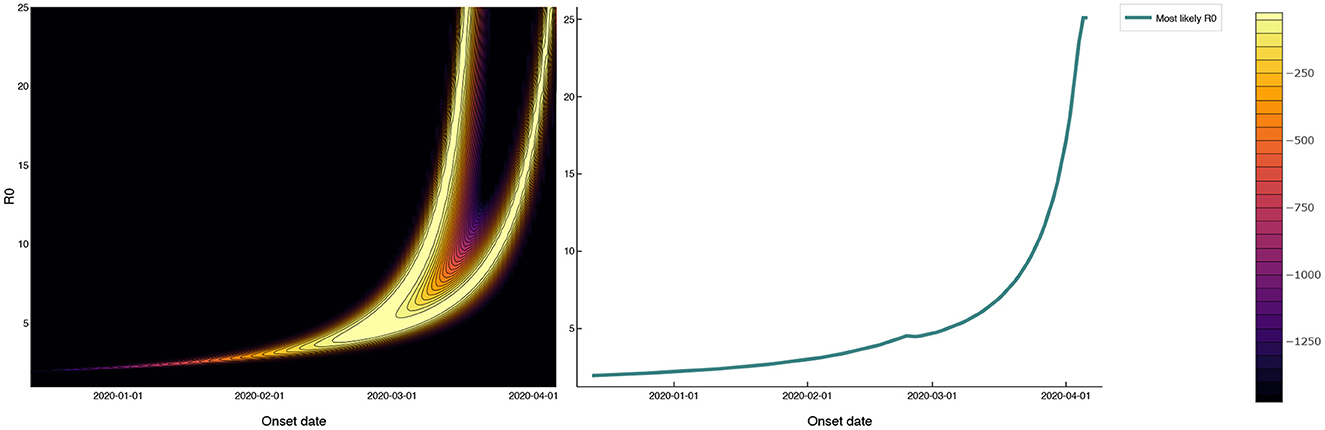
Figure 3. Log-likelihood in the (0, outbreak onset date) plane for mass testing data under a SEIR model with a 3 week test-positive window following the onset of infectiousness. The 0 values that maximize the likelihood as a function of outbreak onset date are shown as a solid red line that follows the right-most branch of the ‘wishbone' in the log-likelihood plot. The 0 values consistent with the reported data (with onsets in late March or later) are as large as 10. Onset dates prior to March, while inconsistent with the reported data, give more realistic 0 values of less than five.
In general, the larger the value of the parameter 0, the more difficult it is to control the epidemic. Our analysis is consistent with this. Both the first and the third possibilities explained above suggest that the 0 values consistent with the reported data must be extremely high, calling attention to the explosive potential for COVID-19 transmission in prisons. Both the second and the third possibilities underscore the implausibility of the reported disease introduction date and/or the initial amount of infection, calling attention to the need for more reliable monitoring and reporting of infection in correctional facilities.
4. Discussion and conclusion
The official reports from ODRC describe widespread infection of MCI inmates with SARS-CoV-2 within the span of 3 weeks. Our primary contribution is a rigorous analysis of the data using an SEIR compartmental model fit to these data using the DSA approach, which allows us to use all of the tools of likelihood-based inference. This analysis indicates three non-exclusive possible explanations for this rapid spread: (i) values for the basic reproduction number that are far higher than the 0 values between two and three that have been estimated for the ancestral strain of SARS-CoV-2 in non-prison settings in the United States (37), (ii) initial exposure of a large number of infected prisoners as in an extreme superspreading event, or (iii) early undetected circulation of SARS-CoV-2 among prisoners prior to April 3. We note that the 0 values in (i) are even greater than the already high estimates of the basic reproduction number in a large urban jail (28). All three possibilities speak to the vulnerabilities of prison inmates and staff to COVID-19. Distinguishing between these different scenarios is impossible without improved data collection and reporting. An arguable weakness of our analysis is that it is retrospective in nature. However, we believe studies such as ours will lead to improvements that allow more detailed insight into the transmission of respiratory infections within prisons are critical for protecting the health of prison inmates, staff, and surrounding communities in future pandemics.
Permissive conditions for spread within correctional facilities, challenges for disease surveillance and care in these settings, and the inextricable link between COVID-19 within correctional facilities and disease spread in the surrounding community, have been discussed eloquently by others (10–14). Structural changes such as lower inmate densities (25, 40) and improved ventilation (9, 16) are needed to decrease transmission potential in correctional facilities. Efforts to increase vaccine coverage are also important, particularly among prison staff who may have relatively low vaccine uptake (23). Community case rates are associated with cases in prisons (18), inmate transfers can allow outbreaks to jump from one prison to another (20), and staff can be an epidemiological link between correctional facilities and surrounding communities. Without changes to protect the health of staff and inmates, it is predictable prisons will be vulnerable to extremely rapid spread of future respiratory pathogens.
Improved surveillance and reporting are critical for pandemic preparedness and for preventing or controlling future outbreaks of respiratory diseases in prisons. Testing policies during the COVID-19 pandemic varied widely across state corrections departments (24). Testing protocols changed over time, and state reporting of COVID-19 cases in prisons was often incomplete or absent (41). Swift response is essential for preventing and controlling large outbreaks, and it has been identified as a distinguishing feature for countries with successful COVID-19 pandemic responses (42). This swift response is impossible without pathogen detection and reporting efforts that include correctional facilities. Going forward, we urge health departments and corrections departments to collect accurate data and to make these data available for analysis with appropriate protections for human subjects in this vulnerable population.
Data availability statement
Publicly available datasets were analyzed in this study. This data can be found at: https://github.com/wasiur/PrisonCOVID19Analysis.
Author contributions
SK collected and organized the data. WK, EK, GR, and JT developed the analytical approach. WK carried out the analysis. All authors contributed to the conception and writing of the manuscript and approved the submitted version.
Funding
This project was supported by the National Science Foundation (NSF) grant DMS-2027001, the Mathematical Biosciences Institute (NSF DMS-1440386), the Ohio State University President's Postdoctoral Scholars Program, and the Infectious Diseases Institute at The Ohio State University. EK and WK were funded in part by National Institute of Allergy and Infectious Diseases (NIAID) grant R01 AI116770. WK was supported by the President's Postdoctoral Scholars Program (PPSP) of the Ohio State University (OSU), by a Scheme 4 grant (Ref. 42118) from the London Mathematical Society (LMS), and an International Collaboration Fund awarded by the Faculty of Science, University of Nottingham (UoN). The content is solely the responsibility of the authors and does not represent the official views of NSF, NIAID, or the National Institutes of Health.
Conflict of interest
The authors declare that the research was conducted in the absence of any commercial or financial relationships that could be construed as a potential conflict of interest.
Publisher's note
All claims expressed in this article are solely those of the authors and do not necessarily represent those of their affiliated organizations, or those of the publisher, the editors and the reviewers. Any product that may be evaluated in this article, or claim that may be made by its manufacturer, is not guaranteed or endorsed by the publisher.
References
1. The COVID Prison Project. National COVID-19 Statistics (2021) Available online at: https://covidprisonprojectcom/data/national-overview/ (accessed November 01, 2022).
2. Wang EA, Zenilman J, Brinkley-Rubinstein L. Ethical considerations for COVID-19 vaccine trials in correctional facilities. JAMA. (2020) 324:1031–2. doi: 10.1001/jama.2020.15589
3. Mhlanga-Gunda R, Rusakaniko S, Chinyuku AN, Pswarayi VF, Robinson CS, Kewley S, et al. “We sleep 10 cm apart so there is no social distancing”: COVID-19 preparedness in a Zimbabwean prison complex. Int J Prison Health. (2022). doi: 10.1108/IJPH-10-2021-0101/full/html. [Epub ahead of print].
4. Chapell B,. 73% of Inmates at an Ohio Prison Test Positive for Coronavirus. NPR (2020). Available online at: https://www.npr.org/sections/coronavirus-live-updates/2020/04/20/838943211/73-of-inmates-at-an-ohio-prison-test-positive-for-coronavirus (accessed February 12, 2023).
5. Hooks G,. COVID-19 Spread Faster in Counties With Large Prisons–And to Nearby Counties: Marion Correctional Institution (Ohio) is a Disturbing Example (2020). Available online at: https://www.prisonpolicy.org/reports/covidspread_marion.html (accessed February 12, 2023).
6. Woods J, Cooley, P,. Coronavirus in Ohio: More Than 1,800 Inmates at Marion Correctional Test Positive (2020). Available online at: https://eu.cincinnati.com/story/news/2020/04/19/coronavirus-ohio-more-than-1-800-inmates-marion-correctional-test-positive/5163046002/ (accessed February 12, 2023).
7. Ohio Department of Rehabilitation & Correction. COVID-19 Inmate Testing (2020). Available online at: https://coronavirus.ohio.gov/static/reports/DRCCOVID-19Information.pdf (accessed April 30, 2020).
8. Hagan LM, Williams SP, Spaulding AC, Toblin RL, Figlenski J, Ocampo J, et al. Mass testing for SARS-CoV-2 in 16 prisons and jails - six jurisdictions, United States, April-May 2020. MMWR Morbid Mortal Wkly Rep. (2020) 69:1139–43. doi: 10.15585/mmwr.mm6933a3
9. Kwan A, Sklar R, Cameron DB, Schell RC, Bertozzi SM, McCoy SI, et al. Respiratory pandemic preparedness learnings from the June 2020 COVID-19 outbreak at San Quentin California State Prison. Int J Prison Health. (2022). doi: 10.1108/IJPH-12-2021-0116. [Epub ahead of print].
10. Akiyama MJ, Spaulding AC, Rich JD. Flattening the curve for incarcerated populations – COVID-19 in jails and prisons. N Engl J Med. (2020) 382:2075–7. doi: 10.1056/NEJMp2005687
11. Burki T. Prisons are “in no way equipped” to deal with COVID-19. Lancet. (2020) 39510234:1411–2. doi: 10.1016/S0140-6736(20)30984-3
12. Oladeru OT, Tran NT, Al-Rousan T, Williams B, Zaller N. A call to protect patients, correctional staff and healthcare professionals in jails and prisons during the COVID-19 pandemic. Health Just. (2020) 8:17. doi: 10.1186/s40352-020-00119-1
13. Rubin R. The challenge of preventing COVID-19 spread in correctional facilities. JAMA. (2020) 323:1760–1. doi: 10.1001/jama.2020
14. Wurcel AG, Dauria E, Zaller N, Nijhawan A, Beckwith C, Nowotny K, et al. Spotlight on jails: COVID-19 mitigation policies needed now. Clin Infect Dis. (2020) 71:891–2. doi: 10.1093/cid/ciaa346
15. Mastrobuoni G, Terlizzese D. Leave the door open? Prison conditions and recidivism. Am Econ J. (2022) 14:200–33. doi: 10.1257/app.20190038
16. Duarte C, Cameron DB, Kwan AT, Bertozzi SM, Williams BA, McCoy SI. COVID-19 outbreak in a state prison: a case study on the implementation of key public health recommendations for containment and prevention. BMC Publ Health. (2022) 22:977. doi: 10.1186/s12889-022-12997-1
17. Maycock M. ‘COVID-19 has caused a dramatic change to prison life'. Analysing the impacts of the COVID-19 pandemic on the pains of imprisonment in the Scottish Prison Estate. Br J Criminol. (2022) 62:218–33. doi: 10.1093/bjc/azab031
18. LeMasters K, Ranapurwala S, Maner M, Nowotny KM, Peterson M, Brinkley-Rubinstein L. COVID-19 community spread and consequences for prison case rates. PLoS ONE. (2022) 17:e0266772. doi: 10.1371/journal.pone.0266772
19. Reinhart E, Chen DL. Incarceration and its disseminations: COVID-19 pandemic lessons from Chicago's cook county jail. Health Affairs. (2020) 39:1412–8. doi: 10.1377/hlthaff.2020.00652
20. Parsons TL, Worden L. Assessing the risk of cascading COVID-19 outbreaks from prison-to-prison transfers. Epidemics. (2021) 37:100532. doi: 10.1016/j.epidem.2021.100532
21. Puglisi LB, Brinkley-Rubinstein L, Wang EA. COVID-19 in carceral systems: a review. Annu Rev Criminol. (2023) 6:399–422. doi: 10.1146/annurev-criminol-030521-103146
22. Chin ET, Leidner D, Zhang Y, Long E, Prince L, Li Y, et al. Effectiveness of the mRNA-1273 Vaccine during a SARS-CoV-2 Delta Outbreak in a Prison. N Engl J Med. (2021) 385:2300–1. doi: 10.1056/NEJMc2114089
23. Prince L, Long E, Studdert DM, Leidner D, Chin ET, Andrews JR, et al. Uptake of COVID-19 vaccination among frontline workers in California state prisons. JAMA Health Forum. (2022) 3:e220099. doi: 10.1001/jamahealthforum.2022.0099
24. Zielinski MJ, Cowell M, Bull CE, Veluvolu M, Behne MF, Nowotny K, et al. Policy and public communication methods among U.S. state prisons during the first year of the COVID-19 pandemic. Health Just. (2022) 10:27. doi: 10.1186/s40352-022-00187-5
25. Malloy GSP, Puglisi L, Brandeau ML, Harvey TD, Wang EA. Effectiveness of interventions to reduce COVID-19 transmission in a large urban jail: a model-based analysis. BMJ Open. (2021) 11:e042898. doi: 10.1136/bmjopen-2020-042898
26. Kirbiyik U, Binder AM, Ghinai I, Zawitz C, Levin R, Samala U, et al. Network characteristics and visualization of COVID-19 outbreak in a large detention facility in the United States – Cook County, Illinois, 2020. Morbid Mortal Wkly Rep. (2020) 69:1625–30. doi: 10.15585/mmwr.mm6944a3
27. Ryckman T, Chin ET, Prince L, Leidner D, Long E, Studdert DM, et al. Outbreaks of COVID-19 variants in US prisons: a mathematical modelling analysis of vaccination and reopening policies. Lancet Publ Health. (2021) 6:e760–70. doi: 10.1016/S2468-2667(21)00162-6
28. Puglisi LB, Malloy GSP, Harvey TD, Brandeau ML, Wang EA. Estimation of COVID-19 basic reproduction ratio in a large urban jail in the United States. Ann Epidemiol. (2021) 53:103–5. doi: 10.1016/j.annepidem.2020.09.002
29. KhudaBukhsh WR, Choi B, Kenah E, Rempala GA. Survival dynamical systems: individual-level survival analysis from population-level epidemic models. Interface Focus. (2020) 10:20190048. doi: 10.1098/rsfs.2019.0048
30. Di Lauro F, KhudaBukhsh WR, Kiss IZ, Kenah E, Jensen M, Rempała GA. Dynamic survival analysis for non-Markovian epidemic models. J R Soc Interface. (2022) 19:20220124. doi: 10.1098/rsif.2022.0124
32. Vossler H, Akilimali P, Pan Y, KhudaBukhsh WR, Kenah E, Rempała GA. Analysis of individual-level data from 2018-2020 Ebola outbreak in Democratic Republic of the Congo. Sci Rep. (2022) 12:5534. doi: 10.1038/s41598-022-09564-4
33. KhudaBukhsh WR, Bastian CD, Wascher M, Klaus C, Sahai SY, Weir MH, et al. Projecting COVID-19 cases and hospital burden in Ohio. J Theor Biol. (2023) 561:111404. doi: 10.1016/j.jtbi.2022.111404
34. He X, Lau EHY, Wu P, Deng X, Wang J, Hao X, et al. Temporal dynamics in viral shedding and transmissibility of COVID-19. Nat Med. (2020) 26:672–5. doi: 10.1038/s41591-020-0869-5
35. Xiao AT, Tong YX, Zhang S. Profile of RT-PCR for SARS-CoV-2: a preliminary study from 56 COVID-19 patients. Clin Infect Dis. (2020) 71:2249–51. doi: 10.1093/cid/ciaa460
36. Lauer SA, Grantz KH, Bi Q, Jones FK, Zheng Q, Meredith HR, et al. The incubation period of coronavirus disease 2019 (COVID-19) from publicly reported confirmed cases: estimation and application. Ann Intern Med. (2020) 172:577–82. doi: 10.7326/M20-0504
37. Moghadas SM, Shoukat A, Fitzpatrick MC, Wells CR, Sah P, Pandey A, et al. Projecting hospital utilization during the COVID-19 outbreaks in the United States. Proc Natl Acad Sci USA. (2020) 117:9122–6. doi: 10.1073/pnas.2004064117
38. Somekh I, KhudaBukhsh WR, Root ED, Boker LK, Rempala G, Simões EAF, et al. Quantifying the population-level effect of the COVID-19 mass vaccination campaign in Israel: a modeling study. Open Forum Infect Dis. (2022) 9:Ofac087. doi: 10.1093/ofid/ofac087
39. Klaus C, Wascher M, KhudaBukhsh WR, Rempała GA. Likelihood-free dynamical survival analysis applied to the COVID-19 epidemic in Ohio. Math Biosci Eng. (2023) 20:4103–27. doi: 10.3934/mbe.2023192
40. LeMasters K, Brinkley-Rubinstein L, Maner M, Peterson M, Nowotny K, Bailey Z. Carceral epidemiology: mass incarceration and structural racism during the COVID-19 pandemic. Lancet Publ Health. (2022) 7:e287–90. doi: 10.1073/pnas.2026577118
41. Knight K, Bleckner J, Cameron E, Amon JJ. Pandemic treaty should include reporting in prisons. Health Hum Rights. (2022) 24:117–9.
Keywords: SARS-CoV-2, correctional facilities, mathematical modeling, mass testing, reproduction number
Citation: KhudaBukhsh WR, Khalsa SK, Kenah E, Rempała GA and Tien JH (2023) COVID-19 dynamics in an Ohio prison. Front. Public Health 11:1087698. doi: 10.3389/fpubh.2023.1087698
Received: 02 November 2022; Accepted: 20 February 2023;
Published: 30 March 2023.
Edited by:
Olumide Babatope Longe, Academic City University College, GhanaReviewed by:
Kayode Oshinubi, Northern Arizona University, United StatesOluwatosin Babasola, University of Bath, United Kingdom
Antonio Di Lorenzo, University of Bari Aldo Moro, Italy
Roya Ghasemian, Mazandaran University of Medical Sciences, Iran
Copyright © 2023 KhudaBukhsh, Khalsa, Kenah, Rempała and Tien. This is an open-access article distributed under the terms of the Creative Commons Attribution License (CC BY). The use, distribution or reproduction in other forums is permitted, provided the original author(s) and the copyright owner(s) are credited and that the original publication in this journal is cited, in accordance with accepted academic practice. No use, distribution or reproduction is permitted which does not comply with these terms.
*Correspondence: Joseph H. Tien, anRpZW5AbWF0aC5vaGlvLXN0YXRlLmVkdQ==