 Jarosław Domaradzki
 Dawid Koźlenia
- Unit of Biostructure, Faculty of Physical Education and Sport, Wroclaw University of Health and Sport Sciences, Wroclaw, Poland
Background: This study aimed to assess the importance of socioeconomic status (SES) on health-related fitness (H-RF) measurements in young adults and determine the impact of SES over 20 years of substantial social and economic changes in Poland.
Material and methods: The study compared H-RF differences between 2001 (P1) and 2022 (P2) in 252 volunteers aged 18 to 28 years who were grouped into quartiles based on SES and gender. The variables measured included height, weight, body mass index, body fat mass, hand strength (hand grip), abdomen strength (sit-ups), flexibility (sit and reach), and leg power (standing long jump), with a synthetic motor performance index (MPSI) calculated for each participant.
Results: Health-related differences based on social inequalities included body fat mass and MPSI, and two-way analysis of variance (ANOVA) revealed an interaction between SES and period on motor performance (F = 2.73, p = 0.045). In addition, post-hoc tests revealed differences in P1 between SES quartiles one and two (p = 0.028). Over the last 20 years, physical fitness decreased and body fat increased. The regression slope showed decreased motor performance with higher amounts of body fat in P2 subjects compared to their P1 peers.
Conclusion: The observed trends may be associated with lifestyle changes shaped by technology development, high-energy and low-quality food access, and increased physical inactivity.
1. Introduction
Socioeconomic status (SES) is defined by income, educational level, family structure, and degree of urbanization, among other factors, and its relationship with health is researched widely for numerous public health reasons. Among the many health-related impacts of SES, including its psychological, mental, physical, and physiological effects, indicators of physical fitness are rarely used (1–3). Indeed, an increasing number of studies have focused on physical activity rather than physical fitness, especially health-related fitness (H-RF) (4–6). Health outcomes mirror differences in socioeconomic position (lower–higher), defined as socioeconomic inequalities in health (7). Health inequalities are “systematic differences in the health of people occupying unequal positions in society” and are primarily “unjust and avoidable.” They are complex and observed in many different, often overlapping, social dimensions such as income, social class, geography, ethnicity, disability, and gender. Some of these dimensions can be ranked, such as income, and some cannot, including ethnicity (8, 9). Thus, health inequalities are systematic differences in the health status of different socioeconomic groups, and several health-related variables reflect changes in socioeconomic conditions over a long period (balancing or deepening of the differences). Several studies demonstrated, amid a global pandemic and continued rise in obesity, that the gap in inequalities is being widened further (10).
One description of health in terms of public health is physical fitness directly related to health, referred to as H-RF (11). In this regard, systematic physical activity directly impacts health and H-RF (12, 13). H-RF includes a combination of abdominal strength and endurance, lower back and upper thigh flexibility, cardiorespiratory fitness, and body composition (11), and a lack of physical activity leads to an excessive increase in body fat (14). Recent H-RF definitions also include metabolic and body morphology components (15). Increasing H-RF by improving cardiovascular and muscular functioning, for example, and focusing on body composition quality, leads to improved health (16). Such improvements directly translate into reductions in the development of cardiovascular diseases, diabetes, and hypertension. They also improve emotional control, reduce stress, and help maintain an appropriate level of body weight, which is one of the components of H-RF (12, 17–19). Biological traits that are health measures, broadly understood as H-RF, that respond to environmental changes such as economic and social factors, are a sensitive “barometer” of the economic and social situation of groups of people (20).
Those who occupy low positions in the social hierarchy are estimated to have at least twice the risk of severe illness and premature death (21–23). The negative impact of low SES on health is explained by its association with an unhealthy lifestyle, higher exposure to stress, low level of social support, lower level of health knowledge, and limited access to health services, especially specialist services (24–27). Moreover, growing up in impoverished and marginalized socioeconomic conditions shortens life expectancy and contributes to poor mental and physical health (28–30).
Health inequalities are measured using a variety of procedures and methods. Recognized measures of socioeconomic health inequalities include, among others, the slope of inequality index (SII) and the relative inequality index (RII) (31, 32). Many national and international programs focus on reducing social inequalities in countries and social groups (33, 34). When measuring differences between more and less privileged groups, the results depend on the factors assessed (34). In a study by Hauspie et al. (35), the secular trend in the achieved height and growth rate was more pronounced in children from lower socioeconomic backgrounds, such as those from low-educated families and rural areas. However, the results of many studies indicate a lack of clear assessment of the impact of SES on the existence or absence of social inequalities in health (36). Furthermore, few studies have focused on the differences between the least advantaged and most advantaged groups or regions because they aimed to merely document the existence of these differences (34).
Health inequities tend to change over long periods, such as 10, 20, or 50 years (37). According to the literature, no studies have examined if or how the impact of social differences has changed H-RF components. In Poland, there have been substantial economic, educational, and cultural changes in the last 20 years, which may be the background for changes in social inequalities that impact H-RF. Moreover, restrictions imposed during the coronavirus disease (COVID-19) pandemic have left their mark. In this regard, ongoing health monitoring in the context of H-RF is necessary, and a comparison of today's population to the same from 20 years ago will allow for the assessment of the directions of changes in H-RF in young adults from families with different economic and social statuses.
Since anthropometrical and functional features are health markers, social gradients in health, whereby morpho-functional features improve as SES rises, can be used to assess health inequalities of different subpopulations or groups of people. Indeed, foundational knowledge of the reciprocal interrelations between secular changes and social gradients is crucial in determining the nature of health inequalities and the scale of changes over time, highlighting the groups of young adults most at risk and identifying features that most strongly reflect environmental changes. The problems of intergenerational changes were often undertaken but were addressed to average populations. Only a few studies assessed secular trends concerning young people who are athletic or are engaged in physical activity, such as Physical Education and Sport Faculty students (38). To the best of the authors' knowledge, no studies have assessed secular trends in health-related fitness (H-RF) in such physically active subpopulations. Furthermore, there are no studies focused on the secular trends in H-RF from a social-economic inequalities perspective. Therefore, this study aimed to assess the importance of SES on H-RF measurements in young adults and how the impact of SES changed over 20 years of substantial social and economic change in Poland by posing the following four questions: (1) Has the proportion of people with different economic and social statuses changed over the 20 years analyzed, and how has it changed? (2) Which variables reflect social inequalities, and were the variables the same in 2001 and 2022? (3) What were the absolute differences, measured using the SII, between those in the lowest and highest SES positions at the beginning of the 21st century and 20 years later? and (4) Have these differences between the groups at either extreme changed over time, based on the RII?
2. Material and methods
This study follows up on the issues presented in the study by Fugiel et al. (1), which provides a detailed description of the methodology, test subjects, and procedures. Here, the most important aspects are briefly described.
2.1. Ethics
The Senate Research Ethics Committee of the Wroclaw University of Health and Sport Sciences in Poland granted permission for this research, which followed the guidelines of the Declaration of Helsinki (consent number 16/2018). All subjects gave written voluntary consent to participate in the project before starting the study. Participants received detailed information about the research purpose, type, and methods and could withdraw from the research at any time without giving a reason.
2.2. Participants/sample
Two groups of students provided measurement data, with results obtained in March 2001 (P1) and March 2022 (P2). Participants were students recruited from the Faculty of Physical Education and Sport, with employees from the Department of Biostructure of the Wroclaw University of Health and Sport Sciences carrying out the research. Participants (n = 252, aged 18 to 28 years) comprised 120 men (M) and 127 women (F), with 70 M and 78 F included in 2001 and 50 M and 49 F examined in 2022. All subjects declared no participation in professional sports. The additional inclusion criterion was good health declared in the questionnaire and lack of musculoskeletal injuries 2 weeks before studies. The exclusion criterion was hospitalization during the semester the studies were conducted.
2.3. Procedures
The research was conducted at the Biokinetics Research Laboratory of the Wroclaw University of Health and Sport Science, which has the Polish Standard-European Standard International Organization for Standardization (PN-EN ISO) 9001:2009 Quality Management System Certificate (certificate reg. no. PW-48606-10E). Testing occurred in the morning, and all subjects were to refrain from eating, drinking, and exercising for at least 3 h before testing. Measurements of somatic features and physical fitness followed established procedures.
2.4. Measurements
2.4.1. Somatic features
Trained personnel performed each anthropometric measurement privately in a separate room. Body height (BH) and body weight (BW) measurements followed the procedures of Martin and Saller (39). BH was measured with an accuracy of 0.1 cm using a Swiss Anthropometer (GPM Anthropological Instruments, DKSH Ltd, Switzerland). BW was measured to the nearest 0.1 kg using a SECA M799 (type approval D07-09-032, Hamburg, Germany).
The Harpenden Skinfold Caliper measured skin folds of the triceps brachii and abdominal muscles with an accuracy of 0.1 mm (1). Body fat percentage (BFP) was calculated from skin fold measurements using the equations of Slaughter et al. (40) for comparative analysis.
2.4.2. Physical fitness of the musculoskeletal system
Four tests (Eurofit) assessed physical fitness, including hand strength (HS), abdomen strength (ABS), flexibility (Flex), and leg power (SJ). HS tests measured hand grip strength with an accuracy of 1 kg using a JAMAR hydraulic hand dynamometer (Sammons Preston Rolyan, IL, USA) with an adjustable handle set in position two. Analysis of HS results used the best score from two trials. Meanwhile, the number of full sit-ups performed within 30 s (timed sit-ups) determined ABS from one trial, during which participants adopted a sitting position and reached as far forward as they could along a measurement line with one hand placed on top of the other. A standing long jump, measured as the distance from the measurement line to the heel closest to the measurement line at the maximum jump, determined SJ, with the best score from two trials used for analysis. All data were standardized using the formula,
where zij is the standardized value, xij is the j-variable of the i-object, is the mean value of the j-variable, and sj is the standard deviation (SD) of the j-variable (41).
After transformation, the diagnostic variables were standardized between 0 and 1, which made it possible to compare and estimate patterns and the distance from them (41).
Body mass index (BMI), BH, and BFP were assessed as single variables. Secular trends in motor function and social-economic gradients were related to general motor performance. Therefore, these variables were combined into a motor performance synthetic index (MPSI) using multidimensional comparative analysis (MCA), which uses a different scale and units. MCA analysis adopted the Hellwig (42) pattern of development method, for which a detailed description of the steps used in its design was published by Hellwig (42).
2.4.3. Socioeconomic status
The SES assessment was based on five socioeconomic factors, including urbanization level (city, town, or village, with a higher urbanization level equating to a higher SES), family size (one, two, three, four, or more children, with a smaller family resulting in a higher SES), parents' education level (elementary school, secondary school, trade school, or university, with a higher education level leading to a higher SES), and family type during the students time at the family home as a child (one or two parent households as no students lived without parents, and two-parent households led to a higher SES).
The first factor of principal component analysis (PCA) defined the general SES variable. The first-factor eigenvalue for P1 was 1.61, which explained 32.24% of the variance, and factor loadings were 0.51–0.37. For P2, the eigenvalue of the first factor was 1.58, which explained 31.60% of the variance, with factor loadings of 0.77–0.42.
Division of SES values into quartiles resulted in four categories, very low, low, medium, and high. Mean values calculated for the indices of each category underwent regression analysis to calculate health inequality indices.
2.5. Statistical analysis
All calculations used Statistica 13.0 software (StatSoft Poland, Cracow, Poland). The student numbers in each SES category were presented as percentages, accumulated proportions, and ranks. Pearson's chi-squared (χ2) test determined the statistical significance between the differences in expected and observed SES frequencies (43). The Shapiro–Wilk test evaluated the normality of the distribution of continuous variables. Descriptive statistics for continuous measurements (ABS, age, BFP, BH, BMI, BW, FL, HS, and SJ) and secular trends were published previously (1). The current study calculated and presented standardized BFP, BH, BMI, and MPSI for each period (P1 and P2) as mean and SD, with 95% confidence intervals (CI).
A two-way analysis of variance (ANOVA) assessed the differences between mean values of the anthropometric measurements and MPSI at the time (two levels: P1 and P2) and SES (four quartiles: very low, low, medium, and high) levels. Post-hoc tests made detailed comparisons between quartiles in each period and matching quartiles from the different periods.
Regression methods assessed inequalities in health using the calculated SII and RII indices. The SII and RII indices are regression-based indicators (8, 11) that rely on a regression relating to health outcomes of social groups relative to their position on the SES distribution. In the classic approach, the absolute inequality index (SII) is a linear regression coefficient based on data defining the health status index for each socioeconomic group and a variable determining the rank of this group based on social status (44). The results are interpreted as the absolute difference in health between the lowest-ranked social group and the social group with the highest rank in the adopted classification. Analyses of changes over time and comparisons use the RII, which is the absolute measure (SII) in relation to the mean health status of the population (45). This index is interpreted as a percentage difference in the health measures of groups at either end of the social hierarchy in relation to the mean level of health observed in the population. The slope of the regression line is the SII, a measure of absolute inequality, and is given by:
Where xi is the ridit, yi the mortality rate, and wi the frequency of each class i = {1, …, n}, and and ȳw the frequency-weighted averages of xi and yi.
The RII is obtained by extrapolating the regression line toward the extreme (theoretical) positions of the x-axis, 0 and 1. It is calculated as a ratio of the value at the bottom of the social hierarchy (corresponding to the intercept) and the value at the top of the hierarchy (corresponding to the intercept + slope). RII is given by:
The significance level was set to α = 0.05.
3. Results
Among all participating students, the majority (58.7%) were surveyed in P1, with 41.3% surveyed in P2. These unequal numbers reflect the typical decline in the number of students, which is related to, among other factors, a demographic decline and a lower recruitment rate.
The group with the lowest economic and social status (Q1) included 28% of people surveyed in P1 and 26% in P2. The groups with average family SES conditions included 30% (Q2) and 21% (Q3) of the respondents in P1 and 20% (Q2) and 29% (Q3) of the respondents in P2. Students with the highest family SES (Q4) comprised 22% of P1 and 25% of P2. These percentages indicate similar frequencies of people with the lowest SES in both periods, while the proportion of people in the subgroups with the highest SES (Q3 and Q4) increased in P2 (54%) compared to P1 (43%) (Table 1). However, the χ2 analysis did not show statistically significant differences in the proportions of people from individual quartiles in periods P1 and P2 (χ2 = 4.10, p = 0.251).
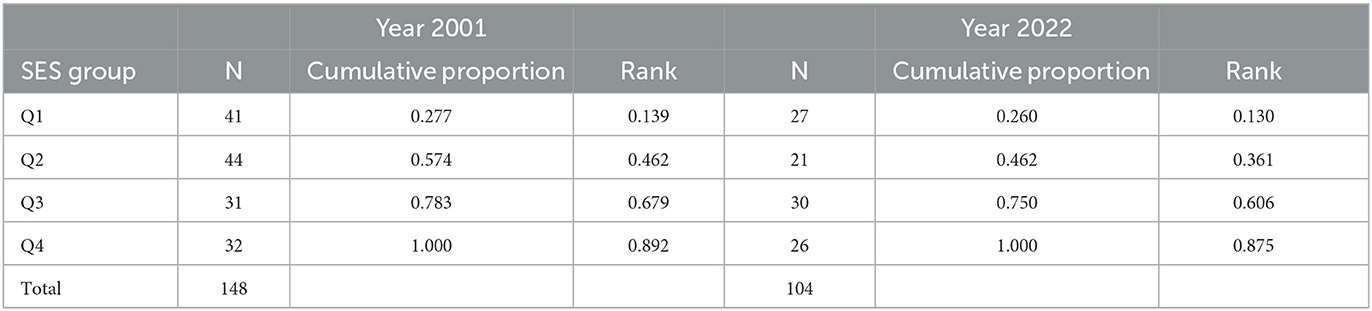
Table 1. The numbers, percentages, and cumulative proportions of the students by socioeconomic status groups (Q1-Q4) and period of examination (2001–2022).
Table 2 details the statistical characteristics of the normalized BH, body mass synthetic index (BMSI), and MPSI values.
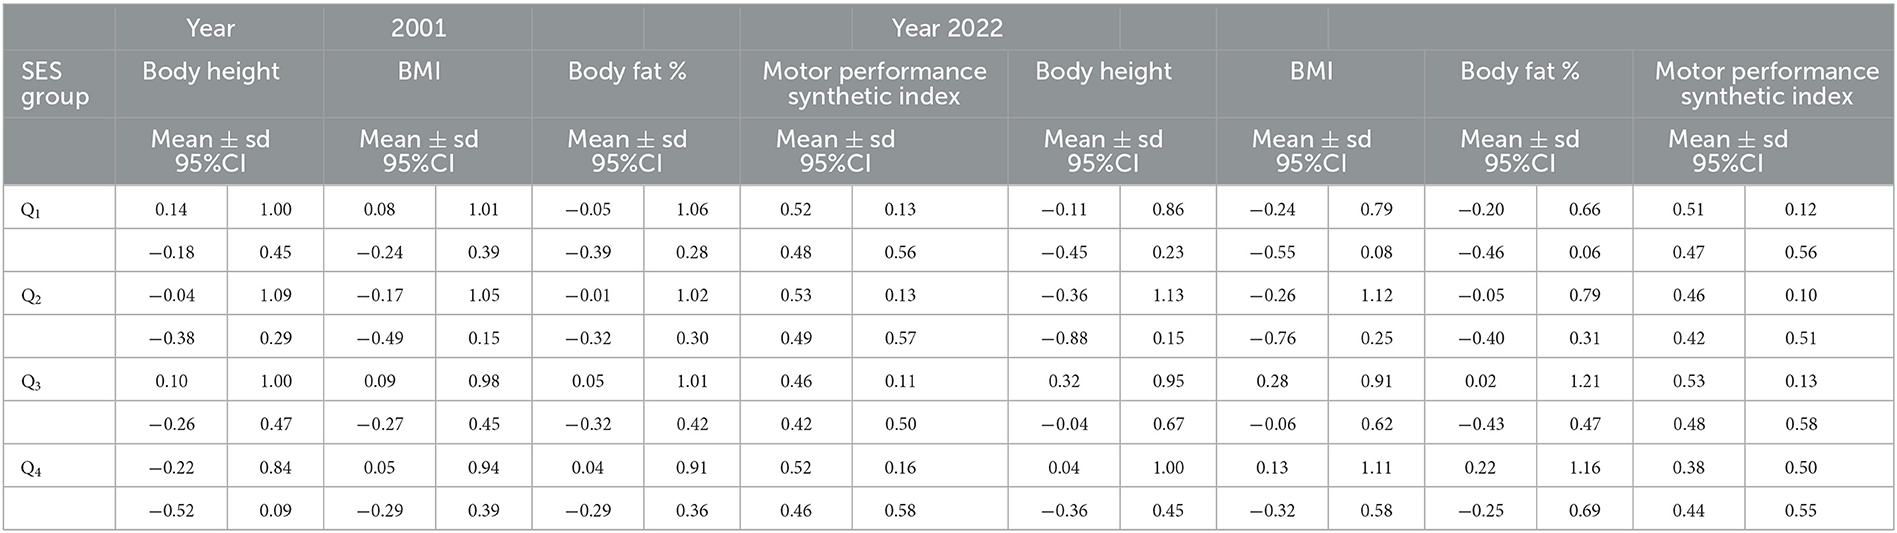
Table 2. Basic statistics of the standardized morphological features and motor performance synthetic index (MPSI) of the students by socioeconomic status groups (Q1–Q4) and period of examination (2001–2022).
The two-way ANOVA of normalized values of all variables suggested no significant influence of either SES (BH: F = 1.86, p = 0.138; BMI: F = 1.87, p = 0.134; BFP: F = 0.70, p = 0.552; MPSI: F = 0.34, p = 0.795) or time (F = 0.03, p = 0.852; F = 0.06, p = 0.803; F = 0.02, p = 0.961; F = 0.28, p = 0.599). However, a significant interaction was observed between both factors in motor performance (F = 2.73, p = 0.045), which indicated that the change in SES impacted motor fitness over time.
The two-way ANOVA results justified detailed post-hoc comparisons of the quartiles within and between the periods. Within P2, BH differed significantly between Q2 and Q3 (p = 0.035), though BFP and BMI were similar between the quartiles. However, differences in MPSI between Q2 and Q3 were significant in P1 (p = 0.028). Comparisons of the same quartiles between the periods showed significant MPSI differences in Q2.
The primary analysis concerned the assessment of differences in the intensity of the relationship between SES position and morphological and motor variables over time. The regression models analyzed SII and RII indices of inequalities, where the β1 statistic was the absolute index (SII) (see results in Table 3).
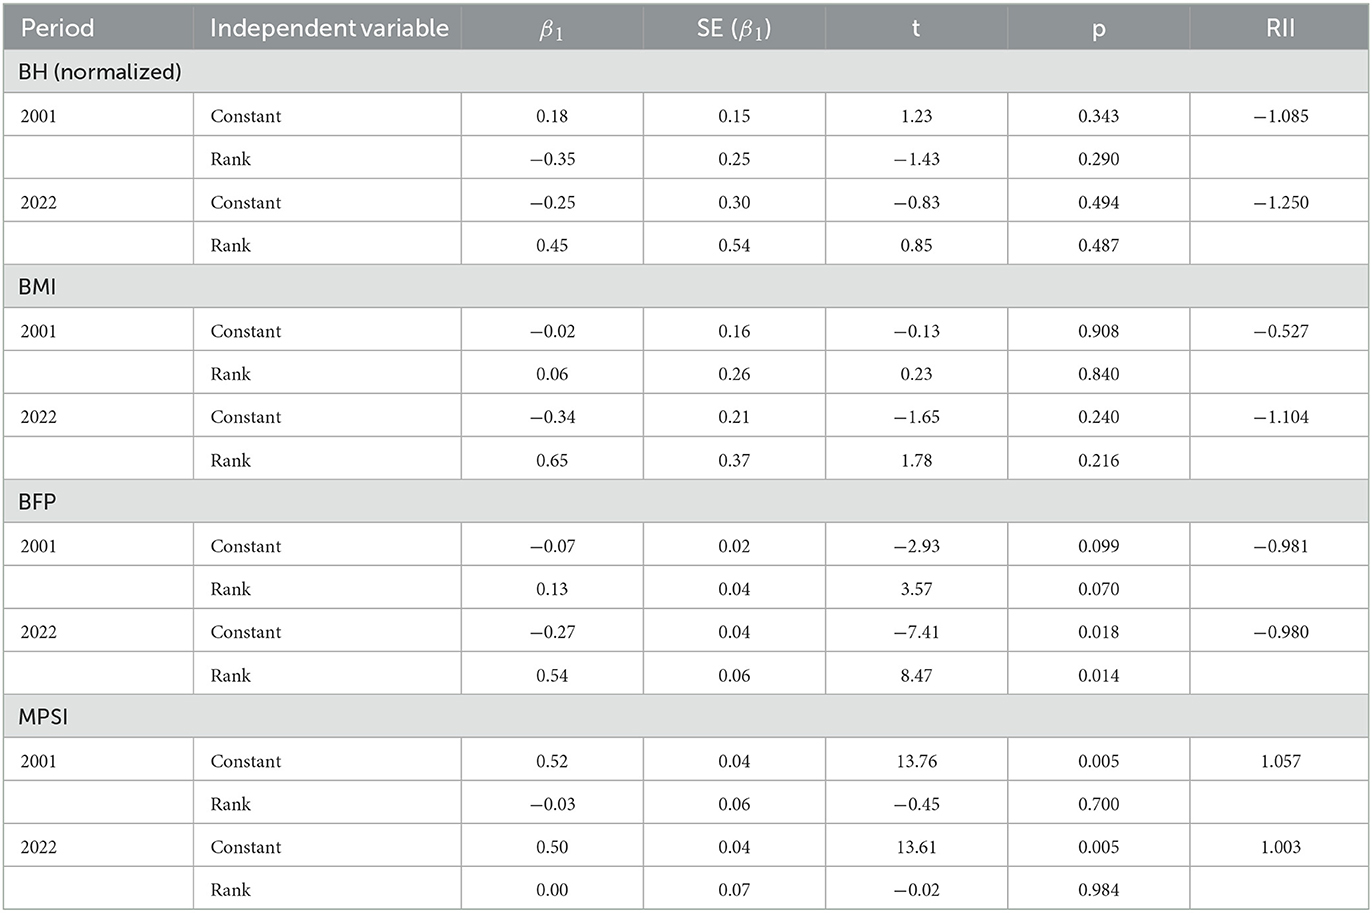
Table 3. The results of the linear regression models estimation.
The lack of significance in BH and BMI indicated no inequalities in these health markers. Indeed, similar patterns emerged in the relationship between anthropometric features and the socioeconomic position of P1 and P2 participants (Table 3).
BFP increased along the SES axis, with lower values in those with the worst living conditions and higher values in those living under the best conditions (Figure 1; Table 3). The BFP regression for the participants examined in P2 was steeper, which suggests a more intense effect of social inequalities on BFP in P2 than in P1. Interestingly, BFP in students with lower SES (Q1-Q2) in P1 was higher than in Q1 and Q2 from P2, though the opposite was true for Q3 and Q4. This indicates a deeper gap between SES groups examined in 2022 and an intensification of the effects of inequalities on BFP. In contrast, the motor performance gradient had the steepest decline along the SES axis, from lowest (Q1) to highest (Q4), in P1. As such, P2 students in Q1-Q3 had lower motor performance levels. However, P2 Q4 students had lower MPSI levels than P1, with all student scores identical.
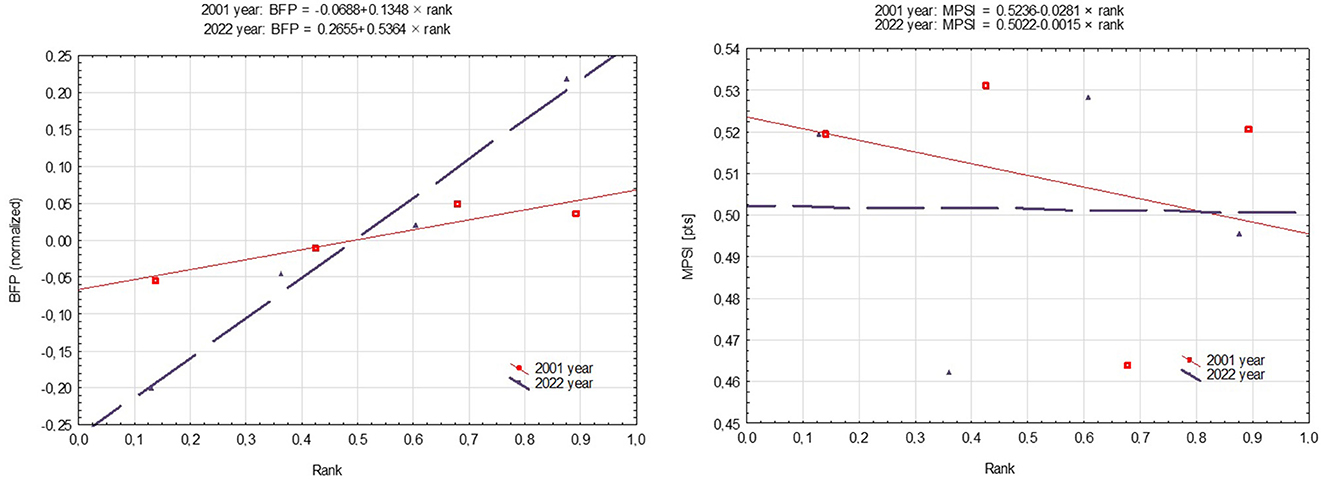
Figure 1. Health inequalities in students by the period of examination using a regression-based approach.
The absolute inequality indicators confirmed social inequalities at the BFP level related to the socioeconomic position of student families. There are greater differences in health now (P2 SII = −0.27) than 20 years ago (P1 SII = −0.07). The RII shows that the differences in the level of BFP between people in the highest (Q4) and the lowest (Q1) socioeconomic positions were at 27% in P2 and 7% in P1. Regarding MPSI, the intensity of differences between extreme SES groups was 2% higher in P1 (SII = 0.52) than in P2 (SII = 0.50).
RII illustrates the relationship between health markers and SES grouping in relation to the mean level of these markers observed in the studied groups. For BFP, the RII indicators were practically identical, indicating that the same proportion of people in the highest SES from P1 and P2 had a higher level of adiposity than the mean group score. MPSI was the same across SES groups in P2 (RII = 1), although scores in Q4 were 6% lower than the mean level of motor performance in the entire group of respondents.
4. Discussion
This study demonstrated SES-related changes to motor performance and body composition over 20 years. The last two decades have seen substantial lifestyle changes associated with technology development (46). However, social inequalities still strongly affect health features, as the risk of being overweight increases by 2-fold. In this regard, higher SES equated to higher body fat indicators, which could lead to health-related problems associated with metabolic disorders and cardiovascular diseases (47).
A declining trend in motor performance levels was evident 20 years ago, which seems to be constant in current times. Furthermore, a comparison of the groups from both periods indicated a significant worsening in motor performance. These data provide deeper insight into H-RF changes and indicate the need for public health disease prevention interventions (48). The decline in motor performance requires attention because motor skills are lower at a young age, meaning future generations are at risk of limited independence in old age (1, 49). Moreover, this creates a severe public health issue that could grow if the tendency develops.
A study by Baran et al. (50) among school-aged children showed a tendency of increased BMI in subjects living outside the city. This was due to a lack of health-related knowledge, limited access to good-quality food, and the limited availability of leisure activities in smaller towns. Nonetheless, family is the primary factor affecting health-related inequalities.
Health inequalities were less visible in Swedish student populations in periods similar to this study (51), indicating that political and economic states strongly affect citizens' lives. Dalstra et al. (52) showed a higher likelihood of cardiovascular issues in lower SES groups, which could be related to inequalities in access to health services and early diagnosis. Furthermore, health inequalities pose a substantial risk of life quality decline and can be a source of many mental diseases and disorders (53). However, a healthy lifestyle is vital to disease prevention, irrespective of SES differences, and this is worsening in groups with limited access to health services (54). This growing issue became apparent throughout the recent COVID-19 pandemic, during which the risk of adverse disease was higher in individuals with low SES and worse lifestyles (55).
A decline in physical activity is linked to increased body fat (56), and a sedentary lifestyle combined with an unhealthy diet leads to many diseases of civilization (57). Indeed, physical activity is one of the most crucial preventive actions not strongly related to SES. One of the reasons for growing physical inactivity is the development of technologies (46). Despite the many advantages associated with the development of numerous forms of transport and communications, and the possibilities provided by the internet, people need to do less in their daily routines, which means they move less and expend less energy. In addition, inactivity is prolonged due to the many hours of leisure time now spent using phones or computers (58). These factors all translate to growing body fat and a decline in motor performance, which was also visible in the current study. It was shown that low health-related fitness level in youth is associated with cardiometabolic risk (59). Therefore, there is a need to popularize many forms of physical activity from school age (60), which should decrease the risk of many health problems or independency in older years (61, 62).
We are aware of some limitations in the current study. The study was conducted on a select group of students from a single institution, which limits the applicability of the findings to a larger population. A more extensive and diverse sample is needed to provide a comprehensive understanding of health inequalities in the overall population of Poland. The absence of body fat data from 2010 and 2011 limited the Slaughter regression analysis and would have provided a deeper understanding of the observed trends. On the other hand, the study presented unique data on the association between SES, body morphology, and motor performance. This data provide insight into the changes associated with H-RF factors and fills a gap in the literature. Another limitation is the lack of several different potential confounding variables such as lifestyle (smoking and alcohol consumption) or dietary behaviors. In addition, more socioeconomic factors (e.g., occupation, income, and wealth) could be used to assess a family's socioeconomic situation.
5. Conclusion
The regression method provided information on the intensity of inequalities in health by calculating the RII, which determined the relative disadvantage experienced by SES subgroups over 20 years. This method better reflected the relationship between the economic and social living conditions of families (SES) and the variables characterizing health than comparisons of means using analysis of variance. Furthermore, the juxtaposition of the two periods made it possible to compare the intensity of social differences in health.
Time did not significantly differentiate the overall percentage of people from individual SES groups, though it affected the social gradient concerning BFP, which was much steeper in P2 than in P1. However, a slight increase in BFP was evident in higher SES subgroups, which relates to strong economic development.
Adipose tissue was and is a sensitive barometer of economic and social status, even within a select group of physical activity students from the University of Physical Education. The increase in the dependence of BW and its fat component on the SES position (between Q1 and Q4) in P2 may be the result of strong technological development in the last two decades. Such changes have changed behavior patterns related to spending free time (more time in front of computers and televisions and less physical activity), traveling, and undertaking physical work.
A specific group at risk of excessive BFP are those from more affluent families, for whom improper nutrition may be connected to fast food, among other factors. On the other hand, the physical activity of the groups included in this study may equalize the level of physical fitness, regardless of SES. However, in terms of physical fitness level, students from the P1 period were characterized by a higher level, which could be due to a combination of a higher level of physical activity and changes in body morphology (adipose tissue). This finding suggests a strong relationship between motor fitness level and body morphology. The results presented indicate that changes in morphological and motor health indicator variables should be monitored periodically using the regression method described.
Data availability statement
The raw data supporting the conclusions of this article will be made available by the authors, without undue reservation.
Ethics statement
The studies involving human participants were reviewed and approved by the Senate Research Ethics Committee of the Wroclaw University of Health and Sport Sciences in Poland (consent number 16/2018). The patients/participants provided their written informed consent to participate in this study.
Author contributions
JD conceived the study. JD, DK, KK-J, and PS collected data for the study. JD and JF analyzed the data. All authors were involved in drafting the article, reviewing, and approving the final manuscript.
Conflict of interest
The authors declare that the research was conducted in the absence of any commercial or financial relationships that could be construed as a potential conflict of interest.
Publisher's note
All claims expressed in this article are solely those of the authors and do not necessarily represent those of their affiliated organizations, or those of the publisher, the editors and the reviewers. Any product that may be evaluated in this article, or claim that may be made by its manufacturer, is not guaranteed or endorsed by the publisher.
References
1. Fugiel J, Kochan-Jacheć K, Kozlenia D, Domaradzki J. Changes in Anthropometric Measurements and Physical Fitness of Polish Students in 20-Year Period. Int J Environ Res Public Health. (2022) 19:16885. doi: 10.3390/ijerph192416885
2. Eberhardt T, Niessner C, Oriwol D, Buchal L, Worth A, Bös K. Secular Trends in Physical Fitness of Children and Adolescents: A Review of Large-Scale Epidemiological Studies Published after 2006. Int J Environ Res Public Health. (2020) 17:5671. doi: 10.3390/ijerph17165671
3. Rosique-Esteban N, Díaz-López A, Martínez-González MA, Corella D, Goday A, Martínez JA, et al. Leisure-time physical activity, sedentary behaviors, sleep, and cardiometabolic risk factors at baseline in the PREDIMED-PLUS intervention trial: A cross-sectional analysis. PLoS ONE. (2017) 12:e0172253. doi: 10.1371/journal.pone.0172253
4. Bor J, Cohen GH, Galea S. Population health in an era of rising income inequality: USA, 1980-2015. Lancet. (2017) 389:1475–90. doi: 10.1016/S0140-6736(17)30571-8
5. Holdsworth M, Nicolaou M, Langøien LJ, Osei-Kwasi HA, Chastin SFM, Stok FM, et al. Developing a systems-based framework of the factors influencing dietary and physical activity behaviours in ethnic minority populations living in Europe - a DEDIPAC study. Int J Behav Nutr Phys Act. (2017) 14:154. doi: 10.1186/s12966-017-0608-6
6. Chastin SFMC, Van Cauwenberg J, Maenhout L, Cardon G, Lambert EV, et al. Inequality in physical activity, global trends by income inequality and gender in adults. Int J Behav Nutr Phys Act. (2020) 17:142. doi: 10.1186/s12966-020-01039-x
7. Graham C, Felton A. Does inequality matter to individual welfare? An initial exploration based on happiness surveys from Latin America. In Happiness, Economics and Politics. Edward Elgar Publishing. (2009).
9. Beeston C, McCartney G, Ford J, Wimbush E, Beck S, MacDonald W, et al. Health inequalities policy review for the Scottish ministerial task force on health inequalities. Edinburgh: NHS Health Scotland. (2013).
10. Jackson-Morris AM, Nugent R, Ralston J, Barata Cavalcante O, Wilding J. Strengthening resistance to the COVID-19 pandemic and fostering future resilience requires concerted action on obesity. Glob Health Action. (2020) 13:1804700. doi: 10.1080/16549716.2020.1804700
11. Skinner JS, Oja P. Laboratory and field tests for assessing health-related fitness. In: Physical activity, fitness and health. (1994) 160–179.
12. Ortega FB, Ruiz JR, Castillo MJ, Sjöström M. Physical fitness in childhood and adolescence: a powerful marker of health. Int J Obes. (2008) 32:1–11. doi: 10.1038/sj.ijo.0803774
13. Shephard RJ, Bouchard C. Population evaluations of health related fitness from perceptions of physical activity and fitness. Canad J Appl Physiol. (1994) 19:151–73. doi: 10.1139/h94-012
14. Poitras VJ, Gray CE, Borghese MM, Carson V, Chaput JP, Janssen I, et al. Systematic review of the relationships between objectively measured physical activity and health indicators in school-aged children and youth. Appl Physiol Nutr Metabol. (2016) 41:S197–239. doi: 10.1139/apnm-2015-0663
15. Bouchard C. Physical activity, fitness and health: the model and key concepts. in Physical activity, fitness and health: International proceedings and consensus statement. Human Kinetics. (1994).
16. Chen W, Hammond-Bennett A, Hypnar A, Mason S. Health-related physical fitness and physical activity in elementary school students. BMC Public Health. (2018) 18:195. doi: 10.1186/s12889-018-5107-4
17. Rauner A, Mess F, Woll A. The relationship between physical activity, physical fitness and overweight in adolescents: a systematic review of studies published in or after 2000. BMC Pediatr. (2013) 13:19. doi: 10.1186/1471-2431-13-19
18. Blair SN, Cheng Y, Holder JS. Is physical activity or physical fitness more important in defining health benefits? Med Sci Sports Exer. (2001) 33:S379–S420. doi: 10.1097/00005768-200106001-00007
19. Katzmarzyk PT, Malina RM, Bouchard C. Physical activity, physical fitness, and coronary heart disease risk factors in youth: the Québec Family Study. Prev. Med. (1999) 29:555–62. doi: 10.1006/pmed.1999.0592
20. Bielicki T, Szczotka H, Charzewski J. The influence of three socio-economic factors on body height in polish military conscripts. Hum Biol. (1981) 53:543–55.
21. Hotchkiss JW, Davies C, Gray L, Bromley C, Capewell S, Leyland AH. Trends in adult cardiovascular disease risk factors and their socio-economic patterning in the Scottish population 1995-2008: cross-sectional surveys. BMJ Open. (2011) 1:e000176. doi: 10.1136/bmjopen-2011-000176
22. Kaplan GA, Keil JE. Socioeconomic factors and cardiovascular disease: a review of the literature. Circulation. (1993) 88:1973–98. doi: 10.1161/01.CIR.88.4.1973
23. Wilkinson RG Marmot M World Health Organization. The solid facts: social determinants of health (No. EUR/ICP/CHVD 03 09 01). Copenhagen: WHO Regional Office for Europe. (1998).
24. Wamala SP, Mittleman MA, Horsten M, Schenck-Gustafsson K, Orth-Gomér K. Job stress and the occupational gradient in coronary heart disease risk in women. The Stockholm Female Coronary Risk Study. Soc Sci Med. (2000) 51:481–9. doi: 10.1016/S0277-9536(00)00006-X
25. Droomers M, Schrijvers CT, Mackenbach JP. Why do lower educated people continue smoking? Explanations from the longitudinal GLOBE study. Health Psychol. (2002) 21:263–72. doi: 10.1037/0278-6133.21.3.263
26. Andersson P, Leppert J. Men of low socio-economic and educational level possess pronounced deficient knowledge about the risk factors related to coronary heart disease. J Cardiovasc Risk. (2001) 8:371–7. doi: 10.1177/174182670100800606
27. Pell JP, Pell AC, Norrie J, Ford I, Cobbe SM. Effect of socioeconomic deprivation on waiting time for cardiac surgery: retrospective cohort study. BMJ. (2000) 320:15–8. doi: 10.1136/bmj.320.7226.15
28. Ahinkorah BO, Budu E, Seidu AA, Agbaglo E, Adu C, Osei D, et al. Socio-economic and proximate determinants of under-five mortality in Guinea. PLoS ONE. (2022) 17:e0267700. doi: 10.1371/journal.pone.0267700
29. Nejatinamini S, Godley J, Minaker LM, Sajobi TT, McCormack GR, Cooke MJ, et al. Quantifying the contribution of modifiable risk factors to socio-economic inequities in cancer morbidity and mortality: a nationally representative population-based cohort study. Int J Epidemiol. (2021) 50:1498–511. doi: 10.1093/ije/dyab067
30. Santoro D, Ingegnieri MT, Vita G, Lucisano S, Zuppardo C, Canale V, et al. Socio-Economic Factors, Food Habits and Phosphorus Levels in Patients on Hemodialysis. Nephrourol Mon. (2015) 7:e27114. doi: 10.5812/numonthly.27114
31. Shang XT, Wei ZH. Socio-economic inequalities in health among older adults in China. Public Health. (2022) 214:146–52. doi: 10.1016/j.puhe.2022.11.013
32. Sha H, Debbie A, Shaw GD. The handbook of inequality and socioeconomic position: concepts and measures. J Soc Policy. (2009) 38:545. doi: 10.1017/S0047279409003201
33. Mackenbach JP, Kunst AE. Measuring the magnitude of socio-economic inequalities in health: an overview of available measures illustrated with two examples from Europe. Soc Sci Med. (1997) 44:757–71. doi: 10.1016/S0277-9536(96)00073-1
34. Mazur J. Metody regresyjne w badaniach nad nierównościami w zdrowiu [Regression-based methods in the studies on health inequalities]. Probl Hig Epidemiol. (2010) 91:21–7.
35. Hauspie RC, Vercauteren M, Susanne C. Secular changes in growth and maturation: an update. Acta Paediatr. (1997) 86:20–7. doi: 10.1111/j.1651-2227.1997.tb18364.x
36. Mazur J, Woynarowska B. Mierniki nierówności społecznych w badaniach ankietowych młodziezy szkolnej [Indicators of social inequalities for school-age children health surveys]. Przegl Epidemiol. (2004) 58:377–90.
37. Thompson JM, Irgens LM, Rasmussen S, Daltveit AK. Secular trends in socio-economic status and the implications for preterm birth. Paediatr Perinat Epidemiol. (2006) 20:182–7. doi: 10.1111/j.1365-3016.2006.00711.x
38. Kalka E, Pastuszak A, Buśko K. Secular trends in body height, body weight, BMI and fat percentage in Polish university students in a period of 50 years. PLoS ONE. (2019) 14:e0220514. doi: 10.1371/journal.pone.0220514
40. Slaughter MH, Lohman TG, Boileau R, Horswill CA, Stillman RJ, Van Loan MD, et al. Skinfold equations for estimation of body fatness in children and youth. Hum Biol. (1988) 60:709–23.
42. Hellwig Z. Application of the taxonomic method to the typological division of countries due to the level of their development and the resources and structure of qualified personnel. Stat Rev. (1968) 4:307–27.
43. Corder GW, Foreman DI. (2014). Nonparametric Statistics: A Step-by-Step Approach. New York: Wiley. ISBN 978–1118840313
44. Preston LE, Post JE. Private management and public policy. Calif Manage Rev. (1981) 23:56–62. doi: 10.2307/41172602
45. Pamuk ER. Social class inequality in mortality from 1921 to 1972 in England and Wales. Population studies. (1985) 39:17–31. doi: 10.1080/0032472031000141256
46. Woessner MN, Tacey A, Levinger-Limor A, Parker AG, Levinger P, Levinger I. The evolution of technology and physical inactivity: the good, the bad, and the way forward. Front Public Health. (2021) 9:655491. doi: 10.3389/fpubh.2021.655491
47. Vuković D, Bjegović V, Vuković G. Prevalence of chronic diseases according to socio-economic status measured by wealth index: health survey in Serbia. Croat Med J. (2008) 49:832–41. doi: 10.3325/cmj.2008.49.832
48. Smith SA, Ansa B. A systematic review of lifestyle interventions for chronic diseases in rural communities. J Georgia Public Health Assoc. (2016) 5:304–13. doi: 10.21633/jgpha.5.404
49. Marques EA, Baptista F, Santos DA, Silva AM, Mota J, Sardinha LB. Risk for losing physical independence in older adults: the role of sedentary time, light, and moderate to vigorous physical activity. Maturitas. (2014) 79:91–5. doi: 10.1016/j.maturitas.2014.06.012
50. Baran R, Baran J, Leszczak J, Bejer A, Wyszyńska J. Sociodemographic and Socio-economic Factors Influencing the Body Mass Composition of School-Age Children. Int J Environ Res Public Health. (2022) 19:11261. doi: 10.3390/ijerph191811261
51. Ahlborg M, Svedberg P, Nyholm M, Morgan A, Nygren JM. Socio-economic inequalities in health among Swedish adolescents-adding the subjective perspective. BMC Public Health. (2017) 17:1–10. doi: 10.1186/s12889-017-4863-x
52. Dalstra JA, Kunst AE, Borrell C, Breeze E, Cambois E, Costa G, et al. Socioeconomic differences in the prevalence of common chronic diseases: an overview of eight European countries. Int J Epidemiol. (2005) 34:316–26. doi: 10.1093/ije/dyh386
53. Kivimäki M, Batty GD, Pentti J, Shipley MJ, Sipilä PN, Nyberg ST, et al. Association between socio-economic status and the development of mental and physical health conditions in adulthood: a multi-cohort study. Lancet Public health. (2020) 5:e140–9. doi: 10.1016/S2468-2667(19)30248-8
54. Zhang YB, Chen C, Pan XF, Guo J, Li Y, Franco OH, et al. Associations of healthy lifestyle and socio-economic status with mortality and incident cardiovascular disease: two prospective cohort studies. BMJ. (2021) 373:n604. doi: 10.1136/bmj.n604
55. Foster HM, Ho FK, Mair FS, Jani BD, Sattar N, Katikireddi SV, et al. The association between a lifestyle score, socioeconomic status, and COVID-19 outcomes within the UK Biobank cohort. BMC Infect Dis. (2022) 22:1–13. doi: 10.1186/s12879-022-07132-9
56. Pribis P, Burtnack CA, McKenzie SO, Thayer J. Trends in body fat, body mass index and physical fitness among male and female college students. Nutrients. (2010) 2:1075–85. doi: 10.3390/nu2101075
57. Bulwer BE. Sedentary lifestyles, physical activity, and cardiovascular disease: from research to practice. Crit Pathw Cardiol. (2004) 3:184–93. doi: 10.1097/01.hpc.0000146866.02137.ab
58. Yan Z. Child and Adolescent Use of Mobile Phones: An Unparalleled Complex Developmental Phenomenon. Child Dev. (2018) 89:5–16. doi: 10.1111/cdev.12821
59. Reuter C, Silveira J, Borfe L, Renner J, Pohl H. Low performance-related physical fitness levels are associated with clustered cardiometabolic risk score in schoolchildren: a cross-sectional study. Human Movement. (2022) 23:113–9. doi: 10.5114/hm.2022.107976
60. Santos F, Sousa H, Gouveia ÉR, Lopes H, Peralta M, Martins J, et al. School-based family-oriented health interventions to promote physical activity in children and adolescents: a systematic review. Am J Health Promot. (2023) 37:243–62. doi: 10.1177/08901171221113836
61. Zurek G, Lepsy E, Zurek A, Radajewska A, Ptaszkowski K, Golachowska M. The relationship between the level of physical activity, independence in daily activities, and life quality and satisfaction in women over 80 living in rural areas - a pilot study. Rocz Panstw Zakl Hig. (2020) 71:171–80. doi: 10.32394/rpzh.2020.0112
Keywords: health inequalities, health-related fitness, young adults (18–25 years old), socio-economic factors, body morphology, physical fitness
Citation: Domaradzki J, Koźlenia D, Kochan-Jacheć K, Szkudlarek P and Fugiel J (2023) Socioeconomic inequalities in health-related fitness gradient shifts between 2001 and 2022 in young Polish adults. Front. Public Health 11:1163215. doi: 10.3389/fpubh.2023.1163215
Received: 10 February 2023; Accepted: 06 April 2023;
Published: 09 May 2023.
Edited by:
Pasqualino Maietta Latessa, University of Bologna, ItalyReviewed by:
Anna Szczerba-Turek, University of Warmia and Mazury in Olsztyn, PolandRan Guo, University of Houston, United States
Copyright © 2023 Domaradzki, Koźlenia, Kochan-Jacheć, Szkudlarek and Fugiel. This is an open-access article distributed under the terms of the Creative Commons Attribution License (CC BY). The use, distribution or reproduction in other forums is permitted, provided the original author(s) and the copyright owner(s) are credited and that the original publication in this journal is cited, in accordance with accepted academic practice. No use, distribution or reproduction is permitted which does not comply with these terms.
*Correspondence: Dawid Koźlenia, ZGF3aWQua296bGVuaWFAYXdmLndyb2MucGw=