 Tingting Wang1†
 Qi Gao1†
 Yuanyuan Yao1†
 Ge Luo1†Tao Lv2Guangxin Xu2Mingxia Liu1
 Jingpin Xu1Xuejie Li1Dawei Sun1Zhenzhen Cheng1
 Ying Wang1Chaomin Wu2Ruiyu Wang1Jingcheng Zou1
 Min Yan1*
- 1Department of Anesthesiology, Second Affiliated Hospital, Zhejiang University School of Medicine, Hangzhou, China
- 2Department of Anesthesiology, The Fourth Affiliated Hospital, International Institutes of Medicine, Zhejiang University School of Medicine, Yiwu, China
Background: Observational studies have suggested an association between obesity and iron deficiency anemia, but such studies are susceptible to reverse causation and residual confounding. Here we used Mendelian randomization to assess whether the association might be causal.
Methods: Data on single-nucleotide polymorphisms that might be associated with various anthropometric indicators of obesity were extracted as instrumental variables from genome-wide association studies in the UK Biobank. Data on genetic variants in iron deficiency anemia were extracted from a genome-wide association study dataset within the Biobank. Heterogeneity in the data was assessed using inverse variance-weighted regression, Mendelian randomization Egger regression, and Cochran's Q statistic. Potential causality was assessed using inverse variance-weighted, Mendelian randomization Egger, weighted median, maximum likelihood and penalized weighted median methods. Outlier SNPs were identified using Mendelian randomization PRESSO analysis and “leave-one-out” analysis.
Results: Inverse variance-weighted regression associated iron deficiency anemia with body mass index, waist circumference, trunk fat mass, body fat mass, trunk fat percentage, and body fat percentage (all odds ratios 1.003–1.004, P ≤ 0.001). Heterogeneity was minimal and no evidence of horizontal pleiotropy was found.
Conclusion: Our Mendelian randomization analysis suggests that obesity can cause iron deficiency anemia.
Introduction
Obesity is an energy metabolism disorder that results in excessive fat storage and that can lead to physical and psychological problems (1). The World Health Organization calls obesity a chronic disease and a major threat to public health, in part because it increases the risk of cardiovascular disease (2), diabetes mellitus, and cancer (3).
Obesity has been linked to another global public health problem, iron deficiency anemia (4, 5). In low- and middle-income countries, iron deficiency anemia is one of the five most frequent causes of chronic disability (6). Observational studies have provided strong evidence of an association between obesity and iron deficiency anemia in Israel (7), Turkey (8), Taiwan (9, 10), Bangladesh (11) and the US (12, 13). A study on the interaction between body mass index and iron deficiency anemia showed that overweight and obese women had a 10.11 (95%CI: 1.267–80.797) times greater risk of iron deficiency anemia (9). Another study conducted in 525 women of reproductive age showed that the prevalence with iron deficiency anemia was 43.0% (11). On the other hand, some observational studies have reported no significant association (14–16), while an observational study in Colombia suggested that overweight and obesity were associated with lower risk of iron deficiency anemia than normal-weight women (17). And another study also indicated that no correlation was found between body mass index and iron deficiency anemia, which showed that only 13.4% of obese women and 17.1% of normal-weight women had iron deficiency anemia (OR = 0.75; 95% CI:0.39–1.49, P > 0.05) (14). This discrepancy in the literature, combined with the vulnerability of observational studies to reverse causation and residual confounding (18), led us to seek a more rigorous approach to assessing whether obesity might cause iron deficiency anemia.
We turned to Mendelian randomization (MR) as a more robust method for inferring causality than conventional observational studies. The greater robustness is thought to arise from the fact that genotypes are defined at conception and are generally not associated with conventional confounders in observational studies (18, 19). MR involves testing for a causal relationship between exposure (in our case, obesity) and outcome (iron deficiency anemia) using genetic markers (single-nucleotide polymorphisms, SNPs) associated with the exposure (20). We therefore applied two-sample MR to data from large-scale genome-wide association studies that explored links between anthropometric traits of obesity and iron deficiency anemia.
Methods
Data sources and selection of instrumental variables
We extracted data on SNPs and the following seven obesity-linked anthropometric traits from the UK Biobank, a prospective cohort study involving more than half a million people in the UK aged 40–69 years (21): body mass index, waist circumference, hip circumference, trunk fat mass, whole-body fat mass, trunk fat percentage, and body fat percentage (22, 23) (Table 1). We included data from 361,194 individuals diagnosed with iron deficiency anemia in the present study.
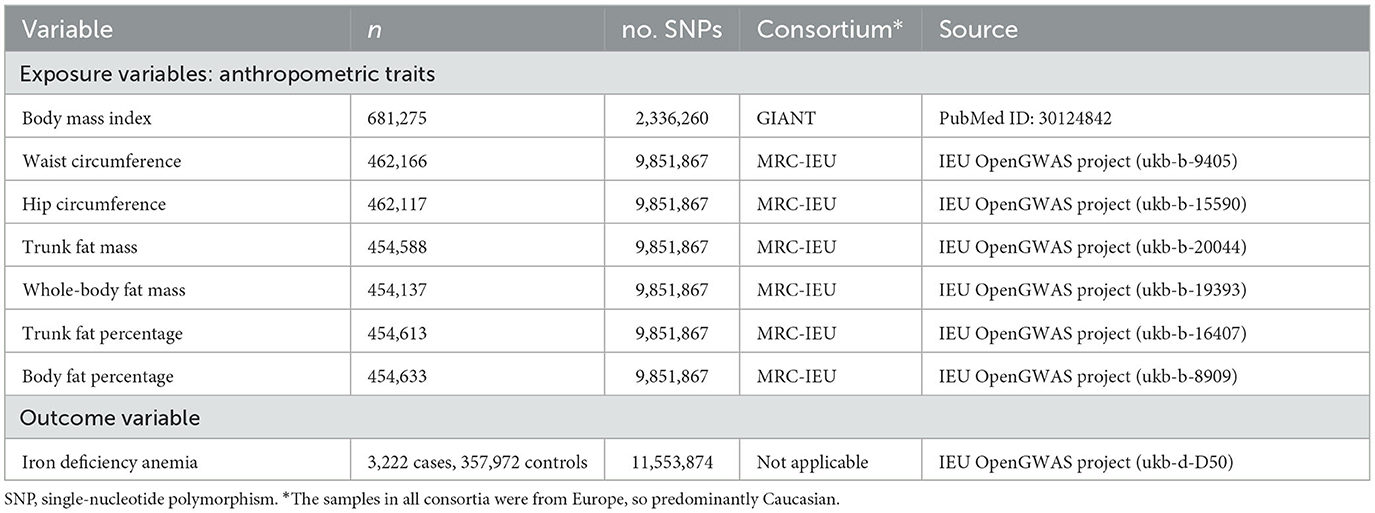
Table 1. Characteristics of the eight genome-wide association studies used in the present work.
Data on obesity-linked anthropometric traits and SNPs in individuals were obtained from genome-wide association studies within the UK Biobank as described in Supplementary Table 1. Publicly available summary data on body mass index and 2,336,260 SNPs were obtained from 681,275 individuals of European ancestry in the “Genetic investigation of anthropometric traits” consortium (24). Data were extracted, from genome-wide association studies in the MRC-IEU consortium (Table 2), for waist circumference from 462,166 individuals; hip circumference, 462,117 individuals; trunk fat mass, 454,588 individuals; whole-body fat mass, 454,137 individuals; trunk fat percentage, 454,613 individuals; and body fat percentage, 454,633 individuals.
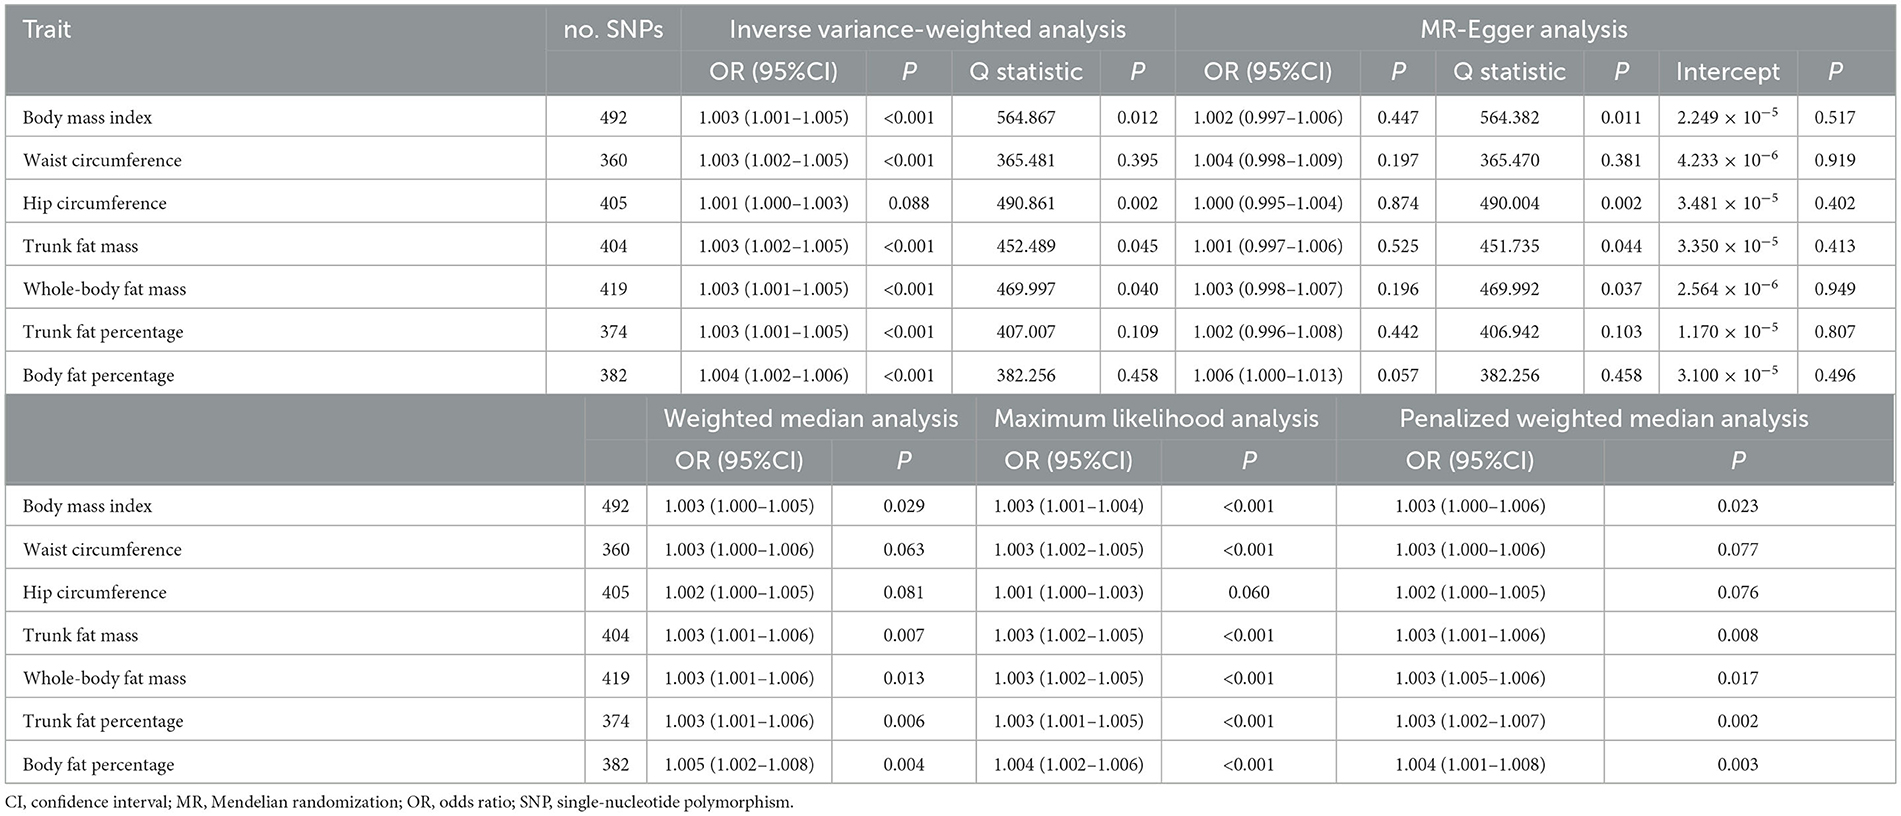
Table 2. Mendelian randomization analysis of casual associations between obesity-related anthropometric traits and iron deficiency anemia.
The abovementioned seven anthropometric traits were selected because they were the only ones for which the associated SNPs showed genome-wide significance (P < 5 × 10⁻⁸). Only data from SNPs showing r2 < 0.001 for a window size = 10,000 kb were extracted in order to ensure absence of linkage disequilibrium, as shown in Supplementary Figure 4. It was worth to emphasize that when performing MR analysis using genetic variants as instrumental variables, MR analysis needs to based on three principle assumptions (21): (1) genetic variants should be associated with the exposure; (2) genetic variants should be associated with the outcome exclusively through the exposure; and (3) genetic variants should be independent of any measured and unmeasured confounders.
The present study was considered exempt from ethics approval because it relied entirely on data from public databases that had been collected after the responsible institutions had received ethics approval and participants had given consent.
Two-sample MR and sensitivity analyses
Effect alleles were harmonized across the genome-wide association studies, and primary MR analysis was conducted using inverse variance-weighted regression. A fixed-effect regression model was used unless heterogeneity was significant (P < 0.05) based on Cochran's Q statistic from inverse variance-weighted and MR-Egger regression analyses, in which case a random-effects regression model was used.
Since inverse variance-weighted regression is sensitive to invalid instrumental variables and pleiotropy (25), secondary MR analyses were performed based on MR-Egger analysis, which can detect, and correct for, possible pleiotropy (26); weighted median analysis (27); as well as maximum likelihood and penalized weighted median methods (28). The weighted median method can produce consistent causal estimates, assuming that more than half of instrumental variables reflect valid SNPs (27). Maximum likelihood and penalized weighted median methods were used to assess the robustness of MR results (28). MR analyses were performed using “TwoSampleMR” (version 0.5.6; https://mrcieu.github.io/TwoSampleMR/) in R software (version 4.0.5; www.r-project.org).
Heterogeneity was assessed in terms of Cochran's Q statistic from inverse variance-weighted and MR-Egger regression analyses. Potential horizontal pleiotropy in regression results was assessed using MR-Egger and “MR-PRESSO” (version 1.0, https://github.com/rondolab/MR-PRESSO) analyses (29) in R, with the distribution number set to 1,000. MR-PRESSO has three components: (1) detection of horizontal pleiotropy; (2) correction for horizontal pleiotropy through removal of outliers; and (3) testing of significant differences in causal estimates before and after outlier removal. Outlier SNPs that might be confounding results were identified through analysis of individual SNPs and “leave-one-out” analyses. Variance (R2) in MR refers to the proportion of total variation in the exposure that is explained by the genetic instruments. R2 for each trait was derived from the original genome-wide association studies. We verified that the F-statistic, defined as mean β2/σ2 across all SNPs, was at least 10 for all the anthropometric traits in our analysis in order to minimize bias from weak genetic instruments (30) (Supplementary Table 9).
Results
The MR process in the present study is summarized in Figure 1. The genetic instruments initially identified to explore causal relationships between obesity-associated anthropometric traits and iron deficiency anemia are summarized in Supplementary Tables 1, 2, and the results after harmonization are shown in Supplementary Table 3. After removal of SNPs for which the allele or DNA strand was ambiguous (Supplementary Table 4), we searched for causal effects of individual obesity-associated anthropometric traits on iron deficiency anemia. The results of sensitivity analysis are shown in Supplementary Tables 6–8, and there was no horizontal pleiotropy in any of these results.
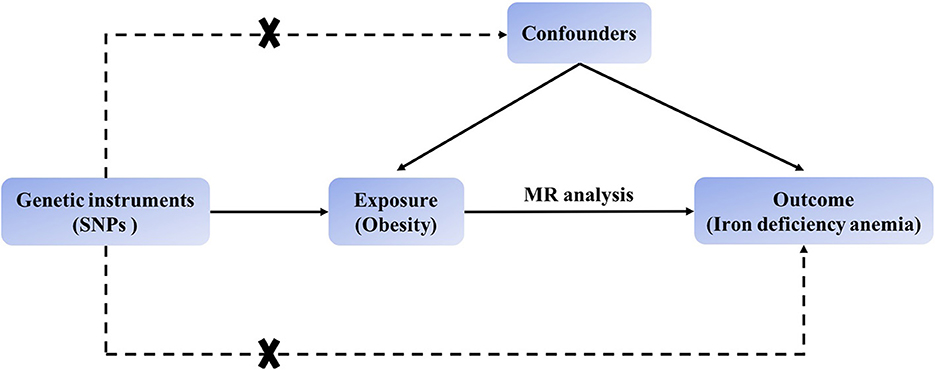
Figure 1. Schematic showing how Mendelian randomization was used to evaluate a causal association between obesity-related traits and iron deficiency anemia in this study.
Based on 492 SNPs related to body mass index, we found a causal effect of this index on risk of iron deficiency anemia in primary and secondary MR analyses (IVW: OR = 1.003, 95% CI: 1.001–1.004, P < 0.001; MR-Egger: OR = 1.002, 95% CI: 0.997–1.006, P = 0.447; weighted median: OR = 1.003, 95% CI: 1.000–1.006, P = 0.029; maximum likelihood: OR = 1.003, 95% CI: 1.001–1.004, P < 0.001; penalized weighted median: OR = 1.003, 95% CI: 1.000–1.006, P = 0.023; Table 2; Supplementary Table 5). The F-statistic for SNPs related to body mass index was approximately 29.742 (Supplementary Table 9). The P values of Q statistics for inverse variance-weighted and MR-Egger analyses suggested the existence of heterogeneity (MR-Egger: Q statistic = 564.382, P = 0.011; IVW: Q statistic = 564.867, P = 0.012), so random-effects regression model was used (Supplementary Table 6). The MR-Egger intercept test suggested horizontal pleiotropy (intercept = 2.249 × 10⁻⁵, P = 0.517, Supplementary Table 7), and removal of three outliers (rs380857, rs7903146 and rs818524) in MR-PRESSO analysis did not substantially alter the original results (Supplementary Table 8). The scatter plot showed a significant positive correlation between body mass index and iron deficiency anemia, and MR intercepts were close to zero, indicating minimal horizontal pleiotropy (Figure 2A). The causal association was robust to leave-one-out sensitivity analysis (Supplementary Figure 2A) and the funnel plot was symmetrical (Figure 3A), indicating no pleiotropy. Forest plots showed the causal effect estimates between body mass index and iron deficiency anemia, and the combination of the effect estimates based on inverse variance-weighted and MR-Egger regression (Supplementary Figure 3A).
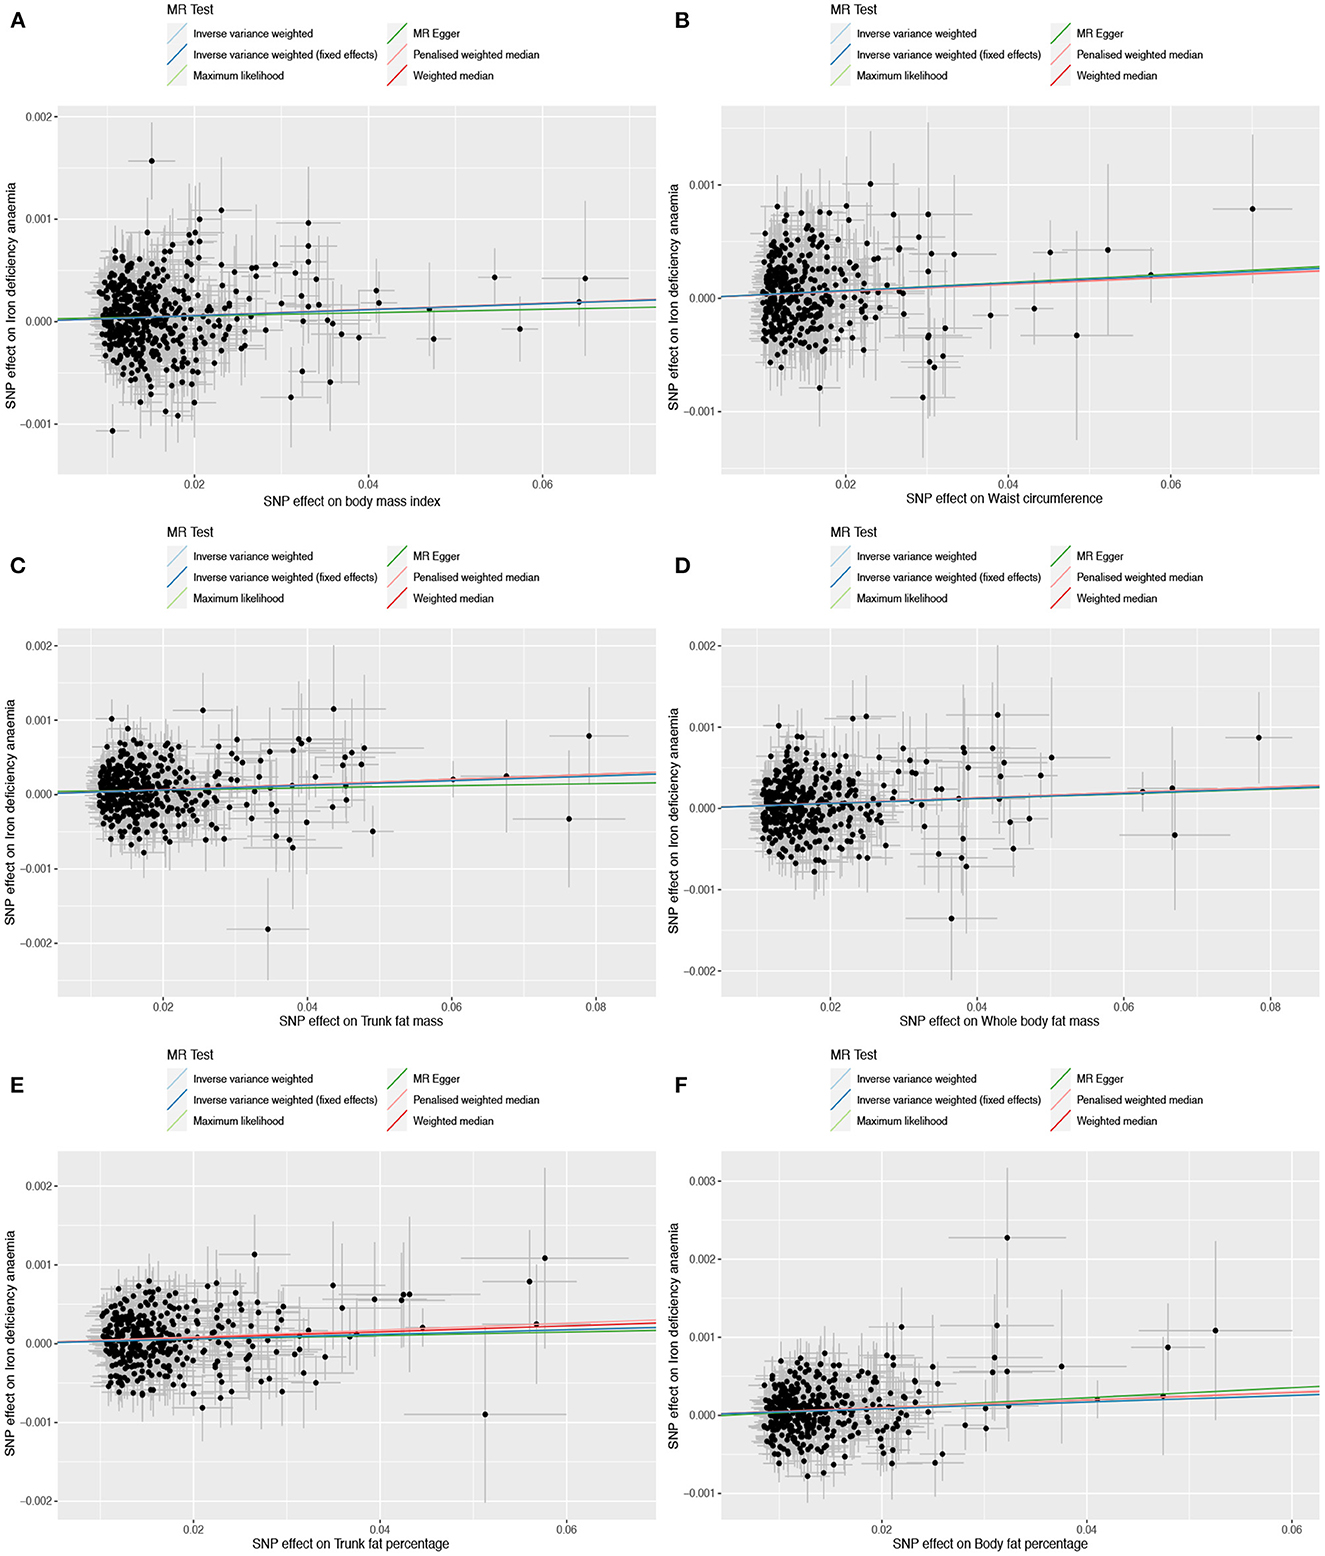
Figure 2. Scatter plots to assess causal associations between iron deficiency anemia and each of the following six obesity-related anthropometric traits: (A) body mass index, (B) waist circumference, (C) trunk fat mass, (D) whole-body fat mass, (E) trunk fat percentage, and (F) body fat percentage.
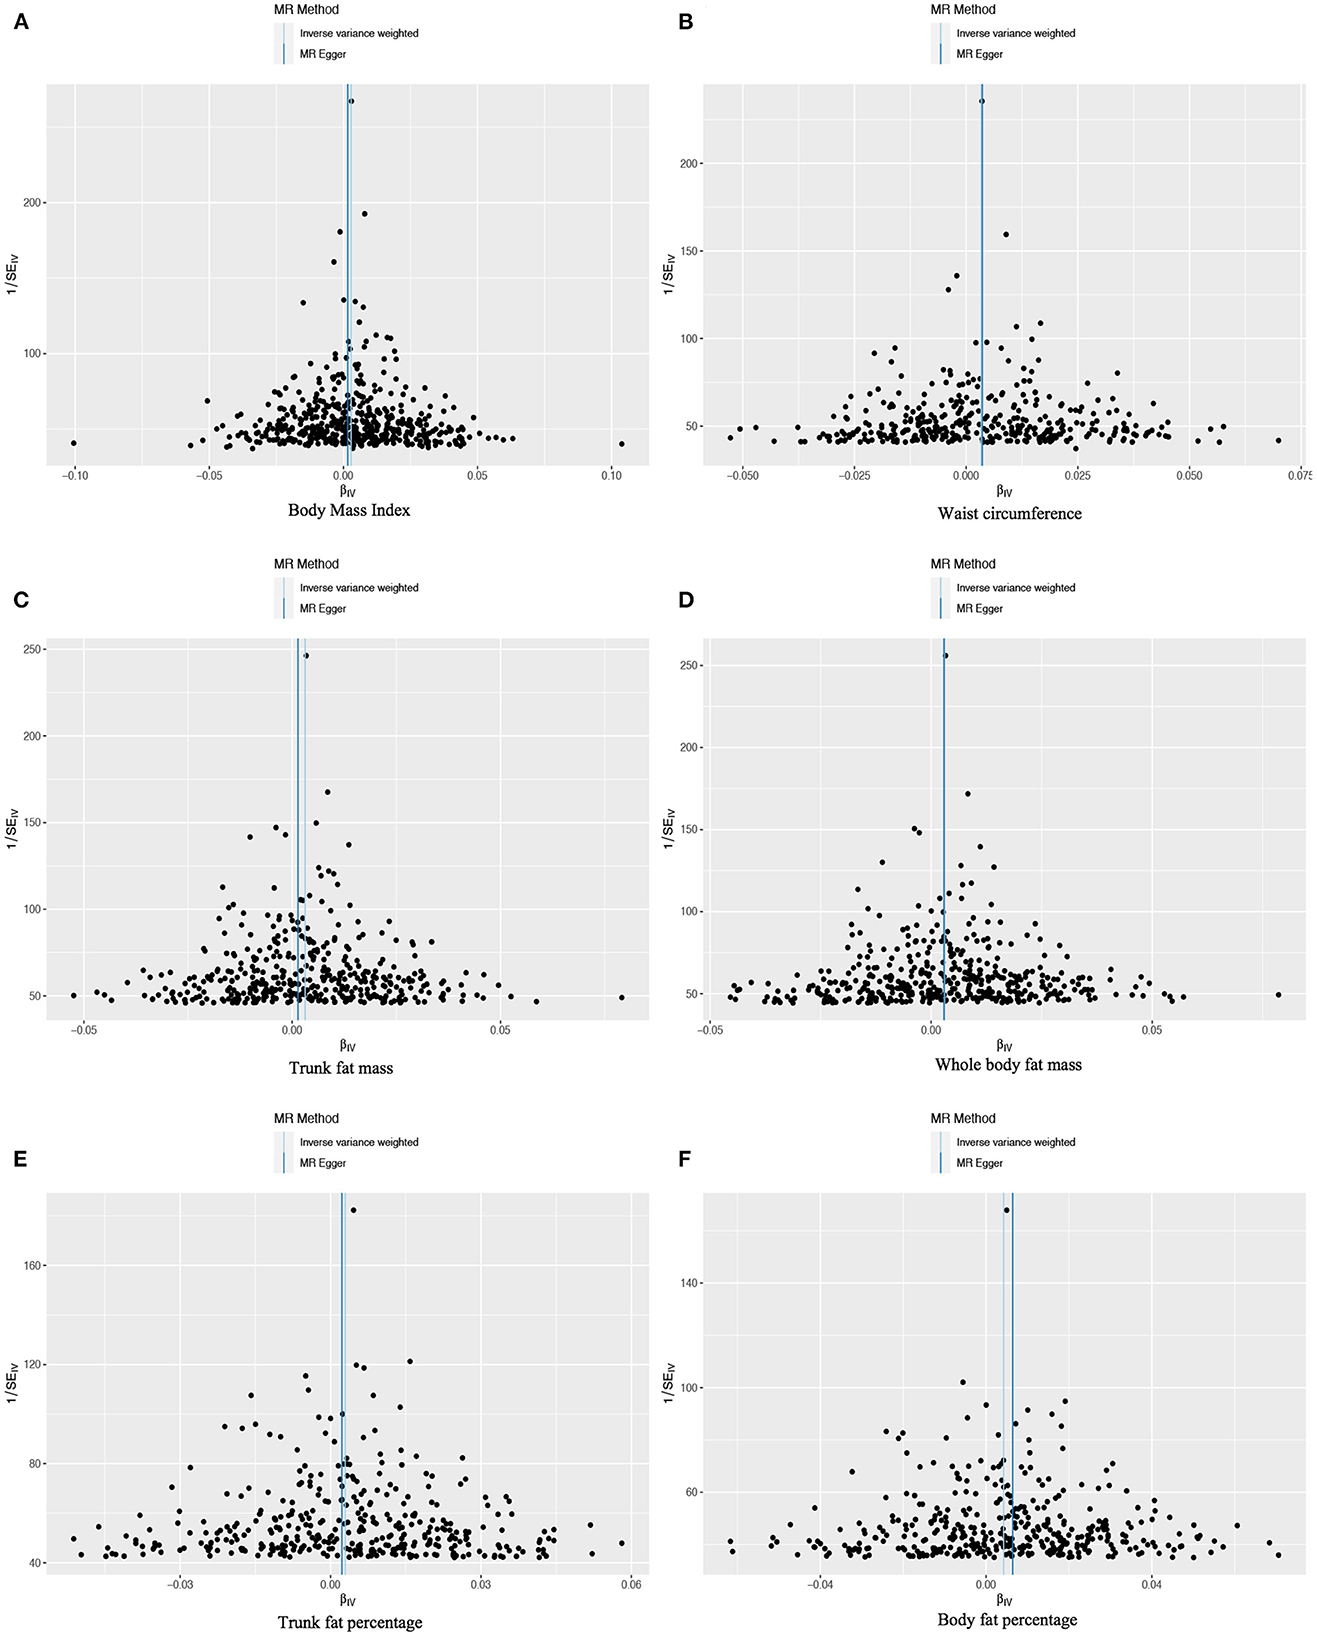
Figure 3. Funnel plots to assess the pleiotropy of observed causal associations between iron deficiency anemia and each of the following six obesity-related anthropometric traits: (A) body mass index, (B) waist circumference, (C) trunk fat mass, (D) whole-body fat mass, (E) trunk fat percentage, and (F) body fat percentage.
Based on 360 SNPs related to waist circumference, we found a causal effect of this parameter on risk of iron deficiency anemia in primary MR analysis with a fixed-effect regression model and in secondary MR analysis (IVW: OR = 1.003, 95% CI: 1.002–1.005, P < 0.001; MR-Egger: OR = 1.004, 95% CI: 0.998–1.009, P = 0.179; weighted median: OR = 1.003, 95% CI: 1.000–1.006, P = 0.063; maximum likelihood: OR = 1.003, 95% CI: 1.002–1.005, P < 0.001; penalized weighted median: OR = 1.003, 95% CI; 1.000–1.006, P = 0.077; Table 2; Supplementary Table 5). SNPs identified in iron deficiency anemia and waist circumference were found to be a available instruments, with F-statistics = 24.765 (Supplementary Table 9). We found no evidence of heterogeneity or pleiotropy based on MR-Egger analysis (Supplementary Tables 6, 7) and no evidence of outlier SNPs in MR-PRESSO analysis (Supplementary Table 8). The results were robust to leave-one-out analysis (Supplementary Figure 2B), and scatter, funnel and forest plots were similar to those for body mass index (Figures 2B, 3B; Supplementary Figure 3B).
Based on 404 SNPs for trunk fat mass, a causal effect of this parameter on iron deficiency anemia was found in inverse variance-weighted regression (IVW: OR = 1.003, 95% CI: 1.002–1.005, P < 0.001; MR-Egger: OR = 1.001, 95% CI: 0.997–1.006, P = 0.525; weighted median: OR = 1.003, 95% CI: 1.001–1.006, P = 0.007; maximum likelihood: OR = 1.003, 95% CI: 1.002–1.005, P < 0.001; penalized weighted median: OR = 1.003, 95% CI; 1.001–1.006, P = 0.008; F = 30.390; Table 2; Supplementary Tables 5, 9), which was conducted using a random-effects model because MR-Egger and inverse variance-weighted analyses indicated heterogeneity (MR-Egger: Q statistics = 451.735, P = 0.044; IVW: Q statistics = 452.489, P = 0.045; Supplementary Tables 5, 6). In addition, MR-PRESSO analysis did not detect significant outliers (Supplementary Table 8).
Based on 419 SNPs for whole-body fat mass, which explained 2% of its variance (Supplementary Table 9), a causal effect of this parameter on iron deficiency anemia was found in regression (IVW: OR = 1.003, 95% CI: 1.001–1.005, P < 0.001; F = 31.144), which was conducted using a random-effects model because the P-value of the Q statistic was < 0.05 in MR-Egger and inverse variance-weighted analyses (MR-Egger: Q statistics = 469.992, P = 0.037; IVW: Q statistics = 469.997, P = 0.040; Table 2; Supplementary Table 5). MR-Egger regression did not detect horizontal pleiotropy (intercept = 2.564 × 10⁻⁶, P = 0.949), and MR-PRESSO did not detect outliers (Supplementary Tables 6–8).
Based on 374 SNPs for trunk fat percentage, a causal effect of this parameter on iron deficiency anemia was found (IVW: OR = 1.003, 95% CI: 1.001–1.005, P = 0.001; F = 25.704; Table 2; Supplementary Tables 5, 9), and there was no heterogeneity in MR-Egger and inverse variance-weighted analyses (MR-Egger: Q statistics = 406.942, P = 0.103; IVW: Q statistics = 407.007, P = 0.109). MR-Egger regression did not detect horizontal pleiotropy (intercept: = 1.170 × 10⁻⁵, P = 0.807), and MR-PRESSO did not detect outliers (Supplementary Tables 6–8).
Based on 382 SNPs for body fat percentage, a causal effect of this parameter on iron deficiency anemia was found (IVW: OR = 1.004, 95% CI: 1.002-1.006, P < 0.001; F = 26.946; Table 2; Supplementary Tables 5, 9). No evidence of heterogeneity, horizontal pleiotropy or outliers was found (Supplementary Tables 6–8). The scatter, funnel and forest plots for trunk fat mass, whole-body fat mass, trunk fat percentage and body fat percentage were also similar to those for body mass index (Figures 2C–F, 3C–F; Supplementary Figures 3C–F).
In contrast to the other six anthropometric traits, no causal effect of hip circumference on iron deficiency anemia was detected based on 405 SNPs (IVW: OR = 1.001, 95% CI: 1.000–1.003, P = 0.088; F = 24.765; Table 2; Supplementary Tables 5, 9). These results did not reflect heterogeneity, horizontal pleiotropy or outliers (intercept = 3.480 × 10⁻⁵, P = 0.402; Supplementary Tables 6–8).
Discussion
Using a genetic approach, this study provides evidence that obesity can cause iron deficiency anemia, based on causal relationships between this type of anemia and six well-established anthropometric traits related to obesity: body mass index (IVW: OR = 1.003, 95% CI: 1.001–1.004, P < 0.001), waist circumference (IVW: OR = 1.003, 95% CI: 1.002–1.005, P < 0.001), trunk fat mass (IVW: OR = 1.003, 95% CI: 1.002–1.005, P < 0.001), body fat mass (IVW: OR = 1.003, 95% CI: 1.001–1.005, P < 0.001), trunk fat percentage (IVW: OR = 1.003, 95% CI: 1.001–1.005, P = 0.001) and body fat percentage (IVW: OR = 1.004, 95% CI: 1.002–1.006, P < 0.001). These results were obtained in the absence of horizontal pleiotropy and outliers.
Our findings are consistent with numerous observational studies in various countries that reported associations between obesity and iron deficiency anemia (7–13). However, some studies have reported no significant association (14, 15), while at least one study has linked obesity with lower risk of iron deficiency anemia (17). We suggest that our finding of a causal link may be more reliable than findings from observational studies because MR analysis is less vulnerable to confounding or reverse causation. In addition, we were careful to correct for horizontal pleiotropy, in which the SNPs in the analysis might affect risk of iron deficiency anemia via pathways unrelated to obesity (31, 32). The consistency of our estimates from different analytical methods provides strong support for obesity as a cause of iron deficiency anemia.
Our study justifies future research to clarify how obesity may trigger this condition (17). One possibility is that the greater blood volume in obese individuals increases their iron requirement (33), which cannot be met because the diet is inadequate (7), less iron is bound to myoglobin in muscles due to low physical activity (34), genetic risk factors exist (12), and hypermetabolic medications as well as chronic inflammation reduce the level of iron available to the blood. Obesity does not appear to cause iron deficiency anemia by impairing gastrointestinal absorption (13). In fact, obese mice in one study absorbed and retained approximately twice as much iron as lean mice (33), which may indicate an adaptive response to the increase in blood volume.
Adipose tissue releases various proinflammatory cytokines called adipokines, which have been linked to obesity-related comorbidities (35). Obesity is characterized by mild chronic inflammation, which leads to the release of proinflammatory cytokines such as interleukin-6 and tumor necrosis factor-α. About a third of the circulating IL-6 is released from fat tissue (36), which stimulates the production of hepcidin through STAT3 (37). The adipokine hepcidin reduces iron output from macrophages, hepatocytes, and intestinal cells (38, 39), leading to iron sequestration within macrophages in the spleen and liver and reducing iron uptake by other cells and tissues. High levels of hepcidin have been found in obese individuals who are deficient in iron, which suggests that the iron deficiency observed in obese people may be related to mechanisms associated with hepcidin (40, 41).
Limitations
Our findings should be interpreted with caution in light of several limitations. First, nearly all our data came from European populations, reflecting the Caucasian bias in genomic research on obesity and iron deficiency anemia. Our results should be verified and extended in other populations. Second, we cannot exclude that our analyses were confounded by intermediation effects. Third, we did not perform subgroup analyses according to sex or geographic area. These and other potential effect modifiers should be considered in future work.
Conclusions
This two-sample MR study provides evidence of a potential causal association between obesity and iron deficiency anemia, which was robust to different analyses and rigorous pleiotropy testing. Among these anthropometric traits of obesity, people with a high body fat percentage may have a greater probability of developing iron deficiency anemia. This study can guide people to carry out scientific health management by reducing body fat percentage. Since dieting without exercise only loses muscle, not fat, people should lose weight through diet and exercise. In addition, increasing iron-rich foods is beneficial for people with iron deficiency anemia, regardless of weight. Further research should identify the molecules and pathways through which obesity can trigger iron deficiency anemia.
Data availability statement
The original contributions presented in the study are included in the article/Supplementary material, further inquiries can be directed to the corresponding author.
Ethics statement
Ethical review and approval was not required for the study on human participants in accordance with the local legislation and institutional requirements. Written informed consent for participation was not required for this study in accordance with the national legislation and the institutional requirements.
Author contributions
TW and GL designed this study and drafted the manuscript. ML, JX, XL, DS, ZC, QG, YW, CW, GX, TL, RW, and JZ collected and analyzed the data. YY and MY revised the manuscript. All authors have read and approved the final manuscript.
Funding
This study was supported by the Leading Health Talents of Zhejiang Province, Zhejiang Health Office No.18 (2020) and the National Clinical Key Specialty Construction Project of China 2021 (2021-LCZDZK-01).
Conflict of interest
The authors declare that the research was conducted in the absence of any commercial or financial relationships that could be construed as a potential conflict of interest.
Publisher's note
All claims expressed in this article are solely those of the authors and do not necessarily represent those of their affiliated organizations, or those of the publisher, the editors and the reviewers. Any product that may be evaluated in this article, or claim that may be made by its manufacturer, is not guaranteed or endorsed by the publisher.
Supplementary material
The Supplementary Material for this article can be found online at: https://www.frontiersin.org/articles/10.3389/fpubh.2023.1188246/full#supplementary-material
References
1. Kakinami L, Henderson M, Delvin EE, Levy E, O'Loughlin J, Lambert M, et al. Association between different growth curve definitions of overweight and obesity and cardiometabolic risk in children. CMAJ. (2012) 184:E539–50. doi: 10.1503/cmaj.110797
2. Myint PK, Kwok CS, Luben RN, Wareham NJ, Khaw K-T. Body fat percentage, body mass index and waist-to-hip ratio as predictors of mortality and cardiovascular disease. Heart. (2014) 100:1613–9. doi: 10.1136/heartjnl-2014-305816
3. Noto H, Goto A, Tsujimoto T, Osame K, Noda M. Latest insights into the risk of cancer in diabetes. J Diabetes Investig. (2013) 4:225–32. doi: 10.1111/jdi.12068
4. Zhao L, Zhang X, Shen Y, Fang X, Wang Y, Wang F. Obesity and iron deficiency: a quantitative meta-analysis. Obes Rev. (2015) 16:1081–93. doi: 10.1111/obr.12323
5. Pasricha SR, Tye-Din J, Muckenthaler MU, Swinkels DW. Iron deficiency. Lancet. (2021) 397:233–48. doi: 10.1016/S0140-6736(20)32594-0
6. GBD 2016 Disease and Injury Incidence and Prevalence Collaborators. Global, regional, and national incidence, prevalence, and years lived with disability for 328 diseases and injuries for 195 countries, 1990-2016: a systematic analysis for the Global Burden of Disease Study 2016. Lancet. (2017) 390:1211–59. doi: 10.1016/S0140-6736(17)32154-2
7. Pinhas-Hamiel O, Newfield RS, Koren I, Agmon A, Lilos P, Phillip M. Greater prevalence of iron deficiency in overweight and obese children and adolescents. Int J Obes Relat Metab Disord. (2003) 27:416–8. doi: 10.1038/sj.ijo.0802224
8. Kaner G, Pekcan G, Pamuk G, Pamuk BÖ, Amoutzopoulos B. Is iron deficiency related with increased body weight? a cross-sectional study. Prog Nutr. (2016) 18:102–10.
9. Chang J-S, Chen Y-C, Owaga E, Palupi KC, Pan W-H, Bai C-H. Interactive effects of dietary fat/carbohydrate ratio and body mass index on iron deficiency anemia among Taiwanese women. Nutrients. (2014) 6:3929–41. doi: 10.3390/nu6093929
10. Huang Y-F, Tok T-S, Lu C-L, Ko H-C, Chen M-Y, Chen SC-C. Relationship between being overweight and iron deficiency in adolescents. Pediatr Neonatol. (2015) 56:386–92. doi: 10.1016/j.pedneo.2015.02.003
11. Ali NB, Dibley MJ, Islam S, Rahman MM, Raihana S, Bhuiyan SET, et al. Overweight and obesity among urban women with iron deficiency anaemia in Bangladesh. Matern Child Nutr. (2021) 17:e13102. doi: 10.1111/mcn.13102
12. Nead KG, Halterman JS, Kaczorowski JM, Auinger P, Weitzman M. Overweight children and adolescents: a risk group for iron deficiency. Pediatrics. (2004) 114:104–8. doi: 10.1542/peds.114.1.104
13. Menzie CM, Yanoff LB, Denkinger BI, McHugh T, Sebring NG, Calis KA, et al. Obesity-related hypoferremia is not explained by differences in reported intake of heme and nonheme iron or intake of dietary factors that can affect iron absorption. J Am Diet Assoc. (2008) 108:145–8. doi: 10.1016/j.jada.2007.10.034
14. Rad HA, Sefidgar SAA, Tamadoni A, Sedaghat S, Bakouei F, Bijani A, et al. Obesity and iron-deficiency anemia in women of reproductive age in northern Iran. J Educ Health Promot. (2019) 8:115. doi: 10.4103/jehp.jehp_371_18
15. Laillou A, Yakes E, Le TH, Wieringa FT, Le BM, Moench-Pfanner R, et al. Intra-individual double burden of overweight and micronutrient deficiencies among Vietnamese women. PLoS ONE. (2014) 9:e110499. doi: 10.1371/journal.pone.0110499
16. Karl JP, Lieberman HR, Cable SJ, Williams KW, Glickman EL, Young AJ, et al. Poor iron status is not associated with overweight or overfat in non-obese pre-menopausal women. J Am Coll Nutr. (2009) 28:37–42. doi: 10.1080/07315724.2009.10719759
17. Kordas K, Centeno ZYF, Pachón H, Soto AZJ. Being overweight or obese is associated with lower prevalence of anemia among Colombian women of reproductive age. J Nutr. (2013) 143:175–81. doi: 10.3945/jn.112.167767
18. Smith GD, Ebrahim S. 'Mendelian randomization': can genetic epidemiology contribute to understanding environmental determinants of disease? Int J Epidemiol. (2003) 32:1–22. doi: 10.1093/ije/dyg070
19. Davey Smith G. Use of genetic markers and gene-diet interactions for interrogating population-level causal influences of diet on health. Genes Nutr. (2011) 6:27–43. doi: 10.1007/s12263-010-0181-y
20. Burgess S, Butterworth A, Thompson S G. Mendelian randomization analysis with multiple genetic variants using summarized data. Genet Epidemiol. (2013) 37:658–65. doi: 10.1002/gepi.21758
21. Boef AG, Dekkers OM, le Cessie S. Mendelian randomization studies: a review of the approaches used and the quality of reporting. Int J Epidemiol. (2015) 44:496–511. doi: 10.1093/ije/dyv071
22. Marini S, Merino J, Montgomery BE, Malik R, Sudlow CL, Dichgans M, et al. Mendelian randomization study of obesity and cerebrovascular disease. Ann Neurol. (2020) 87:516–24. doi: 10.1002/ana.25686
23. Kim MS, Kim WJ, Khera AV, Kim JY, Yon DK, Lee SW, et al. Association between adiposity and cardiovascular outcomes: an umbrella review and meta-analysis of observational and Mendelian randomization studies. Eur Heart J. (2021) 42:3388–403. doi: 10.1093/eurheartj/ehab454
24. Yengo L, Sidorenko J, Kemper KE, Zheng Z, Wood AR, Weedon MN, et al. Meta-analysis of genome-wide association studies for height and body mass index in ~700000 individuals of European ancestry. Hum Mol Genet. (2018) 27:3641–9. doi: 10.1093/hmg/ddy271
25. Burgess S, Bowden J, Fall T, Ingelsson E, Thompson SG. Sensitivity analyses for robust causal inference from mendelian randomization analyses with multiple genetic variants. Epidemiology. (2017) 28:30–42. doi: 10.1097/EDE.0000000000000559
26. Bowden J, Davey Smith G, Burgess S. Mendelian randomization with invalid instruments: effect estimation and bias detection through Egger regression. Int J Epidemiol. (2015) 44:512–25. doi: 10.1093/ije/dyv080
27. Bowden J, Smith GD, Haycock PC, Burgess S. Consistent estimation in mendelian randomization with some invalid instruments using a weighted median estimator. Genet Epidemiol. (2016) 40:304–14. doi: 10.1002/gepi.21965
28. Hartwig FP, Davey Smith G, Bowden J. Robust inference in summary data Mendelian randomization via the zero modal pleiotropy assumption. Int J Epidemiol. (2017) 46:1985–98. doi: 10.1093/ije/dyx102
29. Ong JS, MacGregor S. Implementing MR-PRESSO and GCTA-GSMR for pleiotropy assessment in Mendelian randomization studies from a practitioner's perspective. Genet Epidemiol. (2019) 43:609–16. doi: 10.1002/gepi.22207
30. Haycock PC, Burgess S, Wade KH, Bowden J, Relton C, Smith GD, et al. Best (but oft-forgotten) practices: the design, analysis, and interpretation of Mendelian randomization studies. Am J Clin Nutr. (2016) 103:965–78. doi: 10.3945/ajcn.115.118216
31. Davies NM, Holmes MV, Davey Smith G. Reading Mendelian randomisation studies: a guide, glossary, and checklist for clinicians. BMJ. (2018) 362:k601. doi: 10.1136/bmj.k601
32. Emdin CA, Khera AV, Kathiresan S. Mendelian randomization. JAMA. (2017) 318:1925–6. doi: 10.1001/jama.2017.17219
33. Failla ML, Kennedy ML, Chen ML. Iron metabolism in genetically obese (ob/ob) mice. J Nutr. (1988) 118:46–51. doi: 10.1093/jn/118.1.46
34. Seltzer CC, Mayer J. Serum iron and iron-binding capacity in adolescents. II. comparison of obese and nonobese subjects. Am J Clin Nutr. (1963) 13:354–61. doi: 10.1093/ajcn/13.6.354
35. Nathan C. Epidemic inflammation: pondering obesity. Mol Med. (2008) 14:485–92. doi: 10.2119/2008-00038.Nathan
36. Coimbra S, Catarino C, Santos-Silva A. The role of adipocytes in the modulation of iron metabolism in obesity. Obes Rev. (2013) 14:771–9. doi: 10.1111/obr.12057
37. Wrighting D M, Andrews N C. Interleukin-6 induces hepcidin expression through STAT3. Blood. (2006) 108:3204–9. doi: 10.1182/blood-2006-06-027631
38. Nemeth E, Ganz T. Regulation of iron metabolism by hepcidin. Annu Rev Nutr. (2006) 26:323–42. doi: 10.1146/annurev.nutr.26.061505.111303
39. Nemeth E, Ganz T. The role of hepcidin in iron metabolism. Acta Haematol. (2009) 122:78–86. doi: 10.1159/000243791
40. Aeberli I, Hurrell RF, Zimmermann MB. Overweight children have higher circulating hepcidin concentrations and lower iron status but have dietary iron intakes and bioavailability comparable with normal weight children. Int J Obes. (2005) 33:1111–7. doi: 10.1038/ijo.2009.146
Keywords: obesity, iron deficiency anemia, Mendelian randomization, causal relationship, two-sample
Citation: Wang T, Gao Q, Yao Y, Luo G, Lv T, Xu G, Liu M, Xu J, Li X, Sun D, Cheng Z, Wang Y, Wu C, Wang R, Zou J and Yan M (2023) Causal relationship between obesity and iron deficiency anemia: a two-sample Mendelian randomization study. Front. Public Health 11:1188246. doi: 10.3389/fpubh.2023.1188246
Received: 17 March 2023; Accepted: 31 May 2023;
Published: 16 June 2023.
Edited by:
Jennifer K. Frediani, Emory University, United StatesReviewed by:
Mohammad Safiqul Islam, Noakhali Science and Technology University, BangladeshHélène Delisle, Montreal University, Canada
Adrianna Westbrook, Emory University, United States
Copyright © 2023 Wang, Gao, Yao, Luo, Lv, Xu, Liu, Xu, Li, Sun, Cheng, Wang, Wu, Wang, Zou and Yan. This is an open-access article distributed under the terms of the Creative Commons Attribution License (CC BY). The use, distribution or reproduction in other forums is permitted, provided the original author(s) and the copyright owner(s) are credited and that the original publication in this journal is cited, in accordance with accepted academic practice. No use, distribution or reproduction is permitted which does not comply with these terms.
*Correspondence: Min Yan, enJ5YW5taW5Aemp1LmVkdS5jbg==
†These authors have contributed equally to this work