 Ayodeji Oluwaseun Ogunleke
 Seyi Olalekan Olawuyi
 Olusegun Jeremiah Ijila
- 1Department of Business, Entrepreneurship and Executive Education, University of Ibadan School of Business, University of Ibadan, Ibadan, Oyo, Nigeria
- 2Department of Agricultural Economics and Extension, University of Fort Hare, Alice, South Africa
Malnutrition and food insecurity remain a significant public health challenge globally, affecting millions of people, particularly in low- and middle-income countries. In Nigeria, the prevalence of malnutrition and food insecurity is high, with a significant burden in the South-West region. Despite several interventions aimed at promoting healthy diets and reducing food insecurity, little is known about the pattern of healthy diets and zero hunger among households, as well as the budget shares on the food items driving these outcomes. Therefore, this study analyzes the pattern of healthy diets and zero hunger among households in South-West Nigeria, using the primary data elicited from 600 rice-consuming households, drawn through a multistage random sampling technique. Descriptive statistics and Linear Approximation to Quadratic Almost Ideal Demand System (LA-QUAIDS) model were used to analyze the dataset. The estimated LA-QUAIDS model was helpful to decipher the relationships that may not be possible to discover using a single-equation model. The finding of this study revealed that rice, especially local (Ofada) rice, is the most consumed food item among the households in the study area with a monthly budget share of 0.195. This is an indication that households spend approximately 19.5% of their monthly food expenditure share on rice consumption. The results also indicated that yam flour (−0.10), cassava-gari (−2.12), and meat (−0.03) are net complements to rice, while the rest of the food items are regarded as net substitutes. The estimated compensated (−1.64) and uncompensated (−1.69) own-price elasticities of local rice, respectively, indicate that local rice variety is price inelastic, and the estimated expenditure elasticity (0.02) suggests that local rice is not a luxury food in the household food basket but a necessity. This study affirms the importance of locally produced foods, especially local rice to the households in the study area. In light of the findings, this study recommends adequate policy aimed at reducing the cost of local food production by boosting domestic production. Apparently, this will technically trigger market price adjustment, as shown in this study, where local rice was estimated to be own-price elastic in nature.
1. Introduction
Healthy diets and zero hunger are critical components of sustainable development and poverty reduction targets. According to the United Nations (UN), healthy diets promote overall health and wellbeing and help to prevent chronic diseases, such as obesity, diabetes, and heart disease (1). Similarly, zero hunger is essential for achieving food security, eliminating malnutrition, and eradicating poverty (1). However, despite the global effort to achieve healthy diets and zero hunger, the prevalence of malnutrition and food insecurity remains high in low- and middle-income countries, including Nigeria (2).
From a global perspective, the food system has been weakening over the years owing to multidimensional shocks and other unexpected events, and this situation has exacerbated the systemic issues that are threatening food security and weakening the resilience of the food system (3). The countries' ranking on the Global Food Security Index (GFSI) reveals that the global food environment is seriously deteriorating. Sadly, Nigeria is among the last four weakest performers and bottom-ranked countries with a very low GFSI of 42 points score in the latest ranking. In sub-Saharan Africa, Nigeria is also among the bottom 10 countries whose food security situation is worse (3). This has also contributed to the awful performance of Nigeria in the latest Global Hunger Index (GHI) ranking, which currently stands at a global hunger index score of 27.3 (4).
In recent times, the progress recorded against hunger has largely been stagnated and even worsened in many nations across the world, especially on the prevalence of undernourishment, which reveals a skyrocketing figure of people who do not have regular access to sufficient calories, with as many as 828 million individuals undernourished (4, 5). From a regional perspective, vulnerable populations in sub-Saharan Africa and some other parts of Africa are the most at risk of increased undernourishment because of the persistent unrest and conflicts, as well as other underlying factors in this region, and the proportion of people facing hunger in Congo, Ethiopia, and Nigeria, in particular, is continually increasing (6). Apparently, this threatens the progress toward the ambitious goal of ensuring access to adequate food and healthy diets for all.
In the real sense of it, more than half of the world's population cannot afford a healthy diet (7). In Nigeria, the cost of a healthy diet in Nigeria is approximately $4.1 per person per day, and given this metric, in Nigeria, the percentage of the population who are unable to afford a healthy diet is 95.9% (7). Globally, in approximately 52 countries, where most are residents of Africa, over half of the estimated inhabitants cannot afford a healthy diet (7). While hunger is a global phenomenon, it is particularly acute in African countries. In many countries across sub-Saharan Africa, more than 90% of the population cannot afford a healthy diet. Sub-Saharan Africa is particularly susceptible to extreme climate events and the resulting volatility in food prices is due to the disruption in the supply chain (7–10). This has led to serious inflationary effects in the prices of food items across many African countries, including Nigeria. This evidence suggests that the likelihood of having more people who are unable to afford healthy diets is very high.
Malnutrition and food insecurity are significant public health challenges in Nigeria, and the prevalence of undernutrition is high, with 37% of children younger than 5 years stunted, and 17% wasted (11). Similarly, the prevalence of overweight and obesity is increasing, with 20.8% of adults overweight and 8.5% obese (12). Furthermore, the Food and Agriculture Organization (FAO) estimates that 22.5% of the Nigerian population is food insecure, with more than 90 million people experiencing moderate to severe levels of food insecurity (2). Notable studies have also shown that unhealthy diets and food insecurity are associated with poverty, low education, and poor access to healthy foods (13, 14). The availability and accessibility of healthy foods have been identified as critical determinants of healthy diets and zero hunger (15, 16). However, few notable studies (17–20) have examined the pattern of healthy diets and zero hunger among households in Nigeria.
South-West Nigeria is one of the regions in Nigeria with a high prevalence of malnutrition and food insecurity (2). Malnutrition affects both children and adults, with the highest prevalence among the rural population and low-income households (11). Similarly, food insecurity is prevalent in the region, with many households experiencing inadequate access to food and poor dietary diversity (2). The pattern of healthy diets and zero hunger among households in Africa and, in particular, Nigeria is influenced by several factors. These factors include sociodemographic characteristics, such as income, education, and occupation, as well as environmental and structural factors such as the availability and accessibility of healthy foods, food prices, and food systems (15, 18, 20–22). For instance, households with higher income and education levels are more likely to consume a healthy diet than those with lower income and education levels (21). Similarly, the availability and accessibility of healthy foods in the local food environment are essential for promoting healthy diets and reducing food insecurity (15).
According to Erhabor and Ojogho (23), as well as (24), rice is a staple food crop consumed by nearly every household, but with the recent development of encouraging local production in the nation, Ofada rice represents a good option to focus on owing to its nutritive value which is essential for a healthy diet (24). In Nigeria, efforts to promote healthy diets and zero hunger have been made through various policies and programs. For example, the National Food and Nutrition Policy was launched in 2016 to promote healthy diets and improve nutrition in the country (25). Similarly, the National Social Safety Net Program was established to provide cash transfers to vulnerable households to improve their access to food (26). Meanwhile, the impact of these policies and programs on the pattern of healthy diets and zero hunger among households in South-West Nigeria is largely unfelt, as a majority of the households are finding it difficult to have a healthy diet. Therefore, this study aims to contribute to the existing knowledge by examining the pattern of healthy diets and zero hunger among households in the region, given the consumption expenditures and budget shares by households on various mixtures of food items.
1.1. Theoretical and empirical approach
This research utilized the Quadratic Almost Ideal Demand System (QUAIDS) framework to analyze the demand for different food groups and identify patterns of healthy diets among households. The theoretical approach is based on the assumption that households allocate their budget to purchase various food groups to maximize their utility subject to budget constraints. The QUAIDS framework allows for a flexible demand system that accounts for non-linearities and heterogeneity in consumer preferences. The study builds on previous research that has applied the QUAIDS framework to examine food demand in various settings. For instance, Chalak and Kallas (27) used the QUAIDS model to investigate the demand for food in Lebanon and found that consumers are responsive to changes in food prices and income. Similarly, Pascual et al. (28) used the QUAIDS approach to analyze the demand for fruits and vegetables in Spain and found that higher income and education levels are associated with a healthier diet.
Empirically, the model which is an extension of the QUAIDS model is a popular econometric technique used to estimate consumer demand for different goods and services. The QUAIDS model has been widely used in empirical studies of consumer demand, particularly in the analysis of food demand and nutrition. It has been used to estimate the price and income elasticities of demand for various food groups and to analyze the effects of food prices on nutrition outcomes. The LA-QUAIDS model assumes that consumers allocate their budget across different goods and services to maximize utility subject to their budget constraint, and this framework is used to derive a set of demand equations, which explain how changes in prices and income affect the quantities of different goods and services that consumers purchase (29, 30). Importantly, the model provides a flexible and robust framework for estimating consumer demand functions for multiple goods while accounting for heterogeneity in consumer preferences.
According to Pollak (31), the general empirical framework for the LA-QUAIDS model can be expressed as follows:
1.1.1. The demand system
According to Pollak (31), the demand system can be expressed as follows:
where Qij represents the quantity of good i that is demanded by the consumer for a given price Pj and income I.
aij represents the constant or intercept term for good i.
bij is the own-price elasticity of demand for good i, which measures how the quantity demanded of good i changes in response to a change in its own price.
ln (Pj) is the natural logarithm of the price of good j.
γj is the income elasticity of demand for good i, which measures how the quantity demanded of good i changes in response to a change in income.
ln (I) is the natural logarithm of the consumer's income.
εij is the error term representing all other factors that affect the demand for good i but are not explicitly included in the model.
1.1.2. The budget constraint
According to Pollak (31), the budget constraint can be expressed as follows:
where
P1, P2, ..., Pn represent the prices of n different goods and services.
Q1, Q2, ..., Qn represent the quantities of n different goods and services.
I represents the consumer's income.
1.1.3. The symmetry restriction
According to Deaton and Muellbauer (29), the symmetry restriction can be expressed as follows:
This assumption implies that the cross-price elasticity of demand between goods i and j is equal to the cross-price elasticity of demand between goods j and i.
1.1.4. The Slutsky symmetry restriction
In line with Pollak (31), the Slutsky symmetry restriction can also be expressed as follows:
This assumption implies that the own-price elasticity of demand for good i with respect to the price of good j is equal to the own-price elasticity of demand for good j with respect to the price of goodi.
1.1.5. The rank condition
In terms of the rank condition, it requires that the matrix of price and income elasticities is full rank (31), suggesting that it has rank n-1 where n is the number of goods and services in the model.
The LA-QUAIDS model is estimated using data on prices, quantities, and income for different goods and services (31). The estimation process involves solving the demand system equations for the unknown parameters using statistical software. Once the parameters are estimated, they can be used to simulate how changes in prices and income affect the quantities of different goods and services that consumers purchase (31). Overall, the LA-QUAIDS model provides a flexible and useful framework for analyzing consumer demand for different goods and services and can be used to inform policy decisions related to pricing, taxation, and income redistribution.
Overall, the theoretical and empirical approach as applied in this study provides a useful framework for understanding the demand for healthy diets among households. By identifying the patterns of demand for different food items, policymakers can develop targeted interventions to promote healthy eating habits and reduce food insecurity.
2. Study area and method of data collection
This study was conducted in the South-West region of Nigeria. The region is one out of six geopolitical zones in the country. The South-West region lies between longitude 20 311 and 60 001 East and latitude 60 211 and 80 371N and has a total land area of approximately 77,818 km2. It shares boundaries in the west, south, east, and north with the Republic of Benin, Gulf of Guinea, Edo and Delta States, and Kwara and Kogi States, respectively. South-West Nigeria's climate is tropical in nature and experiences both rainy and dry seasons. Data were collected with the use of a well-structured questionnaire administered to the representative sample selected for this study. A multistage sampling technique was employed to select the respondents in the study area. The study purposively selected three states, namely, Lagos, Osun, and Ogun because of the predominance of local (Ofada) rice farmers in the areas. The purposive selection was also adopted in the second stage to select two local government areas (LGAs) from each of the selected state. The third stage involved a random selection of two wards, each from the two selected LGAs in each of the states, making it four wards from each selected state based on a lucky-dip approach (24, 32). The final stage used a random proportionate-to-size sampling technique to select 600 respondents (households) from all the chosen LGAs. This was applied because of the population variation that exists across the villages in the selected LGAs. Hence, this represents the representative sample used for the research.
This study collected information on the following commonly consumed food items: rice (Main staples), Maize (Main staples), Yam tuber (Main staples), Yam flour Main staples, Beans (Pulses), Cassava-Gari (Main staples), Plantain (Fruit), Vegetable (Vegetables), Fruits (Fruit), Meat (Meat and fish), Beverages (Condiments), Fats and Oil (Oil). According to World Food Programme (33), the food items are broadly grouped into different food groups, as shown in parentheses beside the food items. This also requires further analysis of attaching weights and measurements if the study is interested in the food consumption score of the sampled households, which is outside the scope of this study. Hence, the main focus of this study was on the budget share analysis of these food items and to mirror the households' pattern of consumption expenditure on the food items using budget share analysis.
3. Data analysis approach and econometrics modeling
3.1. Linear approximated quadratic almost ideal demand system (LA-QUAIDS)
The discourse on the approach to the LA-QUAIDS model was adapted from the study by Diewert (34), Moschini (35), and Matsuda (36). At the stage of linearization estimation of the QUAIDS, “the translog price aggregator term, i.e., f(p) and the Cobb–Douglas price aggregator term, i.e., g(p) will be replaced with a composite variable which does not depend on unknown parameters from the general QUAIDS model (36)”.
Stone's (geometric) price index ln h(p*) represents the widely used composite variable for the approximation of f(p) (29), which is expressed as follows:
Moreover, the price index was usually applied in the linearization of the Cobb–Douglas price aggregator part of the model (34, 36). This is also expressed as follows:
The budget shares and prices, denoted by the superscript zero, are the associated base budget share and base price value. Meanwhile, Diewert (34) suggested the introduction of the “chained principle” which has to do with incorporating the time values (t−1) as the base for time t. With this, equation (4) can be transformed to read:
Given the processes above, one can derive equation (14), showing the linear approximated version of the QUAIDS model, which is the LA-QUAIDS, expressed in the following form:
Differentiating equation (4) with respect to income and price results in the following:
Expenditure elasticity ei is calculated as follows:
Uncompensated price elasticities are calculated as follows:
where ∂ij is the Kronecker delta (∂ij = 1 if i = j and ∂ij = 0 if i≠j). Recovery of the compensated price elasticities was made using the Slutsky derivative expressed in elasticity form as follows:
Expression in equation (10) was used to recover symmetric values of compensated cross-price elasticity estimates:
where w's are budget shares of ith and jth good, and ej.ej are expenditure elasticities of jth and ith goods, respectively.
The pattern of consumption expenditure and the inter-relationships among the 13 food items were captured using the LA-QUAIDS model. In the analyses, expenditure, own-price, and cross-price demand elasticities (both uncompensated and compensated) were all estimated for the food items considered in the study.
4. Results and discussion
The results of expenditure, own-price, and cross-price demand elasticities (both uncompensated and compensated) are presented sequentially.
The result in Table 1 revealed that the households' budget shares on local rice in Lagos, Ogun, and Osun States were 0.11, 0.14, and 0.09, respectively. This implies that 11%, 14%, and 9% of the households' food expenditure were spent on local rice consumption, and from a general perspective of rice consumption (both local and foreign), approximately 19.5%, 23%, and 17.5% of the budgets were expended for the period under consideration. The households' budget share on local rice for the aggregated households of the study is 0.11, which indicates that households spent 11% of their food expenditure on local rice variety and 19.5% of food expenses on both local and foreign rice consumption. However, 19.5% of households' expenditure on both local and foreign rice was found to be below that of the North-West geopolitical zone, and the nation's average was reported to be 28.39% and 30.63%, respectively (37). The highest budget share is associated with rice consumption (19.36%), and the lowest budget share is associated with plantain (1.91%). The budget share of fat and oil stands at the second highest. Households' total expenditure for all of the food items considered for the study is N=79,651,455 ($218,223) for the period under review. This finding lends credence to the growing trend in households' rice consumption preference over other food items and therefore, the central position of rice in households' food basket. The higher proportion of households' expenditure on rice, both local and foreign varieties, agrees with Omonona et al.'s study (38) and Erhabor and Ojogho (23) also established that rice had the highest proportion of households' monthly food expenditure relative to other food items in their study. The implication is that sudden changes in households' food expenditure would affect the households' rice consumption.
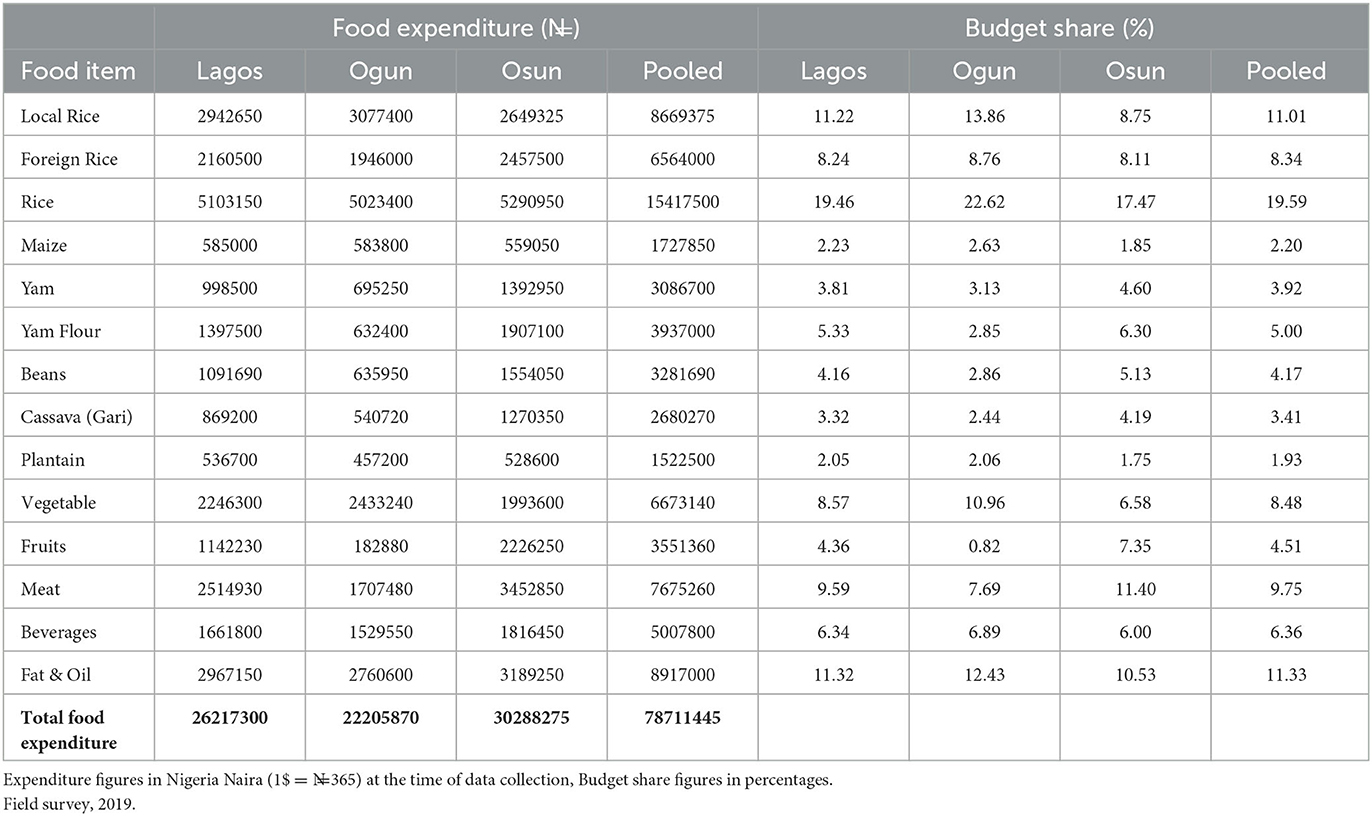
Table 1. Summary statistics: food expenditure and budget share on food items.
Given the observation on the budget share attached to the prevalent food items consumed by households in the study area, one can infer that a large proportion of the budget was expended on the main staple food items, suggesting that there was no significant diversity in the food item matrix of the household. Evidently, this can have implications on the health outcomes of the household members and ultimately lead to a serious healthy diet crisis.
4.1. LA-QUAIDS elasticity estimates
Given the estimates of the parameters, this study calculated the expenditure, uncompensated and compensated own-price, and the cross-price elasticities for local rice and other food items consumed by households. It is important to reiterate that the elasticity expression shown in equations (18, 19) was applied. The “uncompensated cross-price elasticities indicate the gross substitution and gross complementary effects while its compensated counterpart distinguishes between net substitutes and net complements”. In addition, the expenditure elasticity shows the percentile increase or decrease (change) in the consumption of a food item as a result of a percentile increase or decrease in the expenditure of the other food items included in the demand equation.
Tables 2, 3 show the calculated uncompensated and compensated own price, cross-price, and expenditure elasticities for each of the food items. The expenditure elasticity of rice as presented in Table 2 indicates that local rice is a normal good as shown by the positive sign of its expenditure elasticity and is expenditure inelastic as its expenditure elasticity lies between one and zero. This suggests that local rice is not a luxury in the households' food basket but a necessity, and a unit increase in the households' income would be proportionately less than the increasing demand for local rice by a magnitude of 0.02. This finding agrees with Onyeneke et al. (39) and Gyimah-Brempong and Kuku-Shittu (40) that local rice is a necessity and not luxury food but disagrees with Omonona et al. (38) who posited that rice is an inferior good, as indicated by the negative sign of its expenditure elasticity (−5.2837), and this is an expenditure elastic food item. This could be because what was obtainable in terms of the nation's economy at the time of their research is quite different from the present economic reality. In Nigeria, rice is perhaps the most consumed food item, and this can be established based on the amount spent ($1.0 billion) yearly on the import of this food item (32). The status of local rice, being a necessity in the households' food basket, is a pointer to the growing consumer preference in Nigeria. The calculated expenditure elasticities also revealed that all the food items were expenditure inelastic, meaning that the food items are not luxury goods but necessities.
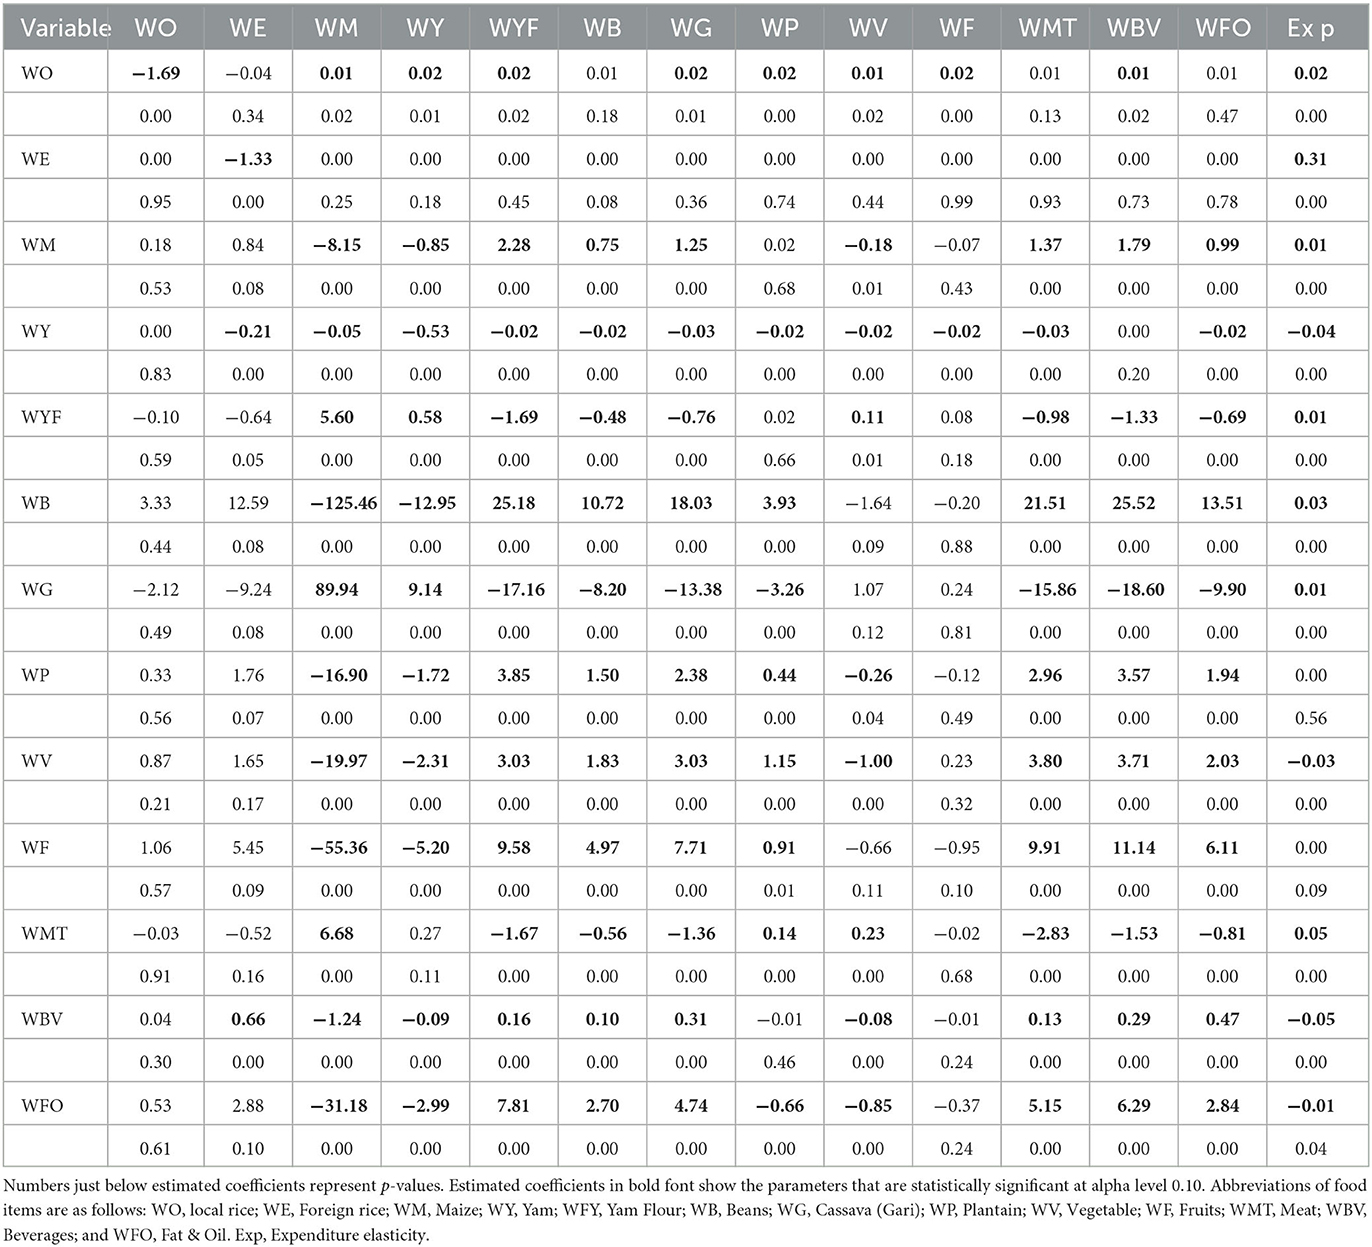
Table 2. Expenditure elasticities and uncompensated own-price and cross-price demand elasticities estimated through LA-QUAIDS.
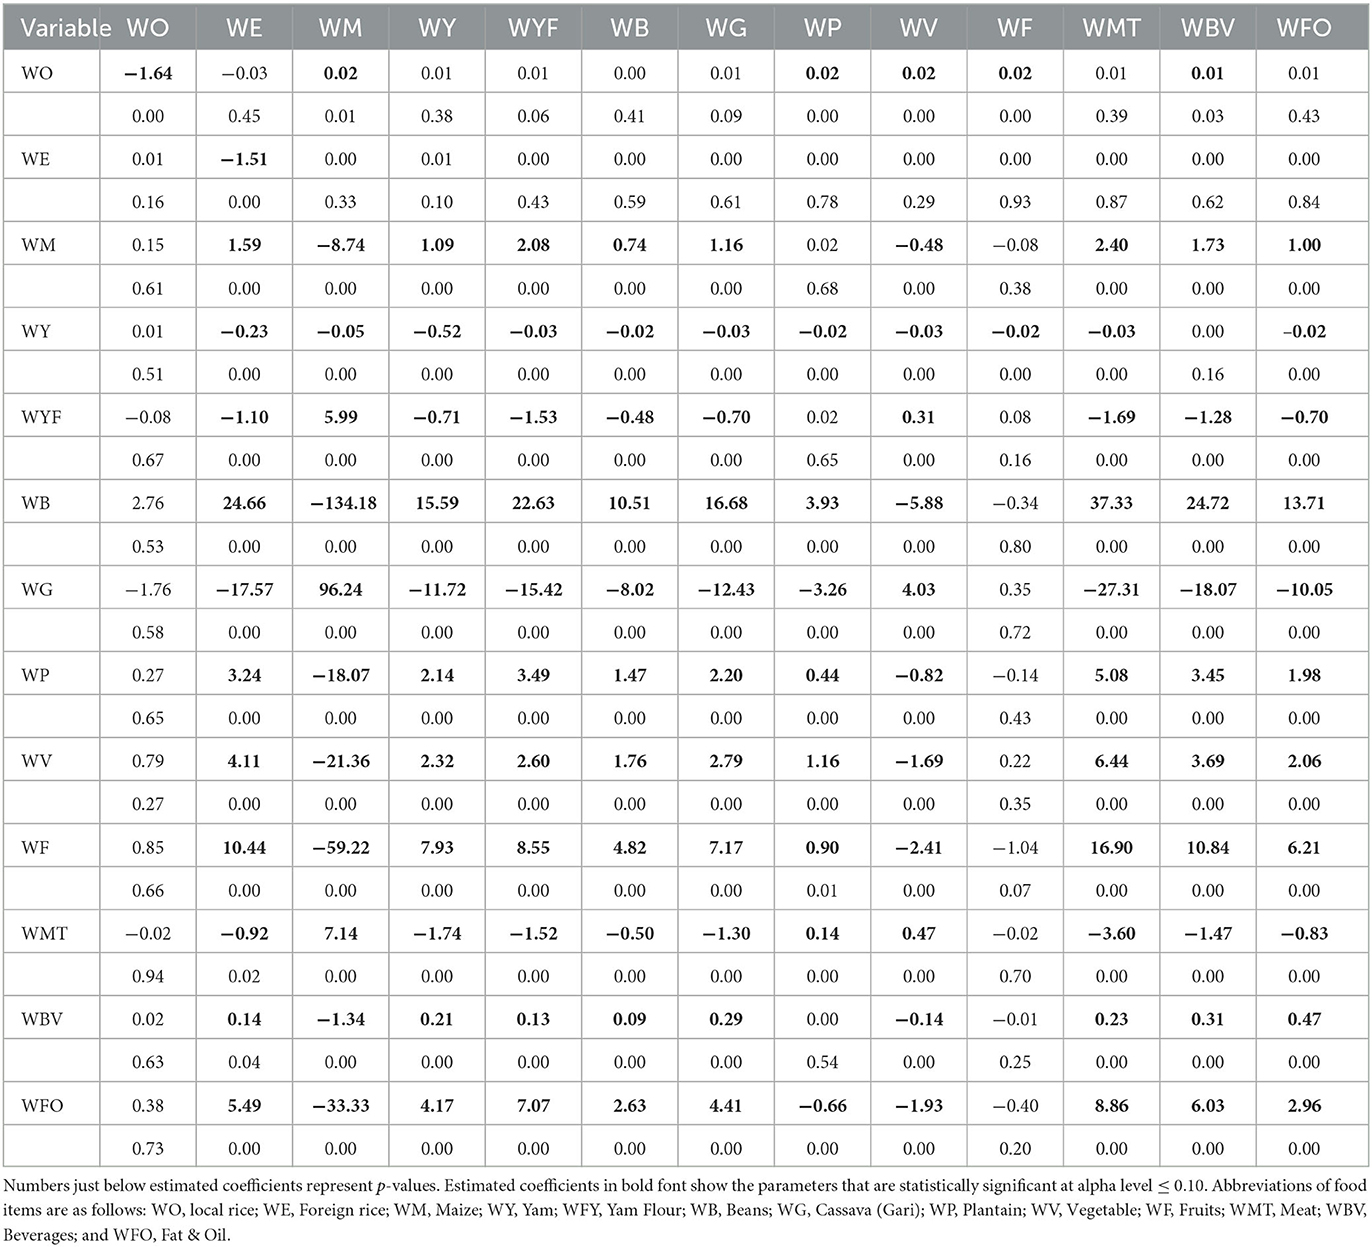
Table 3. Compensated own-price and cross-price demand elasticities estimated through LA-QUAIDS.
Uncompensated and compensated own-price elasticities of demand for 9 (9) out of 13 food items are negative and are statistically significant. The values of compensated and uncompensated own-price elasticities for local rice are −1.64 and −1.69, respectively, which is an indication that the food is price-sensitive (41). Here, in line with the demand theory, consumers are likely to respond to any changes in the price. The absolute value of the own-price elasticity of local rice is higher than the absolute values of its cross-price elasticity. This implies that the demand for local rice is more responsive to its price than the prices of other food items. This result is in line with the findings of Makama et al. (42) and Kuku-Shittu and Pradesha (43) that local rice uncompensated and compensated own-price elasticities are negative for rural and urban consumers in Nigeria. The estimated compensated own-price and cross-price elasticities of local rice, as shown in Table 3, are lower than its uncompensated own-price and cross-price elasticities. This implies that the substitution effect surpasses the income effect. This finding supports Erhabor and Ojogho (23) who found that the uncompensated elasticities of rice were higher than the compensated elasticities of rice. On the other hand, the compensated own-price elasticity of local rice was similar to the uncompensated own-price elasticity in being price elastic and negative. This suggests that a unit increase in the price of local rice would be more than a proportionate decrease in demand for local rice by a magnitude of 1.64. This agrees with the findings of Hoang (44) and Obalola et al. (45) who noted that the demand for rice with respect to price is relatively elastic compared to other foods.
However, Gari is the most price-sensitive out of all the food items, having a compensated own-price elasticity of demand of −12.43. Even though there is a small budget share associated with Gari (~3%) compared to other food items, it is the most expensive out of the 13 food items considered in this study. Given this high price of Gari, consumers may be more sensitive to changes in its price. The compensated own–price elasticities of demand for foreign rice, maize, yam flour, beans, vegetable, fruits, meat, and fat and oil are −1.51, −8.74, −1.53, 10.51, −1.69, −1.04, −3.60, and 2.97, respectively, indicating elastic demands. Yam has the most inelastic compensated own–price elasticity of demand, which is −0.06. This finding is similar to the study by Gyimah–Brempong and Kuku–Shittu (40) that most food items are complements for rice consumption among households in Nigeria. In addition, Demont et al. (46) who carried out research on rice demand in Senegal found that local rice and imported rice are characterized by low substitutability and that compensated cross–price elasticity estimates between rice and other food commodities are small and mostly insignificant.
Moreover, 3 out of 13 compensated cross–price elasticities have negative signs with local rice (Yam flour = −0.10, Gari = −2.12, and meat = −0.03), indicating net complements to local rice consumption. Gari has the highest complimentary value with local rice, followed by yam flour, then meat, while the remaining 10 food items compensated cross-price elasticities are indicative of net substitutes. In total, 66 out of 156 (42%) compensated cross-price elasticities have negative signs indicating net complements, and 58% of compensated cross-price elasticities are indicative of net substitutes.
4.2. Limitations of the study and areas for further research
This research was limited to the analysis of the households' budget share on the food items commonly consumed in the study area. While we acknowledged that each of the food items identified in the study area also belongs to one of the food groups or the other, as highlighted in WFP (2008), further study and analysis can be carried out in this aspect by conducting an in-depth food security analysis using the recommended weights and measurements on the food items, to estimate the households' food consumption score.
5. Contribution of the study
This study underscores the importance of having access to good-quality and healthy foods by people to cater to their dietary needs, given various mixes of food items required for adequate human functionality in society. The research probed on the consumption-expenditure pattern and households' budget shares on various food items commonly consumed by people through the estimation of households' price and demand elasticity which only a few studies have dealt with in the past using other study locations, different from this study area. Besides, most of this study used the QUAIDS model, while this study applied an extended version of the model known as the LA-QUAIDS model. This is very important to guide the policy maker in the design and implementation of necessary policy actions that can encourage domestic production, increase food distribution and supply, and ultimately reduce the market prices of locally produced food items; all aiming at self-sufficiency in local food production.
6. Conclusion
This study used a linear approximated QUAIDS model to analyze households' demand for local rice in the South-West region of Nigeria. The findings from this study reveal that households in Nigeria consume local rice to a reasonable extent and that local rice does not represent a luxury good based on the calculated expenditure elasticities because they are all expenditure inelastic. Uncompensated and compensated own-price elasticities of demand for 9 (9) out of 13 food items are negative, which is consistent with demand theory, and they are statistically significant. The value of compensated and uncompensated own-price elasticities for local rice was found to be −1.64 and −1.69, respectively, which suggests that local rice is price-sensitive. That is, consumers are likely to be affected by any changes in the price of local rice. In light of the findings of this study, it is recommended that adequate policy aimed at boosting local rice production and increasing its supply should be pursued. This could invariably connote a price-reduction strategy, by default. Suffice to say that increased supply will force down the price of local rice because the food crop was shown to be own-price elastic.
Data availability statement
The raw data supporting the conclusions of this article will be made available by the authors, without undue reservation.
Ethics statement
The studies involving human participants were reviewed and approved by University Research Ethics Committee. The patients/participants provided their written informed consent to participate in this study.
Author contributions
All authors listed have made a substantial, direct, and intellectual contribution to the work and approved it for publication.
Conflict of interest
The authors declare that the research was conducted in the absence of any commercial or financial relationships that could be construed as a potential conflict of interest.
Publisher's note
All claims expressed in this article are solely those of the authors and do not necessarily represent those of their affiliated organizations, or those of the publisher, the editors and the reviewers. Any product that may be evaluated in this article, or claim that may be made by its manufacturer, is not guaranteed or endorsed by the publisher.
References
1. United Nations (UN). Sustainable Development Goals: Goal 3: Ensure healthy lives promote well-being for all at all ages. (2019). Available online at: https://www.un.org/sustainabledevelopment/health/
3. Economist Impact Global Food Security Index 2022: Country Profiles. (2022). Available online at: https://repository.gheli.harvard.edu/repository/12829/
4. Resnick D, von Grebmer R, Bernstein K, Wiemers J, Reiner, Marilena B, et al. Global Hunger Index: Food Systems Transformation and Local Governance. Bonn, Germany; and Dublin, Ireland: Welthungerhilfe; and Concern Worldwide. Available online at: https://www.ifpri.org/publication/2022-global-hunger-index-food-systems-transformation-and-local-governance
5. Abdulai A, Aubert D. A Cross-section analysis of household demand for food and nutrients in Tanzania. Agricultural Econ. (2004) 31:67–79. doi: 10.1111/j.1574-0862.2004.tb00222.x
6. FAO IFAD UNICEF WFP and WHO (2022). “The State of Food Security and Nutrition in the World 2022,” in Repurposing food and agricultural policies to make healthy diets more affordable. Rome: FAO.
7. World Economic Forum (WEF). Over Half the Global Population Can't Afford a Healthy Diet. (2022). Available online at: https://www.weforum.org/agenda/2022/10/healthy-diet-food-agriculture-africa-income/
8. Adesina AA. “Unlocking the potential of agriculture in Sub-Saharan Africa: Nigeria's transformation agenda for agriculture. Federal Ministry of Rural Development and Agriculture, Abuja,” in Growing food: new places, new technologies. Washington, DC: Johns Hopkins University School of Advanced International Studies on April 17th 2012. (2012).
9. Ayinde OE Ojehomon VET Daramola FS and Falaki AA. Evaluation of the effects of climate change on rice production in Niger State, Nigeria. Ethiopian J Environ Stud Manag. (2013) 6:763–73. doi: 10.4314/ejesm.v6i6.7S
10. Mishra AK, El-Osta HS. Estimating demand elasticities for food commodities: A review. Applied Economic Perspectives and Policy. (2006) 28:446–60.
11. United Nations International Children's Emergency Fund (UNICEF). The State of the World's Children 2021: On my mind - Promoting, protecting caring for children's mental health. (2021). Available online at: https://www.unicef.org/reports/state-of-worlds-children-2021 (accessed May 19, 2023).
12. World Health Organization. Overweight and Obesity. Geneva: World Health Organization (2018). Available from: https://www.who.int/news-room/fact-sheets/detail/obesity-and-overweight
13. Lachat C, Hawwash D, Ocké MC, Berg C, Forsum E, Hörnell A, et al. Strengthening the reporting of observational studies in epidemiology-nutritional epidemiology (STROBE-nut): An extension of the STROBE statement. PLoS Med. (2019) 16:e1002967. doi: 10.1186/s12263-019-0655-5
14. Sharkey JR. Measuring potential access to food stores and food-service places in rural areas in the U.S. Am J Prev Med. (2009) 54:e35–e42. doi: 10.1016/j.amepre.2009.01.004
15. Ruel MT Alderman H Maternal and Child Nutrition Study Group Nutrition-sensitive interventions and programmes: how can they help to accelerate progress in improving maternal and child nutrition? Lancet. (2013) 391:65–86. doi: 10.1016/S0140-6736(13)60843-0
16. Food and Agriculture Organization. (FAO). The State of Food Security and Nutrition in the World. Rome: FAO (2018).
17. Akinyele Isaac Ȯ. Ensuring Food Nutrition Security in Rural Nigeria: An Assessment of the Challenges, Information Needs, Analytical Capacity. NSSP Working Paper 7. Abuja: International Food Policy Research Institute (IFPRI) (2009). Available online at: http://ebrary.ifpri.org/cdm/ref/collection/p15738coll2/id/22824
18. Obayelu OA, Osho FR. How diverse are the diets of low-income urban households in Nigeria. J Agricult Food Res. (2020) 2:100018. doi: 10.1016/j.jafr.2019.100018
19. Morgan A, Fanzo J. Nutrition transition and climate risks in nigeria: moving towards food systems policy coherence. Curr EnvironmHealth Reports. (2020) 7:392–403. doi: 10.1007/s40572-020-00292-3
20. Otekunrin A. Investigating food insecurity, health and environmental-related factors and agricultural commercialization in Southwestern Nigeria: evidence from smallholder farming households. Environ Sci Pollut Res. (2022) 29:51469–88. doi: 10.1007/s11356-022-19544-w
21. Gelli A, Headey D, Becquey E. Improving diets and nutrition through an integrated poultry value chain and social and behavior change program in Burkina Faso: Protocol for a cluster randomized controlled trial. BMC Public Health. (2017) 21:1–13. doi: 10.1186/s13063-017-2156-4
22. Abbass IM. Trends of rural-urban migration in Nigeria. European Scientific J. (2012) 8:97−125. doi: 10.19044/esj.2012.v8n3p%25p
23. Erhabor POI, Ojogho O. Demand analysis for rice in Nigeria. J Food Technol. (2011) 9:66–74. doi: 10.3923/jftech.2011.66.74
24. Ogunleke AO, Baiyegunhi LJS. Effect of households' dietary knowledge on local (Ofada) rice consumption in South-West Nigeria. J Ethnic Foods. (2019) 6:1–11. doi: 10.1186/s42779-019-0023-5
25. Federal Ministry of Health National Guideline for Community-Based Management of Acute Malnutrition (CMAM) in Nigeria. Abuja, Nigeria: Federal Ministry of Health. (2016). Available online at: https://www.actionagainsthunger.org/sites/default/files/publications/CMAM-Guidelines-Nigeria.pdf (accessed May 27, 2023).
26. National Social Safety Net Coordination OfficeFrequently asked questions on the National Social Investment Programmes (NSIPs). Abuja, Nigeria: National Social Safety Net Coordination Office. (2020). Available online at: https://n-sip.gov.ng/faqs/ (accessed May 24, 2023).
27. Chalak A, Kallas Z. Estimating food demand elasticities in Lebanon using the quadratic almost ideal demand system. J Agricult Appl Econ. (2020) 53:243–61.
28. Pascual J, Flores-Lagunes A, Foster W. The demand for fruits and vegetables in Spain: an application of the quadratic almost ideal demand system. Agricultu Econ. (2020) 51:871–81.
30. Green R and Alston JM. Elasticities in AIDS Models. Am J AgricEcon. 72:442–45. doi: 10.2307/1242346
31. Pollak RA. The structure of preference and attenuation of budgetary information. J Econom. (1988) 39:311–28.
32. Ogunleke AO, Baiyegunhi LJS. Households' acceptability of local (ofada) rice based on quality attributes in South-West, Nigeria. Br Food J. (2019) 121:2233–48. doi: 10.1108/BFJ-01-2019-0045
33. World Food Programme (WFP). Technical Guide Sheet: Food Consumption Analysis, World Food Programme, Vulnerability Analysis and Mapping Branch. (2008). Available online at: http://vam.wfp.org (accessed May 19, 2023).
34. Diewert WE. Index Numbers. In:Eatwell J, Milgate M, Newman P, , editor. The New Palgrave-A Dictionary of Economics. New York: Stockton Press. (1987). doi: 10.1057/978-1-349-95121-5_940-1
35. Moschini G. Units of measurement and the stone index in demand system estimation. Am J Agricultural Econ. (1995) 77:63–8. doi: 10.2307/1243889
36. Matsuda T. Linear Approximations to the Quadratic Almost Ideal Demand System. Empirical Econ. (2006) 31:663–75. doi: 10.1007/s00181-005-0044-3
37. Adeyeye VA. Strategies for Enhancing Consumption of Locally Produced Rice in Nigeria. Nigerian Institute of Social and Economic Research (NISER), Ibadan, Nigeria (2012).
38. Omonona BT, Nkang NM, Ajao FA. Household food demand analysis: a survey of semi-urban and rural households in South-West, Nigeria. Global J Pure Appl Sci. (2009) 15:315–24. doi: 10.4314/gjpas.v15i3-4.48545
39. Onyeneke RO, Chukwuemeka RU, Emenekwe E, Amadi MU, Munonye JO, Njoku CL, et al. Demand analysis of rice in Nigeria: application of quadratic almost ideal demand system model. Asian J Agricu Rural Dev. (2020) 10:364–78. doi: 10.18488/journal.1005/2020.10.1/1005.1.364.378
40. Gyimah-Brempong K, Kuku-Shittu O. Evolution of Rice Consumption and Demand Patterns. In: Gyimah-Brempong K, Johnson M, Takeshima H. The Nigerian Rice Economy: Policy Options for Transforming Production, Marketing, Trade. Philadelphia: University of Pennsylvania Press. (2016) p. 21–50. doi: 10.2499/9780812248951
41. Adeyonu AG, Shittu AM, Kehinde MO, Adekunle CP. Farm households' demand response to escalating food prices in Nigeria. J Appl Econ. (2021) 24:555–76. doi: 10.1080/15140326.2021.1980351
42. Makama SA, Ilu IY, Suleiman NJ, Isiaku S, Isah MA. Demand analysis of rice in Nigeria. Nigerian J Agricult Extens. (2017) 18:70−75. Available online at: http://www.aaawe.org/wp-content/uploads/2015/01/Yemisi_final.pdf (accessed May 22, 2023).
43. Kuku-Shittu O and Pradesha A. (2013). An econometric analysis of rice demand in Nigeria. Paper presented at the 18th Annual Conference on Econometric Analysis and Policy Challenges in Africa. doi: 10.4314/bja.v4i1.41928
44. Hoang HK. Analysis of food demand in Vietnam and short-term impacts of market shocks on quantity and calorie consumption. Agricultural Econ. (2018) 49:83–95. doi: 10.1111/agec.12397
45. Obalola OT, Tanko L, Aboaba KO, Abubakar BB, Odum EEB, Agboola BO, et al. Determinants of food demand among urban households in Minna Metropolis, Niger State, Nigeria. J Agriculture Nat Res. (2021) 4:175–85. doi: 10.3126/janr.v4i2.33739
Keywords: healthy diets, hunger, households, food, LA-QUAIDS, South-West, Nigeria
Citation: Ogunleke AO, Olawuyi SO and Ijila OJ (2023) The pattern of healthy diets and zero hunger among households in South-West Nigeria: application of linear approximation to quadratic almost ideal demand system. Front. Public Health 11:1211479. doi: 10.3389/fpubh.2023.1211479
Received: 24 April 2023; Accepted: 09 June 2023;
Published: 10 July 2023.
Edited by:
Mojisola Olanike Kehinde, Landmark University, NigeriaReviewed by:
Olutosin Ademola Otekunrin, Federal University of Agriculture, Abeokuta, NigeriaChioma Adekunle, Federal University of Agriculture, Abeokuta, Nigeria
Copyright © 2023 Ogunleke, Olawuyi and Ijila. This is an open-access article distributed under the terms of the Creative Commons Attribution License (CC BY). The use, distribution or reproduction in other forums is permitted, provided the original author(s) and the copyright owner(s) are credited and that the original publication in this journal is cited, in accordance with accepted academic practice. No use, distribution or reproduction is permitted which does not comply with these terms.
*Correspondence: Seyi Olalekan Olawuyi, c2V5aWRvbGFwbzE3MDRAZ21haWwuY29t; U09sYXd1eWlAdWZoLmFjLnph
†ORCID: Seyi Olalekan Olawuyi orcid.org/0000-0002-7405-2802
Olusegun Jeremiah Ijila orcid.org/0000-0001-9174-0140