 Iago Grobas
 Munehiro Asally
 Marco Polin
- 1Warwick Medical School, University of Warwick, Coventry, United Kingdom
- 2Physical and Theoretical Chemistry Department, University of Oxford, Oxford, United Kingdom
- 3Bio-Electrical Engineering Innovation Hub, University of Warwick, Coventry, United Kingdom
- 4Warwick Integrative Synthetic Biology Centre, University of Warwick, Coventry, United Kingdom
- 5School of Life Sciences, University of Warwick, Coventry, United Kingdom
- 6Centre for Mechanochemical Cell Biology, University of Warwick, Coventry, United Kingdom
- 7Physics Department, University of Warwick, Coventry, United Kingdom
- 8Mediterranean Institute for Advanced Studies (IMEDEA UIB-CSIC), Esporles, Spain
Wet self-propelled rods at high densities can exhibit a state of mesoscale turbulence: a disordered lattice of vortices with chaotic dynamics and a characteristic length scale. Such a state is commonly studied by a two-dimensional continuum model. However, less is known about the dynamic behaviour of self-propelled rods in three- or quasi-two- dimensions, which can be found in biological systems, for example, during the formation of bacterial aggregates and biofilms. In this study, we characterised the formation of multi-layered islands in a monolayer of swarming cells using the rod-shaped bacteria B. subtilis as a model system. We focused on how bacteria form multiple layers and how the presence of stress affects the multiple layer formation. Following our previous study where we reported that the initiation of the multilayer formation can be accounted by the framework of motility-induced phase separation (MIPS), this study analysed how this phase separation is impacted by the presence of stress, specifically under the exposure to a gradient of antibiotic. The analyses show that in the presence of an antibiotic gradient, the multi-layer formation happens by a nucleation and growth of well-defined multilayered clusters instead of by the uncontrolled emergence of the multilayer, resembling the traditional thermodynamic processes of binodal and spinodal decomposition respectively. Finally, the multilayer gives place to waves of bacteria that can travel towards high concentrations of antibiotics and that resemble travelling waves predicted by simulations of mixtures of passive and active particles.
Introduction
From flocks of birds to swarms of bacteria, spontaneous emergence of ordered motion in a collective of living organisms is ubiquitous across many length scales (De Magistris and Marenduzzo, 2015; Gompper et al., 2020; Ariel et al., 2022). Intriguingly, these collective motions exhibit shared patterns of spatio-temporal coherence (Vicsek and Zafeiris, 2012; De Magistris and Marenduzzo, 2015), which implies the existence of generic underlying principles of collective dynamics. Elucidating the basis of such patterning is a key research topic of active matter physics as it could advance our understanding of social and multi-cellular phenomena, facilitate the development of functionalized dynamic living materials (Lantada et al., 2022) and reveal novel control designs for swarming robots (Navarro and Matía, 2013). Bacteria are an attractive model system for studying collective motion due to multiple reasons, including their relatively easy use in experiments, their broad applications in biomedical and biotechnological fields and their ability to exhibit surprisingly complex social and multi-cellular behaviours (Vicsek and Zafeiris, 2012; Be’er and Ariel, 2019; Peruani et al., 2010). The last decades have seen a flourishing of biophysical research on swarming bacteria, especially for well-studied model organisms like E. coli and B. subtilis. For example, studies in collective behaviour of swarming B. subtilis mono-layers have found that bacteria move collectively in aligning clusters undergoing large fluctuations in cell density over a period of a few seconds (Zhang et al., 2010). The particular properties of this collective motion depend strongly on the physical properties of the swarm such as cell density, cell velocity and the aspect ratio of the cells (Be’er et al., 2020; Grobas et al., 2020). One of interesting theoretical frameworks in active matter physics is motility-induced phase separation (MIPS) where a dense collection of motile particles spontaneously form high-density and low-motility clusters, surrounded by a low-density high-motility phase (Barré et al., 2015; Gonnella et al., 2015). MIPS emerges from feedback between the drop in motility at high density due to physical interactions and the spontaneous accumulation of active particles in the places where their speed is lower (Cates and Tailleur, 2015). A similar phenomenon was recently reported in bacterial collectives in which cells move slowly (0.5 μm/min) like gliding Myxococcus xanthus and in expanding colonies of Pseudomonas aeruginosa (Takatori and Mandadapu, 2020; Copenhagen et al., 2021).
Formation of multilayered clusters is of biological and biomedical importance because such clusters have been suggested, although not yet proven, to play a key role in collective antibiotic tolerance (Butler et al., 2010; Partridge et al., 2018). Recent studies have displayed that jamming and stress-induced formation of multi-layer clusters in a monolayer B. subtilis swarming colony, eventually lead to biofilms (Grobas et al., 2021; Worlitzer et al., 2022a). Through local perturbation of cell density we have previously shown that this transition is compatible with MIPS (Grobas et al., 2021). However, swarming bacteria formed notably different multi-layer clusters in absence of stressors, which pointed to a difference in the ways by which multilayered clusters are formed and developed in presence and absence of stress.
In this study we show, through a detailed characterization of cluster formation, that swarming B. subtilis have indeed two different mechanisms to transition from a monolayer to a multilayer: one resembling nucleation and growth, where small nuclei form and grow over time; the other through an abrupt transition without defined boundaries between the two phases, similar to a spinodal decomposition. The latter allows bacteria to move towards regions of high antibiotic concentration where cells form an immotile mono-layer. Our results point to the importance of cell replication, a factor that is often omitted in biophysical models, on the transition from single to multilayer.
Results
B. subtilis develops a multilayer through a mechanism that resembles a phase transition in binary fluids
To characterize how swarming B. subtilis can develop multiple layers while still in the swarming state, we performed swarming assay as described previously (Grobas et al., 2021). Following a 2 h lag period, the single-layer swarming front rapidly expanded at 4 mm/h and eventually covered the whole 9 cm Petri dish in
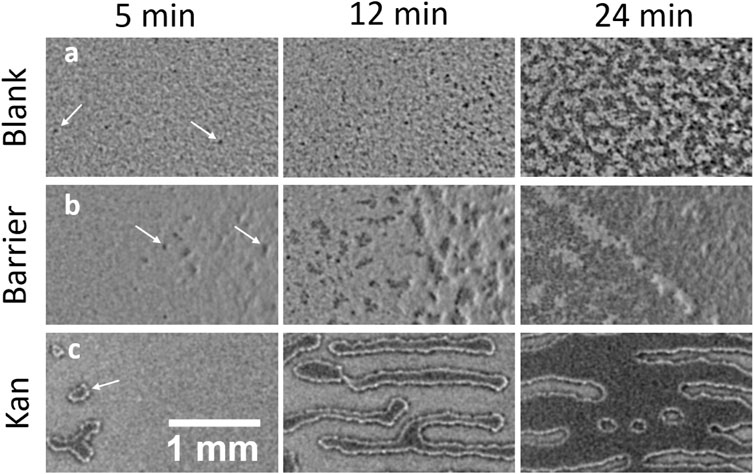
FIGURE 1. Island formation in swarming B. subtilis in a confluent plate in absence of stress, in presence of a physical barrier and in a gradient of kanamycin. (A,B,C) represent a timelapse of islands formation 5 min, 12 min and 24 min after the first island was observed in each condition. (A) Formation of islands in absence of stress. The islands appear as small dark spots in the brightfield image that eventually merge and form large dark areas. (B) Island formation in presence of a physical barrier where the wall was placed just at the right of the shown field of view. (C) Island formation in presence of a gradient of kanamycin. The islands appear as well defined regions that grow in size transversely to the kanamycin disk, placed on the right of the shown field of view. The arrows point at examples of the islands in each of the cases.
The appearance of islands at the petri-dish boundary suggests that they may result from local cell accumulation induced by blocking the expansion of the swarm. To test this possibility, we perform the swarming assay with a physical barrier inserted in the agar to arrest the swarming front (Figure 1B). Once the swarming front hits the barrier, islands emerge near the barrier. This happens much earlier than the spontaneous emergence of islands at the swarm centre. This result indicates that simply stopping the advance of the swarming monolayer is sufficient to cause a localized thickening in a swarming colony. This conclusion is also consistent with our previous study with kanamycin (Grobas et al., 2021). As the expansion of the swarming front stops due to kanamycin, well-defined distinct islands first emerge within a 5 mm-wide band inside of the arrested swarming front. These then grow with a strongly anisotropic pattern oriented transversely to the front of the swarm until they finally merge to form a localized second layer right behind the front (Supplementary Video S3). This phenomenology is clearly different from what is observed in the unperturbed case (see also section SI: Fast time dynamics during island stabilization) and is reminiscent of a binodal liquid-liquid phase separation in a temperature gradient (Jiang et al., 2013) (Supplementary Video S3), or to surfactant-driven phase separation in suspensions of copolymers (Bartolini et al., 2019). In our system, this might reflect a kanamycin-induced speed gradient or a gradient in surface tension due to the difference in surfactant production in the double-layered region with respect to the dead lawn of bacteria close to the kanamycin. These phenomenological differences in the mono-to-multilayer transition with and without an externally imposed stress, point to a possible generic mechanism that bacterial swarms harness to react to environmental stresses like antibiotics.
Nucleation of islands in absence of stress resembles a spinodal decomposition whereas it resembles nucleation and growth in a kanamycin gradient
To quantitatively characterize the mono-to-multilayer transitions, we follow in the steps of earlier studies of phase separation in active particles, namely characterizing whether the phase separation happens through spinodal decomposition or nucleation and growth (Peruani et al., 2012; Liu et al., 2019; van der Linden et al., 2019). During spinodal decomposition, the phase separation happens simultaneously across the whole system because there is no energy barrier that prevents the growth of fluctuations (Papon et al., 2006). In contrast, during nucleation and growth, the nucleated clusters have to overcome an energy barrier (Papon et al., 2006). As a result, phase separation by nucleation and growth is slower and has a characteristic nucleation size (Berry et al., 2018). Putting this in the context of bacterial swarms, it is worth noting that cell replication is likely a non-negligible contributer since the time window for the formation of a confluent second layer, 50 min, is comparable to the doubling time of swarming B. subtilis (43 min) (Jeckel et al., 2019). To understand the physical process of bacterial mono-to-multi-layer transitions, we analyzed the nucleation of islands over time in three conditions: no antibiotic disk (blank); physical barrier (barrier); and antibiotic disk (kan) (Figure 2).
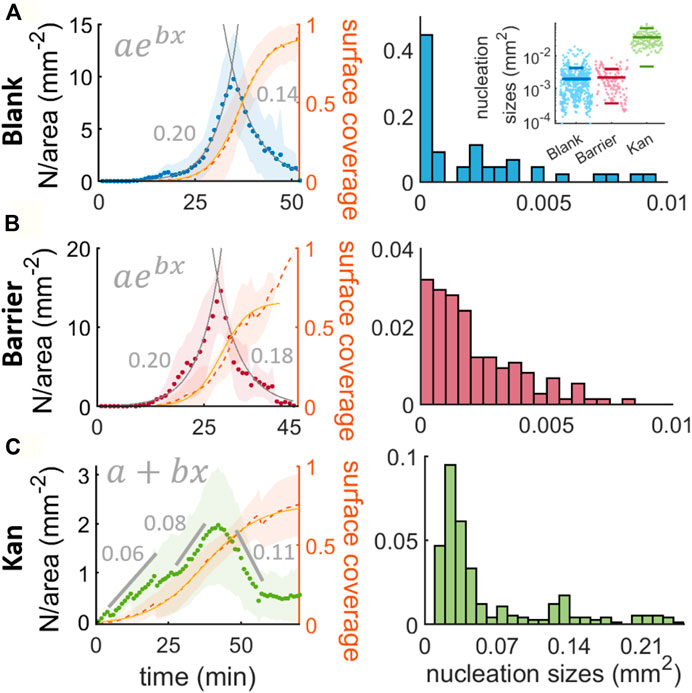
FIGURE 2. Nucleation and nucleation size distributions for the islands in absence of stress, with a physical barrier and with a kanamycin gradient. (A,B,C) describe the nucleation: and the proportion of surface covered by the multilayer, \phi_{II}(t) (in orange) over time for the three conditions studied, taking the origin of times as the first observed island in the field of view. The fits drawn as gray lines in (A) and (B) are fits to exponential functions and the numbers in gray are the exponent b of the exponential fit. For (C) the nucleation was fitted to three straight lines (two increasing and one decreasing) and their slopes are: 0.0605(0.0064), 0.00841(0.0057) and −0.1127 (0.0099) mm−2. The histograms show the distribution of sizes of the nucleated islands. The bin width for the blank and barrier cases are 0.0005 mm2 and for the kanamycin is 0.01 mm2. The inset in (A) represents the distribution of the sizes for the 3 cases studied, the lines are the mean and the standard deviation.
For the analysis of blank disk condition, we focus on a 5.3 × 5.3 mm2 region of interest coming from plates with a blank disk, a barrier, and a kanamycin disk. For the latter two, we consider as ‘blank’ the regions at least 4 cm from the stressor (either the barrier or the kanamycin disk). To minimize the influence of the petri-dish boundary, the regions of interest are chosen
where C and t0 represent the maximum coverage and the time at which the coverage is half maximum and k is the maximum growth rate of the second layer, achieved for ϕII ≪ 1. From the fit we can obtain k = 0.2591 (0.0054)min−1. Comparing k with the replication rate of swarming B. subtilis cells (0.06 min−1) (Jeckel et al., 2019) we can see that the second layer grows faster than it would do if the cause was only cell replication. This strongly suggests that there is a mechanism beyond cell replication that promotes the second layer formation.
For the analysis of the barrier condition, we select a rectangular region of size 7 × 14.5 mm2 adjacent to the barrier to avoid the contribution of islands from other regions of the swarm. The increase in cell number is expected to be faster than in the blank case, because the cell density increase can occur both by cell replication and the local accumulation of cells due to the physical barrier. As we can see in Figure 2B, the nucleation follows a temporal evolution that is again well captured by an exponential, albeit with a slightly worse agreement than in the blank case (R2 = 0.96 for barrier vs 0.99 for blank) and a faster decrease past the peak (−0.178 (0.011)min−1). The growth rate of the second layer is k = 0.310 (0.025)min−1, higher than for the blank case, suggesting that indeed cell accumulation from other regions of the swarm contributes to the formation of the second layer.
For the analysis of the kanamycin case, we consider a region 8.8 × 15 mm2 oriented such that islands grow nearly parallel to the long side of the region of interest. The region considered is
Altogether, the emergence and expansion of multilayer regions of the swarm follow a distinct dynamics in the kanamycin case compared to the other two. In the blank and barrier cases, an extremely rapid increase in nucleation of small islands leads to the formation of intercalating networks of mono- and multi-layers. In the kanamycin case, instead, the multilayer coverage is the result of slow nucleation and growth of large, well-defined, coherent islands. It is well known that in equilibrium phase separation the slower growth rate is characteristic of nucleation and growth, where a few instabilities overcame the energy barrier and can grow. Overall, we suggest that the two contrasting phenomenologies we observe in the single-to-multilayer transition should be understood as the equivalent of spinodal and binodal phase separation. Indeed, the possibility of both binodal-like and spinodal-like phase-separation has been recently predicted for a relevant active matter model (Worlitzer et al., 2021).
Fourier analysis identifies a characteristic wavelength which does not evolve as an increasing power law
The differences in the nucleation and expansion of a multilayer swarm between the blank and barrier case on one side and the kanamycin case on the other, and their similarities with spinodal and binodal decompositions, made us wonder whether these two distinct cases would be compatible with properties intrinsic to the structure of phase transitions in equilibrium thermodynamics. For example, a hallmark of spinodal decomposition is a well-defined length scale of the phase-separated domains that increases with time as a power law as the domains grow self-similarly (Chaikin and Lubensky, 1995; Bray, 2002). This characterization has proven useful for Myxococcus xanthus fruiting body formation (Liu et al., 2019). Myxococcus xanthus can form fruiting bodies through a spinodal decomposition for high inoculation densities and through nucleation and growth for lower inoculation densities, following in both cases a power law increase in their characteristic wavelengths. In a similar way it might be possible to observe a well-defined initial wavelength in the dynamic phase transition from single to multi-layer, possibly distinct for the spinodal-like and binodal-like cases.
To estimate the characteristic wavelengths of the multilayer transition we analyze the structure factor -or power spectrum-of the recorded images. In particular we focus on the direction perpendicular to that corresponding to island elongation in the kanamycin case. We refer to this as the y direction. We therefore choose the kx = 0 component of the power spectrum in the kanamycin case and for consistency we do the same for the barrier and blank cases. We fit this component to a sum of two Gaussians, extracting the characteristic wavelength as the inverse of the wavenumber at the peak of the fit of one of the Gaussians (Figures 3A–C). In the blank case, the structure factor gives a weak peak for times earlier than 15min (Figure 3A), probably due to the absence of any stable nucleated islands, which usually appear for times around 14 min (Figure 2A). Between 15 and 30 min there is a periodic pattern given by the formation of well separated islands (Figure 1C) that then decays for later times probably due to the merging of the islands. The classical theory of coarsening predicts that the microstructure of a two-phase system will evolve to be self-similar, or time independent when scaled by a suitable time-dependent length (Sun et al., 2018). To assess whether this is the case in our experiments, we rescale the structure factor and the wavenumber by their value at the peak.
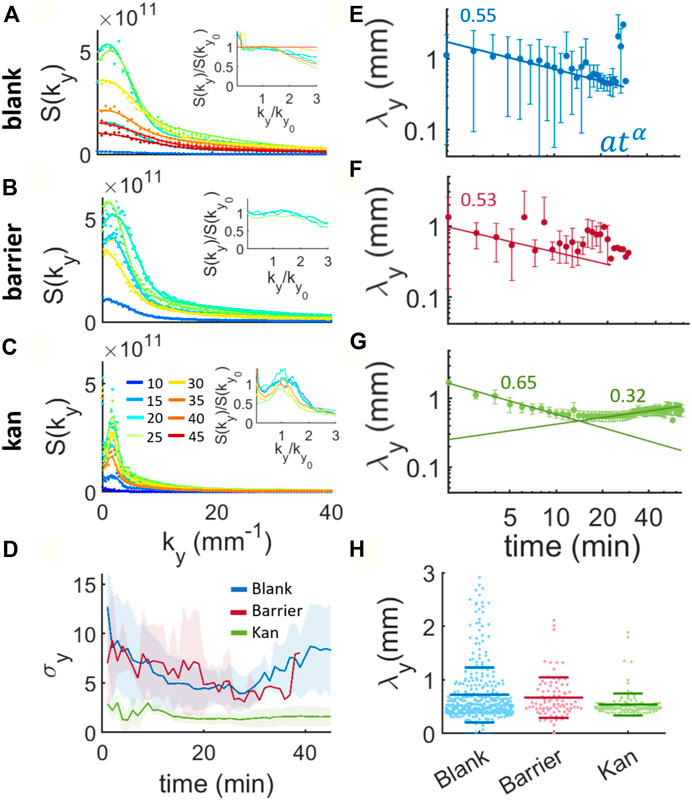
FIGURE 3. Structure factors and evolution of the characteristic wavelengths during island formation for the blank, barrier and kanamycin. (A,B) and (C) show the y component of the structure factors during island formation. The lines are fits to a sum of two gaussians from one of which the characteristic wavenumber of the peak is obtained. The colorcode represents the time in minutes, indicated in the legend of panel (C). The insets represent the structure factors rescaled by their peak plotted against the wavenumber rescaled by the wavenumber at the peak. For clarity, we just plotted a single experiment. (D) Mean width of the Gaussian (σ) and standard deviation across the experiments (shaded region) for the structure factors in the blank, barrier and kanamycin cases. (E), (F) and (G) display the characteristic wavelengths λy calculated as the inverse of the peak’s wavenumbers over time. The points represent the mean of 20 and 5 samples for blank, barrier and kan respectively, and the bars the standard deviation of the mean. The continuous lines are fits to power laws whose exponents are written on the figure. (H) Distribution of all the calculated wavelengths obtained from the Gaussian fits. The long horizontal lines indicate the mean of the distribution and the short lines their standard deviation.
Figure 3A inset shows that the blank case evolves in a self-similar manner only for a restricted period of time (notably between 20 and 40 min). This differs from the barrier case, where the structure factor appears to be self-similar already for times around 10 min and for the whole duration of the island formation and coarsening process until the confluent second layer is formed (Figure 2B inset). For kanamycin, the structure factor is tight around a well defined peak (Figure 3C) and the rescaling shows clear self-similarity in the process (Figure 3C inset). This can be seen also by calculating the average width of the Gaussian peak (σy), which is notably smaller for the kan case than the other two (Figure 3D). In both the blank and barrier cases, the average width of the structure factor decreases with time indicating a trend towards more defined patterns, until eventually growing again as a result of merging between islands. From the Gaussian fits we then extract the characteristic wavelengths (λy) for the three processes, corresponding to the wavenumber at the peak of the structure factors. For a standard spinodal decomposition, this wavelength is predicted to increase with time as a power law when the number of particles is conserved (Chaikin and Lubensky, 1995; Bray, 2002), something that is not borne out of our measurements. In both the blank and the barrier cases, the characteristic wavelength appears to decrease with time, at least initially, with a weak power law [blank: 0.551 (0.045); barrier: 0.53 (0.13); kanamycin: 0.652 (0.048)] (Figures 3E,F). This initial reduction of the characteristic length scale has been predicted by the so-called “domain insertion model” as a consequence of the non-conserved number of units within the system (Kyu and Lee, 1996). During a phase transition with increasing number of particles, if the nucleation of newer domains is faster than the phase separation process the new domains created in the inter-cluster regions lead to smaller inter-domain distances (Kyu and Lee, 1996). Indeed, as discussed in the previous section, the nucleation of new islands increases initially in all three cases (Figure 2) and is therefore expected to lead to shorter observed wavelengths. However, a change in trend can be observed in the latter part of the process especially for the kanamycin case whose characteristic wavelength increases with an exponent of 0.320 (0.034) for more than 30 min (Figure 3G). This change suggests that at the beginning, whilst the surface coverage of the multi-layer swarm is sufficiently low, the characteristic wavelength is selected by the nucleation of new islands and that the growth of existing islands takes over at later times, until eventually the whole field of view is multi-layered. We note that, despite the differences in the characteristic wavelength dynamics for the blank, barrier and kanamycin cases, the average wavelength of the system is nearly the same (Figure 3H). However, the distribution of average wavelengths is significantly narrower in the kanamycin case compared to the blank one, with the barrier distribution intermediate between the two (Figure 3H).
The results of the Fourier analysis suggest that the phase transition dynamics resembles “domain insertion model” for the blank and the barrier cases. In the kanamycin case, there is a turning point that indicates the end of the period dominated by nucleation and the start of a long
The phase transition resembles cluster formation characteristic of motility-induced phase separation
As observed in Figure 1, the islands’ size and shape are very different in the barrier and blank cases compared to the kanamycin one. Despite these differences, we wondered whether the growth of individual islands in time could prove to have a similar character. For a bacterial system like ours, which has been modelled in the past like a monolayer of active particles, domain growth is expected to follow a power law, as prescribed by the Cahn-Hilliard model for a phase-separating binary fluid (Papon et al., 2006; Gonnella et al., 2015).
Figure 4A shows the evolution of the islands’ size distribution over time for the three cases. The initial average size for kanamycin (0.0247 (0.0034)mm2) is clearly different from either the blank or barrier case (0.0031 (0.0060)mm2 and 0.0020 mm2 respectively). The change in size can be described heuristically by a linear combination of a power law and an exponential:
In the kanamycin case, the initial increase of the average island size is indeed well described by a simple power law ⟨s⟩∝ td, with a power d = 0.664 (0.024) which agrees well with the value of 0.67 reported for the equivalent phase of clustering Janus particles in (van der Linden et al., 2019). This stage represents the growth of individual islands and it appears to follow a dynamics similar to what has been reported for clustering of active colloidal particles. In case of Janus particles, the next phase is characterized by a slowing down of the coarsening when most particles have aggregated (regime II in Figure 2A in (van der Linden et al., 2019)). In our case, however, this slowing down does not happen. On the contrary, we observe a rapid acceleration with ⟨s⟩ increasing exponentially in time (rate r = 0.249 (0.018)min−1). We attribute this to the continuous increase in the number of bacteria which ultimately leads to the complete coverage of the field of view by the multilayer. New bacteria must come from a combination of replication and flow from other regions of the swarm. In the blank case, we do not observe a significant increase in the average island size until 5min after the first island appears. As we have seen, during this period new islands continuously appear and disappear with no significant coarsening. Indeed the blank case lacks a power-law phase and is well fitted by a simple exponential. As time progresses, islands nucleation increases exponentially, the average separation between islands decreases rapidly until they start to merge (Supplementary Video S2), resulting in a sudden increase in the average islands size (rate r = 0.348 (0.015)min−1). Finally, in the barrier case, the average island size also displays a two-stages evolution. The latter is an exponential increase with r = 0.390 (0.014)min−1 similar to the blank case and 1.5 times higher than for the kanamycin case. The initial stage, instead, appears to be intermediate between the clear coarsening dynamics of the kanamycin case and the nucleation-dominated constant ⟨s⟩ of the blank case. The power law fit returns an exponent d = 0.205 (0.094) which is only about a third than in the kanamycin case.
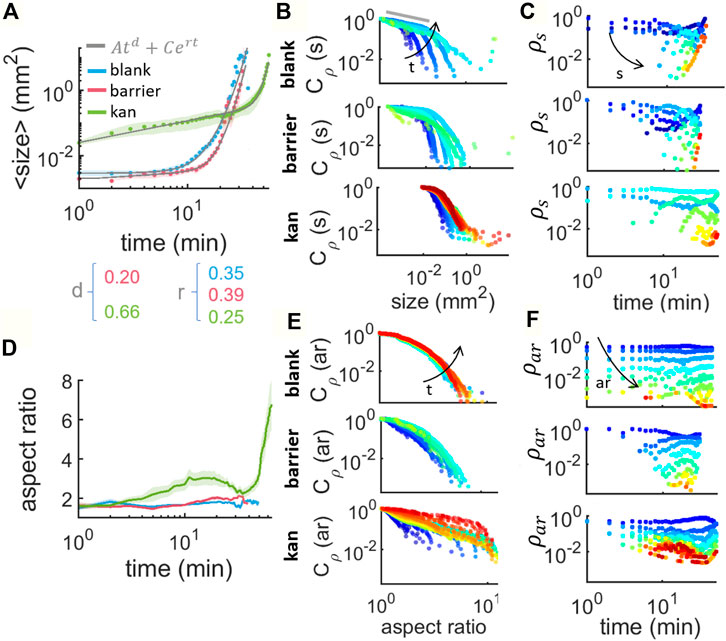
FIGURE 4. Characterization of the size and shape of island formation at the swarming front in absence of stress, in presence of physical barrier and in presence of kanamycin. (A) Average size of the islands tracked along time within an area of: 5.31 × 5.31 mm2 for blank (in blue), 7 × 14.47 mm2 for barrier (in red) and 8.8 × 14.97 mm2 for kanamycin (in green). The curves are the average of 20 samples for blank and 5 for barrier and kanamycin. The gray lines are the result of fitting to Eq. 2. (B) Complementary cumulative distribution of the islands size, Cρ(s,t), for increasing times t ∈ [0, 50] min every 3 min (from blue to red) (C) Cluster size histogram ρs (s,t) as a function of time, for increasing size s ∈ [10–4, 103] mm2 grouped in 12 bins logarithmically distributed (from blue to red). (D) Average aspect ratio (ar) of the islands at the swarming front for the three cases studied. (E) Cumulative distribution of the islands aspect ratio Cρ(ar), for increasing times t ∈ [0, 50] min every 3 min (from blue to red). (F) Cluster aspect ratio histogram ρar(t) as a function of time, for increasing ar ∈ [0 10] grouped in 24 bins linearly distributed (from blue to red).
The drawback of studying the instantaneous average island magnitude is that we are considering old islands, that have already had time to grow, together with the smaller ones that just nucleated. This potentially confounds islands’ nucleation with growth. It is therefore instructive to analyze also the size distribution of the individual islands ρ(s, t),
where ns(t) is the number of islands with size s and N is the total number of islands in the field of view at a given time; and its complementary cumulative distribution function (ccdf) defined as:
This is plotted in Figure 4B for successive times as per color scheme from when the islands first appear (blue) up to 50 min later (red). We can immediately see that the kanamycin case lacks islands of size smaller than 0.01 mm2, dominant even for later times in the other two cases. The small-size end of the distribution (indicated with a gray line in Figure 4B) is expected to follow a power law phase, as predicted by the Callan-Hilliard model (Papon et al., 2006; Gonnella et al., 2015). This has been reported for Monte Carlo models of self-propelled hard disks (Levis and Berthier, 2014), experimental studies of active Janus colloids (van der Linden et al., 2019), gliding M. xanthus (Peruani et al., 2012) and swarming B. subtilis monolayer clusters (Zhang et al., 2010). This would imply that, for sufficiently small sizes, we should expect ρ(s, t) ∼ s−a and therefore Cρ ∼ s−a+1. Typical values for a in cluster formation through MIPS are between 1.7 and 2 (Peruani et al., 2012; Levis and Berthier, 2014; Redner et al., 2016; Ginot et al., 2018). These correspond to systems that are assumed to be strictly two-dimensional and where the total number of particles is constant. Both of these assumptions need to be relaxed in the present case. Estimating a from a fit to the first ∼5 points in Figure 4B (the linear region), one recovers a = 1.264 (0.083), 1.076, 1.0389 for the blank, barrier and kanamycin cases respectively. As the distributions of these exponent are quite broad (Supplementary Figure S2), for simplicity here we report only the mean value of the time averages calculated for each experiment. For the blank case, a matches the value reported for MIPS in Janus particles (1.25) (van der Linden et al., 2019). In the other two cases, however, the values appear much closer to the 0.95 (0.05) reported for cluster formation in gliding bacteria (Peruani et al., 2006; Peruani et al., 2010). In the ccdfs, we can see that for times larger than 10min, or equally for high cell densities, there is a tail at the far end of the size range, due to large islands that appear as a consequence of the increase in cell number. A similar tail in the distribution ρ has been reported also in gliding M. xanthus and interpreted there as the emergence of collective motion, since the tail was absent for immotile bacteria (Peruani et al., 2012).
Beyond the nucleation and coarsening, merging of different islands is the final main aspect of their dynamics. This can be observed best in the island size distribution ρ(s, t). We note that its definition differs from the traditional definition of cluster size distribution, where ns is commonly normalized by the total number of particles, which is a fixed parameter in the system and therefore follows ρ(s, t) ∝ t−2 (equation 5.13 in (Krapivsky et al., 2010)). This is not our case since the number of particles increases over time and experimentally they cannot be counted within an island. In blank and barrier, we observe that just very small islands are present for times shorter than ∼8 min, and then bigger islands emerge due to the coarsening of the small ones giving place to a scenario where new small islands keep nucleating and the old ones grow and merge. This is more pronounced for kanamycin since the nucleated islands are bigger in size and they quickly grow: after 3 min in the kanamycin case we have sizes that will not appear in the other two cases until times larger than 10 min. There is as well a difference in the predominant sizes during the timelapse. In the kanamycin case, the smallest islands, corresponding to the nucleating islands, are not the most abundant size throughout the timelapse since the islands that nucleate quickly start growing. This contrasts with the other two cases where the nucleated islands sizes are quite abundant even for late stages in the timelapse.
So far we described the evolution in size of the islands with time but not the spatio-temporal dynamics of their evolution in shape (Figure 4D). This can be characterized by looking at the aspect ratio of the islands. The average aspect ratio remains constant at
Together with the average aspect ratios, also their distributions and their ccdfs for the three cases (Figures 4E,F) show a clear difference between the barrier and blank cases on one hand and the kanamycin case on the other. In the first two cases the distributions of aspect ratios stay largely identical until merging, while for the antibiotic the distributions show a clear movement towards elongated regions of multilayer swarm.
We have shown that swarming B. subtilis transits into a second layer following a dynamics that bears resemblance to MIPS. The transition is different in absence and presence of antibiotics, following a dynamics that resembles spinodal-decomposition or nucleation-and-growth respectively. It stands to reason that the origin of this difference should be found in differences in the microscopic behaviour of the cells in the different cases. We therefore now turn to the characterisation of critical microscopic aspects of the cell monolayer during the different types of island formation.
Monolayer characterization during island formation
In the search for the origin of the differences observed between the kanamycin, blank and barrier cases, we characterized the case-specific behaviour of the swarming monolayer, as the differences might reflect a fundamentally distinct behaviour at the microscale. More specifically, we followed cell speed and surface coverage of the monolayer in a region between 0.7 cm and 2.7 cm from the kanamycin disk for a time interval of 1 h after the emergence of the first islands (0min) (Figure 5A). This region was selected in such a way that the points nearest to the disk correspond to the monolayer that gives rise to nucleation and growth of the front in presence of kanamycin, while the other side belongs to the region of the monolayer where we observe the spinodal-like decomposition. At the earliest time point, the swarm was still expanding and was still at a distance of 1.7 cm from the disk. Approximately 30 min later, the velocity decreased in the interior of the swarm. This is in agreement with (Jeckel et al., 2019), which characterized the cell velocity in different regions of a B. subtilis swarm and reported that the highest velocities are close to the advancing front.
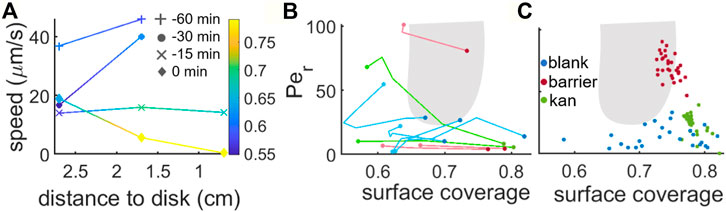
FIGURE 5. Speed and surface coverage characterization during multilayer formation. (A) Cell speed at 0.7, 1.7 and 2.7 cm away from the kanamycin disk for a time interval of 1 h before the initial formation of the islands (0 min corresponds to island formation). For reference, in our kanamycin experiments the islands form within a band that goes from ∼1.7 cm from the disk to just before the region where cells are immotile. The colorscale shows the surface coverage. (B) Phase diagram showing the Peclet number vs. the surface coverage of the system. The lines show the trajectories that the swarm follows in the phase space to form the islands. (C) Monolayer Peclet number and surface coverage while coexisting with the multilayer. The gray area shows the region where MIPS occur according to the numerical simulations for disks in (van Damme et al., 2019).
Approximately 15 min before the first island formation was observed, the front reached a position 0.7 cm away from the kanamycin disk. At this point, the speed of the front had decreased to approximately a third of the one measured between 60 min and 30 min before island formation. This reduction in speed is accompanied by a
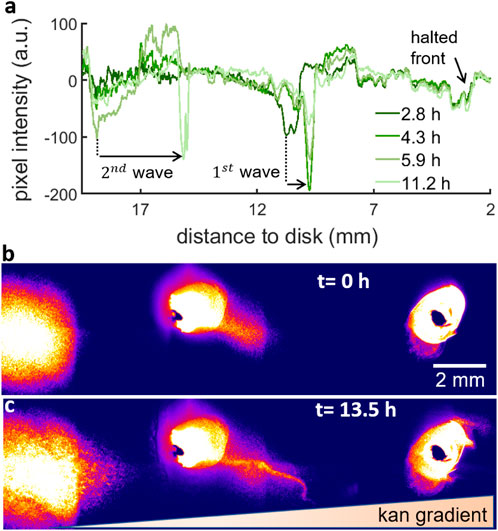
FIGURE 6. Fluorescent beads show that the waves create a net flow of bacteria moving towards the kanamycin disk. (A) Brightfield intensity profile of the swarm for 2.8, 4.3, 5.9 and 11.2 h after island formation. The drops in the pixel intensity correspond to high density regions. From the kanamycin disk, the profile shows a small drop corresponding to the halted front, then two drops for two different timepoints corresponding to the 1 mm distance that the 1st wave travels and finally the two last drops corresponding to the 3.7 mm travelled by the 2nd wave. (B) Fluorescent beads inoculated at three different points from the bacteria inoculation point (at the left of the image) to the kanamycin disk (at the right of the image). The fluorescent beads on the left were inoculated 15 mm away from the bacteria inoculum and the three points are equally spaced by 10 mm. The inoculum on the right is approximately 5 mm from the disk. The image corresponds to the start of island formation. (C) Distribution of fluorescent beads after ∼13.5 h, when the waves had already passed through all the points.
To test the extent to which the phenomenology observed here is compatible with the MIPS picture, we characterized the swarming states through their surface coverage and rotational Péclet number (calculated as described in (Grobas et al., 2021)) and followed their dependence in time until the islands were first seen in the field of view. Figure 5B shows the trajectories in parameter space corresponding to the evolution of the blank, barrier and kanamycin cases.
These two parameters are strongly dependent on where the data is acquired within the swarm. For example, to avoid the effect of a physical barrier that could be induced by the boundaries of the petri dish itself, we acquired the data in the blank case very close to the centre. This region is known to include clusters of immotile cells and low motility rafts (Jeckel et al., 2019; Worlitzer et al., 2022b), making the average speed in the field of view very low. The trajectories show that in both the blank and barrier cases what changes in the process of island creation is mostly the concentration of the monolayer, with only a minimal variation in motility with respect to the initial values. Figure 5C shows the phase-space parameters of the monolayer coexisting with the stable second layer. It is notable that, in the barrier case, the monolayer coexisting with the islands has a distinctly higher speed with respect to the other two cases. This might result from a combination of two factors. On one side the barrier forces the cells to accumulate at a premature state, different from when they naturally accumulate; on the other the small meniscus created by the presence of a physical barrier allows the cells to move faster (Kantsler et al., 2020). As seen in Figure 5A, in the blank case the second layer emerges with a lower surface coverage than in the kanamycin case. This suggests that the reduced speed due to kanamycin exposure, which would hinder the emergence of multilayer islands, is compensated by the increase in cell concentration due to the arrest of front propagation.
Differences in the dynamical properties of the monolayer while in coexistence with the multi-layer regions may not come only from the average cell velocity but also from higher moments of the velocity distribution. For example, continuum models of MIPS predict that the kurtosis of the velocity components should increase in a dense phase due to bacteria clustering, as opposed to a lower kurtosis in the diluted phase during spinodal decomposition (Worlitzer et al., 2021).
To compare our system to this model, we characterised the skewness and kurtosis of the x component of the velocities for the monolayer when coexisting with the second layer (Supplementary Figure S3). The skewness, which is commonly used to quantify the asymmetry of a distribution, is
In conclusion, the characterization of the monolayer demonstrates that in absence of stress, the swarm dynamics do not change significantly and the monolayer seems to behave like a diluted fluid. In contrast, in presence of kanamycin, the monolayer forms a packed state where cell-to-cell forces might have a greater contribution.
Waves of bacteria resulting from island formation expand further into the kanamycin gradient
Previous simulations of mixtures of active and passive particles have demonstrated the emergence of travelling waves of particles during phase separation (Stenhammar et al., 2015; Agrawal et al., 2017). Such a mixture can be found in our kanamycin experiment where highly motile cells and slow moving cells coexist. Therefore, we wondered if bacterial swams approaching to kanamycin disk can develop travelling waves. To test this conjecture, we examined the time evolution of swarming colony after the nucleation of the islands formed a confluent layer.
The multilayers at the front in the kanamycin case has a limited width: it occupies a band approximately
Following this multilayering over 4 layers, the localized multilayer forms a wave that moves towards the higher kanamycin concentration region (Figure 6). The expansion dynamics of the swarm layers was tracked via the intensity profile of brightfield images during a time lapse observation of the formation of multilayers at 30°C (Figure 6A). While the mechanism used by the multilayer to move forwards is currently unknown, we speculate that the second layer spreads following a mechanism involving the secretion of surfactin by individual cells, in a manner similar to the expansion of the first swarm layer (Ke et al., 2015; Srinivasan et al., 2019).
This 1st wave appears as a very dark thick line in the field of view due to multiple layers of cells. The wave first emerged at 10.8 mm from the kanamycin disk and then it travelled forward a total distance of 1 mm in 1.5 h to finally stop probably due to the presence of kanamycin. After that, the multilayer transition at the interior of the swarm created a 2nd wave. The 2nd wave started at 18.9 mm from the disk and travelled 3.7 mm in 5.3 h towards the kanamycin disk. The expansion speeds of the first and second waves,
To check whether there is any net transport of cells towards the antibiotic, we inoculated fluorescent beads at three different points in the trajectory of these waves (Figures 6B,C, Supplementary Video S5). The three points were separated by 1 cm from each other and they were placed in such a way that the left inoculum was just behind the point where the 2nd wave appears while the middle inoculum was just by the 1st wave. The third inoculum on the right acts as a control to test the net transport of beads in absence of these waves. As a result of the waves (Figure 6C), the beads were displaced towards the kanamycin disk. From that moment until the front halts,
Altogether the waves we observe allow the colony to expand into a region that was precluded to the initial expansion of the monolayer swarm. These waves of bacteria resemble the active waves happening in mixtures of particles during phase separation into dense and dilute phases (Stenhammar et al., 2015; Agrawal et al., 2017; Saha et al., 2020; You et al., 2020).
Discussion
In this study we describe how monolayer bacterial swarms can develop multiple layers through a mechanism resembling a first order phase transition. In absence of antibiotic stress, the swarm generates small islands that emerge suddenly to form a new layer, in a manner similar to a spinodal decomposition. In presence of stress, such as a gradient of antibiotics, the swarm creates nuclei of a well-defined initial size that coarsen with time, reminiscent of nucleation and growth. During their growth, the islands close to the antibiotic patch become elongated towards the outer side of the colony. Although the macroscopic description of how these islands evolve with time matches with some of the quantitative aspects reported for motility-induced cluster formation in active colloids, gliding bacteria and even swarming monolayers, we observed that the traditional models of MIPS failed to fully account for some quantitative properties of our system. For example, by MIPS, the characteristic wavelength of a phase transition with a constant number of particles is expected to increase as a power law over time. However, we observed that the characteristic wavelengths do not increase but rather decrease. This may be due to the constant creation of nuclei as a result of increase in cell density. Furthermore, in the models of MIPS using 2D repulsive active Brownian particles, the binodal decomposition happens at low density (high speed) (Speck et al., 2014), which appears different from swarming bacteria that we report here. There are at least two key differences between these models and our system: namely, aspect ratio and dimensionality. Particle aspect ratio induces effective torques in particle-particle interactions which has been shown to induce alignment and reducing the MIPS coexistence region (van Damme et al., 2019; Großmann et al., 2020). Unlike the other models, our system is not completely confined to be a monolayer. In fact, we have reported in the past that collisions between sufficiently large rafts can temporarily lead to the extrusion of parts of cells out of the monolayer (Grobas et al., 2021). The islands discussed here are regions of the swarm that have thickened in the transversal direction. As viewed from a 2D projection, this amounts to particles being able to overlap. Particle overlaps have been shown recently to be important in determining the pair correlation function and therefore qualitative aspects of the phase behaviour of a system of self-propelled (elongated) particles (Großmann et al., 2020). In bacterial swarms, cell replication could also have an effect in how the phase separation happens. Numerical models implementing birth and death are emerging to study self-organization among motile bacteria (Grafke et al., 2017; Li and Cates, 2020). Further development of these models can provide a better characterization of the described phase separation and presumably reveal novel phenomena that could have biomedical or industrial implications for other active matter systems with increasing number of particles. The quantification of swarming colony in this study could complement such models of phase transitions where the number of particles is not constant (Cates et al., 2010; Li and Cates, 2020).
In absence of stress, the emergence of islands is not stochastic throughout the field of view Supplementary Figure S1. Instead, islands appear at specific sites. Numerical simulations of self-propelled particles have shown that this could be due to the presence of obstacles that promote cluster formation (Aceves-Sanchez et al., 2020).
In presence of kanamycin, we link this localized phase transition with the development of waves of bacteria that carry cells in the swarm towards the regions of higher concentration of antibiotic, to a greater extent than the monolayer. This could give swarmers an advantage at conquering new territories and it could inspire new technologies using bacteria to transport particles or drugs for novel therapies. This phenomenon has been reported in systems of nonreciprocally interacting colloids (Stenhammar et al., 2015; Agrawal et al., 2017; Saha et al., 2020; You et al., 2020) which brings the opportunity to further exploit this transport mechanism in bacteria.
Methods
Kanamycin gradient assay
−80°C glycerol stock of B. subtilis NCIB3610 wild-type strain (WT) was streaked on a lysogeny-broth (LB) 1.5% agar plate and grown overnight at 37°C. A single colony was picked from this plate and cultured in 1 ml of liquid LB for 3 h at 37°C with aeration at 200 rpm. A 4 μl inoculum from this culture was placed in the center of a LB 0.5% agar plate supplemented with a glycerol ranging from 1 to 3% and 0.1 mM MnSO4 (LBGM (Shemesh and Chai, 2013)) to promote biofilm formation. A kanamycin diffusive disk (OxoidTM 30 μg) was placed on a side of the plate 24 h before inoculation to allow the antibiotic to diffuse at room temperature. The distance between the inoculum and the kanamycin disk was approximately 3.2 cm.
Physical barrier
A 3% agarose solution in water was autoclaved and then poured in a Petri dish. Once it solidified, a rectangular region (6 cm × 1 cm) was cut out to make a barrier object. The agar block was placed on a molten swarming liquid LBGM (0.5% agar). After the system solidified, bacterial cells were inoculated in the centre of the plate. Different barriers and barrier geometries were tried. For example, another common barrier was the stick of an inoculation loop placed as the agarose barrier. We also tried putting two of these sticks forming a triangular shape. Finally, a small petri dish with a whole in it was used for a circular confinement. All the confinements gave similar results. Videos of the formation of islands were recorded under 2x (Nikon Plan 2x UW, NA 0.06) in a Nikon Eclipse Ti2 microscope.
Islands geometry
To characterise the islands size and shape, time-lapses of islands formation in presence and absence of kanamycin and with a physical barrier were recorded. The period of acquisition was nearly 2 h with an interframe time of 1 min. The first frame (just before the islands appeared) was subtracted to the time-lapse and then a Gaussian filter was applied to remove noise. To create a wide region to track the evolution of the islands, we stitched several field of views with the “Grid/Collection stitching” plugin (Preibisch et al., 2009) in Fiji (Schindelin et al., 2012). Depending on the microscope and image quality, the resulting stitched image showed differences in background pixel intensity across the different stitched images. To homogenize the background in the field of view, a bandpass filter was used. When this pre-processing was insufficient to obtain good quality thresholded island, which was the case in the barrier and blank conditions, ilastik (Berg et al., 2019), a machine-learning based software, was used. The features relevant to distinguish the islands from the background were chosen as follow: Maximum Object per Merger = 1, Division Weight = 100, Transition Weight = 15, Appearance Cost = 1, Disappearance Cost = 500, Border Width = 10, Transition Neighbourhood = 2, Frames per Split = 0 and solver = ILP. The output was a layer of probabilities that can be thresholded to create a binary image. This binary timelapse was read by Matlab and the islands below a threshold size were discarded away, to remove spurious noise from the videos. Finally, the islands sizes were measured by using the command ‘regionprops’ in Matlab. To determine the aspect ratio, we used the same command to obtain the ‘MajorAxisLength’ and ‘MinorAxisLength’ properties. The ratio between the major and minor axis lengths was defined as the aspect ratio of the islands.
The size of the stitched field of view for the blank, barrier and kanamycin were respectively: 5.31 × 5.31, 7 × 14.47 and 8.8 × 14.97 mm2. The experiments in the blank and barrier cases were acquired using 2x (Nikon Plan 2x UW, NA 0.06), 2x (Nikon Apo Lambda 2x UW, NA 0.1) and 2.5x (Leica 2.5x N PLAN, NA 0.07) lenses in two different microscopes: Nikon Eclipse Ti2 and Leica DMi8. The experiments were repeated a total of 7 times for the blank case, 5 times for the barrier and kanamycin cases. More replicates were made in all cases where the common features could be observed but there were not used for the analysis due to the lack of sufficient time resolution. As the size of the acquisition region for the blank case was around 5 times larger than the ROI used for the analysis, from each of the experiments we used more than a single region for the analysis giving a total of 20 samples. These 20 samples were averaged and their standard error was calculated, as for the barrier and kanamycin cases. To average the samples, we aligned them by calculating the second derivative of the size evolution and matching the maxima of this magnitude for the different experiments. The first 13 points and 11 points of the barrier and kanamycin respectively, were fitted to an exponential as
Calculation of the complementary cumulative distribution functions, the size histograms and the cluster size distributions
From the thresholded timelapses, the ccdfs were calculated using the ‘cdfcalc’ function in Matlab. To obtain the cluster size distribution ρ(s, t) the sizes were grouped in 12 bins, distributed logarithmically using the function “logspace” going from 10–4 to 103, roughly the minimum and maximum sizes achievable by the islands in mm2. The number of counts in each bin were normalized by the total amount of counts. For the aspect ratios, a similar protocol was followed with the only difference that the bins were distributed linearly, from 0 to 10.
The first 5 points of the ccdf (considered in general the linear region in a log-log scale) were fitted to a power law of the form csα. To calculate the distributions of the exponent α, the values outside an interval of 4 standard deviations from the mean were discarded. The fits with R2 < 0.9 were discarded from analysis. Finally, we attempted to fit the cluster size distributions to:
as derived in (Krapivsky et al., 2010) and used in (van der Linden et al., 2019), which in our case did not fit our distributions.
Estimation of the nucleation rate
The number of islands that nucleate was calculated as the total number of islands whose size was below the median of the size distribution at a given time point. The number of islands resulting from this output was divided by the available area that they have to appear in the field of view, i. e. the entire area minus the area occupied by the islands in the previous frame. The resulting curves for nucleation were the result of the average of 20 curves for the blank, 5 for the barrier and kan. The curves were aligned so the peaks of the nucleation matched across experiments.
To fit the functions we used an exponential fit for the blank and barrier cases. For kanamycin, the increase in nucleation was fitted to two linear increases with different slope and the decrease to another linear fit.
Structure factors
To characterize the wavelengths in the system, we calculated the Fourier transforms in the x and y directions. To do so, first the axes in the frequency domain were calculated and centered in 0. Then, the 2D Fourier transform of the image is calculated using “fft2” in Matlab and then centered using “fftshift”. From here, the sum of the real and imaginary components to the square is calculated resulting in a 2D matrix. To calculate the static structure factor for each component, we added all the values of this 2D matrix in the y direction to calculate the component x of the structure factor and we added the values in the x direction to obtain the y component. This process was repeated for each image in the timelapse so then the evolution of the structure factor over time can be calculated. The structure factor was then fitted to a sum of two Gaussian functions using the “gaus2” fitting in Matlab. The characteristic wavelength was obtained as the inverse of the wavector at the peak of one of the gaussians. The wavelength from the other Gaussian was discarded since its value was physically unrealistic. A more simple fit to a single Gaussian was also tried but since the structure factor’s maximum is at wavenumber 0, the Gaussian would fit around this peak instead of the characteristic wavelength. To calculate the distribution of the wavelengths, the values greater than 3 mm were discarded, since they corresponded to wrong fits that did not fit any data set. The width σ of the structure factor was obtained from the Gaussian fit as the parameter “c” from the “gauss2” function in Matlab.
To rescale the structure factors, the calculated frequency axis was divided by the wavenumber at the peak of the Gaussian fit. Equally, each component of the structure factor was divided by the value at the peak of the Gaussian fit.
Fast time-scale dynamics of islands in the blank case
A 2 min timelapse of the islands was recorded with an interframe time of 0.5 s. A time average of this video was calculated using Fiji/ImageJ by using “z project → average”. In the same way, the standard deviation of the timelapse was also calculated and both projections were combined by using “Color → Merge Channels”, setting the standard deviation as the red channel.
Following this, the video was filtered and thresholded using ilastik. Then, the islands were tracked over time as explained in section “Islands geometry” with slight changes in the parameters to obtain the best possible tracks. Since these islands are quickly changing, the tracking software detected a high amount of islands lasting just a single or two frames. This was not observed when looking at Supplementary Video S6 by eye so we decided to consider lifetimes longer than two frames (1 s). After the tracks were filtered, a histogram was calculated by normalizing by the probability of each lifetime setting the binwidth as 1 s.
Motility and cell density of the monolayer
Timelapses of the monolayer were recorded with a 40x objective (Nikon 40x LWD, NA 0.55) at 37°C. Cell motility was measured by adapting a Particle Image Velocimetry (PIV) code written in Matlab (Sveen, 2004). The surface coverage was measured by thresholding the images and dividing the area covered by bacteria by the total area of our field of view. The threshold was set by using the command ‘imbinarize’ in Matlab and adapting the sensitivity of its threshold to account for the best estimate of cells in the field of view.
Tracking of bacterial waves with timelapse microscopy and fluorescent beads
To track the movement of the waves across the swarm, a line of thickness 15 was drawn with Fiji/ImageJ and the intensity profile in the brightfield channel was measured for a region going from the kanamycin disk to 17 mm into the swarm. A measurement of this profile was taken for the following events: when the 1st wave appears at t = 2.8 h, when the 1st wave halts at t = 4.3 h, when the 2nd wave starts at t = 5.9 h and finally when the 2nd wave halts at t = 11.2 h.
To characterize the transport of the waves, FluoSpheres™ (Carboxylate-Modified Microspheres, F8823) were inoculated in three different points 1, 2 and 3 cm away from the inoculum. In this case, the images were acquired along time for different positions within the colony with the 2x (Nikon Plan 2x UW, NA 0.06) magnification objective. The motion of beads was tracked in these three positions over time for a total period of approximately 13.5 h, acquiring frames every 3.6 min.
Data availability statement
The data that support the findings of this study are openly available in zenodo at 10.5281/zenodo.7258263. Data can be found in .fig, .tif and .xls formats and can be requested in other formats.
Author contributions
IG: Conceptualization, Formal analysis, Investigation, Visualization, data acquisition, Writing—original draft, Writing—review and editing MA: Conceptualization, Supervision, Funding acquisition, Investigation, Visualization, Writing—original draft, Writing—review and editing MP: Conceptualization, Supervision, Funding acquisition, Investigation, Visualization, Writing—original draft, Writing—review and editing.
Funding
This research is funded by the MRC Doctoral Training Partnership (MR/N014294/1). This work was supported in part by the Ramón y Cajal Programme (RYC-2018-02534; MP).
Acknowledgments
MP and MA acknowledge support from EPSRC grant, Bridging the Gaps initiative (EP/M027503/1). MA acknowledges BBSRC/EPSRC grant to the Warwick Integrative Synthetic Biology Centre (BB/M017982/1). MP acknowledges support from a Ramón y Cajal Fellowship (RYC-2018-025345-I).
Conflict of interest
The authors declare that the research was conducted in the absence of any commercial or financial relationships that could be construed as a potential conflict of interest.
Publisher’s note
All claims expressed in this article are solely those of the authors and do not necessarily represent those of their affiliated organizations, or those of the publisher, the editors and the reviewers. Any product that may be evaluated in this article, or claim that may be made by its manufacturer, is not guaranteed or endorsed by the publisher.
Supplementary material
The Supplementary Material for this article can be found online at: https://www.frontiersin.org/articles/10.3389/frsfm.2022.936779/full#supplementary-material
Supplementary Figure S1 | Short time-scale characterization of islands appearance in absence of kanamycin. (A) Image average and standard deviation (in red) of a 2 min timelapse showing that islands have preferred sites to appear. The white arrows show some examples of the islands in the field of view. (B) Histogram of the islands lifetime. The lifetime was measured as the time interval from island appearance until disappearance during a 2 min timelapse of images taken every 0.5 s. The bin width of the histogram is 1 s. This is remarkably different to what happens in presence of kan. In this case, once the island nucleates, it remains there for the whole timelapse and disappearance events are very rarely observed (Supplementary Video S7). The nucleated islands show instead big fluctuations in the boundaries.
Supplementary Figure S2 | Power law exponent α distributions and evolution with time for the complementary cumulative distributions in Figure 4. The first points of the ccdfs were fitted to a power law of the form csα. The main lines indicate the mean of the distribution and the small ones -or the shades-indicate the standard deviation of the mean.
Supplementary Figure S3 | Skewness and kurtosis of the x component of velocity for the blank, barrier and kanamycin. (A) Skewness of the x component vx of velocities calculated for the blank, barrier and kanamycin. (B) Kurtosis of the x component vx and modulus v of velocities. The long horizontal bars represent the mean of the distribution and the upper and lower short bars represent the standard deviation.
References
Aceves-Sanchez, P., Degond, P., Keaveny, E. E., Manhart, A., Merino-Aceituno, S., and Peurichard, D. (2020). Large-scale dynamics of self-propelled particles moving through obstacles: Model derivation and pattern formation. Bull. Math. Biol. 82, 129. doi:10.1007/s11538-020-00805-z
Agrawal, M., Bruss, I. R., and Glotzer, S. C. (2017). Tunable emergent structures and traveling waves in mixtures of passive and contact-triggered-active particles. Soft Matter 13, 6332–6339. doi:10.1039/c7sm00888k
Ariel, G., Ayali, A., Be’er, A., and Knebel, D. (2022). Springer international publishing, cham pp. 1–33.
Barré, J., Chétrite, R., Muratori, M., and Peruani, F. (2015). Motility-induced phase separation of active particles in the presence of velocity alignment. J. Stat. Phys. 158, 589–600. doi:10.1007/s10955-014-1008-9
Bartolini, A., Tempesti, P., Ghobadi, A. F., Berti, D., Smets, J., Aouad, Y. G., et al. (2019). Liquid-liquid phase separation of polymeric microdomains with tunable inner morphology: Mechanistic insights and applications. J. Colloid Interface Sci. 556, 74–82. doi:10.1016/j.jcis.2019.08.015
Be’er, A., and Ariel, G. (2019). A statistical physics view of swarming bacteria. Mov. Ecol. 7, 9. doi:10.1186/s40462-019-0153-9
Be’er, A., Ilkanaiv, B., Gross, R., Kearns, D. B., Heidenreich, S., Bär, M., et al. (2020). A phase diagram for bacterial swarming. Commun. Phys. 3, 66. doi:10.1038/s42005-020-0327-1
Benisty, S., Ben-Jacob, E., Ariel, G., and Be’er, A. (2015). Antibiotic-induced anomalous statistics of collective bacterial swarming. Phys. Rev. Lett. 114, 018105. doi:10.1103/physrevlett.114.018105
Berg, S., Kutra, D., Kroeger, T., Straehle, C. N., Kausler, B. X., Haubold, C., et al. (2019). ilastik: interactive machine learning for (bio)image analysis. Nat. Methods 16, 1226–1232. doi:10.1038/s41592-019-0582-9
Berry, J., Brangwynne, C. P., and Haataja, M. (2018). Physical principles of intracellular organization via active and passive phase transitions. Rep. Prog. Phys. 81, 046601. doi:10.1088/1361-6633/aaa61e
Bray, A. J. (2002). Theory of phase-ordering kinetics. Adv. Phys. 51, 481–587. doi:10.1080/00018730110117433
Butler, M. T., Wang, Q., and Harshey, R. M. (2010). Cell density and mobility protect swarming bacteria against antibiotics. Proc. Natl. Acad. Sci. U. S. A. 107, 3776–3781. doi:10.1073/pnas.0910934107
Cates, M. E., Marenduzzo, D., Pagonabarraga, I., and Tailleur, J. (2010). Arrested phase separation in reproducing bacteria creates a generic route to pattern formation. Proc. Natl. Acad. Sci. U. S. A. 107, 11715–11720. doi:10.1073/pnas.1001994107
Cates, M. E., and Tailleur, J. (2015). Motility-induced phase separation. Annu. Rev. Condens. Matter Phys. 6, 219–244. doi:10.1146/annurev-conmatphys-031214-014710
Chaikin, P. M., and Lubensky, T. C. (1995). Principles of condensed matter physics. Cambridge University Press.
Copenhagen, K., Alert, R., Wingreen, N. S., and Shaevitz, J. W. (2021). Topological defects promote layer formation in Myxococcus xanthus colonies. Nat. Phys. 17, 211–215. doi:10.1038/s41567-020-01056-4
De Magistris, G., and Marenduzzo, D. (2015). Physica A: Statistical mechanics and its applications. Phys. A Stat. Mech. its Appl. 418, 65–77. doi:10.1016/j.physa.2014.06.061
Ginot, F., Theurkauff, I., Detcheverry, F., Ybert, C., and Cottin-Bizonne, C. (2018). Aggregation-fragmentation and individual dynamics of active clusters. Nat. Commun. 9, 696. doi:10.1038/s41467-017-02625-7
Gompper, G., Winkler, R. G., Speck, T., Solon, A., Nardini, C., Peruani, F., et al. (2020). The 2020 motile active matter roadmap. J. Phys. Condens. Matter 32, 193001. doi:10.1088/1361-648x/ab6348
Grafke, T., Cates, M. E., and Vanden-Eijnden, E. (2017). Spatiotemporal self-organization of fluctuating bacterial colonies. Phys. Rev. Lett. 119, 188003. doi:10.1103/physrevlett.119.188003
Grobas, I., Bazzoli, D. G., and Asally, M. (2020). Biofilm and swarming emergent behaviours controlled through the aid of biophysical understanding and tools. Biochem. Soc. Trans. 48, 2903–2913. doi:10.1042/bst20200972
Grobas, I., Polin, M., and Asally, M. (2021). Swarming bacteria undergo localized dynamic phase transition to form stress-induced biofilms. eLife 10, e62632. doi:10.7554/elife.62632
Großmann, R., Aranson, I. S., and Peruani, F. (2020). A particle-field approach bridges phase separation and collective motion in active matter. Nat. Commun. 11, 5365. doi:10.1038/s41467-020-18978-5
Jeckel, H., Jelli, E., Hartmann, R., Singh, P. K., Mok, R., Totz, J. F., et al. (2019). Learning the space-time phase diagram of bacterial swarm expansion. Proc. Natl. Acad. Sci. U. S. A. 116, 1489–1494. doi:10.1073/pnas.1811722116
Jiang, H., Dou, N., Fan, G., Yang, Z., and Zhang, X. (2013). Effect of temperature gradient on liquid-liquid phase separation in a polyolefin blend. J. Chem. Phys. 139, 124903. doi:10.1063/1.4821591
Kantsler, V., Ontañón-McDonald, E., Kuey, C., Ghanshyam, M. J., Roffin, M. C., and Asally, M. (2020). Pattern engineering of living bacterial colonies using meniscus-driven fluidic channels. ACS Synth. Biol. 9, 1277–1283. doi:10.1021/acssynbio.0c00146
Ke, W. J., Hsueh, Y. H., Cheng, Y. C., Wu, C. C., and Liu, S. T. (2015). Water surface tension modulates the swarming mechanics of Bacillus subtilis. Front. Microbiol. 6, 1017. doi:10.3389/fmicb.2015.01017
Krapivsky, P. L., Redner, S., and Ben-Naim, E. (2010). A kinetic view of statistical physics. Cambridge: Cambridge University Press.
Kyu, T., and Lee, J.-H. (1996). Nucleation initiated spinodal decomposition in a polymerizing system. Phys. Rev. Lett. 76, 3746–3749. doi:10.1103/physrevlett.76.3746
Lantada, A. D., Korvink, J. G., and Islam, M. (2022). Taxonomy for engineered living materials. Cell Rep. Phys. Sci. 3, 100807. doi:10.1016/j.xcrp.2022.100807
Levis, D., and Berthier, L. (2014). Clustering and heterogeneous dynamics in a kinetic Monte Carlo model of self-propelled hard disks. Phys. Rev. E 89, 062301. doi:10.1103/physreve.89.062301
Li, Y. I., and Cates, M. E. (2020). Non-equilibrium phase separation with reactions: A canonical model and its behaviour. J. Stat. Mech. 2020, 053206. doi:10.1088/1742-5468/ab7e2d
Liu, G., Patch, A., Bahar, F., Yllanes, D., Welch, R. D., Marchetti, M. C., et al. (2019). Self-driven phase transitions driveMyxococcus xanthusfruiting body formation. Phys. Rev. Lett. 122, 248102. doi:10.1103/physrevlett.122.248102
Navarro, I., and Matía, F. (2013). An introduction to swarm robotics. ISRN Robot. 2013, 1–10. doi:10.5402/2013/608164
Papon, P., Leblond, J., and Meijer, P. H. (2006). in The physics of phase transitions: Concepts and applications. Editors P. Papon, J. Leblond, and P. H. Meijer (Berlin, Heidelberg: Springer Berlin Heidelberg), 1–409.
Partridge, J. D., Ariel, G., Schvartz, O., Harshey, R. M., and Be’er, A. (2018). The 3D architecture of a bacterial swarm has implications for antibiotic tolerance. Sci. Rep. 8, 15823. doi:10.1038/s41598-018-34192-2
Peruani, F., Deutsch, A., and Bär, M. (2006). Nonequilibrium clustering of self-propelled rods. Phys. Rev. E 74, 030904. doi:10.1103/physreve.74.030904
Peruani, F., Schimansky-Geier, L., and Bär, M. (2010). Cluster dynamics and cluster size distributions in systems of self-propelled particles. Eur. Phys. J. Spec. Top. 191, 173–185. doi:10.1140/epjst/e2010-01349-1
Peruani, F., Starruß, J., Jakovljevic, V., Søgaard-Andersen, L., Deutsch, A., and Bär, M. (2012). Collective motion and nonequilibrium cluster formation in colonies of gliding bacteria. Phys. Rev. Lett. 108, 098102. doi:10.1103/physrevlett.108.098102
Preibisch, S., Saalfeld, S., and Tomancak, P. (2009). Globally optimal stitching of tiled 3D microscopic image acquisitions. Bioinformatics 25, 1463–1465. doi:10.1093/bioinformatics/btp184
Qiu, F., Peng, G., Ginzburg, V. V., Balazs, A. C., Chen, H.-Y., and Jasnow, D. (2001). Spinodal decomposition of a binary fluid with fixed impurities. J. Chem. Phys. 115, 3779–3784. doi:10.1063/1.1388223
Redner, G. S., Wagner, C. G., Baskaran, A., and Hagan, M. F. (2016). Classical nucleation theory description of active colloid assembly. Phys. Rev. Lett. 117, 148002. doi:10.1103/physrevlett.117.148002
Saha, S., Agudo-Canalejo, J., and Golestanian, R. (2020). Scalar active mixtures: The nonreciprocal Cahn-Hilliard model. Phys. Rev. X 10, 041009. doi:10.1103/physrevx.10.041009
Schindelin, J., Arganda-Carreras, I., Frise, E., Kaynig, V., Longair, M., Pietzsch, T., et al. (2012). Fiji: An open-source platform for biological-image analysis. Nat. Methods 9, 676–682. doi:10.1038/nmeth.2019
Shemesh, M., and Chai, Y. (2013). A combination of glycerol and manganese promotes biofilm formation in Bacillus subtilis via histidine kinase KinD signaling. J. Bacteriol. 195, 2747–2754. doi:10.1128/jb.00028-13
Speck, T., Bialké, J., Menzel, A. M., and Löwen, H. (2014). Effective Cahn-Hilliard equation for the phase separation of active brownian particles. Phys. Rev. Lett. 112, 218304. doi:10.1103/physrevlett.112.218304
Srinivasan, S., Kaplan, C. N., and Mahadevan, L. (2019). A multiphase theory for spreading microbial swarms and films. eLife 8, e42697. doi:10.7554/elife.42697
Stenhammar, J., Wittkowski, R., Marenduzzo, D., and Cates, M. E. (2015). Activity-induced phase separation and self-assembly in mixtures of active and passive particles. Phys. Rev. Lett. 114, 018301. doi:10.1103/physrevlett.114.018301
Sun, Y., Andrews, W. B., Thornton, K., and Voorhees, P. W. (2018). Self-similarity and the dynamics of coarsening in materials. Sci. Rep. 8, 17940. doi:10.1038/s41598-018-36354-8
van Damme, R., Rodenburg, J., van Roij, R., and Dijkstra, M. (2019). Interparticle torques suppress motility-induced phase separation for rodlike particles. J. Chem. Phys. 150, 164501. doi:10.1063/1.5086733
van der Linden, M. N., Alexander, L. C., Aarts, D. G. A. L., and Dauchot, O. (2019). Interrupted motility induced phase separation in aligning active colloids. Phys. Rev. Lett. 123, 098001. doi:10.1103/physrevlett.123.098001
Vicsek, T., and Zafeiris, A. (2012). Collective motion. Phys. Rep. 517, 71–140. doi:10.1016/j.physrep.2012.03.004
Worlitzer, V. M., Ariel, G., Be’er, A., Stark, H., Bär, M., and Heidenreich, S. (2021). Motility-induced clustering and meso-scale turbulence in active polar fluids. New J. Phys. 23, 033012. doi:10.1088/1367-2630/abe72d
Worlitzer, V. M., Jose, A., Grinberg, I., Bär, M., Heidenreich, S., Eldar, A., et al. (2022). Biophysical aspects underlying the swarm to biofilm transition. Sci. Adv. 8, eabn8152. doi:10.1126/sciadv.abn8152
You, Z., Baskaran, A., and Marchetti, M. C. (2020). Nonreciprocity as a generic route to traveling states. Proc. Natl. Acad. Sci. U. S. A. 117, 19767–19772. doi:10.1073/pnas.2010318117
Keywords: active matter, swarming, biological physics, quantitative biology, bacterial collective motility, phase separation, physics of life, biofilms
Citation: Grobas I, Asally M and Polin M (2022) The dynamics of single-to-multi layer transition in bacterial swarms. Front. Soft. Matter 2:936779. doi: 10.3389/frsfm.2022.936779
Received: 05 May 2022; Accepted: 13 October 2022;
Published: 18 November 2022.
Edited by:
Jay X. Tang, Brown University, United StatesReviewed by:
Mingcheng Yang, Institute of Physics (CAS), ChinaYael Roichman, Tel Aviv University, Israel
Copyright © 2022 Grobas, Asally and Polin. This is an open-access article distributed under the terms of the Creative Commons Attribution License (CC BY). The use, distribution or reproduction in other forums is permitted, provided the original author(s) and the copyright owner(s) are credited and that the original publication in this journal is cited, in accordance with accepted academic practice. No use, distribution or reproduction is permitted which does not comply with these terms.
*Correspondence: Iago Grobas, aWFnby5ncm9iYXNAY2hjaC5veC5hYy51aw==