 Maryam Moraveji
 Azin Sadat
 Iris J. Joye
- Department of Food Science, University of Guelph, Guelph, ON, Canada
Gliadin due to its low water solubility is excellently suited to make biopolymeric nanoparticles through liquid antisolvent precipitation. These gliadin nanoparticles (GNPs) can be utilized to populate and stabilize interfaces. Gliadin, by nature a protein that carries a low charge, can be altered by deamidation. Deamidation effectively alters the physicochemical properties of gliadin through decreasing the protein’s isoelectric point (IEP). The objective of this study is to explore the effect of different degrees of deamidation on gliadin nanoparticle (interfacial) characteristics. Besides altering the physical stability of GNP suspensions, deamidation did alter the functionality of GNPs as interfacial agents. GNP behaviour at the air-water interface is substantially impacted by pH. Particles made with untreated and deamidated gliadin exhibited a greater tendency to adsorb and form strong viscoelastic films at the air-water interface and better foam structures closer to their IEP. The combination of SEM, confocal Raman microscopy and drop tensiometry provides unique insights in the dominant gliadin structures and interactions at the interfacial film. This study provides crucial insights into the potential of deamidation to tailor gliadin and GNP properties for specific food applications.
1 Introduction
Gliadin, the so-called monomeric protein fraction of wheat gluten, is primarily composed of non-polar amino acids and contains only a very low fraction of charged amino acids, resulting in a very low solubility in water. Based on the low water solubility of gliadin, colloidal protein particles can be easily made using gliadin by a process referred to as liquid antisolvent precipitation (LAS). LAS relies on decreasing the solvent quality of the liquid in which the biopolymer is present. The addition of an antisolvent causes supersaturation of the biopolymer in the liquid phase, which drives nucleation and eventually particle growth (Joye et al., 2015a). Gliadin nanoparticles (GNPs) can, hence, be conveniently made utilizing water as the antisolvent. In a previous study it was shown that GNPs are unstable against aggregation around pH 7.0–9.0, and/or upon increasing the ionic strength and temperature of the GNP dispersion (Joye et al., 2015a). Modifications to gliadin or GNPs are needed to improve nanoparticle stability. Deamidation of neutral glutamine and asparagine residues in gliadin results in the introduction of more of the negatively charged glutamic acid and aspartic acid residues (Wang et al., 2017). As such, the protein’s isoelectric point (IEP) will decrease to a more acidic pH value. Wang et al. (2019) found that deamidation of gliadin indeed shifts the IEP from pH ∼ 6.5 to around pH ∼ 4.5. The newly introduced negative charges will not only alter the solubility of gliadin in water, it will also affect the stability of the formed GNPs against aggregation.
Colloidal protein nanoparticles show promise for use as interface-stabilizing structures in food emulsion and foam applications (Peng et al., 2018; Petker et al., 2021). In a paper by Wouters and colleagues (2019) the foaming and air-water interfacial properties of GNPs were investigated while used individually and in combination with zein nanoparticles. One of the key findings of this study was that GNPs effectively stabilized foam structures. A similar observation was made by Peng et al., 2017, Peng et al., 2018. More precisely, exceptional foam stability and an interfacial film with high surface dilatational viscoelastic moduli were found for GNP suspensions at pH values close to gliadin’s IEP; i.e., ∼ pH 6.5. At pH 4.5, however, a highly relevant pH in food applications, the foam stability was weak, and the films had significantly lower surface dilational moduli (Wouters et al., 2019). Wouters and colleagues (2019) postulated that a higher aggregation tendency of proteins at the interface could improve foamability and foam stability due to the formation of a stronger viscoelastic network at the interface (Wouters et al., 2019). This result was also confirmed by Petker and colleagues (2021) that studied the effect of glutaraldehyde crosslinking of gliadin molecules in GNPs on the particle behavior at interfaces. They found that gliadin’s higher mobility in the untreated particles likely allowed the (partial) disintegration of the colloidal particles at the interface, followed by the formation of a more smooth and stronger protein network at the interface. As such, GNPs can almost be seen as a convenient way of delivering (water-insoluble) gliadin to the air-water interface after which GNPs ‘melt’ at the interface, and the proteins and particle remnants (if any) fulfill their interface-stabilizing role. Deamidation of gliadin will alter the way how the proteins are interacting with each other, not only within and in between the particles, but also how these particles and proteins will populate and stabilize an interface. To date, no study investigating the impact of deamidation on the foaming and air-water interfacial behaviour of GNPs has been published. As this information is crucial in light of fully exploring the potential of these particles for building and stabilizing food structure, this topic is the focus of this study.
2 Materials and methods
2.1 Materials
Commercial wheat gluten was purchased from Bulk Barn (Bulk Barn Foods, Guelph, ON, Canada). All chemicals, reagents and solvents were purchased from Fisher Scientific (Mississauga, ON, Canada) and of analytical grade.
2.2 Preparation of gliadin extract
Gliadin was extracted from commercial vital wheat gluten with EtOH 70% (v/v) as described by Joye (2015a). In short, EtOH 70% (v/v) was prepared by mixing 1.47 L EtOH (95% (v/v)) with deionized (DI) water to a total mixture volume of 2.00 L. Gliadin was extracted from wheat gluten by slowly suspending 100 g of gluten powder in 400 ml 70% (v/v) EtOH, followed by stirring for 2 h in a beaker at 500 rpm. Then, the suspensions were centrifuged for 10 min at 10000 g using an Allegra X-15R centrifuge (Beckman Coulter Inc., Indianapolis, IN, United States). The supernatants were filtered using Q5 Fisherbrand paper filters (Thermo Fisher Scientific, Mississauga, ON, Canada). The filtrates were then kept overnight in the fridge at 4°C to allow insoluble material to sediment, prior to being centrifuged (10000 g for 10 min) and filtered (using Q5 Fisherbrand paper filters) for a second time. The clear supernatant containing the gliadin protein fraction was collected. The liquid extract was eventually concentrated by rotary evaporation at 40°C (50–150 mbar) to remove the ethanol and subsequently freeze-dried. The freeze-dried gliadin powder had a protein content of approximately 90% by weight.
2.3 Deamidation of gliadin
Deamidation was conducted according to the previously published method of Wang and colleagues (2019). Freeze-dried gliadin containing 90% (w/w) protein (dry basis) was mixed with tartaric acid (800 mM) to a final protein concentration of 5.0% (wp/v) and left to hydrate for 1 h at room temperature under continuous stirring. The acidic gliadin suspension was then incubated in a shaking water bath at 70°C for 1, 2, 4, 6, 8, and 16 h to obtain different degrees of deamidation. The deamidated gliadin (DG) was then dialyzed for 24 h against deionized water to remove residual tartaric acid with a regenerated cellulose membrane (Spectrum™ Spectra/Por™ 6000–8000 Dalton MWCO) and freeze-dried. The powdery samples deamidated for 1, 2, 4, 6, 8, and 16 h were labeled as DG-1, DG-2, DG-4, DG-6, DG-8, and DG-16, respectively.
2.4 Size distribution and ζ-potential measurement
The size distribution of the protein and nanoparticle samples was determined using dynamic light scattering (DLS). Data are reported as average particle diameters and polydispersity indices (pdi). The ζ-potential was determined by particle Doppler electrophoresis (Ζetasizer Nano ZS series, Malvern Instruments, Worcestershire, United Kingdom). All measurements were carried out at 25°C. The dispersant phase viscosity was set as 0.8872 cP, and the refractive index to 1.330 for the analysis. The laser wavelength was 633 nm, the measuring angles were 13 and 173°.
2.5 Size exclusion high performance liquid chromatography
Samples with a final protein concentration of 1.0 mg/ml were prepared in 50 mM sodium phosphate buffer (pH 6.8) containing 2.0% (w/v) SDS. The separation of the proteins was performed using a Yarra S4000 column (Phenomenex, Torrance, United States) on a modular LC-10 HPLC system (Shimadzu, Kyoto, Japan). The detector wavelength was set at 214 nm and the injection volume for the extracts was 20 μl. The mobile phase was 50 mM sodium phosphate buffer (pH 6.8) containing 2.0% (w/v) SDS. The separation was conducted at a constant flow rate of 1.0 ml/min and the column oven was set at 30°C. The separation over the column took 20 min.
2.6 Preparation of nanoparticles through liquid antisolvent
Native gliadin (NG) and DG solutions (3.0%; wp/v) were produced by dissolving freeze-dried NG, DG-1, DG-2, and DG-4 in EtOH 70% (v/v), and DG-8 and DG-16 in EtOH 60% (v/v). The DG proteins with the highest degree of deamidation were not freely soluble in the high ethanol concentration [70% (v/v)] and the ethanol concentration was lowered [60% (v/v)] to ensure full solubilization. Nanoparticle suspensions were prepared using a LAS method (Joye et al., 2015a). In short, the gliadin solutions were poured into deionized water at a 1:5 volume ratio and stirred in a beaker at 440 rpm for 2 min at room temperature. The resulting GNP suspensions had a final protein concentration of 0.5% (wp/v) and an ethanol concentration of 11.7 (NG, DG-1, DG-2 and DG-4) or 10.0% (v/v) (DG-8 and DG-16). This small difference in ethanol concentration was previously shown not to alter the particle properties (Corradini et al., 2017).
2.7 Particle stability measurements
2.7.1 Particle pH Stability
NG and DG particle suspensions with final concentration of 0.5% (wp/v) were produced through the method described in Section 2.6. The particle suspensions were dialyzed for 24 h against deionized water to remove residual ethanol with a regenerated cellulose membrane (Spectrum™ Spectra/Por™ 6000–8000 Da MWCO). After dialysis, the pH was adjusted to 2.0–9.0 using 0.1 M NaOH and 0.1 M HCl and left to stand at room temperature for 24 h prior to further analysis. The particle size (distribution) and ζ-potential of these samples were then determined 24 h after adjustment of the pH.
2.7.2 Particle ionic strength stability
Native and deamidated GNP suspensions with final concentration of 1.0% (wp/v) were produced through the method described in Section 2.6. Freshly produced particle suspensions [1.0% (wp/v) in EtOH 11.7% (v/v) for NG, DG-1, DG-2 and DG-4, and EtOH 10% (v/v) for DG-8 and DG-16] were diluted with NaCl solutions to obtain a final protein concentration of 0.5% (wp/v) nanoparticles and 1.0, 5.0, 10.0, 20.0, and 30.0 mM NaCl. Native and deamidated GNP suspensions were also diluted with deionized water as control. The samples were first vigorously mixed in test tubes and then shaken for 2 min at 500 rpm. The particle size (distribution) and ζ-potential of these samples were then determined 24 h after adjustment of the ionic strength.
2.7.3 Particle thermal stability
Native and deamidated GNP suspensions with protein concentration of 1.0% (wp/v) were produced and subsequently diluted with deionized water to obtain a final protein concentration of 0.5% (wp/v). The diluted particle suspensions were transferred into test tubes, vortexed and incubated in a water bath for 30 min set at 30, 60 or 90°C. The samples were left to stand at room temperature for 24 h after the thermal incubation after which the size (distribution) was measured. The size (distribution) of the diluted particles was measured and compared before and after incubation.
2.8 Surface rheology
Drop shape tensiometry was used to determine the interfacial tension and dilational viscoelastic moduli for GNP dispersions at air-water interfaces (Tracker, IT Concept, Longessaigne, France). This technique calculates the interfacial tension by fitting the Young-Laplace equation (Benjamins et al., 1996). The surface dilational modulus (E) is derived from the interfacial tension (γ) response to sinusoidal changes in the droplet surface area (A) (Lucassen-Reynders et al., 2010):
Where E is a complex number which consists of a real dilational elastic component (E′), and an imaginary viscous component (E″), where the viscous component is given by the product of the dilational viscosity (ηd) and the angular frequency of the area fluctuations wave (ω) (Benjamins et al., 1996, Benjamins et al., 006):
Prior to measurements of the air-water interfacial behaviour, freshly made GNP suspensions 0.5% (wp/v) were dialyzed for 24 h against deionized water to remove residual ethanol with a regenerated cellulose membrane (Spectrum™ Spectra/Por™ 6000–8000 Dalton MWCO). The suspension pH was then adjusted to 4.0, 4.5, 5.0, 5.5, and 6.0 using 0.1 M HCl and 0.1 M NaOH under continuous stirring. The GNP suspensions were loaded in a 25 μl syringe, and a pendant drop with a fixed volume of 7 μl was formed at the syringe tip in an empty quartz cuvette. The surface tension of the pendant drop was measured for 15 min while the drop volume was sinusoidally oscillated with an amplitude set to 1.0 μl at 0.2 Hz. The sinusoidal oscillations were performed with 5 active cycles followed by 5 blank cycles. Oscillatory measurements took place every 50 s for 5 min (Wouters et al., 2020).
2.9 Measurement of foaming characteristics
Foams produced with native and deamidated GNP suspensions [0.5% (wp/v)] were monitored for 7 h after formation. Foams were produced by vigorously stirring 15 ml of the GNP suspensions. The pH of the particle suspensions was adjusted prior to stirring to pH 4.0, 4.5, 5.0, 5.5 and 6.0. The stirring was carried out in a 250 ml graduated glass cylinder (internal diameter 2.0 in.) for 2 min at a stirring speed of 2,000 rpm using an overhead propeller. After stirring, the propeller was immediately removed and the glass cylinder sealed with Parafilm M (Bemis, Neenah, WI, United States) to avoid foam disruption by air circulation. Foam volume was measured 2, 4, 10, 15, 30, 45, 60, 120, 240 and 420 min after the start of stirring (Wouters et al., 2020).
Foamability (FA) was calculated by comparing the foam volume obtained at 2 min of vigorous stirring (V2) to the initial liquid volume of the studied suspensions (i.e., 15 ml). Foam stability (FS) was determined by comparing the foam volume at 60 min (V60) to the initial foam volume of samples measured after 2 min of vigorous stirring (V2) in a 250 ml graduated cylinder using a high-speed overhead stirrer (Peng et al., 2016):
2.9.1 Cryogenic scanning electron microscopy
Visualization of structures at the air-water interface of foams produced from NG and DG-4 particle suspensions at a protein concentration of 0.5% (wp/v) at pH 4.0 and 6.0 was conducted by cryogenic scanning electron microscopy (cryo-SEM) imaging. Foams were produced as described in Section 2.9. Foam aliquots were immediately after production placed in a sample holder and dipped in liquid nitrogen. The frozen samples were then transferred to the sample preparation chamber of a Quorum (Quorum Technologies, Laughton, United Kingdom) PP3010 cryo-unit, in which the frozen foams were fractured using an iced knife. Ice was removed by sublimation during 10 min at −90°C and the resulting surface was sputter coated with Pd/gold combination for 1 min at 10 mA which would result in a ∼4 nm coating on the samples. Samples were then transferred to an FEI [Field Electron and Ion Company (Thermo Fisher Scientific), Hillsboro, OR, United States] Quanta Field Emission Gun 250 SEM device. Images were obtained at an acceleration voltage of 20 kV.
2.9.2 Confocal Raman microscopy
Confocal Raman microscopy (CRM) was conducted on freshly produced foam samples that were dried and stuck to the microscope slide using compressed air. Raman mapping of foam samples was carried out with a WITec alpha300R microscope (Witech, Ulm, Germany) equipped with an ultra-sensitive EMCCD detector and 532 nm solid state diode laser excitation source. The Raman scattered light from the sample was collected using a 50x objective in the backscattering geometry onto a 600 groove/mm grating. The sample was brought to focus under the microscope to select an appropriate area and the selected area was then scanned to obtain an average Raman spectrum. The image scan function was set to 100 scans per line and 100 lines per image, using 15 mW laser power and 0.1 s integration time. The raw spectra were corrected using cosmic ray removal (filter size 4, dynamic factor 8) and background subtraction (polynomial order 0). The disulfide bridge region (490–550 cm−1), and tyrosine (Tyr) ring vibration/doublet band [I850/I830] were then analyzed. The disulfide bridge region (490–550 cm−1) was subjected to deconvolution to detect and quantify the percentage distribution of the SS bond conformations [gauche-gauche-gauche (SSg-g-g), trans-gauche-gauche (SSt-g-g), and trans-gauche-trans (SSt-g-t)]. The peak shapes were approximated by a Gaussian function, using OriginPro 2020 software (OriginLab Corporation, Northampton, MA, United States).
2.10 Statistical analysis
Samples were prepared in triplicate for each measurement (unless stated otherwise). The significance of the results was assessed using a one-way analysis of variance (ANOVA), followed by Tukey’s post hoc test at p < 0.05. Statistical analysis was conducted with GraphPad Prism 9.0.0.
3 Results and discussion
3.1 Protein characterization
3.1.1 Surface charge
After deamidation, the ζ-potential of the native (NG) and a selected set of deamidated (DG) gliadin samples was studied in function of pH (Supplementary Figure S1). At and above pH 4.0, the ζ-potential values of NG are significantly more positive than those recorded for the studied DG samples (p < 0.05). For DG-2 the ζ-potential becomes 0 mV at a pH of ∼5.5, while the pH at which the ζ-potential of DG-6 is 0 is ∼4.5. The results show a clear and progressive effect of the deamidation duration on the shift in IEP. The shift in IEP is due to the conversion of uncharged glutamine and asparagine in glutamic and aspartic acid, respectively (Wang et al., 2019).
3.1.2 Gliadin molecular weight
Relatively more lower molecular weight fractions are present in the DG samples compared to the NG samples (Supplementary Figure S2) pointing to potential protein hydrolysis during deamidation. Furthermore, besides the increasing fraction of low molecular weight components, a clear decrease in the overall chromatogram signal intensity as a function of deamidation time was observed (results not shown). Absorbance at 214 nm is commonly used to detect peptide bonds (Buck et al., 1989). The observed decrease of the overall chromatogram intensity suggests either that protein was lost during deamidation or that there are less peptide bonds present in the samples. Assuming that the protein concentration has not changed upon deamidation, this could suggest that deamidation indeed led to partial hydrolysis of gliadin and cleaving of the peptide bonds. It could be expected that heat treatment at 70°C for multiple hours in acidic conditions would result in limited hydrolysis of the protein. In addition, the small shoulder on the left side of the first peak for the DG samples could be indicative of some minor cross-linking between the proteins during the deamidation process (Supplementary Figure S2).
3.2 Particle formation and characterization
3.2.1 Particle size and ζ-potential
The effect of deamidation on the gliadin properties also affected the properties of GNPs. While native GNPs have an average particle diameter of 360 nm (pdi 0.248, measured in 5.8% (v/v) ethanol), deamidation of gliadin significantly decreased the average GNP particle diameter. The smallest average particle diameters were obtained for DG-1 (∼72 nm, pdi 0.285, measured in 5.8% (v/v) ethanol), DG-2 (∼63 nm, pdi 0.276, measured in 5.8% (v/v) ethanol) and DG-4 (∼62 nm, pdi 0.281, measured in 5.8% (v/v) ethanol) (Supplementary Figure S3C). Longer deamidation durations seemed to lead to increased average GNP diameters and pdi values (DG-8, ∼205 nm [pdi 0.602, measured in 5.0% (v/v) ethanol] and DG-16, ∼290 nm [pdi 0.644, measured in 5.0% (v/v) ethanol)] (Supplementary Figure S3C). The pH of the particle dispersions was ∼3.0–5.0. Deamidation alters the charge density on gliadin molecules, and will, hence, affect the water solubility of gliadin. This will result in altered particle formation kinetics and, eventually, altered particle diameters. A higher solubility will result in less efficient nucleation. The formed aggregates will probably be less numerous, and their matrix density will be reduced and particle diameter will be inflated. The larger particle sizes for the DG-8 and DG-16 and increased pdi values relative to the other DG samples are, hence, expected based on the anticipated higher solubility of these deamidated samples. The ζ-potential values of the GNPs largely followed the trends observed for the gliadin samples, with a progressive reduction in the IEP as a function of deamidation duration (Figure 1).
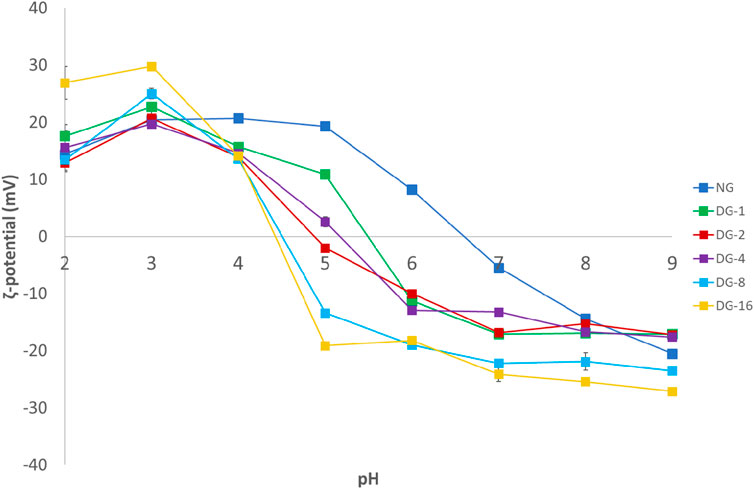
FIGURE 1. Particle ζ-potential measured 24 h after pH treatment in the pH range of 2.0–9.0. Particles were produced by liquid antisolvent precipitation [NG, native gliadin; DG-X, deamidated gliadin with different deamidation time X (x hours)].
3.2.2 Gliadin particle stability
The GNP stability at neutral pH values improved with deamidation, as indicated by smaller particle diameters and significantly higher absolute ζ-potential values (Figure 1; Supplementary Figure S3A). For all samples, however, the pdi seemed to increase as a function of pH (data not shown). DG generated nanoparticles stable at pH values between 7.0 and 9.0, while NG particles were highly unstable at pH 7.0 (Supplementary Figure S3A). As described above, a shift in the IEP from pH ∼6.5 for the native GNPs to pH ∼4.5 for the deamidated GNPs was observed. The aggregation (and ensuing precipitation) of native GNPs at pH ∼6.0–7.0 and deamidated GNPs at pH ∼4.0–5.0 followed this shift in IEP (Supplementary Figure S3A). Particle precipitation over the measurement time was also at the basis of the lower recorded diameters for DG-2 and DG-16 at pH 5.0. The ζ-potential values of deamidated GNPs at pH 7.0–9.0 were found to be between −13 and −27 mV with the ζ-potential approaching more negative values in samples with higher deamidation degrees. The high ζ-potential, in absolute values, can provide more repulsion between colloidal particles to maintain stability against aggregation. However, these │ζ-potential│ values did not exceed 30 mV, the absolute value of the ζ-potential that was related to colloidal stability of charged colloidal systems (Freitas & Müller, 1998) (Supplementary Figure S1).
GNP dispersions destabilize and particles precipitate under low ionic strength conditions. Even at salt concentrations as low as 10 mM NaCl in the continuous phase extensive particle aggregation was observed for GNPs (Joye et al., 2015a). This aggregation (and ensuing precipitation) affected the particle diameter measurement of e.g., the NG sample at 20 mM NaCl. Salt ions screen the surface charges on the particles and, hence, reduce the electrostatic repulsion between the particles promoting the formation of particle aggregates. Deamidation of gliadin slightly improved particle stability in salt concentrations up to 20 mM NaCl which was not only reflected in a lower average particle diameter increase, but also led to lower pdi values (Supplementary Figure S3B, pdi values not shown).
The instability of protein particles upon thermal treatments has been well-described before (Wu et al., 2018). A pronounced increase in the mean particle size (946 ± 14 nm) was indeed observed when the native GNP suspension was incubated for 30 min at 90°C, although the pdi values seemed unaffected (Supplementary Figure S3C, pdi values not shown). The increased temperature will likely increase the collision frequency and efficiency between particles (Wu et al., 2018) and may trigger proteins present within the particles to unfold and expose more of the previously buried hydrophobic patches (Wu et al., 2018). The increased collision frequency and efficiency, together with anticipated structural changes in the proteins may induce intense particle aggregation (Joye et al., 2015b). Deamidated GNPs, however, demonstrated a higher stability against temperature-induced aggregation even after treatment at elevated temperatures (90°C). The mean particle size of DG-1, DG-2, and DG-4 after incubation at 90°C was 79.0 ± 0.6, 70 ± 0.7, and 71 ± 0.1 nm, respectively, while the particles produced with DG-8 and DG-16 were slightly larger (i.e., 233 ± 2, and 189 ± 7 nm, respectively) (Supplementary Figure S3C). For none of the samples substantial changes in pdi values were observed over the temperature tested (data not shown). These results suggest that the negative charges introduced through deamidation can provide increased electrostatic repulsion between the particles, affecting the collision frequency and efficiency, hence, stabilizing the suspensions against aggregation induced by short-term thermal processing at pH 3.0–5.0.
3.3 Air-water interfaces
3.3.1 Interfacial tension
Monitoring the interfacial tension of freshly formed air-water interfaces using aqueous native and deamidated GNP dispersions (pH 4.0, 4.5, 5.0, 5.5, 6.0) revealed a progressive reduction of the interfacial tension as a function of time (Figure 2A). The reduction of interfacial tension originates from particle adsorption and possible post-adsorption rearrangement of the particles and/or constituting proteins at the interface. Surface tension plots approached a plateau but did not actually reach their equilibrium surface tension over the 15-minute measurement time for all GNPs (Figure 2A) indicating that the adsorption and rearrangements of the protein particles at the interface is a relatively slow process.
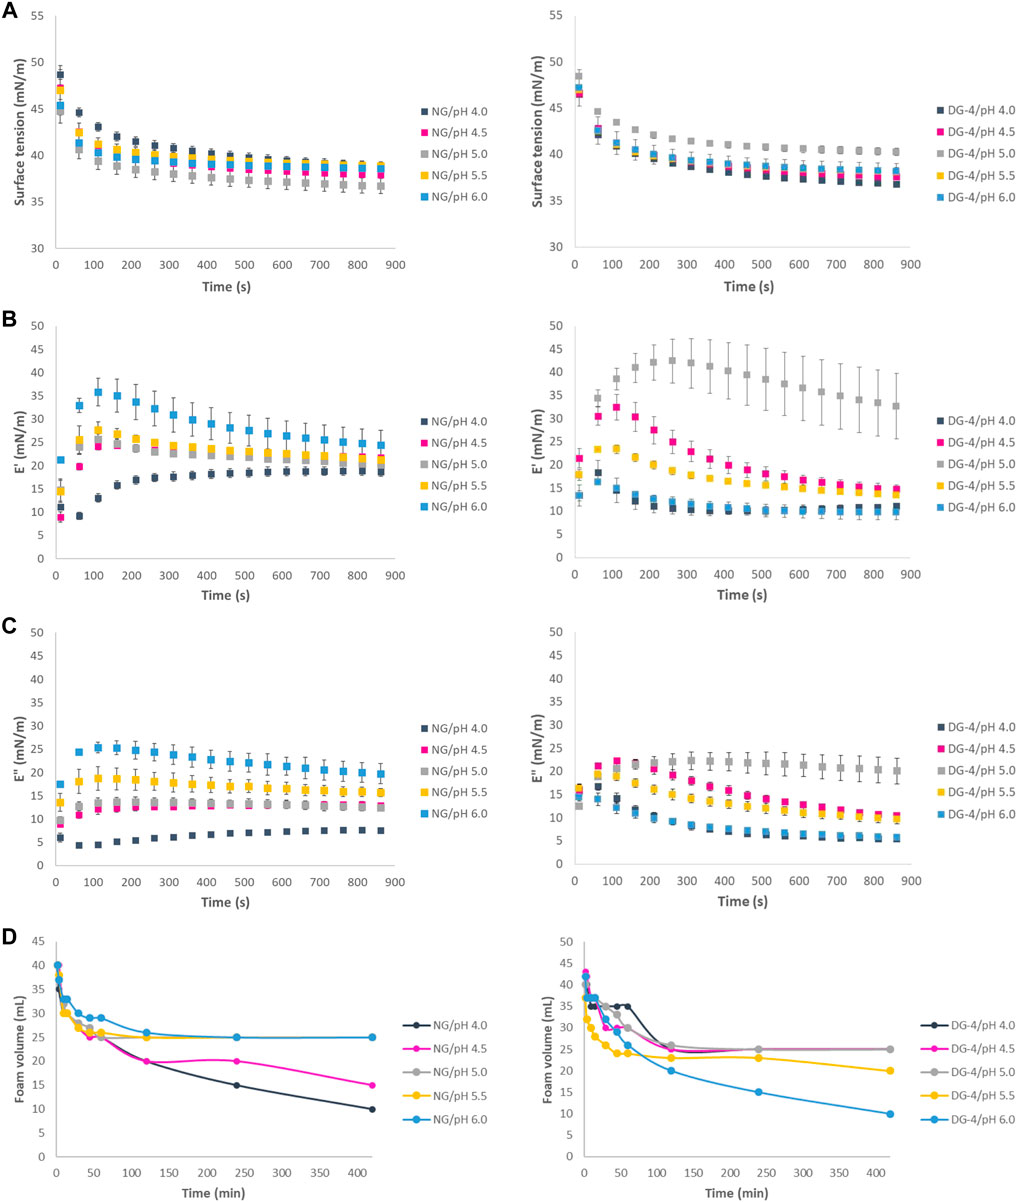
FIGURE 2. (A) Air-water interfacial tension of native (NG, left) and deamidated (DG, right) gliadin nanoparticle suspensions (0.5% (wp/v), (B) Interfacial elastic modulus of native (left) and deamidated (right) gliadin nanoparticle suspensions, (C) Interfacial viscous modulus of native (left) and deamidated (right) gliadin nanoparticle suspensions, (D) Foam volume of NG (left) and DG-4 (right) foams measured at pH values of 4.0, 4.5, 5.0, 5.5, and 6.0.
The measured surface tension value of native GNPs approximately 60 s after formation of the interface increased as the pH moved further from the GNP IEP (∼6.5) (Figure 2A). The increase of the surface tension as the pH reduces to more acidic values suggests that the higher charge density on the native GNPs at these pH values potentially slows down protein particle adsorption at the interface due to the repulsion between the particles and/or hinders proper particle or protein positioning at the interface. At higher pH values, i.e., pH 5.0, 5.5, and 6.0, as the native GNPs approach their IEP, their tendency to readily adsorb, interact and aggregate at the interface is higher, due to the lower net charge and interparticle electrostatic repulsion.
The surface tension values recorded for the deamidated GNPs (DG-1–4), as expected, were slightly higher than the values recorded for native GNPs at pH 6.0 and decreased slightly as the pH approached the IEP of deamidated gliadin (Figure 2A for DG-4 samples). The same results, however, were not obtained for DG-8 and DG-16 (Supplementary Table S1). The average value of surface tension at pH 6.0 at approximately 60 s after formation of the interface for DG-1, DG-2, and DG-4 was 46.52 ± 0.44 mN/m, 44.11 ± 0.75 mN/m, 42.59 ± 1.45 mN/m, respectively. The average surface tension of these samples decreased as the pH was reduced. At pH 4.0, the values of 41.31 ± 0.22 mN/m, 41.70 ± 1.83 mN/m, and 42.15 ± 0.14 mN/m were recorded for DG-1, DG-2, and DG-4, respectively. The reduction of the surface tension as the pH decreases suggests that at pH 4.0–4.5, the deamidated GNPs are more inclined to adsorb at the interfaces and form an interfacial layer. This observation aligns with the lower charge on the deamidated GNPs at pH 4.0, which is closer to their IEP.
3.3.2 Interfacial rheology
The elastic moduli of all GNP-stabilized interfaces were higher than the viscous moduli (Figures 2B,C), indicating that the interfaces that are formed are populated by a viscoelastic network of interfacial agents. Previous research (Petker et al., 2021) indeed already showed that native GNPs form viscoelastic layers at the air-water interface. The elasticity of the interface presumably stems from interparticle and intermolecular (in this case interprotein) interactions at the interface which give rise to a network-like structure surrounding the interface.
Besides a reduction in the surface tension, the pH effect also manifests itself in the interfacial viscoelastic parameters (Figures 2B,C). When the pH is closer to the IEP of the native GNPs, the attractive interparticle interactions are supposedly stronger (less dominated by electrostatic repulsion) and the elastic modulus E′ would, hence, be at its highest value. This is indeed reflected in the E′ values measured for the native GNP-populated air-water interfaces in this pH study (Figure 2B). These results are in agreement with findings of a recent study published by Wouters et al. (2020). Several other studies also reported that the interfacial behaviour of GNPs was strongly influenced by pH conditions (Peng et al., 2017; Wouters et al., 2019). Previous studies demonstrated that the surface dilational moduli for gliadin-stabilized interfaces were higher at pH 5.0–5.8 than those measured at pH 3.0 (Peng et al., 2017).
Different degrees of deamidation resulted in different behaviour of deamidated GNPs at interfaces as a function of pH. At pH 4.0, DG-16 demonstrated a higher elasticity than the other DG samples while at pH 5.0, DG-1, DG-2 and DG-4 showed pronouncedly higher elasticity than the other samples (Supplementary Table S2). It was observed that the elasticity of these samples increased in the first minutes and slightly decreased over time which could mean that an elastic film had been formed but the stability of the film against deformation through the oscillation is not high (Figure 2B). At pH 5.5, DG-1 and DG-2 displayed higher elasticity than native GNPs and DG-4–DG-16 nanoparticles. These observations were in line with the IEP shift of deamidated gliadin where they lean towards more acidic pH values as deamidation duration increased. The more pronounced hydrolysis at longer deamidation times would subsequently result in a higher solubility of the smaller (and more deamidated) protein in water and a decreased probability for (at least some of) the proteins to occupy the interface. Such variations would result in differences in their ability to form a strong viscoelastic interfacial film. At pH values further away from the IEP, the interparticle repulsion possibly hampers the formation of a particle and/or protein network at the interface. However, despite the presumed dominance of electrostatic repulsion, the ζ-potential of the native GNPs was below 30 mV which makes it possible to overcome this repulsion by other interaction types (Freitas & Müller, 1998). Interactions such as hydrogen or disulfide bonds and the hydrophobic effect can be vital to build an elastic interface. The viscoelastic film produced by deamidated GNPs did not show an as high stability against deformation as the films produced by native GNPs. Upon deamidation, the amide groups that were present in glutamine side chains and were possibly involved in hydrogen bonds in GNP, were removed and converted to COOH groups. These COOH groups are negatively charged at pH 4.0 (COO−, considering the glutamic acid side chain’s pKa is ∼2.10) and it is possible that the negative charges present at this pH lead to repulsion between the neighboring glutamic acid residues and partly inhibit building the elastic film at the interface. In addition, we can speculate that building an elastic film to stabilize the air-water interface might have involved hydrogen bonds between amide groups, and deamidation might have hindered the formation of these bonds by removing the amide groups on glutamine side chains.
3.4 Foamability and foam stability
The foamability (FA) and foam stability (FS) of native and deamidated GNP samples varied as a function of pH (Figures 2D, 3A,B). The FA of native GNPs was high over all the pH values (267%) tested, while the FA of deamidated GNP suspensions varied as a function of the degree of deamidation and pH (Figure 3A). At pH 4.0, the FA of all deamidated GNP samples was 267% except for DG-8 and DG-16. Increasing the pH to 4.5, the FA of DG-1, DG-2 were 280% and for DG-4 it was 287%.
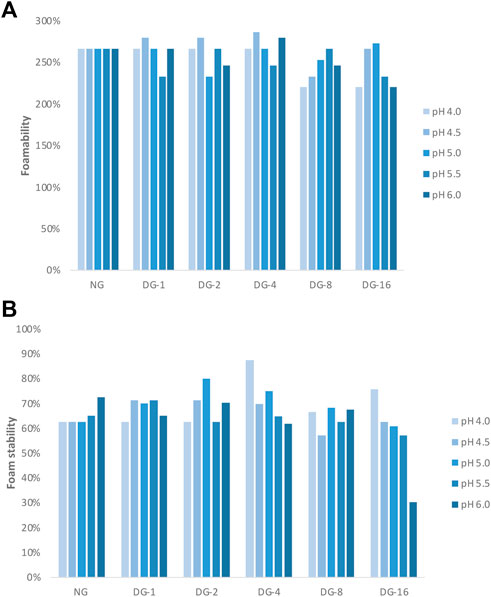
FIGURE 3. (A) Foamability and (B) foam stability of foams made with native and deamidated gliadin nanoparticle suspensions [0.5% (wp/v)] at pH 4.0, 4.5, 5.0, 5.5, and 6.0. [NG, native gliadin; DG-X, deamidated gliadin with different deamidation time X (x hours)].
The highest FS for native GNPs was observed at pH 6.0, while the deamidated GNPs produced the most stable foams at the lower tested pH conditions (Figure 3B). The FS of native GNP foams decreased from 73% (pH 6.0) to 65% (pH 5.5). The FS of native GNP, however, did not change that much at pH 4.0, 4.5, and 5.0 (63%) (Figure 3B). The FS of deamidated GNPs at pH 4.5 for DG-1, DG-2, and DG-4 was 70%–71% and DG-8 and DG-16 showed 57% and 63% FS, respectively. The FS of deamidated GNPs was lower than that of native GNP foams at pH 6.0, where the values of 65%, 70%, 62%, 68%, and 30% were observed for DG-1, DG-2, DG-4, DG-8, and DG-16 compared to 73% FS of native GNPs. Higher stability was observed for DG-8 and DG-16 at pH 4.0 which was in line with the tensiometry results. Nonetheless, DG-8 and DG-16 particles produced foams with comparatively low FS and FA, whereby destabilization already occurred 1 h after production of the foam especially at higher pH values (Figure 3B). For DG-8 and DG-16, a higher degree of hydrolysis due to the longer incubation of these samples at the high temperature in acidic conditions was expected relative to what was the case for DG-1–4. The observations obtained from the size exclusion high performance liquid chromatography (SE-HPLC) supported this more outspoken hydrolysis in the samples deamidated for longer times. The hydrolysis would then result in a higher solubility of the smaller (and more deamidated) protein in water and less tendency of (at least part of) the proteins to populate the interface. In addition, the lower MW of the DG-8 and DG-16 proteins may hamper their propensity to build a strong viscoelastic network at the air-water interface. We could speculate that such distinctions would lead to variations in FA and FS between the samples. In general, it seems that sample-pH combinations that recorded higher elastic moduli at the interface were also creating more stable foam structures. However, due to usage of high sample volumes for foam production, this experiment could only be conducted on one replicate and more extensive testing would be required to confirm and refine these observations.
3.5 Visualization of the air-water interface by cryogenic scanning electron microscopy
To better understand the interfacial behaviour of NG and DG-4 nanoparticles at pH 4.0 and 6.0, foam structures were visualized by cryo-SEM (Figure 4). The foam structure is unavoidably affected by the cryo-SEM sample preparation. The topography of the air-water interfaces was visible in the broken gas cell walls. Bubble bursting will have happened during the sample preparation which involved flash freezing of the foam structures. The interfaces in foams produced with native GNP dispersions at pH 4.0 and 6.0 slightly differed from each other (Figures 4A,C). At pH 4.0, the interfaces of native GNP foams appeared to be populated by aggregated nanoparticles that largely merged together (Figure 4A). At pH 6.0, however, there are visible strands on the interface which were most likely made of native GNPs that aggregated in a coherent network, but no remaining particle shaped structures were observed (Figure 4C). Similar images were captured by Wouters et al. (2020) for native GNPs at pH 6.0, but not at pH 4.0. They stated that native GNPs at pH 6.0 formed a smooth film made by either disintegrated particles at the interface or soluble protein in the water adsorbing at this interface. However, at pH 4.0, they observed an interface with visible particle structures placed far from each other on a smooth surface which was not the case in this study. However, the time the interfacial films got to “cure” prior to the freezing step of this experiment would play a crucial role in the film’s properties and appearance. These SEM observations were in line with native GNPs at pH 6.0 repelling each other less due to an overall lower surface charge. Due to the reduced repulsion, the particles could be interacting more tightly and form a coherent adsorbed particle/protein film layer at the interface. Native GNPs at pH 4.0, conversely, are more likely to repel each other and will, hence, not be able to form an evenly strong viscoelastic and smooth interface. The foams produced by DG-4 particle dispersions, however, did not demonstrate as substantial differences at pH 4.0 and 6.0 (Figures 4B,D). At pH 4.0, the interface appeared to be smoother than at pH 6.0, yet the effect is not as outspoken as what is observed for native GNPs. The produced film composed of DG-4 nanoparticles at pH 4.0 exhibits a roughly even surface where no particulate material could be distinguished (Figure 4B). This could suggest that protein-protein interactions led to the formation of a smooth protein network at the interface. At pH 6.0, however, particle-shaped structures could still be distinguished in the film (Figure 4D). These observations agree with the low surface dilational moduli and poor FS of DG-4 at pH 6.0 where the particles carry negative charges and tend to repel each other and are, hence, less able to form a coherent, viscoelastic film upon adsorption at the interface.
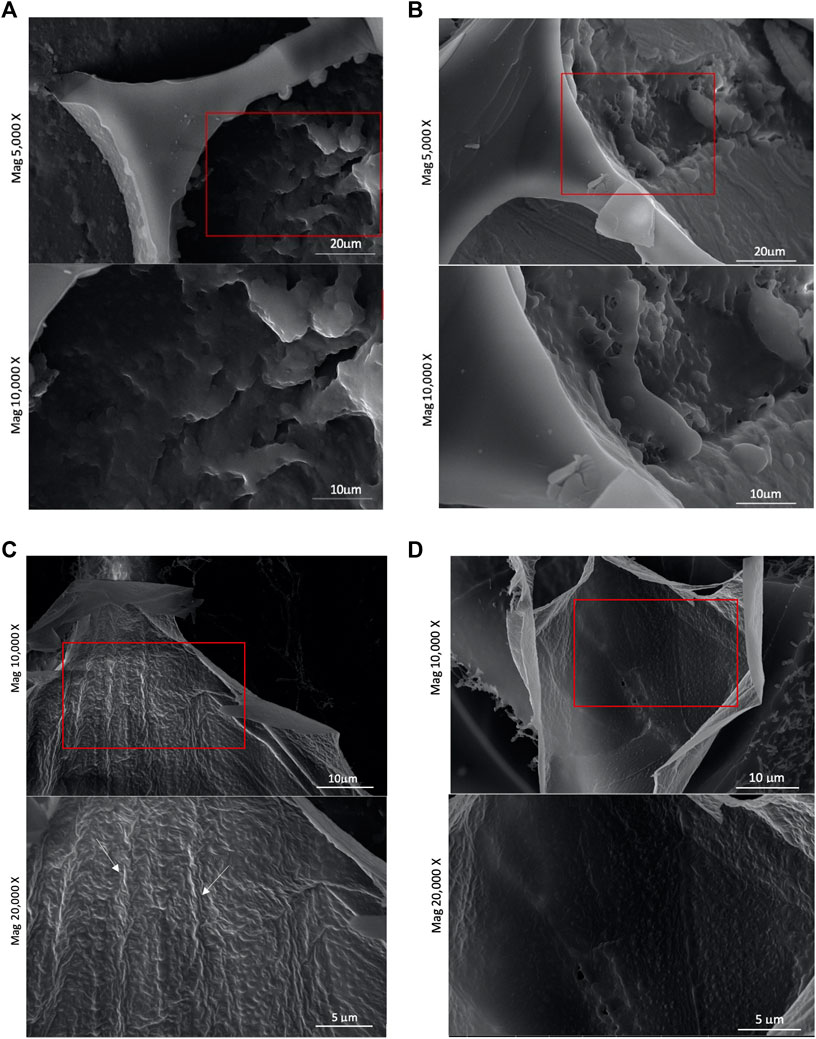
FIGURE 4. (A) Cryo-SEM micrographs of interfacial structure of foam produced with a native gliadin nanoparticle suspension [0.5% (wp/v)] at pH 4.0. (B) Cryo-SEM micrographs of interfacial structure of foam produced with a deamidated gliadin (DG-4) nanoparticle suspension at pH 4.0, (C) Cryo-SEM micrographs of interfacial structure of foam produced with a native gliadin nanoparticle suspension at pH 6.0, (D) Cryo-SEM micrographs of interfacial structure of foam produced with a deamidated gliadin nanoparticle suspension (DG-4) at pH 6.0.
3.6 Interactions at air-water interface as studied by confocal Raman microscopy
Raman spectra were used to study the changes in the disulfide bridge conformations and the Tyr environment of NG and DG-4 at the interface (Figure 5). These submolecular insights will provide insight into what happens at the interface after particle adsorption.
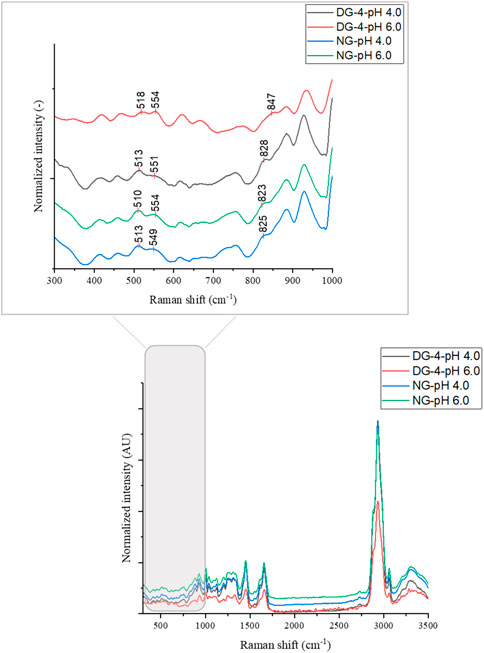
FIGURE 5. Raman spectra of native (NG) and deamidated (DG-4, deamidated for 4 h) gliadin nanoparticles at different pH values.
3.6.1 Changes in disulfide bridge conformations
The disulfide bond region (490–550 cm−1) was subjected to deconvolution in order to detect the different conformations of disulfide bridges (Supplementary Figure S4) (Zhou et al., 2014). Three different disulfide conformations can be found in this region, i.e., SSg-g-g (496–513 cm−1), SSt-g-g (514–527 cm−1), and SSt-g-t (527–548 cm−1) (Pfeuti et al., 2019). The Raman scatter spectra of NG foam at pH 4.0 showed two bands. These were located at 510 cm−1 (SSg-g-g) and 548 cm−1 (SSt-g-t) (Table 1, Supplementary Figure S4). The proportion of the g-g-g, and t-g-t conformation for the NG foam at pH 4.0 was 42% and 58%, respectively (Table 1). However, NG foams at pH 6.0 showed only one band at 510 cm−1 (SSg-g-g) which constituted 100% of the detected SS bonds (Table 1, Supplementary Figure S4). This indicated that at pH 6.0, there are strong and stable disulfide bonds present at the air-water interface formed by NG particles, while at pH 4.0, approximately more than half of the SS bonds were adopting the t-g-t conformation, a weaker conformation of SS bonds. The g-g-g disulfide conformation is the most stable form, and the more trans-linkages a disulfide bond contains, the less energetically stable it becomes (Pfeuti et al., 2021).
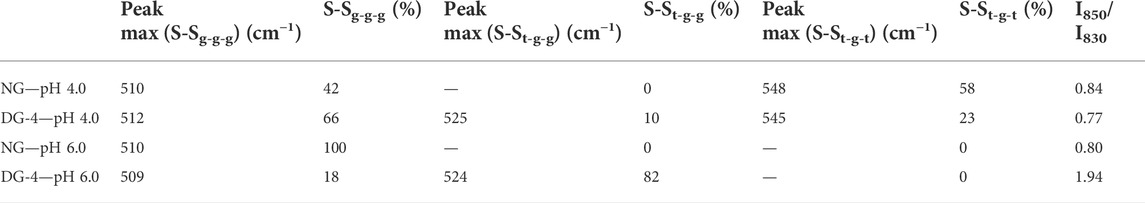
TABLE 1. Proportion (%) of disulfide bridge conformations [gauche-gauche-gauche (SSg-g-g), trans-gauche-gauche (SSt-g-g), and trans-gauche-trans (SSt-g-t)] and analysis of aromatic amino acid environment- Tyr [I850/I830- of the Raman spectra for native and deamidated gliadin foam samples (0.5% (wp/v)] at pH 4.0 and 6.0. [NG, native gliadin; DG-X, deamidated gliadin with different periods of deamidation time X (x hours)].
Foams that were produced with DG-4 NPs, displayed three Raman peaks at 512 cm−1 (SSg-g-g), 525 cm−1 (SSt-g-g) and 545 cm−1 (SSt-g-t) at pH 4.0. The proportions of the g-g-g, t-g-g, and t-g-t conformation were 66%, 10%, and 23%, respectively. For DG-4 foams at pH 6.0, the proportion varied, wherein, 82% was allocated to the t-g-g conformation and the remaining 18% was in the g-g-g conformation. The detected bands were located at 509 cm−1 (SSg-g-g) and 524 cm−1 (SSt-g-g). It appears that there are strong SS bonds at the air- water interface stabilized by the DG-4 NPs at pH 4.0, along with weaker bonds, while at pH 6.0, almost 80% of the disulfide bonds at the interface are in a moderately unstable conformation.
The detection of a disulfide signal in the Raman spectra focusing on the foam interfaces suggests that an important role is reserved for disulfide bonds in foam stabilization. A similar result was acquired by Wouters (2020) where he and his colleagues observed a high content of disulfide bonds in the foam fraction of foams produced by GNPs at pH 6.0. The higher level of g-g-g conformation found for native GNPs at pH 6.0 of all samples studied suggests that disulfide bonds are in their most stable, lowest energy state present in these samples, which can probably be attributed to the reduced electrostatic repulsion between the particles and proteins that would twist the disulfide conformation in a less relaxed state. The disulfide observations are in line with the dilational moduli of native GNPs at pH 6.0, also the pH with the highest elastic and viscous moduli of the interfacial film.
3.6.2 Changes in Tyr environment
Gliadin contains roughly 1% Tyr and being partially hydrophobic, Tyr prefers to be buried in the hydrophobic protein core. The Tyr doublet bands at 830 and 850 cm−1 in the Raman spectra are useful for assessing the microenvironment around Tyr residues. Tyr doublet bands report on the vibration of the Tyr ring structures (Yada & Jackman, 2012). The intensity ratio of the Tyr ring vibrations at 850 and 830 cm−1 (I850/I830) is proportional to the number of “exposed” vs. “buried” Tyr residues in the sample and can be used as an indication of the phenol hydroxyl group’s hydrogen bonding capability. If I850/I830 > 1, the Tyr residues are most likely positioned on the protein’s surface, and the phenolic OH will be both an acceptor and donor of moderate to weak hydrogen bonds. If I850/I830 < 1, the Tyr residues are likely to be entirely or partially buried inside the protein structure, and the phenolic hydroxyl functions as the proton donor in a strong hydrogen bond (Yada & Jackman, 2012). The value of I850/I830 of all the samples were lower than 1, except for the value found for DG-4 at pH 6.0 (I850/I830 = 1.94). The I850/I830 value of NG foams at pH 4.0 was 0.84 which was slightly higher than the value obtained for NG foams at pH 6.0 (0.80). This suggests that in NG, the Tyr ring was buried inside the protein structure at both pH 4.0 and 6.0, implying that the Tyr ring was involved in hydrogen bonds within the protein and particle structure (Sadat et al., 2022).
The high I850/I830 ratio suggests that at pH 6.0, the deamidated GNPs’ Tyr residues are more exposed on the protein surface which can be explained by the high density of net negative charges present in this sample, while at pH 4.0, a much lower value (I850/I830 = 0.77) was observed that could be due to less electrostatic repulsion so close to the IEP of DG-4 and the associated formation of a more tightly folded structure burying the Tyr residues in the hydrophobic interior of the protein/particle film structure. Considering the gliadin structure with repetitive domains of glutamine residues, upon deamidation, the newly formed glutamic acid residues will carry negative charges on the R-group’s carboxyl group (pKa 2.10). The net negative charge on the deamidated proteins will increase with pH and the increased repulsion between the protein’s glutamic acid R-groups will open the protein structure and allow more exposure of the inner protein core to the hydrophilic/aqueous environment. At pH 6.0, relative to pH 4.0, more negative charges will have been introduced in the deamidated gliadin structure, resulting in even more repulsion between the R-groups of the protein in the protein and particle structure.
4 Conclusion
Deamidation was successfully conducted on gliadin, and GNPs were subsequently prepared through the LAS precipitation method. GNPs made with deamidated gliadin displayed an improved overall stability in for food processing-relevant conditions such as exposure to high temperatures, elevated ionic strength, and acidic pH. Deamidation caused a shift in the IEP of gliadin from pH 6.5 to pH 4.5 attributed to the increased level of negative charges introduced in the protein structure. At higher pH values around pH 6.0, closer to their IEP, native GNPs exhibited a greater tendency to adsorb, interact, and aggregate at air-water interfaces relative to what was observed at pH 4.0. Over the pH range of 4.0–6.0, the difference in interfacial behaviour of deamidated GNPs was not as pronounced as that of native GNPs. Although deamidated GNPs also produce a viscoelastic network at the air-water interface, it is not as stable against deformation as the network generated by native GNPs. At pH 4.0, the deamidated GNPs with the longest deamidation time had the maximum viscoelasticity, and as the deamidation time decreased, the pH at which the deamidated GNPs formed a viscoelastic network with the highest viscoelastic moduli increased. Despite the predicted dominance of electrostatic repulsion in governing the protein-protein and particle-particle interactions, the absolute value of the ζ-potential of the native and deamidated GNPs over the studied pH range (pH 4.0–6.0) was less than 30 mV, allowing other interaction types to overcome this repulsion. Interestingly, CRM analysis of the foam structures revealed that disulfide bonds were present at the air-water interface and that less open interfacial protein structures were present close to the IEP. In conclusion, deamidation did affect the physicochemical properties of gliadin and the functionality of the GNPs to form and stabilize air-water interfaces and foams. The here obtained results support earlier observations that GNPs (partially) disintegrate at air-water interfaces to form a viscoelastic film, which is “smoother” closer to the IEP of the proteins. The diversification in gliadin properties induced by deamidation makes this a promising avenue to tailor gliadin and GNP properties for specific food applications. However, more studies are needed to fully understand the effect of deamidation and the fate of GNPs once they adsorb at an air-water interface.
Data availability statement
The raw data supporting the conclusions of this article will be made available by the authors, without undue reservation.
Author contributions
MM: Gliadin deamidation/particle production and characterization/interfacial and foam studies: Formal analysis, investigation, methodology, validation; confocal Raman microscopy: Formal analysis; data curation; visualization; and Writing—original draft. AS: confocal Raman microscopy: Formal analysis, investigation, methodology, validation; and Writing—review and editing. IJ: Conceptualization; methodology; funding acquisition; resources; supervision; visualization; writing—review and editing.
Acknowledgments
The authors acknowledge the Ontario Ministry of Research and Innovation Early Researcher Awards Program (grant number: ER17-13-059) and the Natural Sciences and Engineering Research Council of Canada Discovery Program for funding this work. They are grateful to Katherine Petker for her help with gliadin extraction and Fernanda Peyronel for her assistance in acquiring cryo-SEM images.
Conflict of interest
The authors declare that the research was conducted in the absence of any commercial or financial relationships that could be construed as a potential conflict of interest.
Publisher’s note
All claims expressed in this article are solely those of the authors and do not necessarily represent those of their affiliated organizations, or those of the publisher, the editors and the reviewers. Any product that may be evaluated in this article, or claim that may be made by its manufacturer, is not guaranteed or endorsed by the publisher.
Supplementary material
The Supplementary Material for this article can be found online at: https://www.frontiersin.org/articles/10.3389/frsfm.2022.937152/full#supplementary-material
References
Benjamins, J., Cagna, A., and Lucassen-Reynders, E. H. (1996). Viscoelastic properties of triacylglycerol/water interfaces covered by proteins. Colloids Surfaces A Physicochem. Eng. Aspects 114, 245–254. doi:10.1016/0927-7757(96)03533-9
Benjamins, J., Lyklema, J., and Lucassen-Reynders, E. H. (2006). Compression/expansion rheology of oil/water interfaces with adsorbed proteins. Comparison with the air/ water surface. Langmuir 22 (14), 6181–6188. doi:10.1021/la060441h
Buck, M. A., Olah, T. A., Weitzmann, C. J., and Cooperman, B. S. (1989). Protein estimation by the product of integrated peak area and flow rate. Anal. Biochem. 182 (2), 295–299. doi:10.1016/0003-2697(89)90597-6
Corradini, M. G., Demol, M., Boeve, J., Ludescher, R. D., and Joye, I. J. (2017). Fluorescence spectroscopy as a tool to unravel the dynamics of protein nanoparticle formation by liquid antisolvent precipitation. Food Biophys. 12, 211–221. doi:10.1007/s11483-017-9477-4
Freitas, C., and Müller, R. H. (1998). Effect of light and temperature on zeta potential and physical stability in solid lipid nanoparticle (SLN®) dispersions. Int. J. Pharm. 168 (2), 221–229. doi:10.1016/S0378-5173(98)00092-1
Joye, I. J., Nelis, V. A., and McClements, D. J. (2015a). Gliadin-based nanoparticles: Fabrication and stability of food-grade colloidal delivery systems. Food Hydrocoll. 44, 86–93. doi:10.1016/j.foodhyd.2014.09.008
Joye, I. J., Nelis, V. A., and McClements, D. J. (2015b). Gliadin-based nanoparticles: Stabilization by post-production polysaccharide coating. Food Hydrocoll. 43, 236–242. doi:10.1016/j.foodhyd.2014.05.021
Lucassen-Reynders, E. H., Benjamins, J., and Fainerman, V. B. (2010). Dilational rheology of protein films adsorbed at fluid interfaces. Curr. Opin. Colloid Interface Sci. 15 (4), 264–270. doi:10.1016/j.cocis.2010.05.002
Peng, D., Jin, W., Li, J., Xiong, W., Pei, Y., Wang, Y., et al. (2017). Adsorption and distribution of edible gliadin nanoparticles at the air/water interface. J. Agric. Food Chem. 65 (11), 2454–2460. doi:10.1021/acs.jafc.6b05757
Peng, D., Jin, W., Tang, C., Lu, Y., Wang, W., Li, J., et al. (2018). Foaming and surface properties of gliadin nanoparticles: Influence of pH and heating temperature. Food Hydrocoll. 77, 107–116. doi:10.1016/j.foodhyd.2017.09.026
Peng, W., Kong, X., Chen, Y., Zhang, C., Yang, Y., Hua, Y., et al. (2016). Effects of heat treatment on the emulsifying properties of pea proteins. Food Hydrocoll. 52, 301–310. doi:10.1016/j.foodhyd.2015.06.025
Petker, K., Rogers, M. A., and Joye, I. J. (2021). Chemical hardening of gliadin nanoparticles alters their oil-water interfacial behaviour. Food Struct. 30, 100218. doi:10.1016/j.foostr.2021.100218
Pfeuti, G., Brown, L. S., Erulin, A., Selim, K., Tavares Kütter, M., Bureau, D. P., et al. (2021). Trans-gauche-trans disulphide conformers measured by means of FT-Raman may be predictors of apparent digestibility of crude protein in feather meal fed to rainbow trout (Oncorhynchus mykiss). Animal Feed Sci. Technol. 274, 114829. doi:10.1016/j.anifeedsci.2021.114829
Pfeuti, G., Longstaffe, J., Brown, L. S., Shoveller, A. K., Taylor, C. M., &Bureau, D. P., et al. (2019). Disulphide bonds and cross-linked amino acids may affect amino acid utilization in feather meal fed to rainbow trout (Oncorhynchus mykiss). Aquac. Res. 50 (8), 2081–2095. doi:10.1111/are.14079
Rickey Y. Yada, and R. L. Jackman (Editors) (2012). Protein structure-function relationships in foods (Germany: Springer Science & Business Media).
Sadat, A., Corradini, M. G., and Joye, I. J. (2022). Vibrational and fluorescence spectroscopy to study gluten and zein interactions in complex dough systems. Curr. Res. Food Sci. 25 (5), 479–490. doi:10.1016/j.crfs.2022.02.009
Wang, Y., Gan, J., Zhou, Y., Cheng, Y., and Nirasawa, S. (2017). Improving solubility and emulsifying property of wheat gluten by deamidation with four different acids: Effect of replacement of folded conformation by extended structure. Food Hydrocoll. 72, 105–114. doi:10.1016/j.foodhyd.2017.04.013
Wang, Y., Yan, W., Li, R., Jia, X., and Cheng, Y. (2019). Impact of deamidation on gliadin-based nanoparticle formation and curcumin encapsulation. J. Food Eng. 260, 30–39. doi:10.1016/j.jfoodeng.2019.04.020
Wouters, A. G. B., Joye, I. J., and Delcour, J. A. (2020). Understanding the air-water interfacial behavior of suspensions of wheat gliadin nanoparticles. Food Hydrocoll. 102 (2019), 105638. doi:10.1016/j.foodhyd.2019.105638
Wouters, A. G. B., Schaefer, S., Joye, I. J., and Delcour, J. A. (2019). Relating the structural, air-water interfacial and foaming properties of wheat (Triticum aestivum L.) gliadin and maize (Zea mays L.) zein based nanoparticle suspensions. Colloids Surfaces A Physicochem. Eng. Aspects 567, 249–259. doi:10.1016/j.colsurfa.2019.01.071
Wu, W., Kong, X., Zhang, C., Hua, Y., and Chen, Y. (2018). Improving the stability of wheat gliadin nanoparticles – effect of gum Arabic addition. Food Hydrocoll. 80, 78–87. doi:10.1016/j.foodhyd.2018.01.042
Keywords: protein particles, gliadin, deamidation, interfacial behavior, foam stability, interfacial rheology
Citation: Moraveji M, Sadat A and Joye IJ (2022) Impact of deamidation on the physicochemical properties and air-water interfacial behaviour of gliadin nanoparticles. Front. Soft. Matter 2:937152. doi: 10.3389/frsfm.2022.937152
Received: 05 May 2022; Accepted: 13 July 2022;
Published: 24 August 2022.
Edited by:
Eduardo Guzmán, Faculty of Chemical Sciences (UCM), SpainCopyright © 2022 Moraveji, Sadat and Joye. This is an open-access article distributed under the terms of the Creative Commons Attribution License (CC BY). The use, distribution or reproduction in other forums is permitted, provided the original author(s) and the copyright owner(s) are credited and that the original publication in this journal is cited, in accordance with accepted academic practice. No use, distribution or reproduction is permitted which does not comply with these terms.
*Correspondence: Iris J. Joye, aWpveWVAdW9ndWVscGguY2E=