 Qingbin He1,2
 Hu-Jun Qian
 Quan Chen
- 1State Key Laboratory of Polymer Physics and Chemistry, Changchun Institute of Applied Chemistry, Chinese Academy of Sciences, Changchun, China
- 2Department of Radiology, Shandong First Medical University & Shandong Academy of Medical Sciences, Taian, China
- 3State Key Laboratory of Supramolecular Structure and Materials, College of Chemistry, Jilin University, Changchun, China
Morphological and rheological properties are examined for poly(styrene-co-2-vinyl pyridine) (P(S-co-2VP)) copolymers upon introducing phosphotungstic acid, one kind of polyoxometalates (POMs). The phosphotungstic acid protonates the 2VP monomers, and the deprotonated phosphotungstic acid effectively crosslinks the protonated 2VP monomers, inducing phase segregation into the S-rich and 2VP-rich domains. Linear viscoelasticity (LVE) of the composite samples strongly relies on the continuity of the 2VP-rich domains and can be classified into the following three types. (1) For 2VP-rich sphere domains in the S-rich matrix, LVE is akin to the conventional elastomer characterized by a wide rubbery regime before the terminal relaxation. (2) For bicontinuous morphology, where both the 2VP-rich and S-rich domains are continuous, two glassy processes manifest in LVE, and the chain relaxation is controlled by the continuous ion dissociation in the less mobilized 2VP-rich domain. (3) When the 2VP-rich domain is the only continuous phase, only the glassy modulus of the 2VP-rich domain manifests in LVE, and the chain relaxation is activated by the continuous ionic dissociations in the matrix. Surprisingly, the relaxation time obtained for all three abovementioned morphologies can be reduced to a universal behavior once the average glass transition temperature of the 2VP-rich region and the number of effective stickers per chain have been properly normalized, indicating that these two parameters control the chain-dimensional dynamics.
1 Introduction
Ionic interactions stemming from the attraction between oppositely charged ions are widely used in designing various novel ion-containing materials, including self-healing, stimuli-response, and memory materials (Grosberg and Khokhlov, 2011; Israelachvili, 2011; Van Ruymbeke, 2017; Bhattacharya et al., 2019; Jeong and Choi, 2019). There are two major families of ion-containing polymeric materials based on the source of the ionic groups, i.e., the polymer materials with intrinsic or extrinsic ions. The ionomers and polyelectrolytes are typical ion-containing polymers with intrinsic ions that are covalently bonded (Eisenberg and Rinaudo, 1990; Chen et al., 2015a; Zhang Z. et al., 2017). The ionomers usually have less than 10% ionized monomers and are processable and applicable in bulk. In comparison, the polyelectrolytes contain a much higher fraction of ionized monomers (usually close to 100%) and, thus, are usually not processable in bulk but are instead dissolved in a polar solvent for application.
Another family of ion-containing polymers has extrinsic ions, i.e., ions from introduced salts (Beck et al., 2005; Burnworth et al., 2011; Kumpfer et al., 2012; Han et al., 2020; Neumann et al., 2020), clusters (Cui et al., 2008; Zhang L. et al., 2017; Cheng et al., 2017; Chai et al., 2019), nanoparticles (Gong et al., 2014; Chen et al., 2015b; Holt et al., 2016; Starr et al., 2016; Park et al., 2020; Cui et al., 2021; Yavitt et al., 2021), and so on. Usually, the dispersion of the extrinsic ions in the polymer matrix relies on localized attractive interactions between the ionic groups and the polymer matrix, and good dispersion can be achieved only when the interaction is sufficiently strong.
Polyoxometalates (POMs) are widely used as extrinsic macroions in polymer nanocomposites. POMs have well-defined molecular structures, uniform shapes, tunable charges, and no intra-molecular charge interaction, and appear to exhibit different composition effects compared with the regular small ions, salts, or large nanoparticles or colloidal suspensions in the composite materials (Day and Klemperer, 1985; Li et al., 2007; Long et al., 2010; Yin et al., 2012). The moderate size of the POM macroion endows the counterions with extra binding freedom to migrate on the surface of the macroion. As a result, POM macroions can serve as well-defined crosslinkers with a fixed number of functional groups and adjustable positions of counterions, enabling them to be widely used in fabricating reversible networks. For example, the commercially available tetrafunctional silicotungstic acid H4[Si(W3O10)4] and trifunctional phosphotungstic acid H3[P(W3O10)4] can protonate and physically crosslink polymers such as polyvinylimidazole (PVIm), poly (2-vinyl pyridine) (P2VP), and poly (4-vinyl pyridine) (P4VP). Since the number density of the attractive interactions between negatively charged acid groups, e.g., [P(W3O10)4]3-, and the positively charged monomers (obtained after the protonation) can be well-controlled via the content of POM, it is convenient to prepare the reversible materials with different degrees of gelation.
In our previous studies, we prepared ABA-type copolymers where the end A blocks have a much shorter size and a much higher bulk Tg than the central B block. In addition, the end A blocks can be protonated and crosslinked by POM. These materials show hybrid properties of conventional ABA-type elastomers and reversible networks, where the solid-to-liquid transition depends on both the energetic interaction of the A and B blocks and the ionic attraction between the protonated A monomers and the deprotonated POM (He et al., 2020; He et al., 2021). In this study, we examined the morphology and dynamics of POM-crosslinked A-co-B random copolymers by utilizing the composites of P(2VP-co-S) copolymers and phosphotungstic acid (Keggin type, H3PW12O40) as the model system. A great advantage of choosing P(S-co-2VP) as the precursor is that PS and P2VP have almost the same Tg (Tg = 100°C for PS(Yu et al., 2021) and 101°C for P2VP(Wei and Torkelson, 2020)), and only the 2VP monomers can be protonated by POM (Zhang L. et al., 2017). As a result, the segmental mobility is similar for the copolymer samples having different S/2VP compositions, and the dynamic change owing to the ionic attraction (between the protonated 2VP monomers and deprotonated POM) can be unequivocally characterized.
We find that the copolymer precursors are in a disordered state, while the introduction of POM induces the segregation, leading to the formation of the 2VP-rich and S-rich domains, with POM preferentially located in the 2VP domain. On the one hand, the glassy modulus is governed by the continuous phase (s), where one glassy region is seen for the sphere-matrix morphology, and two glassy regions are seen for the bicontinuous morphology. On the other hand, the rubbery modulus is more governed by the ion dissociation in the 2VP-rich phase that is less mobilized than in the S-rich phase. Surprisingly, the relaxation time of all copolymer samples reduces to a universal behavior after proper normalization of the localized Tg in the 2VP-rich domain and the number of associations per chain, irrespective of the detailed phase segregation morphology.
2 Experimental section
2.1 Materials
Styrene (St, 99%, Aladdin) and 2-vinylpyridine (2VP, 97%, Aladdin) were purified via passing through a basic alumina column. Chain transfer agent (CTA), [1-(O-Ethylxanthy) ethyl]benzene, (Ladavière et al., 2001; Wan et al., 2005) was synthesized according to the procedure reported in the literature. 2,2′-Azobis (2-methylpropionitrile) (AIBN) was purchased from Aladdin and recrystallized in ethanol before use. Extra dry 1,4-dioxane was purchased from Energy Chemical Co. and used as received. H3[P(W3O10)4] (Keggin structure, purchased from Energy Chemical) was used directly without purification.
2.2 Synthesis
Poly(styrene-co-2-vinylpyridine) and polyvinylpyridine were synthesized via RAFT polymerization. A typical procedure for the synthesis of poly(styrene-co-2-vinylpyridine) copolymer is described in the following text. Styrene (10 mmol, 1.04 g), 2-vinylpyridine (10 mmol, 1.05 g), CTA (0.1 mmol, 22.6 mmg), AIBN (0.02 mmol, 3.29 mg), and dry 1,4-dioxane (8 ml) were added into an ampule with a magnetic stirrer. The mixture was degassed by three freeze–pump–thaw cycles and heated under nitrogen in a thermostated oil bath at 70°C. After a reaction period of 24 h with stirring, the polymerization was quenched by liquid nitrogen, and the mixture was precipitated into n-hexane. Molecular weight characteristics of the copolymer were obtained from size-exclusion chromatography (SEC) equipped with both light scattering and refractive index detectors. The important parameters of the P2VP and copolymer samples are summarized in Table 1.
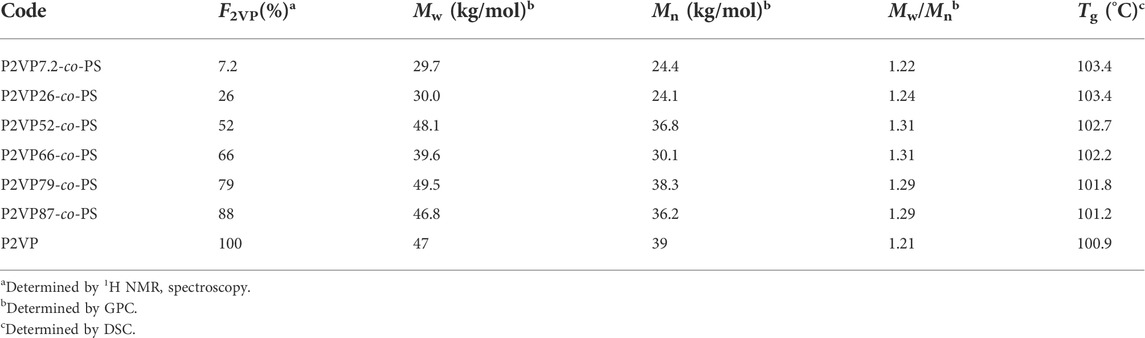
TABLE 1. Important parameters of the copolymer samples.
2.3 Preparation of nanocomposites
H3[P(W3O10)4] was dissolved in DMF and mixed with the matrix polymer in solution. The mixtures were sonicated for 5 min and stirred at room temperature for 1 day. Then the solvent was evaporated in a Teflon beaker at 70°C for 6 h and further dried in vacuum at 150°C for 1 week.
2.4 Measurements
2.4.1 Nuclear magnetic resonance
1H NMR spectra of all samples were recorded at room temperature on a Varian Unity 400 MHz spectrometer with deuterated chloroform as solvent and tetramethylsilane as internal standard. The ratio of 2-vinylpyridine in the copolymer is determined by 1H NMR.
2.4.2 Differential scanning calorimetry
The thermal measurements were carried out on a TA Instruments Q20 differential scanning calorimetry with nitrogen gas purging at a flow rate of 50 ml/min. All experiments were carried out using a heating/cooling rate of 10°C/min. Three heating/cooling runs were conducted, where the glass temperature Tg was determined from the second run, with the aid of commercially available Universal Analysis software. Reproducibility of the DSC traces was confirmed in the third run.
2.4.3 Linear viscoelasticity
All measurements were conducted with a strain-controlled rheometer (ARES-G2, TA, United States) under the protection of dry N2. 4 and 8 mm parallel-plate fixtures were utilized to measure glassy and rubber parts of modulus, respectively. The frequency sweep measurements were conducted within an angular frequency range of 0.1–100 rad/s at a temperature range of 100–240°C. The strain amplitude was kept in the linear regime.
2.4.4 Transmission electron microscopy
The samples were microtomed with a Leica ultramicrotome EM UC7 using a glass knife at ambient conditions, with resulting specimens having thicknesses of ∼100 nm. The TEM measurements were performed on a JEM-1400 electron microscope operating at 120 kV.
2.4.5 X-ray diffraction
XRD measurements were carried out using a Rigaku SmartLab diffractometer with Cu Kα radiation (Kα1 line, with wavelength λ = 0.154 nm). The X-ray source was operated at 40 kV and 40 mA. The XRD patterns of samples were obtained at a step-scan rate of 0.03° per 3s in a scattering angle (2θ) range of 0.5°–30° (where θ is half of the scattering angle) corresponding to a scattering vector q of 0.35–21.11 nm−1.
2.4.6 Small angle X-ray scattering
SAXS experiments were carried out on 1W2A small-angle X-ray scattering station of the Beijing Synchrotron Radiation Facility (BSRF) and Bruker Nanostar-U instrument using Cu Kα radiation (wavelength, λ = 0.154 nm). The scattering vector q = 4πsinθ/λ ranges from 0.08 to 2.0 nm−1, where the scattering angle is 2θ.
3 Results and discussion
3.1 Structure
We prepared a series of P(S-co-2VP) copolymer samples with a systemically changed molar fraction of 2VP, F2VP, varying from 7.2 to 100%. More details of the synthesis are given in Supplementary Figures S1–S3. H3[P(W3O10)4] having a functionality f = 3 was introduced to protonate the 2VP monomers. The protonated 2VP monomers were effectively crosslinked by the deprotonated [P(W3O10)4]3- anions. The number ratio of the functional groups of H3[P(W3O10)4] and that of the 2VP monomers is r = f [POM]/[2VP], and the sample is coded as F2VP-r. For example, 26%-0.1 indicates a sample having F2VP = 26% and r = 0.1. For all samples focused in this study, the value of r is well below one so that the POM molecules were well dispersed (Bu et al., 2009; Lin et al., 2011; Zhang et al., 2016; Zhang L. et al., 2017). Nevertheless, further increasing the content of POM (and, accordingly, r) would finally lead to the crystallization of the POM molecules, as evidenced by the observation of the POM crystalline peaks in the X-ray scattering measurements (cf. Supplementary Figure S4).
Figure 1 compares the X-ray scattering profiles obtained for the representative samples over 1 nm−1
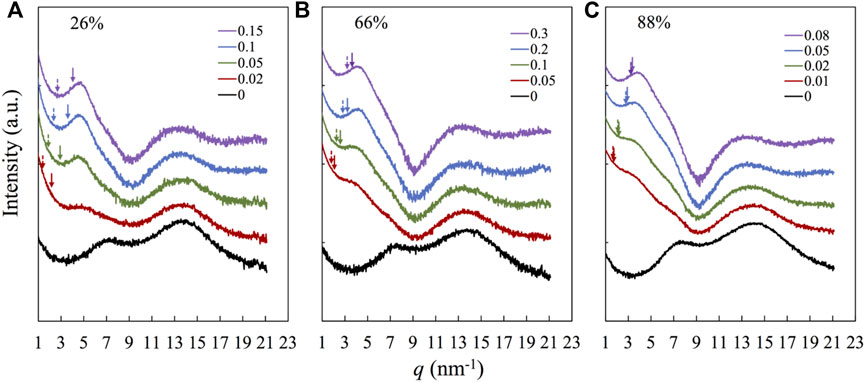
FIGURE 1. XRD patterns of nanocomposites and precursors. Each panel corresponds to samples based on the same precursor with the molar fraction of 2VP in the precursor, F2VP of (A) 26%, (B) 66%, and (C) 88%, as indicated, and the number shown in the legend indicates the number ratio of the functional groups of H3[P(W3O10)4] and that of the 2VP monomers, r = f [POM]/[2VP]. The curves are arbitrarily shifted for clarity. The dotted and solid arrows are q* calculated from Eqs. 1, 2, respectively.
where D represents the spacing between the POM molecules, which is determined by D =
The result is shown by the solid arrow. Both arrows are located at the low-q side of the peak, but the solid arrows are closer to the peak, suggesting that the latter assumption, i.e., POM selectively dissolved in the P2VP-rich domains, can better reflect the X-ray scattering profile. The separation between the solid arrow and the actual peak decreases with increasing the POM content and, accordingly, the amplitude of the POM-related peak, suggesting that the difference between q* in experiments and that evaluated from Eq. 2 is (partly) attributable to the merging of the lowest-q peak with the higher-q backbone correlation peak: the merged peak reflects more on a distance between POM molecules when their content is higher.
To characterize the morphology of the samples after the phase segregation, SAXS and TEM were employed for the high-r samples based on each copolymer in Figure 2 and Supplementary Figures S6 and S7. The left panel (Panel a) of Figure 2 compares the SAXS profiles, where segregation is noted for the samples with F2VP
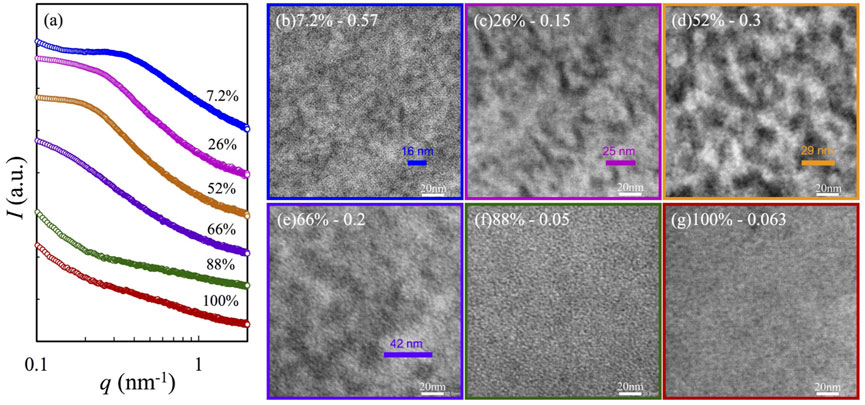
FIGURE 2. TEM images and X-ray scattering profiles for selected nanocomposites with high r: their corresponding SAXS profiles are compared in Panel (A) and TEM images in Panel (B) 7%-0.57, (C) 26%-0.15, (D) 52%-0.3, (E) 66%-0.2, (F) 88%-0.05, and (G) 100%-0.063, where the sample is coded as F2VP-r.
3.2 DSC traces and dynamic heterogeneity
Figure 3 compares the DSC traces for the samples based on three representative copolymers having F2VP = 26% (Panel a), 66% (Panel b), and 88% (Panel c), corresponding to the subcases where the continuous phase(s) is (are) S-rich phase, S- and 2VP-rich phases, and 2VP-rich phase, respectively, as revealed in the TEM images in Figure 2. In Figure 3, we find one glass transition process for the samples based on copolymers having F2VP = 26% (Panel a) and 88% (Panel c), indicating that the DSC traces reflect mainly the continuous phase that is the majority. Nevertheless, the r dependences of Tg are quite different in the composite samples based on F2VP = 26 and 88%; Tg is relatively insensitive to r for the samples having F2VP = 26%, while it increases with r for the samples having F2VP = 88%, indicating that the glass transition process of the S-rich is insensitive, while that of the 2VP-rich phases is strongly dependent on the POM content, in accordance with a naive expectation that the POM molecules locate preferentially in the 2VP-rich phase to restrict the segmental motion therein. In comparison, for the samples having F2VP = 66% (Panel b), two glass transition processes manifest gradually with increasing r, and the low- and high-T processes are insensitive and strongly dependent on r, respectively, and the high-T process intensifies with increasing r. These features indicate that the low- and high-T processes reflect the glass transition of the S-rich and 2VP-rich domains, respectively. To resolve the glass transition temperature of the two phases, we follow the work of Colmenero (Arrese-Igor et al., 2010) to fit the derivatives of DSC traces with two Gaussian equations, as explained in Supplementary Figure S9 of SI. This analysis enables us to evaluate Tgs of the S- and 2VP -rich domains, which are shown in the solid and dashed arrows in Panel b, respectively.
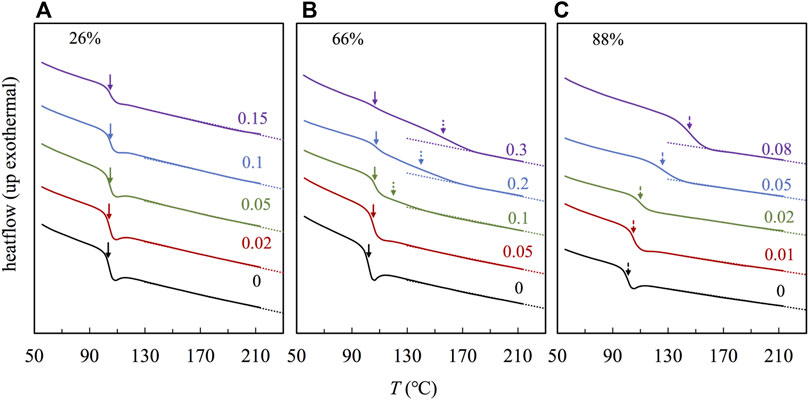
FIGURE 3. DSC traces for the P(S-co-2VP) copolymer and the nanocomposites with the different r as indicted, for F2VP = (A) 26%, (B) 66%, and (C) 88%.
In Figure 4, we compared Tg resolved in Figure 3 against the weight fraction of POM, wPOM, where the filled and unfilled symbols represent Tgs of the S-rich and 2VP-rich phases, respectively. For those composites with F2VP
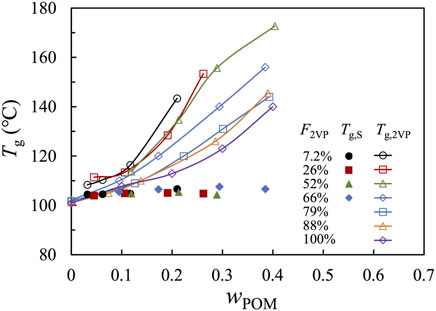
FIGURE 4. Plots of the Tg of the PS-rich (filled symbol) and P2VP-rich (open symbol) phases against the weight fraction of POM. Tg in the PS-rich phase is obtained from analyzing the DSC traces. Tg in the P2VP-rich phase for samples of F2VP
3.3 Analysis of LVE and shift factors
Figure 5 compares the (pseudo-) master curves of linear viscoelastic storage and loss moduli, G′ and G″, obtained for the samples based on three representative copolymers having F2VP = 26% (Panel a), 66% (Panel b), and 88% (Panel c) reduced to the same reference Tr = 120°C. LVE (pseudo-) master curves of the samples having F2VP = 7.2, 52, 79, and 100% are compared in Supplementary Figure S10. The main features of the F2VP = 7.2, 52 and 79% are similar to those of the representative samples having F2VP = 26, 66, and 88%, respectively. To construct the (pseudo-) master curves, the raw G′ and G″ data in the rubbery regime are corrected by an intensity factor bT = Tr/T and shifted along the ω axis with aT until the best superposition has been achieved. The time–temperature superposition principle holds approximately for all samples in this study.
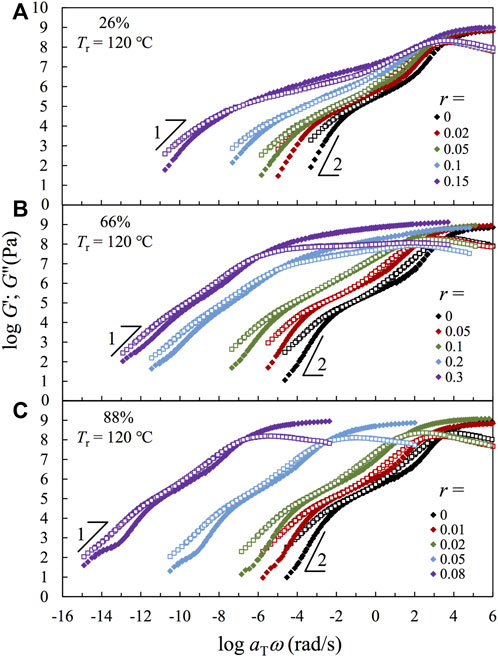
FIGURE 5. Storage modulus G′ (filled symbols) and loss modulus G″ (unfilled symbols) normalized by an intensity factor bT and plotted against reduced frequency ωaT for all samples based on different precursors with F2VP = (A) 26%, (B) 66%, and (C) 88%, with reference temperature Tr = 120°C.
The continuity of the S- and/or 2VP-rich domains is well reflected in the glassy moduli. For the samples having F2VP = 26% (Panel a), the glassy part of the modulus occurs at a similar ω range, and the glassy peak broadens with increasing r. These features reflect that the glassy part of the modulus is governed by the continuous S-rich domain therein, which is in accordance with their DSC traces shown earlier in Figure 3A. In comparison, the glassy peak of the samples having F2VP = 88% (Panel c) shifts significantly toward the lower ω with increasing r, indicating the increased restriction on the segmental motion and, accordingly, the higher localized Tg (cf. Figure 3C) in the 2VP-rich domain. The glass region of the samples having F2VP = 66% (Panel b) first broadens with increasing r for low r
Now, we turn our focus to the rubbery part of the modulus. Since the molecular weights of all copolymer samples in this study are smaller than twice the entanglement molecular weight 2Me of either PS or P2VP, i.e., Me = 18,000 g/mol for PS (Chen et al., 2011; Cao et al., 2019) and 27,000 g/mol P2VP (Beck Tan et al., 1996; Chen et al., 2015b), no entanglement effect is expected for the composite samples. In accordance with this expectation, no plateau region is seen for the composite samples having F2VP = 66 and 88%. Probably, the 2VP monomers in the continuous phase have the same chance to be protonated by POM, leading to the overall quenching of the (continuous) 2VP-rich phase. In contrast, we observe a broad rubbery-like region where the storage modulus is higher than the loss modulus for the F2VP = 26% samples having a high r (also for the F2VP = 7.2% samples having high r
The introduction of the POM leads to both the ion association and the phase segregation, and both changes should influence the terminal relaxation behavior. In relation to the present study, Chen et al. examined the dynamics of ionomers obtained from condensation polymerization of sulfonated phthalates with mixtures of poly(ethylene glycol) (PEO) and poly(tetramethylene oxide) (PTMO) (Chen et al., 2014). They found that the samples exhibited phase segregation, and the ionic dissociation in the PEO-rich phase is much faster than that in the PTMO-rich phase, owing to the superior ion solvating ability of PEO. As a result, the terminal relaxation of these samples is governed by the slow ionic dissociation process in the PTMO-rich phase. For the present study, we may regard the 2VP-rich phase as the less mobilized phase. Then, the motion of the copolymer chains can be fully activated only if T is higher than Tg of the 2VP-rich phase. Having this point in mind, we attempt to analyze the LVE shift factors based on the localized Tg in the 2VP-rich phases.
Figures 6A–C plot the logarithmic shift factor log aT, obtained from constricting the LVE master curves in Figure 5, against T − Tr, with Tr = 120°C. The temperature dependence increases with r, owing to an increase of Tg and, accordingly, a reduction of Tr – Tg, which leads to the stronger temperature dependence at T close to Tr. To test this point, we make a correction first for the F2VP = 88% samples (in Panel c). We choose a new iso-frictional reference temperature, Tiso, that has the same distance from Tg, i.e., Tiso = Tg,2VP + 20°C, and reevaluate the shift factors according to Tiso. In Figure 6F, the log aiso thus obtained is plotted against T – Tiso. All plots agree well with the prediction of the WLF equation of the bulk P2VP using the reference temperature Tr = Tg +20°C:
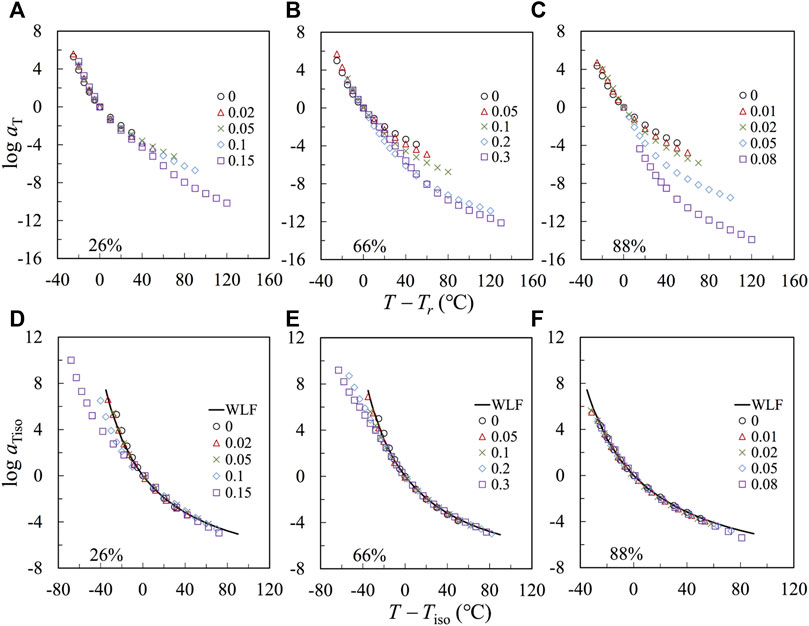
FIGURE 6. (A–C): aT is plotted against T-Tr, with Tr = 120°C for the nanocomposites and precursor. (D–F): The reduced shift factor aiso, defined for the iso-frictional temperature Tiso, is plotted against T-Tiso.
The agreement indicates that the temperature dependence of the samples having F2VP = 88% is governed by that of the 2VP-rich phase. A similar agreement of the plots of log aT against T – Tiso has also been achieved for the composite samples based on pure P2VP, as shown in Supplementary Figure S11 of SI.
A similar correction is given on the plots in Figure 6B (with F2VP = 66%). The re-evaluated shift factors log aiso is against T – Tiso, as shown in Figure 6E. The plots agree well with the prediction of the WLF equation only at high T
The agreement for the plots of log aiso against T – Tiso at T
3.4 Analysis of relaxation time
From LVE, the zero-shear viscosity can be determined from the G″ tail as η0 = [G″/ω]ω
Figure 7A compares the characteristic relaxation time τc plotted against T – Tiso in a T range where G″ ∼ ω tail is detectable. Since the difference of Tg has been properly normalized through plotting against T – Tiso, the scattering of plots, in a range of ∼ 2 decades in the vertical scale, should be mainly due to a difference in the number of ionic associations per chain. To test this idea, we used τc obtained for the bulk P2VP as the reference and shifted the viscosity of each sample by a factor of K to achieve the best superposition on that of the P2VP bulk sample, as shown in Figure 7B, where good agreement has been achieved.
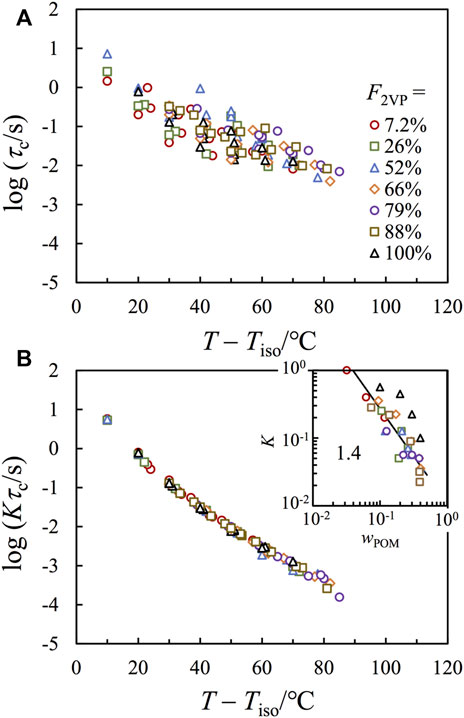
FIGURE 7. (A): Plots of the characteristic relaxation time τc against T – Tiso for all composite samples, with F2VP as indicated. (B) τc in panel a has been multiplied by an intensity factor K and plotted against T – Tiso. Inset plots K against wPOM.
The inset of Figure 7B plots K obtained for each composite sample against wPOM (the weight fraction of POM), where the symbol shapes are the same as those in the main figure. The wPOM dependence of K falls into two groups: those nanocomposites based on P(2VP-co-S) (colorful symbols) exhibit much lower K than those obtained based on the pure P2VP (black symbols). Considering that the normalization is given on Kτc, and, thus, the lower K means the higher τc for the composite samples based on P(2VP-co-S). This difference should indicate extra confinement for the chain motion by the interface. It is interesting that although the composites having F2VP = 88% do not show clear segregation in either the X-ray scattering or the TEM images, their relaxation behavior is more similar to the composite samples based on other P(S-co-2VP) precursors (having F2VP < 88%) than those based on pure P2VP (having F2VP = 100%), suggesting that there should be considerable segregation for the F2VP = 88% composite samples in a dynamic sense.
For all composite samples based on P(2VP-co-S), K decreases with increasing wPOM, suggesting that τc increases with wPOM. This result is typical for associative polymers. Namely, the chain relaxation relies on the continuous dissociation of all stickers on the chain, and, thus, the terminal relaxation time increases with the number of stickers per chain. The classical sticky Rouse model considers the dissociation of different stickers as independent events and predicts relaxation time to be proportional to the square of the number of stickers per chain,
where τs is the lifetime per sticker, and S is the number of stickers per chain. If (1) all POM molecules form effective interchain crosslinkers, and (2) τs is insensitive to wPOM, we would have τc ∼ wPOM2 or K ∼ wPOM−2. Nevertheless, the apparent scaling seen for the composite samples is considerably weaker, i.e., a scaling of K ∼ wPOM−1.4±0.2 has been observed (cf. Solid line in the inset), meaning that the two abovementioned assumptions may be questionable.
On the one hand, it is likely that not all POM molecules serve as effective crosslinkers. Considering that there is a fluctuation of concentration for the nanocomposite samples, the POM crosslinkers in the less rich P2VP region or near the interface between the PS- and P2VP-rich domains may not serve effectively as interchain crosslinkers: They may either be free (non-associated) or associated with 2VP monomers belonging to the same chain. The fraction of POM as effective crosslinkers is likely to decrease with increasing wPOM, leading to S ∼ wPOMβ with β smaller than one, and, accordingly, the scaling τc ∼ wPOM1.4±0.2 being weaker than that expected by the sticky Rouse theory.
On the other hand, τs may decrease with increasing wPOM, considering that higher wPOM leads to smaller POM-POM distance thereby facilitating the hopping of 2VP monomers between the POM crosslinkers. This mechanism has been discussed by Stukalin et al. (2013). They argued that a broken sticker would reassociate several times with its original partner before it could find a new partner. Since the probability of the position of the new partner is the same in any direction, the orientation of the reassociated strand becomes randomized.
The lifetime per sticker, according to Stukalin et al. (2013), can be expressed as:
where τb is the characteristic time for sticker breakup, J is the number of reassociation back to the original partner before finding a new partner, and τa is the time required to migrate a POM-POM distance D. Since D is usually smaller than the end-to-end distance (this condition should be satisfied above the gel point), the diffusion is subdiffusive, leading to
where Δr(t) represents the diffusion distance between 0 and t, and b and τ0 are the size and relaxation time per Kuhn segment. Allowing Δr(t) = D2 gives
Here, τa specifies a time for a broken sticker to explore a volume of D3 containing (D/b)3 sites. Since the number of steps for this exploration is (D/b)4 according to Eq. 7, the possibility of reassociating to the original partner becomes
A combination of Eqs 5–8 gives
For a strong association having τb much longer than the Rouse time, we have the first term much larger than the second term, thereby giving τs ∼ D/bτb. For the present case, we might assume τb is insensitive to wPOM but D ∼ wPOM−1/3, giving τs ∼ wPOM−1/3, meaning that the time for a broken sticker to find a new partner decreases with decreasing the POM-POM distance. Inputting S ∼ wPOM and τs ∼ wPOM−1/3 into Eq. 4 gives a scale of τc ∼ wPOM5/3 (or K ∼ wPOM−5/3). This scaling is closer to K ∼ wPOM−1.4±0.2 seen in Figure 7.
One may think the scaling τc ∼ wPOM1.4±0.2 weaker than that expected by the sticky Rouse theory is partly owing to the crystallization of the POM molecules that reduces the number density of the crosslinking POM molecules. This is unlikely to be the relevant mechanism because no crystalline peaks of POM have been detected in the X-ray scattering profiles.
4 Concluding remarks
In this study, we examine systematically how the morphological and rheological properties change with increasing either the density of crosslinkable sites of the precursor or the density of the extrinsic crosslinkers. The introduced POM crosslinkers effectively protonate the 2VP monomers, which induces the phase segregation into the S-rich and 2VP-rich domains owing to the strong ionic attraction (between the deprotonated POM molecules and the protonated 2VP monomers). The POM preferentially resides in the 2VP-rich domain to restrict the segmental motion, leading to a significant increase in the localized glassy transition temperature therein.
LVE of the composites strongly relies on the continuity of the 2VP-rich domains. When the 2VP-rich domains are isolated in space, the rheological property is akin to associative polymers characterized by a wide rubbery regime with G′ > G″ before the terminal relaxation. This means that the chain relaxation is activated through the chain “hopping” or “walking” between the isolated domains (Yokoyama and Kramer, 2000). In comparison, when the 2VP-rich domain becomes continuous, the chain motion has been largely quenched when T is lower than the localized Tg of the 2VP-rich domains. Above this Tg, the chain motion is activated by the continuous sticker dissociations occurring mainly in the 2VP-rich domains. It is surprising that although the LVE behavior is quite different for these two cases, the T dependence of the terminal relaxation time can be reduced to a universal behavior once the average glass transition temperature of the 2VP-rich region and the number of stickers per chain have been properly normalized. This surprising universal relationship serves as a clear starting point for further theoretical work.
Data availability statement
The original contributions presented in the study are included in the article/Supplementary Materials; further inquiries can be directed to the corresponding author.
Author contributions
QH contributed to conceptualization, methodology, investigation, data analysis, and manuscript writing. YZ performed experiments and analyzed data. ZZ contributed to conceptualization, data analysis, and manuscript writing. H-JQ contributed to data analysis of a few experiments. QC contributed to the editing and finalization of the manuscript, administered the project, and managed funding for the completion of the project.
Funding
QC acknowledges the National Natural Science Foundation of China (21722407), and ZZ acknowledges the National Natural Science Foundation of China (21873095).
Acknowledgments
The authors thank Qianqian Gu and Baohua Zeng from CIAC for the TEM tests. The BSRF is acknowledged for kindly providing the beam time.
Conflict of interest
The authors declare that the research was conducted in the absence of any commercial or financial relationships that could be construed as a potential conflict of interest.
Publisher’s note
All claims expressed in this article are solely those of the authors and do not necessarily represent those of their affiliated organizations, or those of the publisher, the editors, and the reviewers. Any product that may be evaluated in this article, or claim that may be made by its manufacturer, is not guaranteed or endorsed by the publisher.
Supplementary material
The Supplementary Material for this article can be found online at: https://www.frontiersin.org/articles/10.3389/frsfm.2022.980210/full#supplementary-material
References
Arrese-Igor, S., Alegría, A., and Colmenero, J. (2010). Comparison of calorimetric and dielectric Single component glass transitions in Ptbs−Pi Blends. Macromolecules 43, 6406–6413.
Beck, J. B., Ineman, J. M., and Rowan, S. J. (2005). Metal/Ligand-Induced Formation of metallo-supramolecular polymers. Macromolecules 38, 5060–5068. doi:10.1021/ma050369e
Beck Tan, N., Peiffer, D., and Briber, R. (1996). Reactive reinforcement of polystyrene/poly (2-vinylpyridine) interfaces. Macromolecules 29, 4969–4975. doi:10.1021/ma950895d
Bhattacharya, S., Phatake, R. S., Nabha Barnea, S., Zerby, N., Zhu, J.-J., Shikler, R., et al. (2019). Fluorescent self-healing Carbon dot/polymer gels. ACS Nano 13, 1433–1442. doi:10.1021/acsnano.8b07087
Bu, W., Uchida, S., and Mizuno, N. (2009). Micelles and vesicles formed by polyoxometalate-block copolymer composites. Angew. Chem. Int. Ed. Engl. 48, 8431–8434. doi:10.1002/ange.200904116
Burnworth, M., Tang, L., Kumpfer, J. R., Duncan, A. J., Beyer, F. L., Fiore, G. L., et al. (2011). Optically healable supramolecular polymers. Nature 472, 334–337. doi:10.1038/nature09963
Cao, X., Yu, X., Qin, J., and Chen, Q. (2019). Reversible gelation of entangled ionomers. Macromolecules 52, 8771–8780. doi:10.1021/acs.macromol.9b01116
Chai, S., Cao, X., Xu, F., Zhai, L., Qian, H. J., Chen, Q., et al. (2019). Multiscale self-assembly of mobile-ligand molecular nanoparticles for hierarchical nanocomposites. ACS Nano 13, 7135–7145. doi:10.1021/acsnano.9b02569
Chen, Q., Bao, N., Wang, J.-H. H., Tunic, T., Liang, S., and Colby, R. H. (2015a). Linear viscoelasticity and dielectric spectroscopy of ionomer/plasticizer mixtures: A transition from ionomer to polyelectrolyte. Macromolecules 48, 8240–8252. doi:10.1021/acs.macromol.5b01958
Chen, Q., Gong, S., Moll, J., Zhao, D., Kumar, S. K., and Colby, R. H. (2015b). Mechanical reinforcement of polymer nanocomposites from percolation of A nanoparticle network. ACS Macro Lett. 4, 398–402. doi:10.1021/acsmacrolett.5b00002
Chen, Q., Masser, H., Shiau, H.-S., Liang, S., Runt, J., Painter, P. C., et al. (2014). Linear viscoelasticity and fourier Transform infrared spectroscopy of polyether–ester–sulfonate copolymer ionomers. Macromolecules 47, 3635–3644. doi:10.1021/ma5008144
Chen, Q., Uno, A., Matsumiya, Y., and Watanabe, H. (2011). Viscoelastic mode distribution of moderately entangled linear polymers. J. Soc. Rheol. Jpn. 38, 187–193. doi:10.1678/rheology.38.187
Cheng, S., Xie, S.-J., Carrillo, J.-M. Y., Carroll, B., Martin, H., Cao, P.-F., et al. (2017). Big effect of small nanoparticles: A shift in Paradigm for polymer nanocomposites. Acs Nano 11, 752–759. doi:10.1021/acsnano.6b07172
Cui, L., Chen, D., and Zhu, L. (2008). Conformation transformation determined by different self-assembled phases in A dna complex with cationic polyhedral oligomeric Silsesquioxane Lipid. Acs Nano 2, 921–927. doi:10.1021/nn800177v
Cui, W., You, W., Sun, Z., and Yu, W. (2021). Decoupled polymer dynamics in weakly attractive poly(methyl methacrylate)/silica nanocomposites. Macromolecules 54, 5484–5497. doi:10.1021/acs.macromol.1c00264
Day, V. W., and Klemperer, W. G. (1985). Metal oxide chemistry in solution: The early transition metal polyoxoanions. Science 228, 533–541. doi:10.1126/science.228.4699.533
Eisenberg, A., and Rinaudo, M. (1990). Polyelectrolytes and ionomers. Polym. Bull. 24, 671. doi:10.1007/bf00300165
Gong, S., Chen, Q., Moll, J. F., Kumar, S. K., and Colby, R. H. (2014). Segmental dynamics of polymer Melts with spherical nanoparticles. ACS Macro Lett. 3, 773–777. doi:10.1021/mz500252f
Grosberg, A. Y., and Khokhlov, A. R. (2011). Giant molecules: Here, there, and everywhere, Hackensack, nj. World Scientific.
Han, Y., Zhao, X., Liu, Y., Li, Y., and Chen, Q. (2020). Structure and phase behavior of poly(acrylic acid)–ferric ion complex aqueous solutions. Soft Matter 16, 10750–10758. doi:10.1039/d0sm01461c
He, Q., Zhang, Y., and Chen, Q. (2021). Crosslinking aba-type elastomers with polyoxometalate: A convenient molecular design of double network. Polymer 228, 123932–123941. doi:10.1016/j.polymer.2021.123932
He, Q., Zhang, Y., Li, H., and Chen, Q. (2020). Rheological properties of aba-type copolymers physically end-cross-linked by polyoxometalate. Macromolecules 53, 10927–10941. doi:10.1021/acs.macromol.0c01817
Holt, A. P., Bocharova, V., Cheng, S., Kisliuk, A. M., White, B. T., Saito, T., et al. (2016). Controlling interfacial dynamics: Covalent bonding versus physical adsorption in polymer nanocomposites. Acs Nano 10, 6843–6852. doi:10.1021/acsnano.6b02501
Jeong, Y. K., and Choi, J. W. (2019). Mussel-inspired self-healing Metallopolymers for Silicon nanoparticle Anodes. Acs Nano 13, 8364–8373. doi:10.1021/acsnano.9b03837
Kumpfer, J. R., Wie, J. J., Swanson, J. P., Beyer, F. L., Mackay, M. E., and Rowan, S. J. (2012). Influence of metal ion and polymer Core on the Melt rheology of metallosupramolecular Films. Macromolecules 45, 473–480. doi:10.1021/ma201659d
Ladavière, C., Dörr, N., and Claverie, J. P. (2001). Controlled radical polymerization of acrylic acid in protic media. Macromolecules 34, 5370–5372. doi:10.1021/ma010358v
Li, H., Sun, H., Qi, W., Xu, M., and Wu, L. (2007). Onionlike hybrid Assemblies based on surfactant‐encapsulated polyoxometalates. Angew. Chem. Int. Ed. 46, 1300–1303. doi:10.1002/anie.200603934
Lin, X., Liu, F., Li, H., Yan, Y., Bi, L., Bu, W., et al. (2011). Polyoxometalate-modulated self-assembly of polystyrene-block-poly(4-vinylpyridine). Chem. Commun. 47, 10019–10021. doi:10.1039/c1cc13123k
Liu, S., Wu, S., and Chen, Q. (2020). Using coupling motion of connecting ions in designing telechelic ionomers. ACS Macro Lett. 9, 917–923. doi:10.1021/acsmacrolett.0c00256
Long, D. L., Tsunashima, R., and Cronin, L. (2010). Polyoxometalates: Building blocks for functional nanoscale systems. Angew. Chem. Int. Ed. 49, 1736–1758. doi:10.1002/anie.200902483
Neumann, L. N., Gunkel, I., Barron, A., Oveisi, E., Petzold, A., Thurn-Albrecht, T., et al. (2020). Structure–property relationships of microphase-separated metallosupramolecular polymers. Macromolecules 53, 5068–5084. doi:10.1021/acs.macromol.0c00876
Park, J., Bailey, E. J., Composto, R. J., and Winey, K. I. (2020). Single-particle tracking of Nonsticky and sticky nanoparticles in polymer Melts. Macromolecules 53, 3933–3939. doi:10.1021/acs.macromol.0c00457
Starr, F. W., Douglas, J. F., Meng, D., and Kumar, S. K. (2016). Bound layers “cloak” nanoparticles in strongly interacting polymer nanocomposites. Acs Nano 10, 10960–10965. doi:10.1021/acsnano.6b05683
Stukalin, E. B., Cai, L.-H., Kumar, N. A., Leibler, L., and Rubinstein, M. (2013). Self-healing of unentangled polymer networks with reversible bonds. Macromolecules 46, 7525–7541. doi:10.1021/ma401111n
Van Ruymbeke, E. (2017). Preface: Special issue on associating polymers. J. Of Rheology 61, 1099–1102. doi:10.1122/1.5008817
Wan, D., Satoh, K., Kamigaito, M., and Okamoto, Y. (2005). Xanthate-mediated radical polymerization of N-vinylpyrrolidone in fluoroalcohols for simultaneous control of molecular weight And tacticity. Macromolecules 38, 10397–10405. doi:10.1021/ma0515230
Watanabe, H., Matsumiya, Y., Chen, Q., and Yu, W. (2012). “2.28 - rheological characterization of polymeric liquids,” in Polymer science: A comprehensive reference. Editors K. Matyjaszewski,, and M. Möller (Amsterdam: Elsevier).
Wei, T., and Torkelson, J. M. (2020). Molecular weight dependence of the glass transition temperature (Tg)-Confinement effect in well-dispersed poly(2-vinyl pyridine)–silica nanocomposites: Comparison of interfacial layer Tg and matrix Tg. Macromolecules 53, 8725–8736. doi:10.1021/acs.macromol.0c01577
Wu, S., Zhang, Z., and Chen, Q. (2019). Effects of alkyl group size on the structure and dynamics of poly(N-alkyl methacrylate)-based ionomers. J. Of Rheology 63, 977–990. doi:10.1122/1.5118804
Yavitt, B. M., Salatto, D., Zhou, Y., Huang, Z., Endoh, M., Wiegart, L., et al. (2021). Collective nanoparticle dynamics associated with bridging Network Formation in model polymer nanocomposites. Acs Nano 15, 11501–11513. doi:10.1021/acsnano.1c01283
Yin, P., Li, D., and Liu, T. (2012). Solution behaviors and self-assembly of polyoxometalates as models of macroions and amphiphilic polyoxometalate-organic hybrids as novel surfactants. Chem. Soc. Rev. 41, 7368–7383. doi:10.1039/c2cs35176e
Yokoyama, H., and Kramer, E. J. (2000). Diffusion of Triblock copolymers in A spherical domain structure. Macromolecules 33, 954–959. doi:10.1021/ma991202m
Yu, X., Cao, X., and Chen, Q. (2021). Rheological properties of sulfonated polystyrene ionomers at high-ion contents. Rheol. Acta 60, 241–249. doi:10.1007/s00397-021-01265-5
Zhang, L., Cui, T., Cao, X., Zhao, C., Chen, Q., Wu, L., et al. (2017a). Inorganic-Macroion-Induced Formation of bicontinuous block copolymer nanocomposites with enhanced conductivity and modulus. Angew. Chem. Int. Ed. Engl. 56, 9141–9145. doi:10.1002/ange.201702785
Zhang, L., Liu, C., Shang, H., Cao, X., Chai, S., Chen, Q., et al. (2016). Electrostatic tuning of block copolymer morphologies by inorganic macroions. Polymer 106, 53–61. doi:10.1016/j.polymer.2016.10.057
Keywords: nanocomposites, reversibility, rheology, morphology, dynamics
Citation: He Q, Zhang Y, Zhang Z, Qian H-J and Chen Q (2022) Morphology and rheology of composites of poly(styrene-co-2-vinyl pyridine) copolymers and phosphotungstic acid. Front. Soft. Matter 2:980210. doi: 10.3389/frsfm.2022.980210
Received: 28 June 2022; Accepted: 25 August 2022;
Published: 29 September 2022.
Edited by:
Hsin-Lung Chen, National Tsing Hua University, TaiwanReviewed by:
Bradley Mansel, National Synchrotron Radiation Research Center, TaiwanKatsuhiro Yamamoto, Nagoya Institute of Technology, Japan
Copyright © 2022 He, Zhang, Zhang, Qian and Chen. This is an open-access article distributed under the terms of the Creative Commons Attribution License (CC BY). The use, distribution or reproduction in other forums is permitted, provided the original author(s) and the copyright owner(s) are credited and that the original publication in this journal is cited, in accordance with accepted academic practice. No use, distribution or reproduction is permitted which does not comply with these terms.
*Correspondence: Quan Chen, cWNoZW5AY2lhYy5hYy5jbg==