 Alan Overcash1,2†
 Michael Overcash
- 1Environmental Genome Initiative, Sautee Nacoochee, GA, United States
- 2Environmental Clarity, Inc., Reston, VA, United States
- 3Sustainable Innovation Office, The Novo Nordisk Foundation Center for Biosustainability, Technical University of Denmark, Kongens Lyngby, Denmark
L-tryptophan is a naturally occurring α-amino acid that is also purchased by consumers for medicinal and dietary purposes. L-tryptophan is also a starting point for synthesizing medical derivatives with antiplatelet aggregation and antibacterial activity. Beneficial direct use and subsequent synthetic product use were evaluated with respect to the environmental footprint of the cradle-to-L-tryptophan manufacturing process, using the next generation life cycle inventory technology of the Environmental Genome. The principal route is fermentation from sugar (dextrose). The environmental metrics quantified were natural resource energy combustion (NREc) and CO2eq for air (defined below). The environmental boundary includes 137 chemical intermediates (gate-to-gates, gtg), of which 33 are non-repeating, with the most consequential for the environmental metrics being dextrose and the L-tryptophan. The cradle-to-gate process energy is 147 MJ/kg L-tryptophan, while the more comprehensive natural resource energy combustion (NREc) is 222 MJ/kg L-tryptophan. The carbon footprint is 18.7 kg CO2equivalent/kg L-tryptophan, with 53% of this from the cradle-to-gate of the supply chains. It is important to note this is only a partial environmental assessment of L-tryptophan since the environmental benefits of use in consumption and when used to make preventative pharmaceuticals are not included.
Introduction
L-tryptophan is an aromatic amino acid that has major usage as a feed for monogastric animals and numerous derivatives ranging from supplements, nutraceuticals, and therapeutics (Iwuji et al., 2014). The feed usage for pigs and poultry results in high volumes of L-tryptophan around the globe (Food Agriculture Organization of the United Nations, 2021). For consumers, the positive influence of L-Tryptophan on human sleep has been known for decades (Wyatt et al., 1970). One of the supplements that people use is L-Tryptophan. Studies have shown that L-Tryptophan consumption in excess of 1 g leads to improved sleep quality (Sutanto et al., 2022). This has further expanded the demand for Tryptophan and the sleep- enhancing derivatives (such as Melatonin) for direct consumption by humans. Advances in synthetic biology in the past decades, have led to several complex derivatives that could be accessed with L-tryptophan as a platform chemical. These include compounds such as serotonin, tryptamine, auxin, kynurenines and melatonin, critical in key regulatory functions for sleep, appetite, mood and pain (Mukherjee and Maitra, 2015; Han et al., 2019). In recent years, several alkaloids based on L-tryptophan and derivatives (such as strictosidine) have been produced in yeast (Brown et al., 2015; Courdavault et al., 2021; Romero-Suarez et al., 2022).
In recent years, with an increasing focus on sustainability and distributed supply chains, L-tryptophan and derivatives offer a great potential to be accessed further. Specifically, the goal is to transform a natural product-based supply chain to a more robust fermentation-based one. Robust fermentation-based production methods would enable exploring the true potential to develop L-tryptophan derivative compounds (Woodruff, 1980). Via an L-tryptophan-based microbial production, key therapeutic ingredients such as monoterpenoid indole alkaloids (MIAs) could be produced. This would enable exploring thousands of novel production schemes (over 2000 MIAs exist) to decentralize the supply chain of anti-cancer and anti-Alzheimer drugs (MIAMi Project EU, 2019), hence reducing the risks to supply disruptions to the production.
To our knowledge, scarce literature studies are looking into the environmental sustainability aspects of such alternative production schemes. Hence, researchers would benefit by access to parameters pertaining to the economic and environmental performance of L-tryptophan.
The cradle-to-gate (ctg) life cycle inventory (LCI) for L-tryptophan (CAS 73-22-3) presented herein was performed as a part of a larger life cycle inventory investigating the environmental footprint of new derivatives of L-tryptophan. Fermentation routes to industrial chemicals have previously been done by the Environmental Genome research group, such as vancomycin hydrochloride. The synthetic production of vancomycin LCI showed solvent and energy usage to have the greatest impacts on the life cycle assessment (Jimenez-Gonzalez and Overcash, 2000). This finding has led to the development of tools to help scientists select “greener” solvents and routes for new active ingredients manufacturing (Curzons et al., 2007; Slater and Savelski, 2007).
Historically L-L-tryptophan was manufactured by fermentation of a mixture of sugar, indole, and pyruvate using yeast (Hansenula anomala). However, the relatively high cost of indole and the development of genome engineering and microbiome science to re-design metabolic pathways in microorganisms led to research that produced a genetically modified bacterium that produced L-tryptophan at a significantly higher yield (30–50+ gm/l vs. 10–12 gm/l) using only sugar as a source of carbon and an ammonium compound as a source of nitrogen. The modified bacterium is Corynebacterium glutamicum.
This breakthrough eliminated indole as a feedstock and enabled the bacterium to produce the indole and pyruvate precursors, followed by the production of L-tryptophan. The modifications also improved yield by eliminating alternate pathways that did not result in an L-tryptophan product. Additional research to modify Escherichia coli was also successful but did not match or exceed the yield from C. glutamicum. It is important to note that research in this area is still very active, with much of the work led by Professor Masato Ikeda at the Tokyo Research laboratories. The choice of which form of sugar is based on the economics of the local supply chain. This study uses dextrose as a sugar and ammonium hydroxide and oxygen from the air as the other primary ingredients.
The backbone of life cycle assessment (LCA) is the life cycle inventory, or a compilation of all inputs, outputs, and energy use of a product from resource extraction, manufacturing, product use, recycling, and disposal (Rebitzer et al., 2004). Life cycle assessment is a “methodical framework for estimating and assessing the environmental impacts attributable to the life cycle of a product” (Hendrickson et al., 2006). ISO 14040 and 14044 outline the requirements for conducting life cycle inventory and assessment studies (International Standard Organization, 2006a,b). A life cycle inventory gives the complete environmental picture of a product, and can be used to improve the manufacture of products by highlighting where changes can be made to have the most impact on raw materials and energy use and emissions.
This work intends to perform the cradle-to-gate inventory for the production of L-tryptophan (CAS 73-22-3), Figure 1. An additional goal is to provide the life cycle community with usable process information for other future life cycle studies. The scope is from the natural resources through tothe manufacture of L-tryptophan (cradle-to-gate). Use and disposal of the L-tryptophan are not included in this LCI analysis. This study uses transparent gate-to-gate (within the factory) inventories, and the cradle-to-gate inventory is the summation of these first-level inventories of each chemical in the supply chain. This method follows the advanced Environmental Genome methodology (www.environmentalgenome.org; Overcash, 2016).
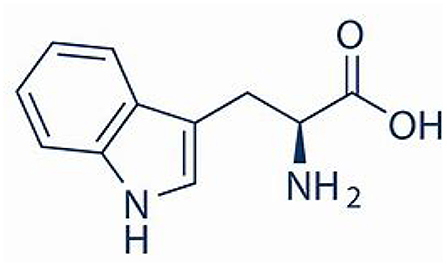
Figure 1. Chemical structure of L-tryptophan.
Methodology
The Environmental Genome is a detailed chemical and process system that links all industrial chemicals and materials in production. It can be defined as the map of origin and development, in both time and place, of molecular building processes for the ~100,000 chemicals and materials used industrially to build nearly every product (trillions of trillions) in current use by our global society (Overcash, 2016).
The Environmental Genome methodology is the next generation life cycle inventory (LCI) analysis technology. Information for each chemical/material includes detailed unit process analyses used in the design and construction of these manufacturing facilities. The goal is to have LCI information that mirrors the detailed information used by industry in design, operation, and process improvement, so that the environmental analyses can more easily diagnose alternatives, improvements, new concepts, and be linked to other tools for economic assessment.
The uniformity of the Environmental Genome methodology supports the ability to look at detailed process analyses across whole supply chains to assure uniform connectivity between each node of the supply chain. The Environmental Genome methodology thus provides a working standard (as defined in the metrology field; Wikipedia, 2021) for complex environmental assessments of chemical manufacturing and supply chains. This design-based LCI methodology (Jimenez-Gonzalez and Overcash, 2000; Overcash, 2016) using process flow diagrams and engineering design principles is used to collect inventory data (e.g., process inputs, process operations, waste generated, etc.) and complete gate-to-gate inventories for each chemical in the supply chain of L-tryptophan. The Environmental Genome is primarily a database with about 2,000 gate-to-gates of chemical manufacturing processes (each with a CAS number). Examples of the Environmental Genome data are on the website to allow an understanding of this next generation approach (www.environmentalgenome.org). Data are currently shared in collaborative projects and as developed in new initiatives. Contact is bXJvdmVyY2FzaEBlYXJ0aGxpbmsubmV0.
For more in-depth discussion of the methodology used in life cycle analysis, the reader should consult Brusseau (2019) and Liebsch (2019).
Terminology
(a) Gate-to-Gate (gtg) is the analysis boundary of a single plant with inputs and products.
(b) Cradle-to-Gate (ctg) is the assembly of gtgs that typically extend from natural resources in the earth, along the necessary building steps to reach a final product, an example for L-tryptophan is provided in the Supplementary Materials section of this paper.
(c) Natural resource energy combustion (NREc)—The energy value (high heat value, HHV) of fossil resources extracted from the earth to supply the process energy (electricity, heat, etc.) throughout the supply chain. This includes energy used to extract, transport, generate, and deliver energy to the point of use. Combustion of fuels leads directly to impacts such as global warming, blue water, and human health.
(d) Global warming potential (GWP) from TRACI 2.1 (US EPA, 2013), expressed as kg CO2equivalent (In paper this is shortened to CO2eq when referring to the environmental impact parameter)
Results
Dextrose is the primary input to the L-tryptophan production process. Dextrose is made from carbohydrates and corn is grown in abundance in the US (https://www.usda.gov/media/blog/2019/07/29/corn-americas-largest-crop-2019) so it is selected as the source of dextrose. The functional unit, or basis of all analyses, is 1,000 kg L-tryptophan. Dextrose, along with ammonium hydroxide and oxygen, is used to create the L-tryptophan molecule (see full chemical tree for L-tryptophan in Supplementary Material). The gate-to-gate inventory of L-tryptophan is built on the reaction in Figure 2. In addition, carbon dioxide and water are produced.
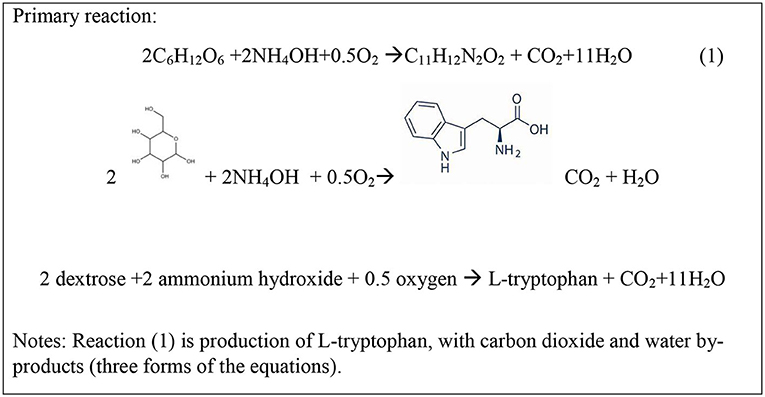
Figure 2. Dextrose role in L-tryptophan synthesis.
According to Ikeda and Katsumata (1999), of the total carbon in dextrose reacted, 31% is converted to L-tryptophan carbon, 12% is converted to biomass carbon, 48% is converted to CO2 carbon, and 10% is converted to carbon in other amino acids. To simplify the reactions, this analysis is based on 31% conversion to L-tryptophan carbon, 22% conversion to biomass carbon, and 48% conversion to CO2 carbon. Dextrose is also the substrate for production of the cell growth and respiration of Corynebacterium glutamicum as shown by reactions in Figure 3.
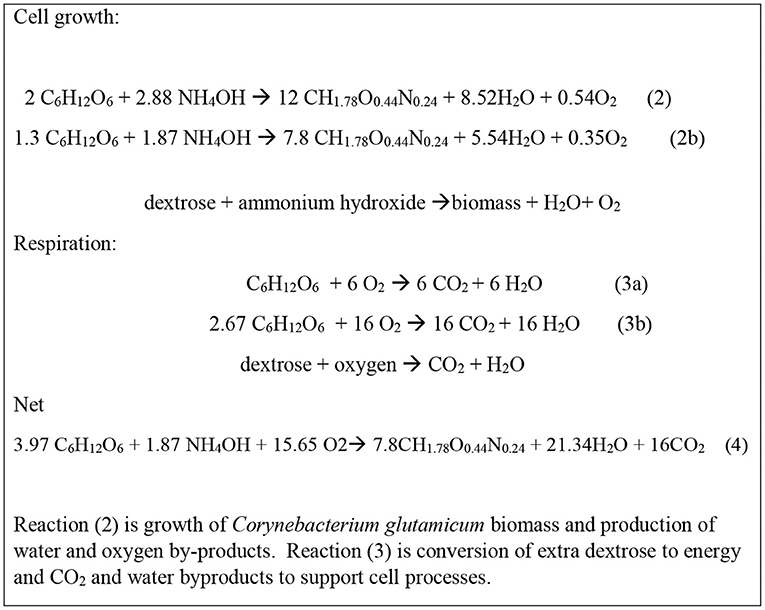
Figure 3. Dextrose utilization in Corynebacterium glutamicum biomass production (reactions s 2a, 2b) and respiration (reactions 3a, 3b). Coefficients not repeated in word equations below.
Calculation on the basis of 1 mole of L-tryptophan production (R1 refers to reaction 1) as the extent of reaction allows the quantification of the dextrose used in biomass production and cellular respiration. Using the Ikeda and Katsumata (1999) carbon balance,
(a) (R1) each mole of L-tryptophan produces 11 moles carbon in L-tryptophan (31% of dextrose carbon) and requires 2 moles of dextrose and also produces 1 mole C in CO2, Figure 2.
(b) (R2, Figure 3) biomass production is 22% of the total dextrose carbon which for 11 moles of L-tryptophan carbon is 22%/31% * 11 moles of carbon in L-tryptophan = 7.8 moles of C produced as biomass in R2 (2b).
(c) (R3, Figure 3) Total CO2 production is 48% of the total dextrose carbon which is for 11 moles of L-tryptophan carbon is 48%/31% *11 moles of carbon in L-tryptophan = 17 moles of carbon produced as CO2. One mole of CO2 is produced in R1 and so 16 moles are produced in R3 (3b).
Scaling reactions 2a and 3a for the carbon balance gives the biomass growth and respiration in reactionss 2b and 3b. The scaled reactions 2b, and 3b when combined give reaction 4 provides the cellular stoichiometry associated with the L-tryptophan production.
With the use of dextrose for both L-tryptophan synthesis and for the growth and respiration of the Corynebacterium glutamicum biomass, the total production reactions are given in reaction 5, Figure 4. These data allow the determination of the inputs and products and wastes in the L-tryptophan production process.

Figure 4. Overall L-tryptophan synthesis chemical process.
The synthesis and purification of L-tryptophan was developed from various nonproprietary sources. The distribution of carbon into L-tryptophan, CO2, and biomass is an important parameter that determines the overall mass efficiency and production of direct CO2 emissions. This distribution and the relative extents of reactions were specified in the Ikeda and Katsumata (1999). The distribution of products from the reactor in this report is shown to match that specified by Ikeda and shown in Figures 2–4.
The L-tryptophan manufacturing process is often a two-stage process shown schematically in Figure 5. The beginning is single-cell bacteria added to a growth medium in a small fermenter where it multiplies rapidly from 0.01–0.05 gm/l to 30–100 dry cell weight/l. This inoculum is then transferred to an aerated production fermenter containing dextrose and ammonium hydroxide. In this gtg, 10% excess ammonium hydroxide over the amount needed by reactions is added. Oxygen is also added at a 10% excess, to ensure that neither ammonium nor oxygen is rate-limiting. The amount of water used was calculated so that the L-tryptophan concentration out of the reactor was 11 g/L (less than the maximum of 12 g/L at which L-tryptophan begins to precipitate). Production fermentation usually operates in the following ranges—pH: 6.5–7.5; temperature 30–40°C for 24–120 h. A pH of 7, the temperature of 30°C, and the fermentation time of 80 h were used in this gtg.
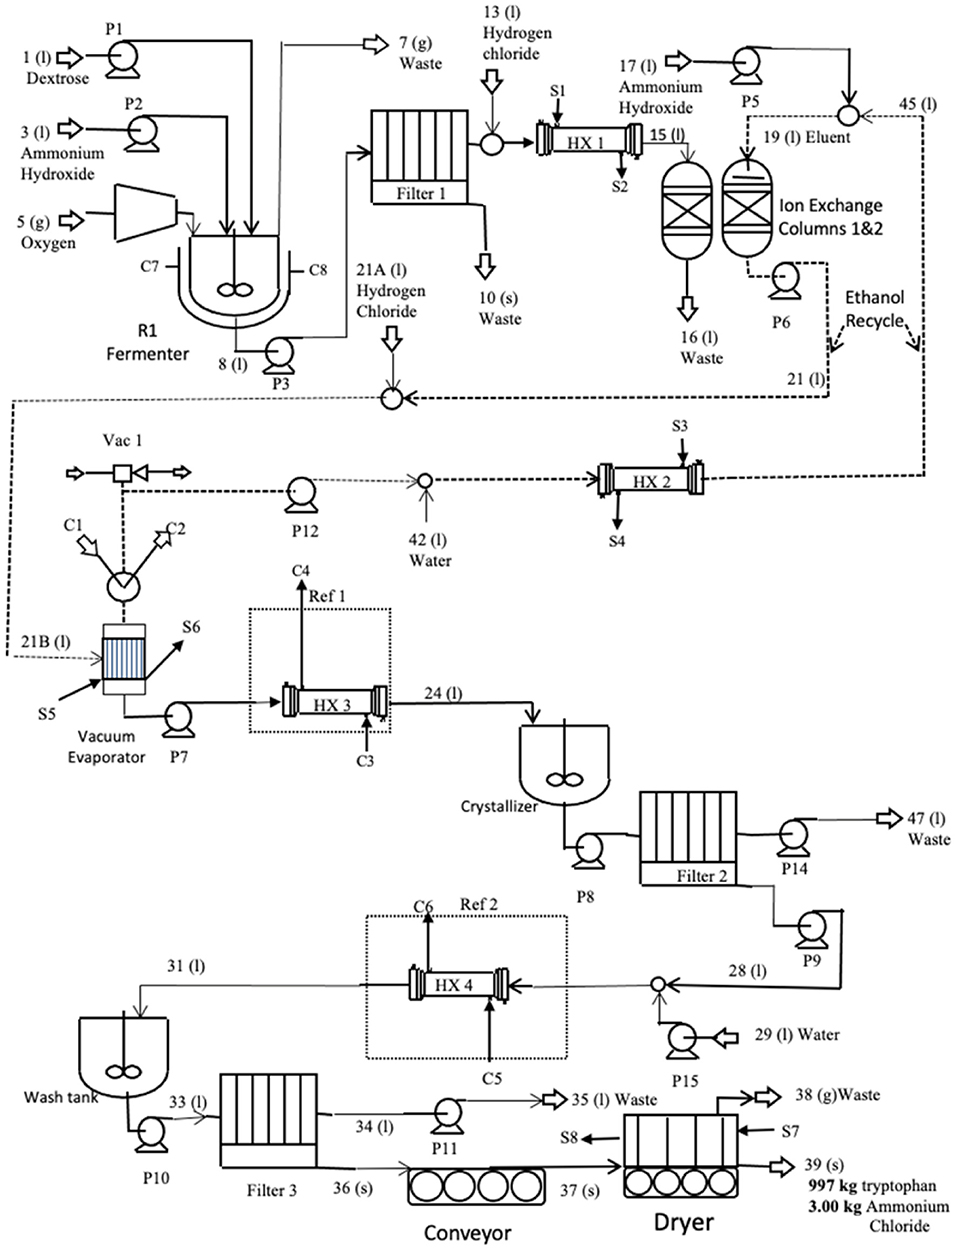
Figure 5. Process schematic of synthesis and purification of L-tryptophan.
The broth from the fermenter is first filtered (filter 1) to remove the biomass solids. The solids stream is 47% solids. The water in the biosolids contains L-tryptophan at 11 g/l and this stream is the main point of product loss. Biomass is a waste stream that can potentially be sold as fertilizer after drying it and standardizing the nitrogen, phosphorus, and potassium analyses. In this life cycle assessment, it is discarded as a waste stream.
The pH of the liquid out of the filter is reduced to 2 using HCl and heated to 48°C to help keep the product in the solution and enable it to bind it to the ionic resin. The amount of HCl used is calculated based on the amount needed to neutralize excess ammonium hydroxide and reduce the stream pH to 2. It is then sent to ion exchangers where the L-tryptophan binds to the resin while the water, ammonium chloride, and other contaminants are discharged in a waste stream. Once the resin bed is full and the L-tryptophan concentration in the waste stream begins to rise, the input stream is switched to a second ion exchange column, and a 50 wt% ethanol/50 wt% water solution is pumped through the first ion exchanger to remove the product from the resin into the ethanol/water stream. The amount of ethanol/water used to elute L-tryptophan is ~19 kg ethanol plus 20 kg water per kg of L-tryptophan.
The ethanol/water/L-tryptophan stream is pumped to a vacuum evaporator, operating at 48°C and 0.26 atm. These conditions prevent the product from exceeding 50°C, the temperature at which it begins to decompose. The evaporated ethanol is combined with fresh water and recycled back to the ion exchange columns. The temperature of the liquid stream from the vacuum evaporator containing water and L-tryptophan is reduced to 5°C, and the pH is raised to 5.8, the isoelectric point, in preparation for the crystallization step. At this pH, the product has a neutral charge and is most easily precipitated.
From the cooling heat exchanger, the product stream enters a continuous stirred tank crystallizer where the L-tryptophan precipitates. The stream is then filtered. The water stream from filter 2 is recycled to the ethanol stream from the first evaporator where it is reheated to 48°C, and pumped to the ion exchange columns.
The solids discharged from filter 2 contain the product and water. This stream is processed again to remove small contaminants, primarily ammonium chloride, that imparts a yellow tint to the crystals. Water is added and cooled (5°C) to dilute the soluble contaminants. This stream is added to a wash tank where it is gently agitated before it is pumped to the final filter where 91% of the water is removed.
The remaining water in the L-tryptophan cake is removed in an air dryer at 48°C. The final product is allowed to cool at ambient conditions. To compensate for the low operating temperature, the dryer efficiency was reduced by 50%, which results in a higher energy requirement.
The mass balance of the L-tryptophan process is given in Table 1, demonstrating the accounting of all inputs and outputs. The emissions were 56 wt% of the inputs and were primarily carbon dioxide and ammonium chloride (neutralized ammonium hydroxide with hydrochloric acid), Table 1. Nonreacting inputs were 98% all inputs and were primarily water and secondarily nitrogen. The emissions were 56% of the reacting inputs and were primarily CO2 and ammonium chloride.
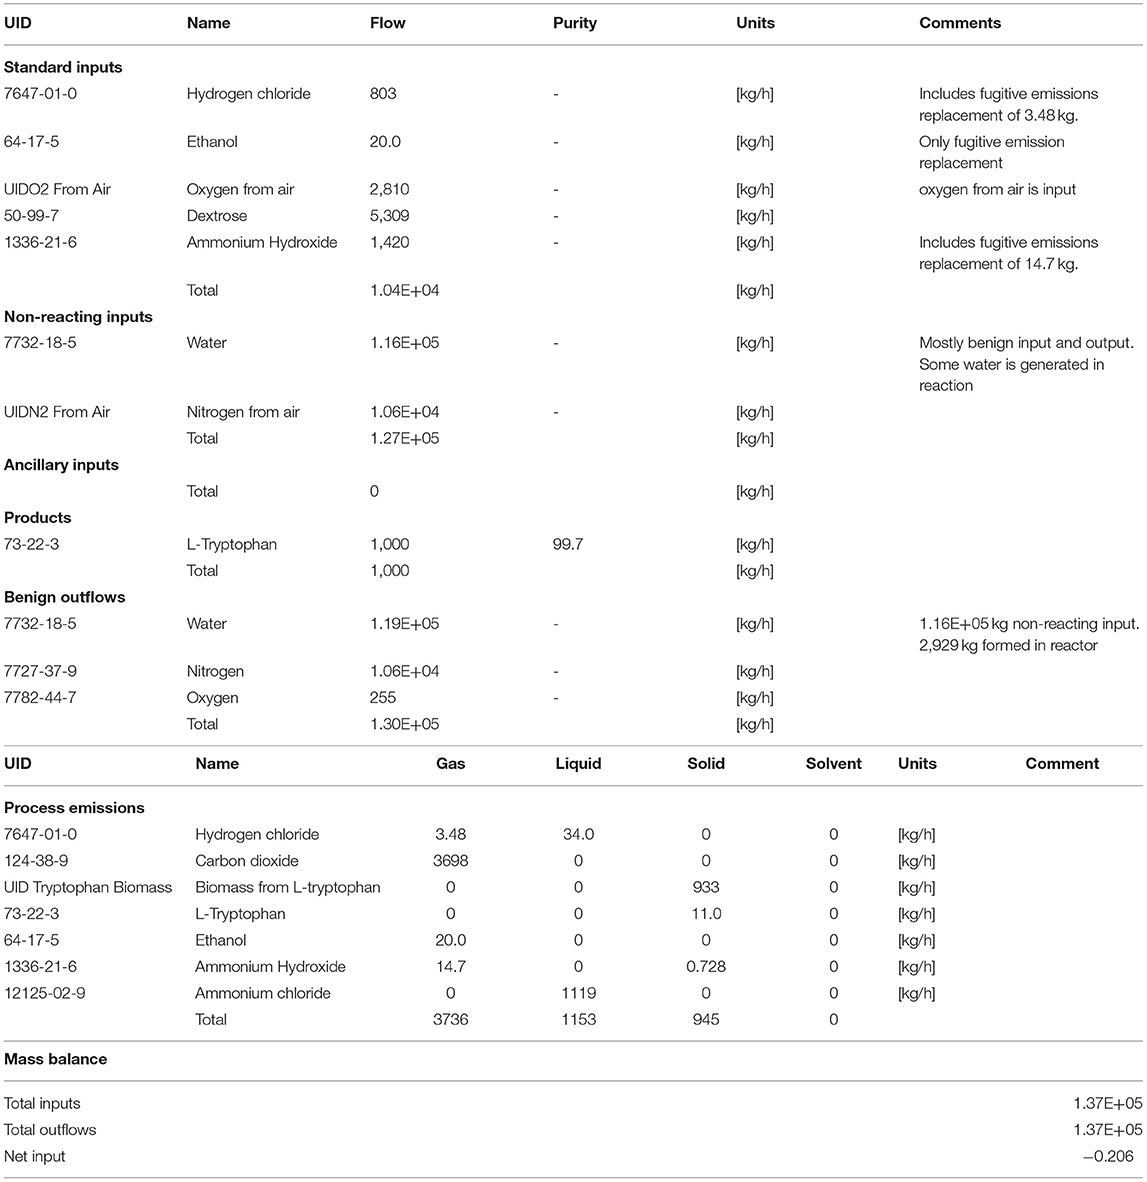
Table 1. Mass balance data of all constituents involved for L-tryptophan manufacturing process (gate-to-gate) as illustrated in Figure 5.
The total environmental footprint of L-tryptophan couples the gate-to-gate of the L-tryptophan process and the full cradle-to-gate of the inputs to the L-tryptophan process. In the Supplementary Material shows the full cradle-to-gate of the entire L-tryptophan process.
Table 2 provides a complete cradle-to-gate profile of L-tryptophan as a commercial product. Two levels of energy use are quantified across six forms of energy found in the entire chemical system cradle-to-gate for L-tryptophan. The first level is process energy, the actual inputs from sources such as the boilers providing steam (<207°C), Dowtherm (207–400°C), and higher temperature requirements (>400°C). Also, energy inputs include the electrical grid (U.S. national system) and for transport of chemicals across the supply chain and to final use. Additionally, estimates of energy savings through heat integration are given as heat potential recovery. In Table 2, the L-tryptophan energy is for the gate-to-gate of processes used in the manufacture (Figure 5). The necessary inputs to L-tryptophan production are given as cradle-to-gate, thus providing the full environmental footprint as process energy. In the final column, the process energies are scaled to the second level, natural resource energy, the comprehensive measure of the energy use and hence the full energy-related environmental impact.
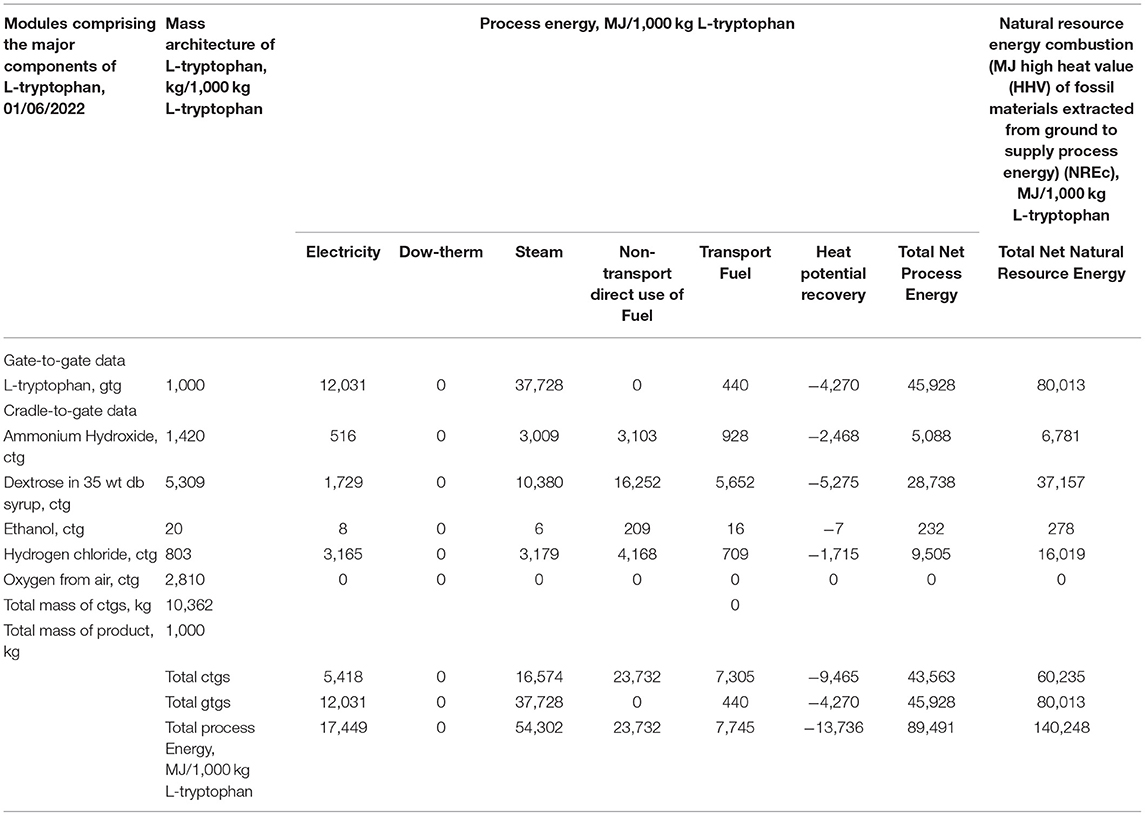
Table 2. Process and natural resource energy combustion (NREc) for L-tryptophan cradle-to-gate (ctg).
As is often the case, the energy used across the supply chains is larger than that of actual energy to synthesize the L-tryptophan. Of these supply chain contributions, dextrose is the largest, primarily because of the larger mass contribution to the manufacture, Table 2. It is also observed that electricity use and hence the electrical grid are only a small contribution (about 12%); hence the geospatial influence of national electrical grids is not large.
Using carbon dioxide equivalents (kg CO2eq) as an environmental impact metric (greenhouse gas, GHG) is of wide interest, Table 3 provides these data for L-tryptophan. To help diagnose the factors in the carbon footprint, Table 3 first provides the GHG estimates for L-tryptophan and the inputs to that process on the basis of 1,000 kg of each chemical. The sources of the GHG are divided into those from the direct process chemical emissions and those from emissions ascribed to the use of energy and for transport. Of the inputs, ethanol, hydrogen chloride, and dextrose as syrup are similar in kg CO2eq/1,000 kg of material. However in the second section of Table 3 when adjusted for the amount of each material needed in L-tryptophan production the results show dextrose is the largest (kg CO2eq/1,000 kg tryptophan, L). From Table 3 the importance of energy use emissions of CO2eq is shown as about 1.5 to 15-fold greater than those from direct chemical manufacturing emissions. Transport impact on greenhouse gas is small.
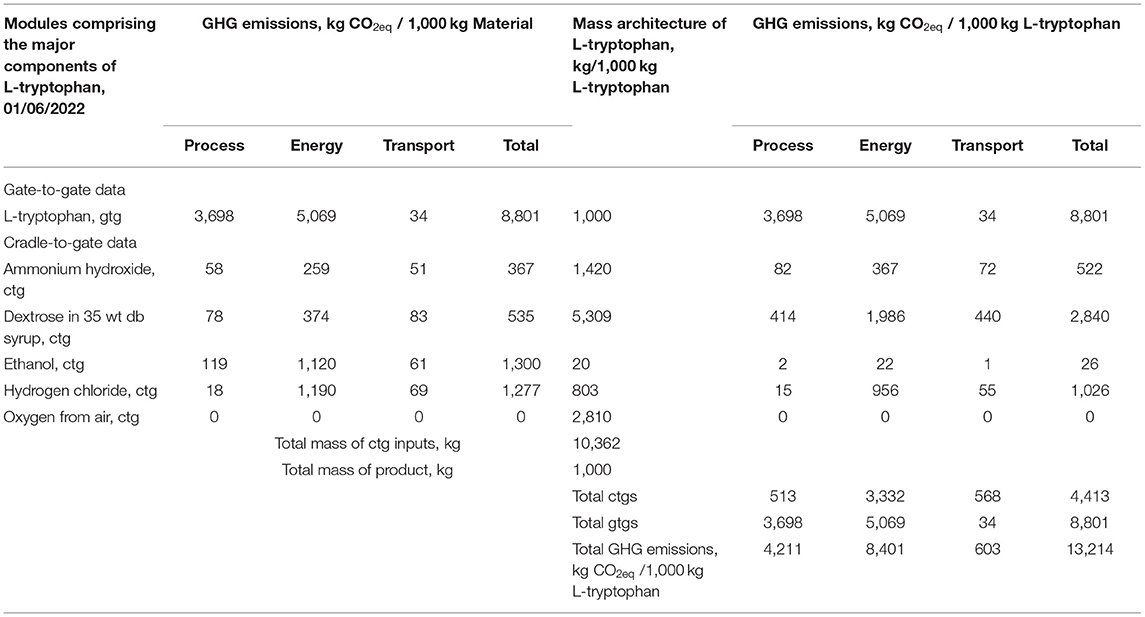
Table 3. Greenhouse gas emissions for L-tryptophan cradle-to-gate (ctg).
Discussion
Performing a life cycle inventory provides a complete picture of energy and raw material usage to manufacture a product tracing back to the cradle, or the natural resources in the earth. The Environmental Genome database, highlights areas that can be targeted for improvement to get the most impact on the environmental performance.
The LCI for this batch fermentation process shows that the L-tryptophan manufacturing process is about 36% of the total energy demand to produce this product. The balance is from the energy needs of the supply chain and transport. In the supply chain category, the largest energy usage is in the cradle-to-gate for producing dextrose, the primary fermentation input. These relative environmental impacts are also seen in the emission of carbon dioxide and equivalent potential global warming chemical emissions.
Energy consumption is the largest carbon footprint contributor to the emissions generated across the L-tryptophan and the input cradle-to-gate supply chains. The L-tryptophan is somewhat higher in kg CO2eq because of the additional input from the microbial respiration.
The life cycle inventory of L-tryptophan will be incorporated in the life cycle inventory of new pharmaceuticals derived from L-tryptophan. It is important to note this is only a partial environmental assessment of L-tryptophan since the environmental benefits of L-tryptophan use in consumption and when used to make preventative pharmaceuticals are not included.
Contribution to Environmental Sustainability Knowledge
L-tryptophan is a biobased consumer product, but also is an important intermediate in building advanced chemicals that prevent disease (anti-cancer and anti-Alzheimer drugs). There is a large supply chain (137 chemicals) needed to take natural resources in the earth and build molecules to produce tryptophan. This paper demonstrates the next generation life cycle inventory methodology developed in the Environmental Genome (www.environmentalgenome.org) to examine the details of energy use and mass efficiency along the whole supply chain and the fermentation process to make tryptophan. The principal route in this fermentation is from sugar (dextrose). The comprehensive natural resource energy (NREc) is found to be 222 MJ/kg tryptophan. The carbon footprint is 18.7 kg CO2eq/kg tryptophan with 53% of this from the cradle-to-gate of the supply chains. It is also noteworthy that in the carbon footprint the importance of energy use emissions of CO2eq is about 3-fold greater than those from direct chemical manufacturing emissions. Transport impact on greenhouse gas is small. It is important to note this is only a partial environmental assessment of tryptophan since the environmental benefits of use in consumption and when used to make preventative pharmaceuticals are not included.
Data Availability Statement
The datasets presented in this article are not readily available because to be shared to joint project participants. Requests to access the datasets should be directed to MO, bXJvdmVyY2FzaEBlYXJ0aGxpbmsubmV0.
Author Contributions
All authors listed have made a substantial, direct, and intellectual contribution to the work and approved it for publication.
Funding
This work was supported by the Novo Nordisk Foundation (grant number NNF20CC0035580) and MIAMi EU Project (grant agreement ID: 814645). Novo Nordisk Foundation was not involved in the study design, collection, analysis, interpretation of data, the writing of this article or the decision to submit it for publication.
Conflict of Interest
AO, EG, and MO were employed by Environmental Clarity, Inc., Reston, VA, United States.
The remaining author declares that the research was conducted in the absence of any commercial or financial relationships that could be construed as a potential conflict of interest.
Publisher's Note
All claims expressed in this article are solely those of the authors and do not necessarily represent those of their affiliated organizations, or those of the publisher, the editors and the reviewers. Any product that may be evaluated in this article, or claim that may be made by its manufacturer, is not guaranteed or endorsed by the publisher.
Supplementary Material
The Supplementary Material for this article can be found online at: https://www.frontiersin.org/articles/10.3389/frsus.2022.863914/full#supplementary-material
References
Brown, S., Clastre, M., Courdavault, V., and O'Connor, S. E. (2015). De novo production of the plant-derived alkaloid strictosidine in yeast. Proc. Natl. Acad. Sci. U. S. A. 112, 3205–3210. doi: 10.1073/pnas.1423555112
Brusseau, M. (2019). “Sustainable development and other solutions to pollution and global change,” in Environmental and Pollution Science, 3rd ed, eds M. Brusseau, I. Pepper and C. Gerba (Elsevier), 585–603. doi: 10.1016/B978-0-12-814719-1.00032-X
Courdavault, V., O'Connor, S. E., Jensen, M. K., and Papon, N. (2021). Metabolic engineering for plant natural products biosynthesis: new procedures, concrete achievements and remaining limits. Nat. Prod. Rep. 38, 2145–2153. doi: 10.1039/D0NP00092B
Curzons, A. D., Jimenez Gonzalez, C., Duncan, A. L., Constable, D. J., and Cunningham, V. L. (2007). Fast life cycle assessment of synthetic chemistry (FLASC™) tool. Int. J. Life Cycle Ass. 12:272. doi: 10.1065/lca2007.03.315
Food Agriculture Organization of the United Nations (2021). Executive Summary. Available online at: https://www.fao.org/3/y5019e/y5019e03.htm (accessed December 2021).
Han, Q., Phillips, R. S., and Li, J. (2019). Editorial: aromatic amino acid metabolism. Front. Mol. Biosci. 6, 22. doi: 10.3389/fmolb.2019.00022
Hendrickson, C., Lave, L., Matthews, H., Horvath, A., Joshi, S., McMichael, F., et al. (2006). Environmental Life Cycle Assessment of Goods and Services: An Input-Output Approach. Washington, DC: Resources for the Future.
Ikeda, M., and Katsumata, R. (1999). Hyperproduction of L-tryptophan by Corynebacterium glutamicum with the modified pentose phosphate pathway. Appl. Environ. Microbiol. 1999, 2497–2502. doi: 10.1128/AEM.65.6.2497-2502.1999
International Standard Organization (2006a). ISO 14040:2006 Environmental Management - Life Cycle Assessment - Principles and Framework, 20.
International Standard Organization (2006b). ISO 14044:2006, Environmental Management — Life Cycle Assessment — Requirements and Guidelines, 46.
Iwuji, T. C., Akinmutimi, A. H., Ogbuewu, I. P., Etuk, I. F., and Odoemelam, V. U. (2014). Roles of tryptophan in monogastric nutrition: a review. Adv. Agric. Sci. Eng. Res. 4, 1544–1556. doi: 10.2741/s152
Jimenez-Gonzalez, C., and Overcash, M. R. (2000). Energy optimization during early drug development and the relationship with environmental burdens. J. Chem. Technol. Biotechnol. 75, 983–90. doi: 10.1002/1097-4660(200011)75:11<983::AID-JCTB307>3.0.CO;2-E
Liebsch, T. (2019). Life Cycle Assessment (LCA) – Complete Beginner's Guide. Amsterdam: Ecochain Technologies BV.
MIAMi Project EU (2019). Refactoring Monoterpenoid Indole Alkaloid Production in Microbial Cell Factories. MIAMi Project EU. Available online at: https://www.miami-project.eu/ (accessed January 13, 2022).
Mukherjee, S., and Maitra, S. K. (2015). Gut melatonin in vertebrates: chronobiology and physiology. Front. Endocrinol. 6:112. doi: 10.3389/fendo.2015.00112
Overcash, M. (2016). Environmental genome of industrial products (EGIP): the missing link for human health. Green Chem. 18, 3600–3606 doi: 10.1039/C6GC00182C
Rebitzer, G., Ekvall, T., Frischknecht, R., Hunkeler, D., Norris, G., Rydberg, T., et al. (2004). Life cycle assessment part 1: framework, goal and scope definition, inventory analysis, and applications. Environ. Int. 30, 701–720. doi: 10.1016/j.envint.2003.11.005
Romero-Suarez, D., Keasling, J. D., and Jensen, M. K. (2022). Supplying plant natural products by yeast cell factories. Curr. Opin. Green Sustain. Chem. 33, 100567. doi: 10.1016/j.cogsc.2021.100567
Slater, C. S., and Savelski, M. (2007). A method to characterize the greenness of solvents used in pharmaceutical manufacture. J. Environ. Sci. Heal. A 42, 1595–1605. doi: 10.1080/10934520701517747
Sutanto, C. N., Loh, W. W., and Kim, J. E. (2022). The impact of tryptophan supplementation on sleep quality: a systematic review, meta-analysis, and meta-regression. Nutr. Rev. 80, 306–316. doi: 10.1093/nutrit/nuab027
US EPA (2013). Tool for Reduction and Assessment of Chemicals and Other Environmental Impacts (TRACI), Version 2.1. Available online at: https://www.epa.gov/chemical-research/tool-reduction-and-assessment-chemicals-and-other-environmental-impacts-traci (accessed Augest 09, 2021).
Wikipedia (2021). Standard (Metrology). Available online at: https://en.wikipedia.org/wiki/Standard_%28metrology%29 (accessed January 29, 2022).
Woodruff, H. B. (1980). Natural products from microorganisms. Science 208, 1225–1229. doi: 10.1126/science.7375932
Keywords: L-tryptophan, life cycle analysis, environmental genome, natural resource energy combustion, carbon footprint
Citation: Overcash A, Griffing E, Sukumara S and Overcash M (2022) Environmental Sustainability Analysis of L-Tryptophan as a Consumer Product and Intermediate to Pharmaceutical Active Ingredients. Front. Sustain. 3:863914. doi: 10.3389/frsus.2022.863914
Received: 27 January 2022; Accepted: 23 March 2022;
Published: 02 May 2022.
Edited by:
Lei Huang, University of Michigan, United StatesReviewed by:
Aida Luz Villa, Universidad de Antioquia, ColombiaDaniele Cespi, Università degli Studi di Bologna, Italy
Copyright © 2022 Overcash, Griffing, Sukumara and Overcash. This is an open-access article distributed under the terms of the Creative Commons Attribution License (CC BY). The use, distribution or reproduction in other forums is permitted, provided the original author(s) and the copyright owner(s) are credited and that the original publication in this journal is cited, in accordance with accepted academic practice. No use, distribution or reproduction is permitted which does not comply with these terms.
*Correspondence: Michael Overcash, bXJvdmVyY2FzaEBlYXJ0aGxpbmsubmV0
†These authors have contributed equally to this work