 Jun Liang
 D. Gillies
 E. Donovan
 H. Parry
 I. Mann2
 M. Connors
- 1Department of Physics and Astronomy, University of Calgary, Calgary, AB, Canada
- 2Department of Physics, University of Alberta, Edmonton, AB, Canada
- 3Athabasca University Observatories, Athabasca, AB, Canada
The existence of detached/isolated auroral structures in the subauroral ionosphere has been recognized and studied for decades. One major subset of such detached auroras is the so-called “isolated proton aurora” (IPA). IPA is characterized by substantial hydrogen emissions and thus inferred to be proton aurora, but is also accompanied by other emission lines. In particular, IPA is usually dominated by 557.7 nm green-line emissions in optical luminosity. To date, there is still a lack of dedicated spectrographic study and detailed comparison among structures in different emission lines of IPA. The intensity ratios between the 557.7 nm and hydrogen emissions in IPA have not been well established from concurrent observations or theoretical models. In this study, we report an IPA event during ∼0245–0345 UT on 12 October 2021, the Canada Thanksgiving storm night. Using multi-station, multi-wavelength optical instruments, including the Transition Region Explorer (TREx) spectrograph, we investigate the evolution and spectrographic properties of the IPA. In-situ and ground magnetometer data show evidence of electromagnetic ion cyclotron (EMIC) waves associated with the passage of IPA, supporting a causal link between the EMIC wave and the proton precipitation. The precipitating proton energies are estimated to range between a few keV and a few tens of keV according to the IPA emission heights inferred from triangulation analyses. Via careful examination of the spectral intensities and the elevation-angle profiles of the 557.7, 427.8, and 486.1 nm emissions based on the spectrograph data, we conclude that the 557.7 nm emissions contained in the IPA were unlikely to owe their source to energetic electron precipitation from the magnetosphere, but were the byproduct of the proton precipitation. The intensity ratio between the 557.7 nm (427.8 nm) and the 486.1 nm emissions of the IPA are confined within a relatively narrow range around ∼26 (∼4), which may serve as validation tests for existing and developing proton transport models.
1 Introduction
The existence of detached auroral arcs or isolated blobs/spots in the subauroral region equatorward of the main auroral oval has been known for decades (see e.g., a historical review by Frey, 2007). Such detached arc/blobs/spots may be present in dayside and nightside, and can be caused by either proton or electron precipitation (or both). In the dayside, emissions called afternoon detached proton arcs (Immel et al., 2002; Burch et al., 2002) and subauroral morning proton spots (Frey., 2007) were observed equatorward of the main auroral oval in the afternoon and morning sector, respectively. In the nightside, the so-called “evening corotating patch” (ECP) (Moshupi et al., 1977; Kobuta et al., 2003) was observed in the evening sector and was attributed to high-energy electron precipitation. Zhang et al. (2005; 2008) reported the “nightside detached auroras” caused by energetic proton precipitations during intense magnetic storms. Using data from the multi-wavelength all-sky-imagers (ASI) and induction magnetometers, Sakaguchi et al. (2007; 2008; 2015) investigated the “isolated proton auroras” in the evening sector and found them coincident with Pc1 geomagnetic pulsations. Those detached/isolated proton arcs/blob/spots, despite their differences in shapes and fine structures, are now often deemed to owe their source mechanisms to the electromagnetic ion cyclotron (EMIC) wave and its resulting pitch-angle scattering of ring-current ions in the inner magnetosphere (e.g., Immel et al., 2005; Sakaguchi et al., 2007, 2008, 2015; Yahnin et al., 2007; Yuan et al., 2010; Liang et al., 2014; Kim et al., 2021; Shumko et al., 2022). EMIC waves are generated in the equatorial region of the plasmasphere-magnetosphere by internal wave-particle interaction with ring-current ions (Fraser et al., 2005; Jordanova et al., 2007; Usanova et al., 2016). In ground magnetic observations, they are typically observed as Pc 1–2 (0.one to five Hz) waves (e.g., Mann et al., 2014; Sakaguchi et al., 2015). For a recent comprehensive review of the detached/isolated proton auroras in the subauroral region and their potential connection to EMIC wave activities, see Gallardo-Lacourt et al. (2021). Notwithstanding the diversity of terminologies used by different researchers due to historical reasons, since the study of Sakaguchi et al. (2007; 2008) the term “isolated proton auroras” (IPA) has become prevalent in literature in depicting those detached/isolated proton auroral structures, particularly in the nightside. We shall follow to use the term IPA in this paper, though sometimes we may also call it “detached arc” for a morphological depiction.
The existence of IPA in the subauroral region is also familiar to auroral chasers and citizen scientists. At one time, the name “proton arc” was used by some citizen scientists to depict the STEVE (Strong Thermal Emission Velocity Enhancement) phenomenon ── we of course now know they are fundamentally different in many key aspects. That being said, it was indeed noticed that some STEVE events were preceded by IPAs (Nishimura et al., 2020; Liang et al., 2021). Though beyond the interest of the current study, we mention that the event to be studied in this paper was also ensured by the occurrence of a “stable auroral red” (SAR) arc and a STEVE ∼1–2 h later. Possible relationship among the IPA, the SAR, and the STEVE, three pronounced subauroral optical phenomena, has been a topic of active research interest recently (e.g., Gallardo-Lacourt et al., 2021; Nishimura et al., 2022).
In this study we shall report an IPA event occurring on 12 October 2021 during a geomagnetic storm interval, commonly known as the Canada Thanksgiving storm. Over that night, a number of subauroral optical structures were seen over Canada, and aroused keen interest and discussions among citizen/professional scientists on social media. The IPAs are among these phenomena. A few spectacular examples of IPAs recorded by citizen scientists are given in Supplementary Material. Knowledgeable and inquisitive citizen scientists have raised the following questions: 1) what is the cause of these IPAs? 2) if these IPAs represent proton auroras, why do they look greenish just as normal electron auroras?
Different auroral emission lines at different wavelengths (colors) are characteristic of different excitation and chemical processes in the ionosphere. Proton precipitation is usually characterized by hydrogen emission lines such as Lyman-α (121.8 nm), Hα (656.3 nm), and Hβ (486.1 nm), among which the Hβ 486.1 nm is the most used in ground-based proton auroral measurements (Eather, 1967). Other pronounced auroral emission lines in the visible wavelength range include 427.8 nm, 557.7 nm, 630 nm, etc. (see e.g., Vallance-Jones, 1974). The 427.8 nm blue-line is among the N2+ first-negative-group (1NG), while the 557.7 nm green-line and 630 nm red-line result from excited oxygen atoms. These nitrogen and oxygen auroras can be led by both electron and proton precipitations. It has been known for a long time that proton auroras are accompanied by other emission lines/bands, and that some of these emission lines can be much stronger in optical brightness than the proton auroral lines (e.g., Eather, 1967, 1968). However, Eather (1967) noted that many of the early measurements of proton-induced auroras contained contributions from co-existing electron auroras. For some more recent examples, detached proton arcs seen by the IMAGE satellite show signals on both SI-12 (Lyman-α) and WIC (N2 LBH band) imagers (Immel et al., 2002, 2005; Frey, 2007). Via multi-wavelength ASI observations, Sakaguchi et al. (2007; 2008) noted that IPAs had counterparts in 557.7 and 630 nm wavelengths, and that the 557.7 nm emission dominated in terms of optical luminosity. However, those authors did not perform a detailed comparison among these emission lines. Due to the instrumental design, the 557.7 and 486.1 nm images involved in Sakaguchi et al. (2007)’s study were run at low time resolution (2 min) and were not taken at the same time epoch (separated by 34 s), which is not ideal for a cross-comparison between the two emission lines for dynamically time-varying IPAs. Nishimura et al. (2022) studied the 630 nm red-line emissions accompanying IPAs, and proposed that the associated red-line emissions may contribute to the initial formation of SAR. However, the relatively low viewing angle and the large difference between the emission altitudes of 630 nm and 486.1 nm hindered efforts to compare their structural shapes in detail. To the authors' knowledge, so far there is still a lack of a dedicated spectrographic study and detailed comparison among emission lines associated with IPAs. It has not been rigorously shown from concurrent observations whether a detached proton arc/blob and its correspondent 557.7 nm arc/blob share the same spatial structures and temporal variations or not. This leads to a remaining uncertainty of whether electron precipitation might co-exist and (partly) contribute to the detached 557.7 nm emissions. Such an uncertainty is compounded by the following complications in both observations and theories. 1) In-situ particle instruments usually have an energy limit (e.g., ∼30 keV for DMSP), so that electron precipitation beyond the observable range cannot be excluded. 2) It is known that a number of plasma waves, such as plasmaspheric hiss, whistler-mode chorus, and EMIC waves, may lead to electron precipitation in the inner magnetosphere, typically with energies from a few tens of keV up to >1 MeV (e.g., Summers et al., 2007; Miyoshi et al., 2008; Ni et al., 2015, 2017; Zhang et al., 2016, 2022; Fu et al., 2018). At times, hints of such electron precipitation appeared in in-situ particle observations in conjunction with IPAs (e.g., Nishimura et al., 2020; Shumko et al., 2022). 3) Detached auroral arcs/patches contributed by electron precipitation are known to exist (Wallis et al., 1979; Kobuta et al., 2003; Yadav and Shiokawa, 2021). For example, a detached arc recently studied by Yadav and Shiokawa. (2021) was found to be related to ∼0.1–2 keV electron precipitation. Mendillo et al. (1989) proposed that plasma-sheet-like electron precipitation might co-exist with proton precipitation and co-contribute to the detached arcs. 4) While various nitrogen auroras and OI 630 nm red-line auroras produced by proton precipitation have been quantitively modeled (e.g., Strickland et al., 1993; Lummerzheim et al., 2001; Galand and Lummerzheim, 2004), dedicated models of the OI 557.7 nm green-line emission led by proton auroral precipitation remain scarce in the existing literature. We are aware, both from private communications and from existing publications (e.g., Eather, 1967), that some researchers were not fully convinced that pure proton precipitation alone could lead to visually bright auroral display whose luminosity is dominantly contributed by 557.7 nm emissions.
In this paper, taking advantage of multi-station, multi-wavelength optical instruments, and aided by a variety of other ground and in-situ observations, we investigate the properties and dynamics of the IPA. In particular, we shall compare the signatures of IPA in various emission lines based on spectrograph measurements. Via such a comparison, we offer compelling arguments that the 557.7 nm green emissions of the detached arc are unlikely to owe their source to energetic electron precipitation from the magnetosphere, but are essentially the byproduct of proton precipitation. We also identify the Helium-band EMIC waves as the likely cause of the proton precipitation. Meanwhile, the intensity ratios among emission lines reported here are intended to set the experimental constraint and serve as validation tests for existing and developing proton auroral transport/emission models.
2 Instruments
The IPA event of interest comes with comprehensive optical observations. Main instruments used in this study include the multi-wavelength all-sky-imagers (ASI) of the Athabasca University Geospace Observatory (AUGSO) at Athabasca (ATHA, Geo. 54.600N, 113.640W), the Four-Eight-Six-One (FESO) meridian-scanning photometer at ATHA, and the Transition Region Explorer (TREx) RGB true-color Camera and Meridian Spectrograph at Lucky Lake (LUCK, Geo. 51.150N, 107.260W). AUGSO multi-wavelength ASI contains three major auroral/airglow emission lines 557.7, 486.1, and 630.0 nm, and two other wavelengths 480 nm and 620 nm serving as background channels for 486.1 and 630.0 nm, respectively. Among them, the 557.7 nm green-line and 486.1 nm Hβ line will be specifically focused on in this study. AUGSO runs in 60-s cadence for 486.1 nm and 30-s cadence for 557.7 nm. FESO is a meridian-scanning photometer designed for 486.1 nm proton auroras (Unick, et al., 2017), which contains a signal channel (3 nm passband centered at 486.1 nm) and a background channel (average of two 3 nm bands centered at 480 and 495 nm). FESO has a time resolution of 30 s. The TREx Spectrograph (TRSp) is an imaging spectrograph designed to yield the optical spectra between ∼400 and 800 nm of night sky emissions at 0.4 nm resolution along a meridian (Gillies et al., 2019). TRSp at LUCK runs at 15-s cadence. The TREx RGB (red-green-blue) ASI is a highly sensitive full-color imager designed to capture “true-color” images of the aurora and airglow (Gillies et al., 2020). The TREx RGB ASI data used in this study has a time resolution of 3 s. We highlight that all the involved instruments are wavelength/color discriminative, serving well for the research purpose of this study.
Besides the optical instruments, we also use the in-situ data from the GOES satellite, the DMSP satellite, and the Swarm satellite to aid this study. GOES-17 data (Kress et al., 2020) will be used to infer the drastic change of the inner magnetospheric status in the storm interval. The SSJ instrument (30–30 k eV, Redmon et al., 2017) onboard DMSP F18 will be used to infer the particle precipitation associated with the IPA. The magnetometer measurements onboard Swarm (Friis-Christensen et al., 2006), together with the ground magnetometer data from the Canadian Array for Real-time InveStigations of Magnetic Activity (CARISMA) (Mann et al., 2008), will be used to check the presence of EMIC wave activities associated with the IPA. Swarm is the fifth Earth Explorer mission in the Living Planet Programme of European Space Agency. CARISMA is the continuation and expansion of the former Canadian Auroral Network for the OPEN Program Unified Study magnetometer array deployed and operated by the University of Alberta.
3 Observations
3.1 Geophysical/geomagnetic context and geosynchronous observations
The IPA of interest occurred during the Canada Thanksgiving storm. The top two panels of Figure 1 show the SYM-H and AE index during 1–4 UT on 12 October 2021. The SYM-H value had been relatively stable between −40 and −45 nT for a few hours before a sudden rise to −15 nT shortly before ∼0230 UT, presumably related to the impact of a coronal mass ejection (CME)-associated interplanetary shock (the CME shock front arrived at the DSCOVR spacecraft at 0147 UT). The SYM-H then gradually decreased to ∼ −70 nT. Large-scale geomagnetic disturbances beginning at ∼0227 UT were recorded by THEMIS ground magnetometer array over Canada, and the AE index peaked over ∼1,500 nT at ∼3 UT. Strong auroral intensifications extended from high to mid-latitudes. As seen from the AUGSO ASI movie (see Supplementary Material), the auroras began to strongly intensify at ∼0230 UT, both at the poleward portion of the aurora oval (discrete auroras) and in the equatorward diffuse auroras, including the main proton auroral band. The IPA of interest took place in the dusk/evening sector during ∼0245–0345 UT, amid the storm interval. The occurrence of detached proton auroras in the dusk/nightside sectors following an interplanetary shock and a storm sudden commencement was previously reported by Zhang et al. (2008).
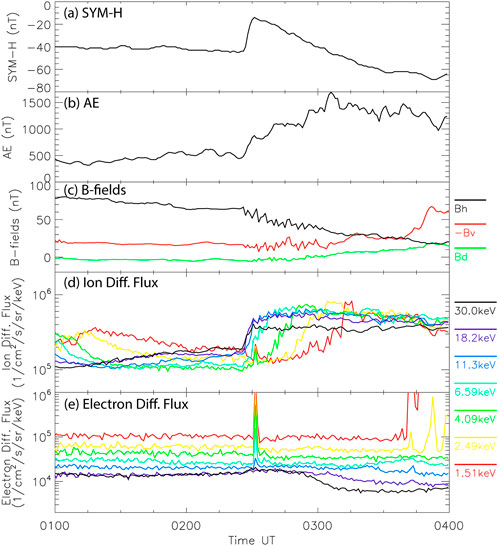
FIGURE 1. (A) SYM-H index. (B) AE index. (C) GOES-17 magnetic fields in VDH coordinates (-Bv: red; Bd: green; Bh: black). (D) GOES-17 omnidirectional proton differential fluxes. (E) GOSE-17 omnidirectional electron differential fluxes.
The remaining three panels of Figure 1 show GOES-17 data at geosynchronous orbit (L∼6.6, Geo. 1240W). The ionospheric footprint of GOES-17 estimated via empirical magnetic field models (T96/T01/TS02/TS05) ranges between ∼62–640 MLAT and is ∼100 west of the AUGSO ASI during the event interval of interest. Notwithstanding the mapping uncertainty GOES-17 is very likely to be located outward of the magnetospheric source region of IPA, but its data shed light on the drastic change of inner magnetospheric status in the dusk sector in our event. Figure 1C shows the magnetic fields in VDH coordinate, in which H-axis is antiparallel to the dipole axis, V-axis is parallel to the magnetic equatorial plane and directed outward, and D-axis completes the right-hand orthogonal system. The Bh component on GOES satellite is typically ∼100 nT during quiescent times, but in this event, after ∼0226 UT Bh gradually decreases to <20 nT, indicating a significant stretching of the magnetic field in the inner magnetosphere. Figures 1D,E show the omnidirectional ion/electron differential fluxes obtained from the low-energy sensor of the Space Environment In Situ Suite (SEISS) onboard GOES-17. We have used the SEISS L1b provisional data and averaged them in 1-min bins and over all view angles of the sensor. Despite the decrease in magnetic fields, the ion fluxes at energies from ∼1to 30 keV increase substantially after ∼0226 UT. Such intensification is not seen on electrons in the same energy range, except for a suspicious spike, perhaps of geophysical origin, for ≤10 keV energies at ∼0231 UT. To summarize, while GOES-17 was not precisely conjugate to our optical observations area, two inferences made from the GOES-17 data are relevant to the duskside inner magnetospheric status and to the dynamics of IPA: 1) the drastic stretching of magnetospheric magnetic fields; 2) the energetic ion injection. We also browsed the Arase/ERG data (https://ergsc.isee.nagoya-u.ac.jp/). The Arase satellite was located at closer radial distances (L ∼ 5.5) than GOES-17 but is further west (∼17 h MLT). The energetic ion injection after ∼0227 UT and the lack of corresponding energetic electron injection are also seen on Arase/ERG data. Clues of intensifications of both energetic ions and electrons are seen on THEMIS A/D/E satellites (http://themis.ssl.berkeley.edu/) at ∼0227 UT when the probes were at L∼8–9 RE and ∼3 h MLT east of GOES-17, but those energetic electrons might not penetrate deep into the duskside inner magnetosphere due to the Alfvén layer effect (e.g., Korth et al., 1999).
3.2 Summary and demonstration of optical instruments
Figure 2 serves to summarize data from the optical instruments used in this study and demonstrate their geometric combination. Overall, our observation time/area spans over the evening MLT between ∼18.5 and ∼20.5 h. Figure 2A exemplifies the AUGSO ASI observations at 486.1 557.7 nm. The 486.1 nm is characteristic of proton auroras, while the 557.7 nm usually represents the brightest emissions in auroras. As seen from both the 486.1 and 557.7 nm images, an azimuthally-extended auroral structure is apparently detached from and equatorward of the main auroral oval, which constitutes the research interest of this study. We have checked the 480 nm image (not shown, see Supplementary Material), which serves as the background channel for the 486.1 nm, and confirmed that such an IPA structure is absent there. Therefore, such an IPA in the 486.1 nm image does not result from a continuum emission like STEVE (Liang et al., 2019) but is truly proton auroras. A movie of AUGSO observations at 486.1/557.7 nm (plotted side-by-side) showing the evolution of the IPA of interest is provided in Supplementary Material. Note that the AUGSO 486.1 and 557.7 nm images are taken at different time epochs and at different time resolutions. In the Supplementary Movie, the observation epochs of the two wavelengths are 10–20 s apart in each movie frame. Nevertheless, one may still infer from the movie the remarkable similarity in the structures and the temporal evolution of the IPA at the two wavelengths. Such a high correlation between the 486.1 nm emissions and the 557.7 nm emissions of the IPA will be specifically examined with TRSp data later in Section 3.5. The IPA also shows imprints in red-line 630 nm AUGSO images (see Supplementary Material), consistent with Nishimura et al. (2022), but the accompanying red-line emissions are not of special interest in this study.
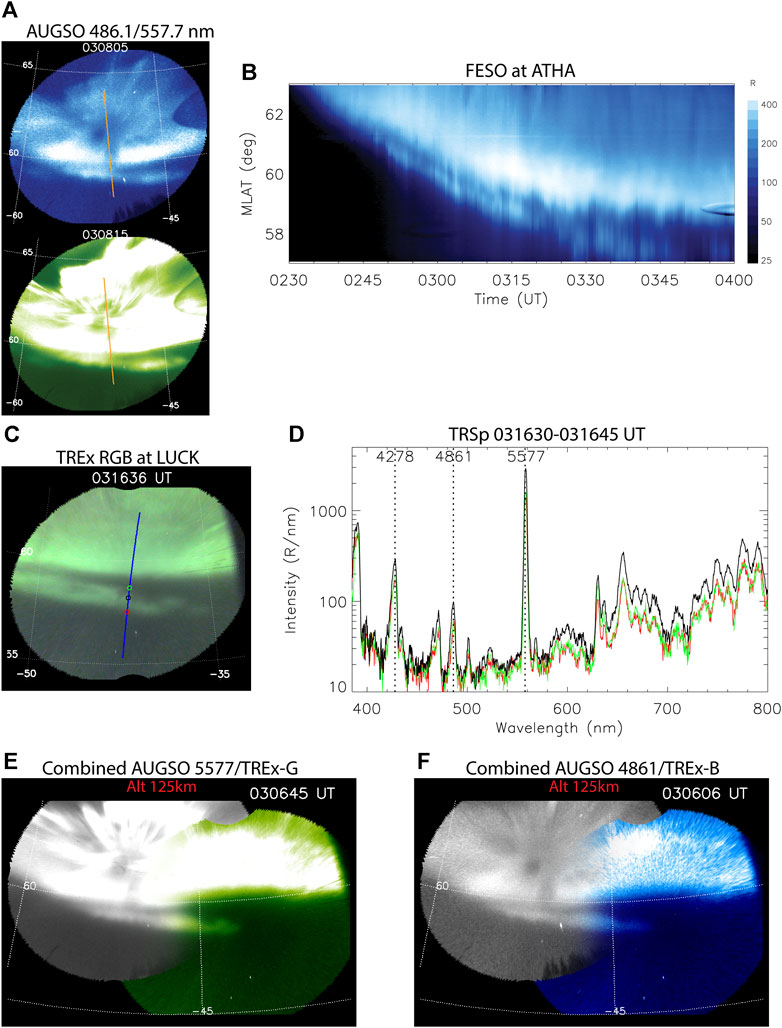
FIGURE 2. (A) Example of ATHA AUGSO 486.1 and 557.7 nm images, with FESO scan line overplotted. (B) 486.1 nm proton auroral intensity versus time and MLAT observed by FESO. (C) Example of TREX RGB ASI image, with TRSp scan line overplotted. Three colored circles along the TRSp scan line denote where the TRSp data are sampled to be shown in (D). In (A–C), an emission altitude of 125 km is assumed. (D) Example of the TRSp-measured optical spectra for three bins labeled in (C). The black curve corresponds to the spectrum of IPA, while the green/red curves denote the spectrum of the northern/southern edge outside the IPA. (E) An example of the combined image maps of AUGSO 557.7 nm and TREX RGB ASI green-channel based on the best-fit altitudes of IPA from triangulation analysis. The overlapping FoV of the two ASIs is presented as an alpha-blending overlay of two images. (F) Similar to (E) but an combined image maps of AUGSO 486.1 nm and TREX RGB ASI blue-channel.
AUGSO is not calibrated into Rayleigh values. An orange line overplotted in Figure 2A marks the scan line of FESO, a photometer specifically designed for 486.1 nm proton auroras (Unick et al., 2017). The FESO data in Figure 2B represents the keogram of the background-channel-subtracted, “pure” proton auroral intensities calibrated into optical Rayleigh. A Van-Rhijn correction is also applied. As seen from Figure 2B, an IPA starts to detach from the main auroral oval after ∼0250 UT and moves progressively southward along with the main auroral oval. Such southward motions are, at least partly, related to the drastic stretching of magnetospheric magnetic fields as indicated in Figure 1C. We recall that the equatorward motion of the main proton auroral band is known to be an indication of the magnetic field stretching and the resultant increase of field-line-curvature at the equatorial magnetosphere (Donovan et al., 2012; Yue et al., 2014). The 486.1 nm emission intensity of the IPA reaches a few hundred Rayleigh, which is exceptionally strong for proton auroras (e.g., Eather, 1967; Donovan et al., 2012; Spanswick et al., 2017). We note that the 486.1 nm intensity obtained from FESO is compatible with that inferred from the spectrograph (see Figure 6 later). Such an agreement adds credibility to the two independent instruments and confirms the strength of the proton auroral structure of interest.
Figure 2C exemplifies the data from the TREx RGB ASI at LUCK. The TREx RGB ASI is designed to capture “true color” images of the aurora and airglow (Gillies et al., 2020). Figure 2C displays a true-color image reconstructed from the RGB channel data of the ASI. Of our interest, an auroral arc separated from the main auroral oval exists at ∼580 MLAT. Such a detached arc appears greenish, similar to the color of the main auroral oval. A movie of the TREx RGB ASI showing the evolution of the IPA of interest is given in Supplementary Material.
A blue line overplotted in Figure 2C indicates the scan line of the TREx spectrograph (TRSp). TRSp is an imaging spectrograph designed to yield the optical spectra between ∼400 and 800 nm of night sky emissions along a meridian (Gillies et al., 2019). TRSp is recently carefully calibrated in terms of the absolute optical intensity. To demonstrate, we sample three latitude bins (shown as circles in Figure 2C) from the TRSp: one inside the IPA, and the other two at its northern and southern edges just outside the arc. The optical spectra measured by TRSp from the three bins are shown in Figure 2D. As one can see, the IPA shows elevated spectral intensities at almost all prominent auroral emission lines, including the N2+ 1NG series (391.4/427.8/470.9 nm), OI 557.7/630 nm, and the proton Hα (656.3 nm) and Hβ (486.1 nm) lines. The 557.7 nm dominates the absolute optical brightness of the IPA, but the 486.1 nm line is also particularly strong in terms of the relative percentage of the enhancement over that outside the IPA. The Hα emission, albeit brighter than Hβ, is embedded in a broad N2 1PG band as well as OH airglows, so that it is usually not used in inferring the proton auroral intensity.
In Figures 2A–C, for demonstration purpose a common emission altitude of 125 km is assumed in projecting the images to MLAT/MLON. The AUGSO ASI and the TREx RGB ASI have overlapping field-of-views (FoV). Such a geometry enables us to perform triangulation to evaluate the emission altitude of the IPA, which may not only be useful in determining the geographical location of the auroral structure, but also carry important information about the particle energy of the auroral precipitation. The triangulation methodology and procedures to determine the emission height from two-station observations were described in Gillies et al. (2017) and Liang et al. (2019). In practice, we use the AUGSO 557.7 nm images and the concurrent green-channel data (deemed as proxy of 557.7 nm) of the TREx RGB ASI to evaluate the emission heights of the detached arc of interest. Figure 2E shows an example of the combined image map of AUGSO and TREX RGB ASI based on the best-fit altitude, which is ∼125 km for this specific time epoch. The overlapping FoV of the two ASIs is presented as an alpha-blending overlay of two images. We note that a 125 km altitude is approximately the energy deposition height of ∼10 keV proton precipitation (see later Figure 8). In the Supplementary Figures S2, S3, we provide more examples of the combined image maps based on the best-fit altitudes of the IPA from triangulation analyses, and demonstrate the gradual change of the best-fit emission altitudes. Throughout the presence of the IPA, the best-fit altitude is initially ∼115 km yet gradually elevates with time, reaching ∼135 km by ∼0320 UT. We also estimated the uncertainties of the best-fit altitude (e.g., Gillies et al., 2017) and found them likely to be at most several km for most of the interval of interest (except at the late stage of the event, see below for explanation). We have also tried triangulation between AUGSO 486.1 nm images and the blue-channel data of the TREx RGB ASI (see an example in Figure 2F), and achieved very similar outcomes of the best-fit altitudes, within the uncertainty of the triangulation method, throughout the event interval. This hints that the 557.7 nm and major blue-color emissions (Hβ and N2+ 1NG series) contained in the IPA all feature similar emission altitudes, an inference to be further corroborated by TRSp measurements later in Section 3.5. After ∼0320 UT, the IPA moves to rather low elevation angles of the ATHA ASI, and its view is partially blocked by trees at the south-eastern edge of the camera. We have also tried the triangulation after 0320 UT and found the best-fit altitude of IPA might be ∼135–140 km, but with a caveat that the accuracy of the triangulation analysis may become questionable by that time. From now on, the inferences from the triangulation analyses will guide our selection of emission altitudes in the following presentation of ASI images at different time epochs; the emission altitude used will be marked in the respective figure caption or in the relevant text. However, a constant altitude of 125 km is assumed in making all ASI movies in the Supplementary Material.
Our optical observations cover the full temporal and spatial span of the IPA event of interest. As seen from the movies, the IPA starts to discernibly separate from the main auroral oval around ∼0248 UT at ∼610 MLAT, −550 MLON (∼18.6 h MLT) in the AUGSO ASI FoV. The IPA then undergoes southward motion and extends eastward into the LUCK ASI FoV. Overall, the event lasts for ∼1 h; the IPA migrates equatorward from ∼610 to 560 MLAT and features a maximum azimuthal extent of ∼250 MLON. We also note that the IPA features dynamic spatial-temporal variations. It sometimes appears as an azimuthally-aligned arc, while sometimes exhibits as a few azimuthally-spaced segments containing one or more strongly intensified “blobs.” At times, the IPA may actively pulsate in certain azimuthal segments (better seen from the 3s-cadence TREx RGB ASI movie). Furthermore, at ∼0309 UT, one other detached arc at further lower latitudes appears to stem from the western edge as seen from AUGSO. In the following we sometimes may still use “arc” in referring to the IPA, but this should not be misunderstood as we actually deem it an azimuthally homogeneous “arc”.
3.3 In-situ particle observations: DMSP in the conjugate hemisphere
There is unfortunately no in-situ particle measurement directly over the IPA. However, DMSP F18 passes over the conjugate area of the arc in the southern hemisphere at ∼0318 UT. Figure 3A shows the AUGSO 486.1 and 557.7 nm images overplotted by the trajectory of the northern conjugate footprints of DMSP F18. A T96 model is used in the mapping (Tsyganenko, 1996). Figure 3B shows the electron/ion energy spectrogram measured by the SSJ instrument onboard F18. Notwithstanding the uncertainty of conjugate mapping, the arcs of interest are very likely to be associated with the energetic proton precipitation (>∼10 keV) structure equatorward of the electron plasma sheet. There is an absence of plasma sheet electron precipitation corresponding to the proton precipitation structure, except that there are some clues of electron precipitation at ≤ ∼100 eV, similar to the observations in Nishimura et al. (2022) in their IPA events.
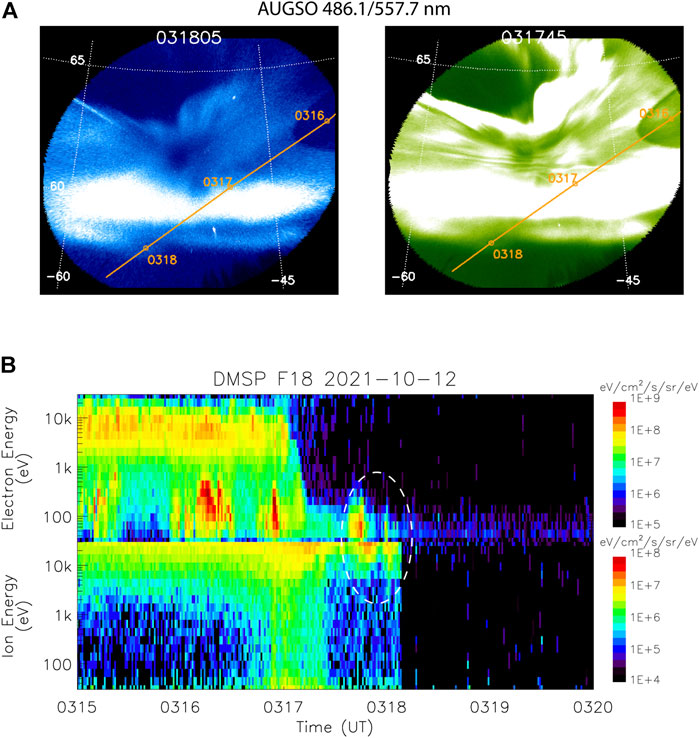
FIGURE 3. (A) AUGSO 486.1 and 557.7 nm images with the trajectory of the norther conjugate footprints of DMSP F18 satellite overplotted. An emission altitude of 135 km is assumed. (B) The electron energy flux spectrogram (upper panel) and ion energy flux spectrogram (bottom panel) measured by DMSP F18 SSJ. A dashed oval highlights the potential correspondence with the IPA.
3.4 Ground and in-situ magnetometer data: Evidence of electromagnetic ion cyclotron waves
IPAs have been observed in connection with EMIC wave activities (e.g., Sakaguchi et al., 2007, 2008, 2015; Zhang et al., 2008; Yuan et al., 2010; Kim et al., 2021). In this subsection, we shall examine the potential EMIC wave activities from both ground-based and in-situ magnetometer data.
We first look into the CARISMA ground magnetometer data. In this study, we use the data from the Gull Lake (GULL, Geo. 50.060N/108.260W) fluxgate magnetometer at 8 Hz sampling rate. Figure 4A shows the location of GULL overplotted on the TREx RGB ASI image. The top two panels of Figure 4B show the power spectral density (PSD) of the GULL Bh (magnetic north) and Bd (magnetic east) components obtained via FFT analyses. Evident Pc1 wave activities exist in the frequency range ∼0.3–0.8 Hz between ∼0306–0328 UT. These Pc1 pulsations are commonly recognized as manifestation of EMIC waves in the ionosphere (e.g., Sakaguchi et al., 2008, 2015; Mann et al., 2014; Usanova et al., 2016). To investigate the wave occurrence in the context of IPA, we plot the RGB ASI keogram along GULL in the 3rd of Figure 4B. This is done by sampling the ASI pixels over ±0.250 MLON around the GULL magnetic meridian. The bottom panel of Figure 4B shows the 486.1 nm keogram inferred from TRSp observations (see Section 3.6 later for more details), whose scan line is close to the GULL meridian. A constant emission altitude 125 km is assumed in the two keograms since the remnant error in projection is not important compared to the spatial integral range in ground magnetometer observations, with which these auroral keograms are intended to compare. The two horizontal dashed lines in the bottom two panels of Figure 4B indicate ±10 MLAT north and south of the GULL station. By such we have taken into account the spatial integral effect of ground magnetometer measurements and the ducting propagation of EMIC waves in the ionospheric waveguide (e.g., Mann et al., 2014). The EMIC wave activities at GULL show clear correspondence with the passage of IPA over the station. Though the IPA pre-exists, EMIC waves are not seen at GULL before ∼0306 UT since the IPA is north/west of, and relatively far away from, the station. The EMIC waves become stronger when the IPA approaches and passes overhead the station. When the IPA fades and moves southward away from the station, the EMIC waves diminish at GULL. We have also checked the magnetometer at other available stations (maintenance of some CARISMA sites was unfortunately affected by the pandemic). Relatively weak and transient EMIC wave activities are also seen at Ministik Lake (Geo. 53.350N/112.970W) around ∼0255 UT when the early evolution of IPA temporarily passes the station. No clue of EMIC waves is found at Weyburn (Geo. 49.690N/103.800W) east of the IPA. The above observations again suggest that the EMIC wave activity is confined to regions not far away from the IPA. To summarize, notwithstanding the complications such as the horizontal propagation of EMIC waves in the ionosphere, the joint magnetic/optical observations in our event strongly indicate an inherent link between the EMIC wave and the IPA.
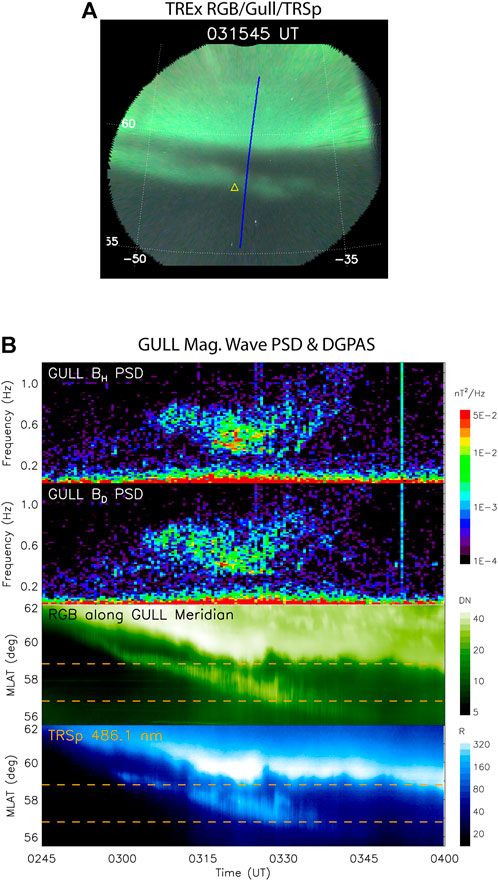
FIGURE 4. (A) TREX RGB ASI image with the GULL station (yellow triangle) and the TRSp scan line (blue line) marked. Emission altitude is 135 km. (B) The top two panels show the PSD spectrogram of the Bh and Bd components from the GULL magnetometer data. The third panel shows the RGB ASI keogram sampled along the GULL magnetic meridian. The bottom panel shows the keogram of 486.1 nm emissions calculated from TRSp observations. Two horizontal dashed lines in the bottom two panels indicate ±10 MLAT north and south of the GULL station.
We then look into in-situ observations from Swarm satellites at ∼500 km altitude. A T96 model is used in mapping the satellite to the auroral height. Swarm-B crosses the FoV of AUGSO ASI during ∼0250–0253 UT, as illustrated in Figure 5A. We note that the satellite trajectory seems to traverse a gap of the visible IPA segments, with a stronger arc segment to its west and a dimmer segment to its east. Nevertheless, a vertical dotted line in Figure 5B marks the approximate time of traversal according to the latitude of the western bright IPA segment. To infer the ULF waves, we resort to the high-resolution (50 Hz) magnetic field data onboard Swarm-B. The identification of Pc1 EMIC waves from in-situ satellite measurements involves some complications, e.g., the spatio-temporal ambiguity, the mixture with other wave modes such as shear Alfven waves, and the spectral leakage from lower-frequency broadband ULF waves (e.g., Kim et al., 2021). In our data processing, we first derive the high-passed perturbation fields by subtracting the mean B-fields obtained from a sliding 600-point (12-s) Savitzky-Golay low-pass filter (Savitzky and Golay, 1964). This suppresses B-field variations at frequencies ≤0.1 Hz since it is difficult to distinguish spatial and temporal variations at these low frequencies in satellite data. We then convert the high-passed perturbation fields into a mean-field-aligned (MFA) coordinate system, in which the z-axis is parallel to the mean field direction, the y-axis is perpendicular to both the radial vector (from the Earth’s center) of the satellite and the mean–field direction, and the x-axis completes the right-hand orthogonal system. The derived wave fields in the MFA coordinates are shown in the top panel of Figure 5B. We then perform FFT analyses on the transverse wave components Bx & By, and present their PSD spectrograms in the mid and bottom panels. As one can see, the waves are strong when the satellite is deep inside the active auroras, yet diminish when the satellite moves into the equatorward portion of the auroral oval. During ∼02:51:00–02:51:30 UT when the satellite moves out of the main auroral oval and enters the subauroral region, the waves intensify again. In particular, narrow-band Pc1 waves at ∼0.3 Hz are discernible from both the waveforms and the PSD. Though the satellite trajectory seems to pass over a gap of visible IPA segments, we hypothesize that the observed Pc1 waves during ∼02:51:00–02:51:30 UT are still evidence of EMIC waves associated with the IPA. It is well known that EMIC waves may undergo ducted propagation in the ionosphere waveguide, and thus propagate away from the footprint of their magnetospheric source region (e.g., Kim et al., 2010). Such ducted waves attenuate during propagation, so that they are expected to be observed within a limited distance from the source region (Mann et al., 2014). Indeed, the wave fades after 02:51:30 UT when the satellite footprint becomes far away from the IPA. It is also possible that Swarm-B is inside the wave source region, but the EMIC wave intensity and its resultant proton scattering at the magnetospheric footprint of Swarm-B are not strong enough to produce visible IPA. We have also performed the polarization analysis (not shown). The polarization of the Pc1 waves of interest is mostly linear and/or weakly right-handed, implying that the EMIC waves may have undergone polarization reversal or change in the course of their propagation from the magnetospheric source region to the ionosphere (e.g., Johnson et al., 1989; Kim et al., 2021).
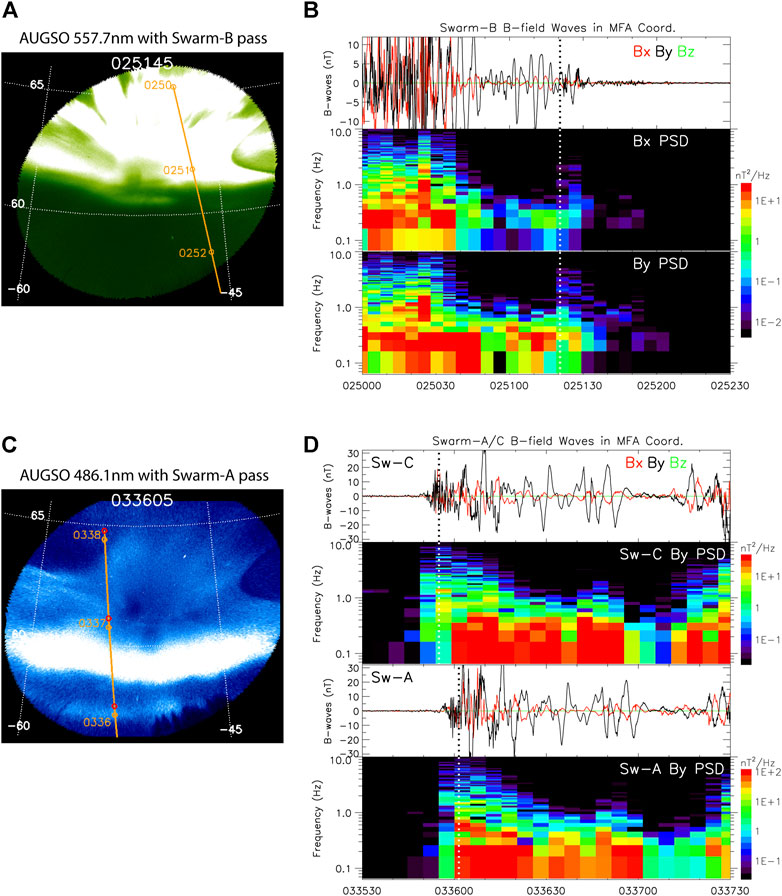
FIGURE 5. (A) AUGSO 557.7 nm images with Swarm-B footprint trajectory overplotted. Emission altitude is 115 km. (B) The top panel shows the high-passed magnetic field waves in MFA coordinate. The rest two panels show the PSD spectrogram of the Bx and By wave components. (C) AUGSO 486.1 nm images with Swarm-A (orange) and Swarm-C (red) footprint trajectory. Emission altitude is 135 km. (D) The top two panels show the B-field waves and By PSD spectrogram on Swarm-C. The bottom two panels show the B-field waves and By PSD spectrogram on Swarm-A. In each panel, a vertical dotted line indicates the estimated center time of IPA traversal.
Later at ∼0336 UT, Swarm-A and C traverse the IPA of interest. This occurs at the later stage of the event, when the IPA has moved to ∼57.20 MLAT. In Figure 5C, we display the Swarm-A/C passage overplotted on the AUGSO image. The trajectories of Swarm-A and Swarm-C overlap, with Swarm-C slightly ahead in time ─ the difference can be viewed in Figure 5C via the separation between Swarm-A footprint (orange circle) and Swarm-C footprint (red circle) at each minute. This configuration helps relieve spatio-temporal ambiguity in satellite data. The derived B-field waveforms on Swarm-C and Swarm-A are shown in the 1st and 3rd panels of Figure 5D, respectively, using the same data processing procedures as above-depicted. The PSD spectrograms of By on the two satellites, which represent the major wave components, are given in the 2nd and 4th panels, respectively. As one can see, when the two satellites traverse the IPA around ∼0336 UT, the waves intensify evidently. Swarm-C encounters the IPA slightly earlier so that the wave intensification precedes on Swarm-C. This observation unambiguously points to a link between the wave intensification and the IPA crossing. In this event interval, the wave spectra are complicated by the presence of relatively long-lasting/large-scale broadband waves, as can be inferred from the waveforms. Nevertheless, as seen from the By PSD on Swarm-A, on top of the long-lasting broadband structure at <∼0.3 Hz, a more localized and narrow-banded wave intensification around ∼0.6 Hz appears in conjunction with the IPA crossing. Similar localized Pc1 features at ∼0.6–0.8 Hz are also seen on Swarm-C By PSD, though slightly ahead in time and weaker in wave power. We conceive these to be possible evidence of EMIC waves associated with the IPA. The difference between waves seen on the two satellites might allude to the fine-scale modulation of EMIC waves (Ozaki et al., 2018), but such fine temporal variations cannot be resolved by our optical instruments.
3.5 Comparison among emission lines and intensity ratios based on TREx Spectrograph data
As mentioned above, though not observed at precisely the same time epochs, the detached 486.1 nm arc and the detached 557.7 nm arc seen on AUGSO images are fairly similar to each other in terms of shape, location, and time evolution. One merit of this study is that the event comes with high-quality spectrograph data, offering an ideal tool to examine and compare the properties of auroral structures in different emission lines. In this regard, we integrate the spectral intensities at the blue-line (427.8 nm), the Hβ (486.1 nm), and the green-line (557.7 nm), from TRSp measurements to infer the absolute optical intensity of these emissions. The fine spectral profile of individual emission line is contingent on parameters such as the temperature and the energy-dependent doppler shift. In this study, upon an inspection of the overall spectral profile of each emission line seen on TRSp during the event interval, the integral wavelength band is set as 483.6–488.1 nm for Hβ, 556.2–559.7 nm for green-line, and 424.8–429.8 nm for blue-line. For each line, we also subtract a baseline determined from its nearby non-auroral, non-airglow wavelengths. Figures 6A–C shows the keogram of optical intensities of the three emission lines versus time and elevation angle (00 indicates the north horizon). For the following analyses, we use the elevation angle without specific assumptions on emission altitudes. Note that the elevation-angle profile of an emission seen by ASI embodies a mixed manifestation of the altitudinal and latitudinal distribution of the emission structure. The detached arc shows up in all three emission lines, and the structural similarity in the three emissions is straightforward to notice. To achieve a more quantitative evaluation, we first delimit the elevation-angle range of the IPA of interest (marked by dashed curves in Figures 6A–C) during 0258–0345 UT. Figures 6D–F, together with Figure 7, serve to demonstrate the comparison of IPA among three emission lines. The total auroral intensities integrated over the delimited elevation range of IPA are shown in Figure 6D (in arbitrary scales). It is straightforward to see that the IPA temporal variations are almost identical and simultaneous in three emission lines. More quantitatively, via a cross-correlation analysis, the total 557.7 (427.8) nm intensity and total 486.1 nm intensity associated with IPA feature a peak correlation coefficient of 0.998 (0.993) at zero time lag.
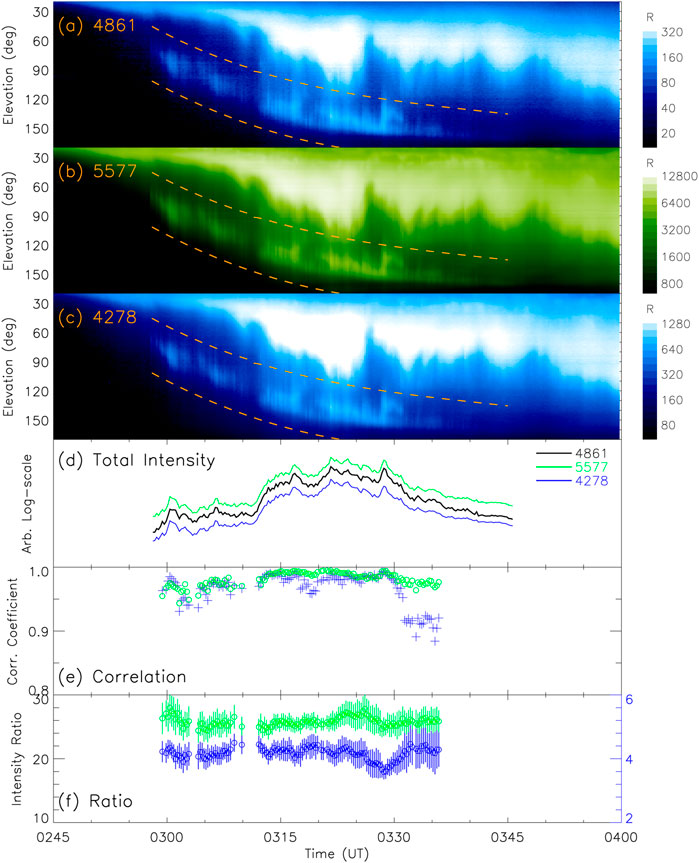
FIGURE 6. The top three panels (A–C) show the keogram of 486.1 nm, 557.7 nm, and 427.8 nm emission intensities calculated from TRSp observations, versus time and elevation angle (0 indicates north horizon). The dashed curves shown in these panels indicate the upper and lower bound within which we sample the elevation-angle bins to investigate the IPA structure. (D) The total 486.1/557.7/427.8 nm intensity integrated over the delimited elevation-angle range of IPA. Each intensity is plotted in arbitary scale, and only their temporal correlations are of interest in this plot. (E) The Pearson correlation coefficient between the elevation-angle structures of 486.1 nm and 557.7 nm (in green circle), and that between the structures of 486.1 nm and 427.8 nm (in blue crosses). (F) The mean and standard deviation of the intensity ratios. Green color denotes the 5577-to-4861 ratio, while blue color denotes 4278-to-4861 ratio (y-ticks on the rightside). At each time epoch, a circle denotes the mean over the elevation-angle range of IPA, while a vertical bar denotes the standard deviation.
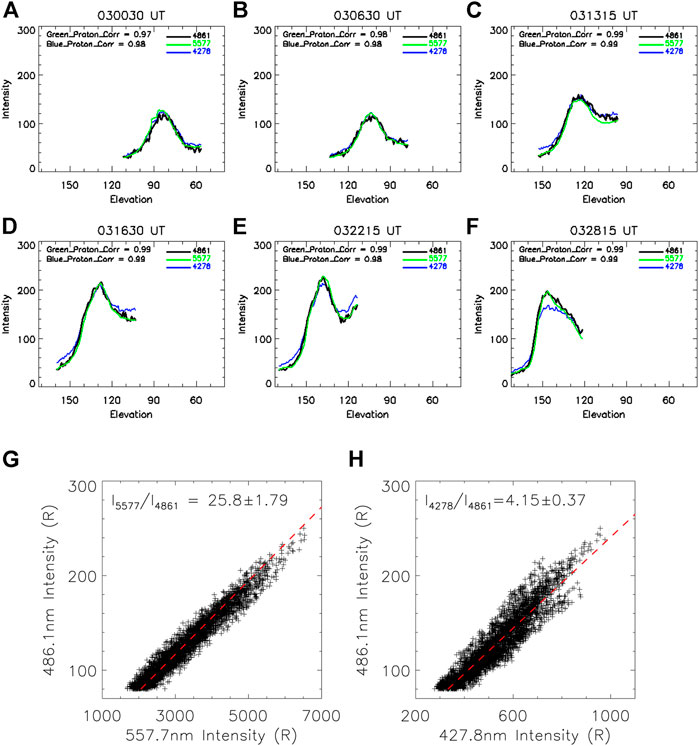
FIGURE 7. (A)–(F) exemplify six time epochs of the comparison and correlation among the elevation-angle structures of 486.1 nm (black), 557.7 nm (green), and 427.8 nm (blue) intensities. The 557.7 nm intensity is scaled by 1/26, while the 427.8 nm intensity is scaled by 1/4, in these plots. (G) The scatter plot of all sampled 557.7 and 486.1 nm emission intensities during the entire IPA interval. (H) The scatter plot of all sampled 427.8 and 486.1 nm emission intensities. The mean and standard deviation of their ratios are given in (G) and (H) for reference.
We then sample the 486.1/427.8/557.7 nm intensities of IPA over the delimited elevation-angle range, and calculate the Pearson correlation among the elevation-angle profiles of these emission lines. To make the comparison meaningful, we are only interested in time epochs when IPA distinguishably stands out of the ambient background, with a threshold of 80 R in terms of the peak 486.1 nm intensity. The threshold also serves to ensure that the counterpart 557.7 nm auroral intensities are presumably an order of magnitude or more above the green-line airglow component. Figure 6E shows the Pearson correlation coefficients between the elevation-angle structures of the 557.7 and 486.1 nm emissions (in green circle) and that between the 427.8 and 486.1 nm emission structures (in blue cross). Figures 7A–F exemplify six frames of such comparison; the 557.7 (427.8) nm intensities are scaled by a factor 1/26 (1/4) in these frames. A full movie showing the comparison and correlation among the three emission lines is given in Supplementary Material. The correlation between the 486.1 nm auroral structure and the 557.7 nm auroral structure is exclusively greater than 0.95 and mostly greater than 0.98. With a proper scaling factor (∼1/26), the 557.7 nm emission structures appear to largely overlap with the 486.1 nm emission structures. This can transpire only when both the latitudinal distribution and the emission altitudes of the two emissions are highly alike. As we shall discuss in the next section, such a near-perfect agreement between the 486.1 nm auroral structure and the 557.7 nm structure offers compelling evidence that the latter results almost purely from the proton auroral precipitation.
Figure 6F shows the emission intensity ratios of the IPA. For each TRSp time epoch, we sample the intensity ratio between 557.7 and 486.1 nm, as well as that between 427.8 and 486.1 nm, in each elevation-angle bin of the IPA. We then calculate the weighted (by the 486.1 nm intensity) mean and standard deviation of the sampled ratios over the elevation-angle bins at each time epoch, and present in Figure 6F. The scatter plot of all sampled 557.7 nm versus 486.1 nm emission intensities during the whole IPA interval is shown in Figure 7G, and the scatter plot of sampled 427.8 versus 486.1 nm intensities is given in Figure 7H. Overall, the 5,577–4,861 intensity ratio is confined in a rather narrow range around ∼26. The variability of this ratio is within 10% in terms of both the temporal and elevation-angle variations. The above results imply that the 557.7 nm component of the IPA can be approximately viewed as a scaled counterpart of the 486.1 nm emission. In comparison, the distribution of 427.8 versus 486.1 nm emission intensities is a little bit more scattered, with an average ratio of ∼4.1 between the two lines.
4 Discussion
In this paper, we report and analyze an IPA event occurring during ∼0245–0345 UT on 12 October 2021, following the impact of a CME interplanetary shock. The IPA of interest looms in the dusk sector and subsequently shows a southward and overall eastward (antisunward) propagation. The 486.1 nm emission intensity is very strong for the IPA, indicating intense proton precipitation. Taking advantage of multi-station, multi-wavelength optical instruments, we investigate the evolution and spectrographic properties of the IPA. More specifically, the following discussions are focused on the potential answers to two questions about the IPA: 1) what’s the cause of the proton auroral precipitation? and 2) why does the IPA look green and what’s the cause of such green emissions?
To preface the following discussions, we present in Figure 8 the altitude profile of the ionization rate led by energetic proton precipitation based on Fang et al. (2013) ‘s model. This serves to demonstrate the altitude range where most of the energy transfers between precipitating protons/hydrogen atoms and neutrals, via impact excitation/ionization, take place in the ionosphere. The model input parameters are conformal to the actual event date and location of the IPA (2021–10-12 03 UT, Geo. 500N/1100W). The neutral atmosphere is from the NRLMSISE00 model (Picone et al., 2002). Three cases of monoenergetic proton precipitation with energies of 1, 10, and 50 keV, respectively, are computed. A total energy flux of 1 erg/cm2/s is assumed for all runs. As expected, the energy deposition height decreases with increasing energy. More specifically, the peak ionization height is ∼110 km for 50 keV protons yet increases to ∼140 km for 1 keV protons. Using the above information, and according to the IPA emission height inferred from the triangulation analysis (∼115–135 km, see Figure 2E and Supplementary Figures S2, S3), we estimate that the precipitating energies of protons likely range between a few keV and a few tens of keV, and show a trend of decreasing energy with time when the IPA migrates to lower latitudes. EMIC waves are known to be capable of resonantly scattering magnetospheric protons in this energy range (e.g., Jordanova et al., 2007; Liang et al., 2014; Usanova et al., 2016). To date, the EMIC waves are commonly deemed the underlying mechanism causing the detached proton auroral precipitation in the subauroral region (Immel et al., 2005; Sakaguchi et al., 2007, 2008, 2015; Yahnin et al., 2007; Zhang et al., 2008; Kim et al., 2021; Shumko et al., 2022).
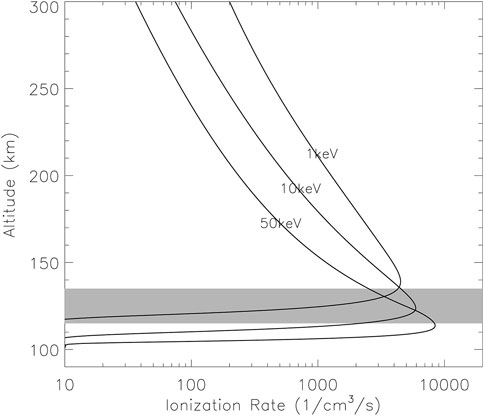
FIGURE 8. Altitude profile of the ionization rate led by 1, 10, and 50 keV monoenergetic proton precipitation, based on Fang et al. (2013). A gray aera marks the estimated range of emission altitudes (115–135 km) in our event inferred from the triangulation analyses.
In our event, magnetometer data, in particular the observations from the CARISMA GULL station, show clear correspondence between the EMIC wave activities and the passage of IPA. This result further corroborates the causal link between the EMIC wave and the proton precipitation leading to IPA. GOES-17 data (Figure 1D) unveil the existence of strong energetic ion injection in the inner magnetosphere, which might allude to the energy source of the EMIC wave generation. It is difficult to accurately evaluate the magnetospheric footprint of the IPA and the equatorial magnetic field strength there under the storm condition. We have tried a series of Tsyganenko magnetic field models T89/T96/T01/TS02/TS05 (Tsyganenko, 1996, 2000, 2002; Tsyganenko and Sitnov, 2005) with OMNIWeb solar wind data, and found that none of them could satisfactorily reproduce the degree of stretching as observed by GOES-17 and inferred from the equatorward border of the main proton auroral band (assumed as representing 20 keV proton isotropic boundary, e.g., Yue et al., 2014), particularly at the later stage of the event. Comparatively, the TS05 model is the best-performing one and thus chosen, albeit with caution, in our following evaluation. At ∼0251 UT which is close to the start of the event, the IPA is found to be located at ∼60.70 MLAT as seen by the AUGSO ASI (Figure 5A), and the TS05 model predicts an equatorial B-field strength of ∼150 nT (proton gyro-frequency fcp∼2.28 Hz) at the magnetospheric root of the arc. The Pc1 waves observed on Swarm-B (Figure 5B) peak at ∼0.2–0.3 Hz, consistent with a Helium-Band EMIC. Later after 0315 UT when the IPA moves to ∼580 MLAT, the TS05 model is found to underestimate the field line stretching and predicts an equatorial B-field of ∼380 nT (fcp∼5.79 Hz) corresponding to the arc. Notwithstanding the uncertainty ── likely an overestimate ── of such a model B-field, the observed waves at GULL (peaking at ∼0.4–0.5 Hz, Figure 4B) are still very likely the He-band EMIC. Similarly, at ∼0336 UT when Swarm-A/C detect ∼0.6–0.8 Hz Pc1 waves upon crossing the IPA at ∼57.20 MLAT, the TS05 model predicts an equatorial B-field strength of ∼460 nT (fcp∼7.01 Hz) corresponding to the IPA arc, again compatible with the scenario of He-band EMIC. We thus propose that the IPA-associated EMIC waves observed by in-situ and ground magnetometers in our event are He-band. This is consistent with the known prevalence of He-band EMIC waves, in terms of the occurrence rate and the wave power, in the duskside inner magnetosphere (e.g., Saikin et al., 2015). We note that He-band EMIC waves were also identified in other IPA events reported in the existing literature (e.g., Sakaguchi et al., 2007, 2008; Kim et al., 2021).
The IPA is visually green as shown in the citizen scientists’ photos, and our observations indicate that it is indeed dominated by OI 557.7 nm emissions. The visual dominance of the 557.7 nm line leads some people, including citizen scientists, to wonder about the cause of such green-line emissions. A DMSP passage over the southern conjunction region of the IPA indicates that there is no electron precipitation in the range ∼100 eV–30 keV (the ≤∼100 eV precipitation structure will be addressed later), but people may still question whether electrons with energies >30 keV might exist and be the main cause of the observed 557.7 emissions. It is known that a number of plasma waves can be operational in pitch-angle scattering energetic/relativistic electrons in the inner magnetosphere and causing their precipitation into the subauroral ionosphere, such as the plasmaspheric hiss, the whistler-mode chorus, the magnetosonic wave, and the EMIC wave (e.g., Summers et al., 2007; Miyoshi et al., 2008; Ni et al., 2015, 2017; Zhang et al., 2022). In this study, using TRSp data we carefully compare the 557.7 nm and 486.1 nm structures corresponding to the IPA. The two emissions are found to be strikingly similar in their elevation-angle profiles, and their intensity ratio is confined within a narrow range. The correlation between the two emission structures is often as high as ∼0.99. Such a high degree of similarity would be unthinkable if the 557.7 nm emissions contained in the IPA originate from a magnetospheric electron precipitation source. The rationale is as follows. First, the mechanisms leading to electron precipitation and proton precipitation are different in the magnetosphere, and the source regions of their precipitation are not necessarily co-located, much less do they have the same spatial-temporal variations. Even though certain activities such as EMIC waves are capable of scattering both electrons and ions, the resonant energies of electrons and ions are outright different. EMIC waves in the inner magnetosphere typically scatter relativistic electrons via gyro-resonance (e.g., Miyoshi et al., 2008; Ni et al., 2015; Zhang et al., 2016), though under certain conditions they may also scatter a broad range of electron energies from ∼10 MeV down to several tens of keV via Landau resonance (Fu et al., 2018). These high-energy electrons are inefficient in producing 557.7 nm emissions. Even if they do, the emission altitudes would be relatively low, presumably ≤∼100 km. Note that the IPA is seen at oblique elevation angles on TRSp, particularly after ∼0310 UT. There is no reason to conceive that the electron auroras and proton auroras would necessarily have the same emission altitudes, and the discrepancy in their emission altitudes would lead to noticeable dissimilarity in their elevation angle profiles in oblique observations. For example, for an arc 10 MLAT south to the station, emission heights of 100 km and 130 km would lead to ∼7.50 difference in viewing angles. Furthermore, the travel time to the ionosphere is different for high-energy electrons and ∼10 keV ions, and such a time difference exceeds the resolution of measurements (15 s for TRSp). For the IPA with dynamic temporal variations, the electron auroras and proton auroras would not be able to keep in perfect pace (see Figure 6D) if they both originated from the equatorial magnetosphere.
Last but not least, it is important to note that electron precipitation and proton precipitation undergo fundamentally different transport processes in the upper ionosphere. When energetic protons from the magnetosphere bombard the Earth’s atmosphere, they undergo charge exchange collisions with atmospheric particles and become neutral hydrogen atoms. These neutral hydrogen atoms are also energetic and can become ionized again when they collide with the atmosphere. The above processes repeat until the protons/hydrogen atoms lost all their energies in the atmosphere. Since a neutral hydrogen atom is not magnetized, these ionization/neutralization sequences may cause the drifting of the proton away from the field line that it was incident on, leading to a broadening of spatial scales of the precipitating proton structure (Davidson, 1965; Eather, 1967; Fang et al., 2004). The broadening mostly takes place in the upper ionosphere (>∼250 km altitude), while it is suppressed in the lower ionosphere where frequent collisions with neutrals hinder protons and hydrogen atoms from drifting apart. No such spatial spreading effect exists for magnetospheric electron precipitation. This would lead to distinct dissimilarity in the spatial structures of electron auroras and proton auroras (e.g., Donovan et al., 2012; Liang et al., 2017), even under a fortunate circumstance that they come from the same magnetospheric origin and that their precipitation fluxes have the same spatial distribution above the ionosphere.
To conclude, the near-identical structural shape of the 557.7 and 486.1 nm emissions and their narrowly-ranged intensity ratios exclude the possibility that the 557.7 nm emission originates from magnetospheric electron precipitation. Instead, the observation strongly suggests that the 557.7 nm emission contained in the IPA is essentially a byproduct of the proton precipitation. One likely source of such 557.7 nm emissions is the secondary electrons produced by the proton precipitation (e.g., Strickland et al., 1993). Upon a close look into Figure 3, one may notice the existence of ≤∼100 eV electrons corresponding to the IPA (in the conjugate hemisphere) and the energetic proton precipitation. Similar observations were also made in Nishimura et al. (2022). These low-energy electrons at the DMSP altitude (∼850 km) are unlikely the direct cause of the 557.7 nm emissions contained in the IPA, but might signify the presence of locally generated or interhemispherically-transported secondary electrons (Khazanov et al., 2015) associated with the proton precipitation. While a full proton-electron transport/emission model is beyond the scope of this study, we notice from Figure 11 of Strickland et al. (1993) that, the secondary electron fluxes at ∼100–200 km altitudes led by a Maxwellian incident spectrum of pure proton precipitation with a characteristic energy of 8 keV appear to be fairly close to that caused by a Maxwellian electron precipitation with a characteristic energy of 1 keV (both electron and proton precipitations are normalized to the same total energy flux). Using our TREx-auroral transport model (Liang et al., 2016), we calculate the secondary electron fluxes produced by 1 keV Maxwellian electron precipitation with 1 erg/cm2/s total flux, and find them capable of inducing 1.05 kR of 557.7 nm emissions (direct impact excitation by primary electrons is artificially excluded in this calculation). In comparison, the 486.1 nm optical yield is estimated by Spanswick et al. (2017) to be ∼67 R per unit erg/cm2/s of proton precipitation flux. We thus semi-quantitatively infer that the secondary electron fluxes induced by proton precipitation can excite 557.7 nm emissions with much higher brightness than the 486.1 nm emissions. One other possible source of the 557.7 nm emissions is the impact excitation by fast hydrogen atoms (Vallance-Jones, 1971; Edgar et al., 1975), which is produced in the aforementioned charge exchange process under the proton precipitation:
Impact excitation of O(1S) directly led by energetic protons requires spin exchange and is therefore highly unlikely (Vallance-Jones, 1971; Edgar et al., 1975). For energetic protons, their energy deposition, including the secondary electron production and impact excitation, is supposed to be mostly concentrated in a narrow altitude range in the lower ionosphere (<200 km, see Figure 8), whereas the spatial spreading of precipitating proton/hydrogen fluxes has been already done at higher altitudes (Fang et al., 2004). Under the above-depicted scenario, the 557.7 nm emissions are excited as a byproduct of the proton precipitation as the latter impacts the lower ionosphere, which explains why they feature a similar structural shape to that of the 486.1 nm emissions. We of course recognize that those secondary electrons and fast hydrogen atoms may also exist and have effects at higher altitudes, such as contributing to the 630 nm auroras that also accompany IPAs (Lummerzheim et al., 2001) and to the density enhancement in the upper F-region (Kim et al., 2021).
The 427.8 nm emission structures corresponding to IPA also correlate fairly well (>0.9) with that of 486.1 nm emissions, but the correlation is slightly lower than that between 557.7 and 486.1 nm. The intensity distribution of 427.8 versus 486.1 nm shown in Figure 7H is also a little bit more scattered than that of 557.7 versus 486.1 nm. Based on the above observations, we expect that a majority of the 427.8 nm emissions contained in IPA might also be the byproduct of the proton precipitation, such as led by the secondary electrons produced in the proton precipitation, and the impact excitation by energetic protons and fast hydrogen atoms. However, some of the 427.8 nm emissions might be owing to other sources. As aforementioned, EMIC waves may cause relativistic electron precipitation; observational evidence of such relativistic electron precipitation in conjunction to an IPA patch was recently reported by Shumko et al. (2022). These high-energy electrons are ineffective in producing 557.7 nm emissions, but may partially contribute to the 427.8 nm emissions and thus slightly degrade the correlation between the 427.8 and 486.1 nm emission structures.
Eather, (1967), Eather, (1968) studied the intensity ratios between 486.1 nm and various other emission lines, including N2+ 1NG 391.4/470.9 and OI 557.7 nm, in proton-induced auroras based upon both theoretical calculations and available measurements. The ratios are presumably contingent upon the proton energy flux spectrum and pitch-angle distribution. For 10 keV monoenergetic isotropic proton precipitation, the theoretical calculation outcome of the 3,914–4861 ratio is 13.8, and that of the 4,709–4861 ratio is 0.79 (Eather, 1967). The ratios (to 486.1 nm intensity) inferred from realistic measurements are 10.0–17.5 for 391.4 nm, 0.9–1.3 for 470.9 nm, and 9.0–12.5 for 557.7 nm (Eather, 1968). Though not presented we have also investigated the 470.9 nm emission from TRSp data following the same procedures as above-depicted, and found its intensity ratio to 486.1 nm emissions to be ∼0.85 ± 0.07, close to Eather’s result. Although the 391.4 nm line is beyond the TRSp calibration range so that its absolute intensity cannot be reliably obtained, using the theoretical branch ratio of N2+ 1NG series (0.65/0.2 for 391.4/427.8 nm, see Shamansky and Broadfoot, 1971), we convert the observed 4,278–4,861 ratio into the 3,914–4,861 ratio and find the latter (∼13.5 ± 1.2) also consistent with Eather’s result. However, the 5,577–4,861 ratio in our study is larger than that in Eather (1968) by a factor of ∼2–3.
In the last a few decades, many of the impact cross-sections and rate coefficients involved in proton-induced auroras have been updated, and the N2 2PG, LBH band, and OI 630 nm auroras led by proton precipitation have been specifically modeled according to those renewed cross-sections and rate coefficients (e.g., Strickland et al., 1993; Lummerzheim et al., 2001; Galand and Lummerzheim, 2004). Curiously, to the authors’ knowledge there is still a scarcity of efforts in modeling 557.7 nm emissions induced by proton precipitation in recent decades. To be able to do this, all the processes mentioned above, including the charge exchange cycle, fast hydrogen atoms, the spatial spreading, etc., should all be properly taken into account. Such a proton transport model would require a multi-stream or Monte-Carlo approach (e.g., Galand et al., 1997; Fang et al., 2004). Besides, due to the importance of secondary electrons in auroral emissions, the generation of secondary electrons by the proton precipitation and their transport in the ionosphere must also be self-consistently included. The overall model would thus be a combined proton/hydrogen atom/electron transport model (e.g., Strickland et al., 1993). An effort at such a model, as a part of our TREx-auroral transport model for the TREx mission, is currently undergoing and will be the content of a future publication. The quantitative results achieved in this study, such as the intensity ratio between 557.7/427.8 nm emission and the Hβ 486.1 nm emission, will undoubtedly be useful in helping us develop and validate the model. We also welcome research peers to compare our results with the outcome of their existing proton transport/emission models.
5.Summary and conclusion
In this study, we report and analyze an IPA event occurring at ∼0245–0345 UT on 12 October 2021, the Canada Thanksgiving storm night. The IPA of interest contained strong Hβ emissions intensities up to a few hundred Rayleigh, indicating intense proton precipitation, yet the 557.7 nm constituted the strongest emission line of the IPA. The IPA was fairly bright and visible to the naked eye over western Canada, and raised extensive interest among citizen scientists. Using a comprehensive set of optical instruments, we investigate the evolution and the spectrographic properties of the IPA. In-situ and ground magnetometer data show evidence of He-band EMIC wave activities associated with the passage of IPA, corroborating the commonly conceived link between the EMIC waves and the detached proton precipitation. Via careful examination of the spectral intensities and the structural shapes of the 557.7, 427.8, and 486.1 nm emissions based on the TRSp data, we conclude that the 557.7 nm emissions of the detached arc were unlikely to owe their source to energetic electron precipitation from the magnetosphere, but were essentially the byproduct of the proton precipitation, e.g., excited by the secondary electrons produced in the proton precipitation, and/or led by the impact of fast hydrogen atoms. The precipitating proton energies are estimated to range between a few keV and a few tens of keV according to the IPA emission heights inferred from triangulation analyses.
We also obtain the intensity ratios among the 557.7/427.8/486.1 nm emissions of the IPA based on TRSp measurements. The intensity ratios achieved are compatible with Eather, (1967), Eather, (1968) for the proton-induced N2+ 1NG series, but are larger than Eather’s result by a factor ∼2–3 for the 5,577–4,861 ratio. An updated proton auroral emission model, properly taking into account the complicated processes involved in the proton transport and with renewed impact cross sections and rate coefficients, is summoned and currently undertaken by the authors. The results achieved in this study provide a useful guide and can serve as validation tests for existing and developing proton transport/emission models.
Data availability statement
Publicly available datasets were analyzed in this study. This data can be found here: http://data.phys.ucalgary.ca/sort_by_project/other/publication_datasets/fspas.2022.0908.
Author contributions
JL is the corresponding author who conducted most of the data analyses and writing. He also participated in the data calibration. DG is responsible for the calibration of TREx instruments, including the spectrograph. She also contributed some valuable ideas to the manuscript. Professor Eric Donovan supervised this study. He is the PI of the TREx mission. HP provided the CARISMA magnetometer data and the data processing procedure. Professor IM is the PI of the CARISMA mission, and guided our use of the CARISMA data. MC is the PI of AUGSO imagers and co-PI of FESO. He also contributed to the paper’s scientific content and helped edit the manuscript. Professor ES is responsible for the deployment, maintenance and data distribution of TREx instruments.
Funding
The study is supported by the Canadian Space Agency (CSA). TREx is jointly funded by the Canada Foundation for Innovation (CFI), Alberta Economic Development and Trade, and the University of Calgary. FESO is supported by CFI and CSA. AUGSO is supported by the CFI. AUGSO, TREx, and FESO data are publicly available at http://data.phys.ucalgary.ca/sort_by_project/other/publication_datasets/fspas.2022.0908. CARISMA is operated by the University of Alberta and funded by CSA. CARISMA data can be downloaded at https://carisma.ca/. Swarm mission is supported by the European Space Agency; Swarm data can be accessed at http://earth.esa.int/swarm. DMSP SSJ data are downloaded from http://cedar.openmadrigal.org/. GOES data used in this study are from https://ngdc.noaa.gov/stp/satellite/goes-r.html.
Acknowledgments
We acknowledge helpful discussions with Dr. Chao Yue, Dr. Mykhaylo Shumko, and Dr. Binbin Ni.
Conflict of interest
The authors declare that the research was conducted in the absence of any commercial or financial relationships that could be construed as a potential conflict of interest.
Publisher’s note
All claims expressed in this article are solely those of the authors and do not necessarily represent those of their affiliated organizations, or those of the publisher, the editors and the reviewers. Any product that may be evaluated in this article, or claim that may be made by its manufacturer, is not guaranteed or endorsed by the publisher.
Supplementary material
The Supplementary Material for this article can be found online at: https://www.frontiersin.org/articles/10.3389/fspas.2022.1040092/full#supplementary-material
References
Davidson, G. T. (1965). Expected spatial distribution of low-energy protons precipitated in the auroral zones. J. Geophys. Res. 70 (5), 1061–1068. doi:10.1029/JZ070i005p01061
Donovan, E. F., Spanswick, E., Liang, J., Grant, J., Jackel, B. J., and Greffen, M. (2012). Magnetospheric dynamics and the proton aurora. Auror. Phenomenology Magnetos. Process. Earth Other Planets 197, 365. doi:10.1029/2012GM001241
Eather, R. H. (1967). Auroral proton precipitation and hydrogen emissions. Rev. Geophys. 5, 207. doi:10.1029/rg005i003p00207
Eather, R. H. (1968). Spectral intensity ratios in proton-induced auroras. J. Geophys. Res. 73, 119–125. doi:10.1029/ja073i001p00119
Edgar, B. C., Porter, H. S., and Green, A. E. S. (1975). Proton energy deposition in molecular and atomic oxygen and applications to the polar cap. Planet. Space Sci. 23 (5), 787–804. doi:10.1016/0032-0633(75)90015-X
Fang, X., Liemohn, M. W., Kozyra, J. U., and Solomon, S. C. (2004). Quantification of the spreading effect of auroral proton precipitation. J. Geophys. Res. 109, A04309. doi:10.1029/2003JA010119
Fang, X., Lummerzheim, D., and Jackman, C. H. (2013). Proton impact ionization and a fast calculation method. JGR. Space Phys. 118, 5369–5378. doi:10.1002/jgra.50484
Fraser, B. J., Singer, H. J., Adrian, M. L., Gallagher, D. L., and Thomsen, M. F. (2005). “The relationship between plasma density structure and EMIC waves at geosynchronous orbit,” in Inner magnetosphere interactions: New perspectives from imaging, geophys. Monogr. Ser. Editors J. L. Burch, M. Schulz, and H. Spence (Washington, D. C: AGU),
Frey, H. U. (2007). Localized aurora beyond the auroral oval. Rev. Geophys. 45, RG1003. doi:10.1029/2005RG000174
Friis-Christensen, E., Luhr, H., and Hulot, G. (2006). Swarm: A constellation to study the Earth's magnetic field. Earth Planets Space 58, 351.
Fu, S., Ni, B., Lou, Y., Bortnik, J., Ge, Y., Tao, X., et al. (2018). Resonant scattering of near-equatorially mirroring electrons by Landau resonance with H + band EMIC waves. Geophys. Res. Lett. 45, 873. doi:10.1029/2018gl079718
Galand, M., Lilensten, J., Kofman, W., and Sidge, R. B. (1997). Proton transport model in the ionosphere: 1. Multistream approach of the transport equations. J. Geophys. Res. 102, 22261–22272. doi:10.1029/97JA01903
Galand, M., and Lummerzheim, D. (2004). Contribution of proton precipitation to space-based auroral FUV observations. J. Geophys. Res. 109, A03307. doi:10.1029/2003JA010321
Gallardo-Lacourt, B., Frey, H. U., and Martinis, C. (2021). Proton aurora and optical emissions in the subauroral region. Space Sci. Rev. 217, 10. doi:10.1007/s11214-020-00776-6
Gillies, D. M., Donovan, E., Hampton, D., Liang, J., Connors, M., Nishimura, Y., et al. (2019). First observations from the TREx spectrograph: The optical spectrum of STEVE and the picket fence phenomena. Geophys. Res. Lett. 46, 7207–7213. doi:10.1029/2019GL083272
Gillies, D. M., Liang, J., Donovan, E., and Spanswick, E. (2020). The apparent motion of STEVE and the Picket Fence phenomena. Geophys. Res. Lett. 47, e2020GL088980. doi:10.1029/2020GL088980
Gillies, M., Knudsen, D., Donovan, E., Jackel, B., Gillies, R., and Spanswick, E. (2017). Identifying the 630 nm auroral arc emission height: A comparison of the triangulation, fac profile, and electron density methods. J. Geophys. Res. Space Phys. 122, 8181–8197. doi:10.1002/2016JA023758
Immel, T. J., Mende, S. B., Frey, H. U., Patel, J., Bonnell, J. W., Engebretson, M. J., et al. (2005). “ULF waves associated with enhanced subauroral proton precipitation,” in Inner magnetosphere interactions: New perspectives from imaging, geophys. Monogr. Ser. Editors J. L. Burch, M. Schulz, and H. Spence (Washington, D. C: AGU), 159, 71
Immel, T. J., Mende, S. B., Frey, H. U., Peticolas, L. M., Carlson, C. W., Gerard, J., et al. (2002). Precipitation of auroral protons in detached arcs. Geophys. Res. Lett. 29 (11), 1519. doi:10.1029/2001GL013847
Johnson, J. R., Chang, G. B., Crew, B., and Andre, M. (1989). Equatorially generated ULF waves as a source for the turbulence associated with ion conics. Geophys. Res. Lett. 16, 1469–1472. doi:10.1029/GL016i012p01469
Jordanova, V. K., Spasojevic, M., and Thomsen, M. F. (2007). Modeling the electromagnetic ion cyclotron wave-induced formation of detached subauroral proton arcs. J. Geophys. Res. 112, A08209. doi:10.1029/2006JA012215
Khazanov, G. V., Himwich, E. W., Glocer, A., and Sibeck, D. G. (2015). “Role of multiple atmospheric reflections in formation of electron distribution function in the diffuse aurora region,” in Auroral dynamics and Space weather. Editors Y. Zhang, and L. J. Paxton (Hoboken, NJ: John Wiley & Sons). doi:10.1002/9781118978719.ch9
Kim, H., Lessard, M. R., Engebretson, M. J., and Luhr, H. (2010). Ducting characteristics of Pc 1 waves at high latitudes on the ground and in space. J. Geophys. Res. 115. doi:10.1029/2010JA015323
Kim, H., Shiokawa, K., Park, J., Miyoshi, Y., Miyashita, Y., Stolle, C., et al. (2021). Isolated proton aurora driven by EMIC Pc1 wave: PWING, Swarm, and NOAA POES multi-instrument observations. Geophys. Res. Lett. 48, e2021GL095090. doi:10.1029/2021GL095090
Korth, H., Thomsen, M. F., Borovsky, J. E., and McComas, D. J. (1999). Plasma sheet access to geosynchronous orbit. J. Geophys. Res. 104 (A11), 25047–25061. doi:10.1029/1999JA900292
Kress, B. T., Rodriguez, J. V., and Onsager, T. G. (2020). in Chapter 20 - the GOES-R Space environment in situ suite (SEISS): Measurement of energetic particles in Geospace. Editors S. J. Goodman, T. J. Schmit, J. Daniels, and R. J. Redmon (The GOES-R Series, Elsevier), 243.
Kubota, M., Nagatsuma, T., and Murayama, Y. (2003). Evening corotating patches: A new type of aurora observed by high sensitivity all-sky cameras in Alaska. Geophys. Res. Lett. 30. doi:10.1029/2002GL016652
Liang, J., Donovan, E., Connors, M., Gillies, D., St-Maurice, J. P., Jackel, B., et al. (2019). Optical spectra and emission altitudes of double‐layer STEVE: A case study. Geophys. Res. Lett. 46, 13630–13639. doi:10.1029/2019GL085639
Liang, J., Donovan, E. F., Ni, B., Yue, C., Jiang, F., and Angelopoulos, V. (2014). On an energy-latitude dispersion pattern of ion precipitation potentially associated with magnetospheric EMIC waves. J. Geophys. Res. Space Phys. 119, 8137–8160. doi:10.1002/2014ja020226
Liang, J., Donovan, E., Gillies, D., Spanswick, E., and Connors, M. (2017). Proton auroras during the transitional stage of substorm onset. Earth Planets Space 70, 126. doi:10.1186/s40623-018-0899-0
Liang, J., Donovan, E., Jackel, B., Spanswick, E., and Gillies, M. (2016). On the 630 nm red-line pulsating aurora: Red-line Emission Geospace Observatory observations and model simulations. J. Geophys. Res. Space Phys. 121, 7988–8012. doi:10.1002/2016ja02290110.1002/2014JA020226
Liang, J., Zou, Y., Nishimura, Y., Donovan, E., Spanswick, E., and Conde, M. (2021). Neutral wind dynamics preceding the STEVE occurrence and their possible preconditioning role in STEVE formation. JGR. Space Phys. 126, e2020JA028505. doi:10.1029/2020JA028505
Lummerzheim, D., Galand, M., Semeter, J., Mendillo, M. J., Rees, M. H., and Rich, F. J. (2001). Emission of OI(630 nm) in proton aurora. J. Geophys. Res. 106 (A1), 141–148. doi:10.1029/2000ja002005
Mann, I. R., Milling, D. K., Rae, I. J., Ozeke, L. G., Kale, A., Kale, Z. C., et al. (2008). The upgraded CARISMA magnetometer array in the THEMIS era. Space Sci. Rev. 141, 413–451. doi:10.1007/s11214-008-9457-6
Mann, I. R., Usanova, M. E., Murphy, K., Robertson, M. T., Milling, D. K., Kale, A., et al. (2014). Spatial localization and ducting of emic waves: Van Allen probes and ground-based observations. Geophys. Res. Lett. 41, 785–792. doi:10.1002/2013GL058581
Mendillo, M., Baumgardner, J., and Providakes, J. (1989). Ground-based imaging of detached arcs, ripples in the diffuse aurora, and patches of 6300-Å emission. J. Geophys. Res. 94, 5367. doi:10.1029/ja094ia05p05367
Miyoshi, Y., Sakaguchi, K., Shiokawa, K., Evans, D., Albert, J., Connors, M., et al. (2008). Precipitation of radiation belt electrons by EMIC waves, observed from ground and space. Geophys. Res. Lett. 35, L23101. doi:10.1029/2008GL035727
Moshupi, M. C., Cogger, L. L., Wallis, D. D., Murphree, J. S., and Anger, C. D. (1977). Auroral patches in the vicinity of the plasmapause. Geophys. Res. Lett. 4, 37–40. doi:10.1029/gl004i001p00037
Ni, B., Cao, X., Zou, Z., Zhou, C., Gu, X., Bortnik, J., et al. (2015). Resonant scattering of outer zone relativistic electrons by multiband EMIC waves and resultant electron loss time scales. JGR. Space Phys. 120, 7357–7373. doi:10.1002/2015ja021466
Ni, B., Hua, M., Zhou, R., Yi, J., and Fu, S. (2017). Competition between outer zone electron scattering by plasmaspheric hiss and magnetosonic waves. Geophys. Res. Lett. 44, 3465–3474. doi:10.1002/2017GL072989
Nishimura, Y., Bruus, E., Karvinen, E., Martinis, C. R., Dyer, A., Kangas, L., et al. (2022). Interaction between proton aurora and stable auroral red arcs unveiled by citizen scientist photographs. JGR. Space Phys. 127. e2022JA030570. doi:10.1029/2022JA030570
Nishimura, Y., Donovan, E. F., Angelopoulos, V., and Nishitani, N. (2020). Dynamics of auroral precipitation boundaries associated with STEVE and SAID. JGR. Space Phys. 125, e2020JA028067. doi:10.1029/2020JA028067
Ozaki, M., Shiokawa, K., Miyoshi, Y., Kataoka, R., Connors, M., Yagitani, S., et al. (2018). Discovery of 1-Hz range modulation of isolated proton aurora at subauroral latitudes. Geophys. Res. Lett. 45, 1209–1217. doi:10.1002/2017GL076486
Picone, J. M., Hedin, A. E., Drob, D. P., and Atkin, A. C. (2002). NRLMSISE-00 empirical model of the atmosphere: Statistical comparisons and scientific issues. J. Geophys. Res. 107 (A12), SIA 15–SIA 15-16. doi:10.1029/2002JA009430
Redmon, R. J., Denig, W. F., Kilcommons, L. M., and Knipp, D. J. (2017). New DMSP database of precipitating auroral electrons and ions. JGR. Space Phys. 122, 9056–9067. doi:10.1002/2016JA023339
Saikin, A. A., Zhang, J.-C., Allen, R. C., Smith, C. W., Kistler, L. M., Spence, H. E., et al. (2015). The occurrence and wave properties of H+-He+-and O+-band EMIC waves observed by the Van Allen Probes. JGR. Space Phys. 120, 7477–7492. doi:10.1002/2015JA021358
Sakaguchi, K., Shiokawa, K., Ieda, A., Miyoshi, Y., Otsuka, Y., Ogawa, T., et al. (2007). Simultaneous ground and satellite observations of an isolated proton arc at subauroral latitudes. J. Geophys. Res. 112 (A4), A04202. doi:10.1029/2006ja012135
Sakaguchi, K., Shiokawa, K., Miyoshi, Y., and Connors, M. (2015). “Isolated proton auroras and Pc1/EMIC waves at subauroral latitudes,” in Auroral dynamics and Space weather. Editors Y. Zhang, and L. J. Paxton. doi:10.1002/9781118978719
Sakaguchi, K., Shiokawa, K., Miyoshi, Y., Otsuka, Y., Ogawa, T., Asamura, K., et al. (2008). Simultaneous appearance of isolated auroral arcs and Pc 1 geomagnetic pulsations at subauroral latitudes. J. Geophys. Res. 113, A05201. doi:10.1029/2007JA012888
Savitzky, A., and Golay, M. J. E. (1964). Smoothing and differentiation of data by simplified least squares procedures. Anal. Chem. 36, 1627–1639. doi:10.1021/ac60214a047
Shemansky, D. E., and Broadfoot, A. L. (1971). Excitation of N2 and N2+ systems by electrons, I: Absolute transition probabilities. J. Quant. Spectrosc. Radiat. Transf. 11 (10), 1385–1400. doi:10.1016/0022-4073(71)90105-1
Shumko, M., Gallardo-Lacourt, B., Halford, A. J., Blum, L. W., Liang, J., Miyoshi, Y., et al. (2022). Proton aurora and relativistic electron microbursts scattered by electromagnetic ion cyclotron waves. Front. Astron. Space Sci. 9, 975123. doi:10.3389/fspas.2022.975123
Spanswick, E., Donovan, E. F., Kepko, L., and Angelopoulos, V. (2017). The magnetospheric source region of the bright proton aurora. Geophys. Res. Lett. 44 (10), 10, 094–110, 099. doi:10.1002/2017GL074956
Strickland, D. J., Daniell, R. E., Jasperse, J. R., and Basu, B. (1993). Transport-theoretic model for the electron-proton-hydrogen atom aurora: 2. Model results. J. Geophys. Res. 98 (A12), 21533–21548. doi:10.1029/93JA01645
Summers, D., Ni, B., and Meredith, N. P. (2007). Timescales for radiation belt electron acceleration and loss due to resonant wave-particle interactions: 2. Evaluation for VLF chorus, ELF hiss, and electromagnetic ion cyclotron waves. J. Geophys. Res. 112, A04207. doi:10.1029/2006JA011993
Tsyganenko, N. A. (2002). A model of the near magnetosphere with a dawn-dusk asymmetry: 2. Parameterization and fitting to observations. J. Geophys. Res. 107 (A8), SMP 10-11–SMP 10-17. doi:10.1029/2001JA000220
Tsyganenko, N. A. (1996). “Effects of the solar wind conditions on the global magnetospheric configuration as deduced from data-based field models,” in Proceedings of the Third International Conference on Substorms (ICS-3). Editors E. Rolfe, and B. Kaldeich (Versailles, France: Eur. Space Agency Spec. Publ., ESA-SP), 181.
Tsyganenko, N. A. (2000). Modeling the inner magnetosphere: The asymmetric ring current and region 2 Birkeland currents revisited. J. Geophys. Res. 105 (27), 27739–27754. doi:10.1029/2000ja000138
Tsyganenko, N. A., and Sitnov, M. I. (2005). Modeling thedynamics of the inner magnetosphere during strong geomagnetic storms. J. Geophys. Res. 110 (A3), A03208. doi:10.1029/2004JA010798
Unick, C. W., Donovan, E., Connors, M., and Jackel, B. (2017). A dedicated H‐beta meridian scanning photometer for proton aurora measurement. J. Geophys. Res. Space Phys. 122, 753–764. doi:10.1002/2016JA022630
Usanova, M. E., Mann, I. R., and Darrouzet, F. (2016). “EMIC waves in the inner magnetosphere,” in Low-frequency waves in Space plasmas. Editors A. Keiling, D.-H. Lee, and V. Nakariakov. doi:10.1002/9781119055006
Vallance-Jones, A. (1971). Notes from the summer institute on planetary magnetosphere and auroras. NCAR, 327.
Wallis, D. D., Burrows, J. R., Moshupi, M. C., Anger, C. D., and Murphree, J. S. (1979). Observations of particles precipitating into detached arcs and patches equatorward of the auroral oval. J. Geophys. Res. 84 (A4), 1347–1360. doi:10.1029/JA084iA04p01347
Yadav, S., Shiokawa, K., Oyama, S., Inaba, Y., Takahashi, N., Seki, K., et al. (2021). Study of an equatorward detachment of auroral arc from the oval using ground‐space observations and the BATS‐R‐US–CIMI model. JGR. Space Phys. 10126, 12. doi:10.1029/2020ja029080
Yahnin, A. G., Yahnina, T. A., and Frey, H. U. (2007). Subauroral proton spots visualize the Pc1 source. J. Geophys. Res. 112, A10223. doi:10.1029/2007ja012501
Yuan, Z., Deng, X., Lin, X., Pang, Y., Zhou, M., Décréau, P. M. E., et al. (2010). Link between EMIC waves in a plasmaspheric plume and a detached sub-auroral proton arc with observations of Cluster and IMAGE satellites. Geophys. Res. Lett. 37 (7), L07108. doi:10.1029/2010gl042711
Yue, C., Wang, C.-P., Lyons, L., Liang, J., Donovan, E. F., Zaharia, S. G., et al. (2014). Current sheet scattering and ion isotropic boundary under 3-D empirical force-balanced magnetic field. JGR. Space Phys. 119, 8202–8211. doi:10.1002/2014JA020172
Zhang, X.-J., Artemyev, A., Angelopoulos, V., Tsai, E., Wilkins, C., Kasahara, S., et al. (2022). Superfast precipitation of energetic electrons in the radiation belts of the Earth. Nat. Commun. 13, 1611. doi:10.1038/s41467-022-29291-8
Zhang, X.-J., Li, W., Ma, Q., Thorne, R., Angelopoulos, V., Bortnik, J., et al. (2016). Direct evidence for emic wave scattering of relativistic electrons in space. JGR. Space Phys. 121, 6620–6631. doi:10.1002/2016ja022521
Zhang, Y., Paxton, L. J., Morrison, D., Wolven, B., Kil, H., and Wing, S. (2005). Nightside detached auroras due to precipitating protons/ions during intense magnetic storms. J. Geophys. Res. 110, A02206. doi:10.1029/2004JA010498
Keywords: isolated proton aurora, EMIC wave, hydrogen emission, green-line emission, TREX
Citation: Liang J, Gillies D, Donovan E, Parry H, Mann I, Connors M and Spanswick E (2022) On the green isolated proton auroras during Canada thanksgiving geomagnetic storm. Front. Astron. Space Sci. 9:1040092. doi: 10.3389/fspas.2022.1040092
Received: 08 September 2022; Accepted: 30 September 2022;
Published: 13 October 2022.
Edited by:
Xiao-Jia Zhang, University of California, Los Angeles, United StatesReviewed by:
Jiang Liu, University of Southern California, United StatesSheng Tian, AOS UCLA, United States
Copyright © 2022 Liang, Gillies, Donovan, Parry, Mann, Connors and Spanswick. This is an open-access article distributed under the terms of the Creative Commons Attribution License (CC BY). The use, distribution or reproduction in other forums is permitted, provided the original author(s) and the copyright owner(s) are credited and that the original publication in this journal is cited, in accordance with accepted academic practice. No use, distribution or reproduction is permitted which does not comply with these terms.
*Correspondence: Jun Liang, bGlhbmdqQHVjYWxnYXJ5LmNh