 Larry R. Lyons1*
 Yukitoshi Nishimura2
 Jiang Liu1,3
 Sneha Yadav1
 Ying Zou4
 William A. Bristow5
 Eric Donovan6
 Nozomu Nishitani7
- 1Department of Atmospheric and Oceanic Sciences, University of California, Los Angeles, Los Angeles, CA, United States
- 2Center for Space Physics, Department of Electrical and Computer Engineering, Boston University, Boston, MA, United States
- 3Department of Earth, Planetary, and Space Sciences, University of California, Los Angeles, Los Angeles, CA, United States
- 4Applied Physics Laboratory, Laurel, MD, United States
- 5Department of Meteorology and Atmospheric Science, The Pennsylvania State University, State College, PA, United States
- 6Department of Physics and Astronomy, University of Calgary, Calgary, AB, Canada
- 7Institute for Space-Earth Environmental Research, Nagoya University, Nagoya, Aichi, Japan
Flow channels can extend across the polar cap from the dayside to the nightside auroral oval, where they lead to localized reconnection and auroral oval disturbances. Such flow channels can persist within the polar cap >1½ hours, can move azimuthally with direction controlled by IMF By, and may affect time and location of auroral oval disturbances. We have followed a polar cap arc as it moved duskward from Canada to Alaska for ∼2 h while connected to the oval. Two-dimensional ionospheric flows show an adjacent flow channel that moved westward with the arc and was a distinct feature of polar cap convection that locally impinged upon the outer boundary of the auroral oval. The flow channel’s interaction with the oval appears to have triggered two separate substorms during its trip across western Canada and Alaska, controlling the onset location and contributing to subsequent development of substorm activity within the oval. The first substorm (over Canada) occurred during approximately equatorward polar cap flow, whereas the second substorm (over Alaska) occurred as the polar cap arc and flow channel bent strongly azimuthally and appeared to “lay down” along the poleward boundary. The oval became unusually thin, leading to near contact between the polar cap arc and the brightening onset auroral arc within the oval. These observations illustrate the crucial role of polar cap flow channels in the time, location, and duration of space weather activity, and the importance of the duration and azimuthal motion of flow channels within the nightside polar cap.
1 Introduction
Space Weather disturbances are seen in the aurora, which reflect intense particle precipitation into Earth’s upper atmosphere that has major impact on the ionosphere and thermosphere. What controls these disturbances is thus critical for understanding particle precipitation as well as magnetospheric dynamics. Recently, it has been shown that dynamic mesoscale flow structures frequently drive the magnetosphere-ionosphere system (see Chapters in Nishimura et al. (2022), and references therein). They appear to start near the dayside cusps, and then move across the open field line regions of the polar caps (Nishimura et al., 2014). Upon reaching the nightside auroral oval, the polar-cap flow channels can lead to flow channels within the oval (de la Beaujardière et al., 1994; Lyons et al., 2011; Pitkänen et al., 2013), which form auroral disturbances known as poleward boundary intensifications (PBIs) along the auroral poleward boundary (Lorentzen et al., 2004; Nishimura et al., 2013; Zou et al., 2014; Zou, et al., 2015) and auroral streamers, which extend equatorward within the auroral oval from PBIs. Auroral streamer and radar observations indicate that some of these flow channels from the polar cap lead to the major disturbances seen in the aurora: substorms (Nishimura et al., 2010; Nishimura et al., 2011; Lyons et al., 2021a; Lyons et al., 2022) and dawnside omega bands (Henderson et al., 2002; Liu et al., 2018).
Over the polar caps, flow channels often carry with them high-density F region plasma that give rise to polar cap airglow patches (Carlson et al., 2006; Lorentzen et al., 2010), so that patches can be used to follow flow channels as they propagate across the polar cap (Nishimura et al., 2014; Zou et al., 2015; Wang et al., 2016). Such tracking of a flow channel can continue for extended periods of time, such as ∼90 min by Nishimura et al. (2014) and ∼110 min by Zhang et al. (2013). In addition to patches, polar cap arcs are located towards the edge of localized flow channels (Robinson et al., 1987; Valladares and Carlson, 1991; Koustov et al., 2009) and can be used to trace flow channels.
Little has been known about the structure and propagation characteristics of the polar-cap flow channels and how they lead to geomagnetic disturbances. Available evidence suggests that the flow channels are embedded in large-scale convection, and that their orientation tends to agree with orientation expected from the that of the interplanetary magnetic field (IMF) y-component IMF By (Zou et al., 2015). Two examples with large, but oppositely signed, By were presented by Lyons et al. (2023), where flow channels were tracked within the nightside polar cap for 1½-2 h using polar cap patch and arc observations. The flow channels’ By dependent azimuthal motion could clearly be seen, their motion within the nightside polar cap being from dawn-to-dusk and from dusk-to-dawn for the IMF By > 0 and By < 0 event, respectively. Interestingly, the observations indicated that one flow channel can trigger more than one auroral zone disturbances as it moves azimuthally while being connected to the poleward boundary of the nightside auroral oval.
In this paper, we track the duskward motion of a particularly well-observed polar cap arc on 2013 March 15 along its ∼2 h duskward trip across the nightside polar cap during positive IMF By. We show its connections to the auroral oval that suggest flow-channel driving of disturbances within the auroral oval. Using two-dimensional flow vectors, we also obtain significant information on the structure of the polar cap flow channel associated with the arc, the flow channel’s control of the onset and subsequent development of disturbances, and the flow channel’s clear distinction from other flows within the polar cap.
2 Data employed
We use auroral images over western Canada and Alaska from the Time History of Events and Macroscale Interactions during Substorms (THEMIS) ground-based all-sky imager (ASI) array (Mende et al., 2008) and 630 nm images from the color imager at Poker Flat, Alaska. The two-dimensional flow vectors are obtained from all available Super Dual Auroral Radar Network (SuperDARN) radar line-of-sight (LOS) flows and LOS flows from the Poker Flat Incoherent Scatter radar (PFISR, https://amisr.com/amisr/about/about_pfisr/) within the localized field-of view (FOV) of that radar over Alaska. Using the divergence-free condition (Bristow et al., 2016; Bristow et al., 2022), we obtain the divergence-free flow pattern from the LOS SuperDARN velocities using the Spherical Elementary Current Systems (SECS) (Amm et al., 2010). This technique gives a divergence-free solution over a 1° latitude and 3° longitude grid and does not include a background statistical convection model to avoid influence of prescribed background flows and to emphasize the continuity of observed flow channels. Ionospheric densities from PFISR are also used.
Ground magnetic field observations within the auroral-oval covering the longitude range of interest were obtained from SuperMAG (Gjerloev, 2012). The stations used and their geographic locations are shown in Figure 1, and the observations from these stations from 08 to 13 UT on 2013 March 15 are shown in Figure 2 stacked vertically from east to west together with the OMNI IMF measurements (http://omniweb.gsfc.nasa.gov/) for the time period of interest. The two onsets of interest for this study are marked by vertical dashed lines. Note that the IMF By was relatively large (∼8 nT) and positive throughout most of the interval.
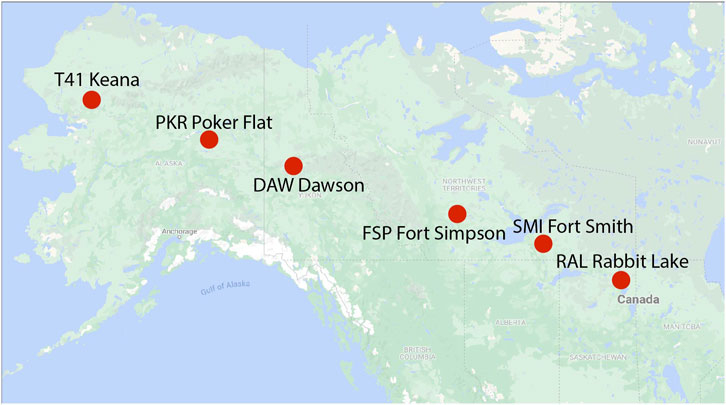
FIGURE 1. Geographic locations of magnetometer used in Figure 2.
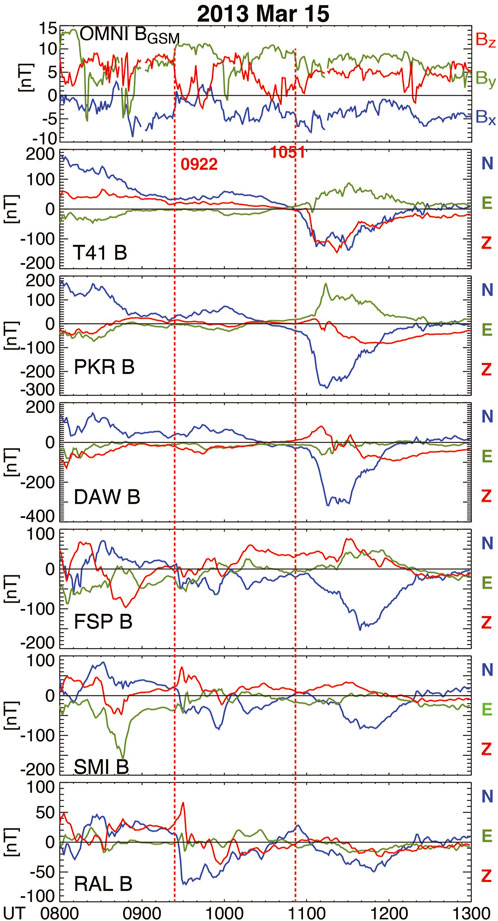
FIGURE 2. Ground magnetic field observations from the stations in Figure 1 from 08 to 13 UT on 2013 March 15 stacked vertically from East to West. OMNI interplanetary magnetic field (IMF) measurements are shown in the top and onset times of two substorms are marker by vertical dashed red lines.
3 Observations
3.1 The first hour: over Canada
Figure 3 presents snapshots of the flow and auroral features associated with the first ∼1 h of a polar cap arc as it moved westward while remaining connected to the poleward boundary of the nightside auroral oval. Each panel includes a mosaic of auroral images from the THEMIS ASIs from central Canada to Alaska, and is overlaid with the 2-D plasma flows obtained from the ground-based radars as described above. Heavier arrows with larger arrowheads give the flow vectors obtained in regions of radar echoes, and thin arrows with small arrowheads give the flows in regions without echoes. Since a background convection model is not included, the flows here are only meaningful in and near regions of echoes. Light yellow two-dashed-line arrows indicate regions of flow near the polar cap arc based on the flow vectors in regions with radar echoes. A movie showing the two-dimensional flows overlaid on the THEMIS ASI images for all 2-min measurement intervals from 08-1130 UT in shown in Supplementary Movie S1.
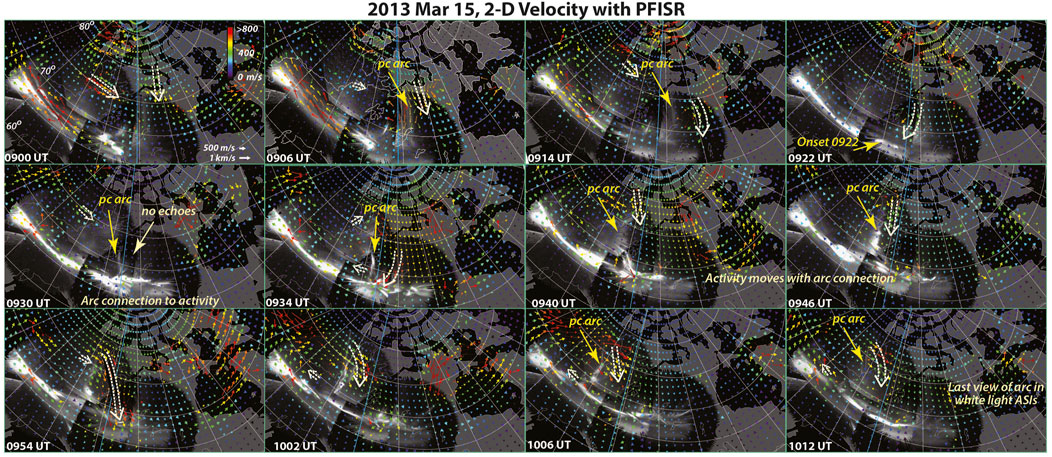
FIGURE 3. Mosaics of auroral images from the THEMIS ASIs from central Canada to Alaska overlaid with the 2-D plasma flows obtained from the ground-based radars as described in the text. Heavier arrows with larger arrowheads give the flow vectors obtained in regions of radar echoes, and thin arrows with small arrowheads give the flows in regions without echoes. Since a background convection model is not included, the flows here are only meaningful in and near regions of echoes. Light yellow two-dashed-line arrows indicate regions of flow relative to the polar cap arc based on flow vectors in regions with radar echoes. Light-blue lines identify the magnetic midnight meridian, and longitude lines are space 1 h in MLT apart. Supplementary Movie S1 shows a movie of these mosaics and flows every 2 min from 08-1130 UT.
The first panel of Figure 3 (0900 UT) shows a flow channel directed towards the auroral oval from ∼80o MLAT. How much further toward the dayside this flow channel extended cannot be determined due to a lack of radar echoes sunward of this region. Based on the available echoes, this flow channel appears to be confined to a width of ∼ 1 h of MLT from 0 to 1 MLT (light blue line identifies the magnetic midnight meridian) and to be well separated from other flows within the polar cap. This flow channel continues to be seen in the 0906 and 0914 UT panels, where its western edge can be seen to lie approximately adjacent to a barely visible polar cap arc near midnight. Available echoes show the flow channel extending further equatorward toward the poleward boundary of the visible auroral oval. In the next panel (0922 UT), the region of echoes shows that the flow channel has moved westward and equatorward and bends further westward near and within the auroral oval, where it is directed toward a small auroral onset at ∼23.5 MLT that led to a 50–70 nT magnetic north (N) depression at the three eastern stations in Figure 2.
In the subsequent panels of Figure 3, we see the polar-cap arc brightening and continuing to be connected to the region of auroral activity to at least 0954 UT as does the polar-cap flow channel (as seen in panels with radar echoes in the region to the east of the arc). In the 0940, 0946, and 0954 UT panels, the arc continues to be seen moving westward as the arc remains connected to the oval, and the auroral activity appears to move with it. Based on the panels with appropriate radar echoes (0922, 0934, and 0954 UT), the adjacent flow also remained connected to, and entered, the auroral oval, moving westward with the westward motion of the arc and auroral oval activity. The magnetometer N depressions continue throughout this period of activity, and the peak in the activity can be seen to progress westward from RAL to SMI. The final panel of Figure 3 (1012 UT) shows that the arc moved westward to near the Alaska-Canada border at ∼23 MLT. This is final time that the arc is visible in the THEMIS ASIs, in part due to the lack of more poleward ASI images over Alaska. Activity with this substorm did not extend westward to Alaska, based on the auroral images and the lack of magnetic variations at DAW, located very near the Alaska-Canada border.
Throughout the period shown in Figure 3, the flow channel directed towards the night-side auroral oval continued as a distinct, longitudinally-localized, feature of polar cap convection. It interacted with the oval, and appears to have led to the substorm and its continuation and westward expansion for over 30 min.
3.2 The second hour: over Alaska
Figure 4 shows data that extends to later times of this event in the same format as Figure 3, except that the images are of 630 nm emissions from the color imager at Poker Flat, Alaska. In general, 630 nm emission are more sensitive to the <1 keV electron precipitation that forms polar cap arcs than are the while light THEMIS ASIs, and their FOV is larger due to the higher altitude of 630 nm emissions than those which typically dominate the THEMIS ASIs. Also shown are ionospheric density measurements along the PFISR radar beams operated during this time period and flow vectors along the PFISR meridian. The flow vectors are a routine PFISR data product that is obtained by a Bayesian linear model that provides a best fit to flow velocities using all the PFISR beams under the assumption of no longitudinal variations within the radar FOV (Nicolls and Heinselman, 2007). A movie showing these panels every 2 min from 08-1130 UT is shown in Supplementary Movie S2.
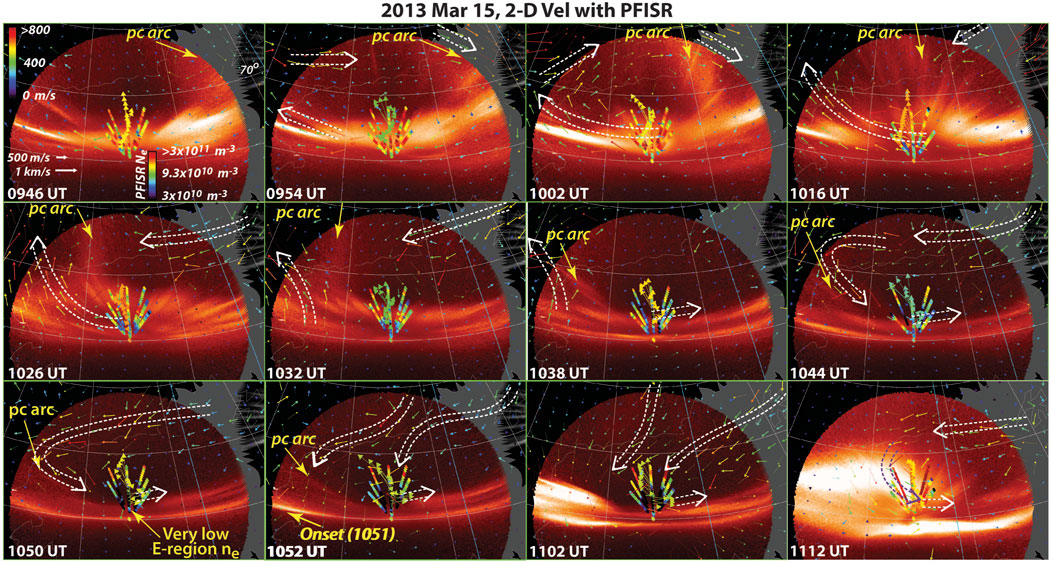
FIGURE 4. Same format as Figure 3, except the images are of 630 nm emissions from the color imager at Poker Flat, Alaska. Also shown are ionospheric density measurements along the FPISR radar beams operated during this time period and flow vectors along the PFISR meridian. A movie showing these panels every 2 min from 08-1130 UT in shown in Supplementary Movie S2.
As identified in Figure 4, the polar-cap arc comes into the FOV of the 630 nm imager at ∼0946, providing ∼25 min of overlap with the images in Figure 3. The arc can be seen to continue its westward progression until ∼1034 UT, which is about 1½ hr after the arc was first discerned in the second panel of Figure 3. By this time, it was over western Canada and at ∼22.3 MLT, ∼2 h of MLT, or ∼3.5 h in geographic longitude, earlier than when it was first seen. After 1034 UT, the poleward part of the arc has moved westward out of the 630 nm image FOV. It is quite interesting that, after ∼1026 UT, the equatorward portion of the polar cap arc, including its connection to the auroral oval, moves westward at a reduced speed causing the equatorward portion of the arc to bend eastward. This equatorward portion of the arc becomes nearly parallel to the poleward boundary of the aurora, and, as it appears to “lay down” along the auroral oval, the onset of a large substorm (∼300 nT peak N depression) can be seen in the 1052 UT panel (the actual auroral onset was closer to 1051 UT; see Additional file S3 of Lyons et al. (2021a) for higher time-resolution images of this onset.).
As the polar cap “lays down” on the oval, the auroral oval appears to thin considerably. Based on the 630 nm emissions along the PFISR meridian, which is the best for viewing since it is the central meridian of the FOV, the oval thinned to about 1o in latitudinal width just before onset (1050 UT panel). The PFISR density measurements support this strong thinning of the oval, the color for the densities along the radar beams just poleward of the arc becoming black, i.e., greatly reduced densities, in the region closest to the radar where the radar beams are within the E-region. This indicates a large reduction in the energy flux of electron precipitation. Such density reduction is not seen further poleward where the radar beams enter the F-region and polar cap patches might be present.
The plasma flows in the regions of echoes in Figure 4 are initially (0954 and 1004 UT panels) eastward in the poleward portion of the 630 nm imager FOV and northwestward to the west of the PFISR beams. As the polar cap arc becomes fully within the FOV of the imager, the flow channel seen during the previous hour in Figure 3 can be seen as southwestward flow intruding to the region just east of the arc, and continuing to extend eastward with the arc (1016-1032 UT panels). Subsequent panels show that, as the equatorward portion of the polar cap arc starts to bend and lay down on the oval, the flow channel appears to bend equatorward and, as seen in the PFISR flow vectors, turn to become an eastward flow channel adjacent to the poleward boundary of the oval. Such a flow must be associated with equatorward Pederson currents, which would be directed toward the auroral arc within the thinning auroral oval. Because of the flow shear across, and upward field-aligned current within, an auroral arc, as strong an eastward flow would not be expected equatorward of that arc, though we don’t have flow measurement that could confirm this.
As can be seen in the final (1102 and 1112 UT) panels and Supplementary Movie S2, this flow channel from the polar cap continued to impact and enter the poleward expanding auroral bulge after onset until at least 1114 UT, after which time there were no longer sufficient radar echoes.
4 Discussion and summary
Flow channels have previously been observed to extend across the polar cap from the dayside to the nightside auroral oval, where they lead to localized reconnection and auroral oval disturbances (Nishimura et al., 2014). We have recently presented evidence that such polar cap flow channels can persist within the polar cap for at least 1½ - 2 h, that they can move azimuthally with their direction controlled by the IMF By, and that they affect the time and location of space weather disturbances within the auroral oval (Lyons et al., 2023). Here we have followed a polar cap as it moved duskward from Canada to Alaska over a ∼2 h period while it remained connected to the auroral oval. As expected, the examined two-dimensional ionospheric flows show a flow channel adjacent to the arcs that moved westward with the arc. This flow channel was a distinct feature of the polar convection that locally impinged upon the outer boundary of the polar cap. The flow channel’s interaction with the auroral oval triggered two separate substorms during its trip across Western Canada and Alaska, and this interaction appeared to substantially control the onset and subsequent development of substorm activity within the oval.
It has been established previously that flow channels from the polar cap can enter the auroral oval (plasma sheet), and that most substorm onsets can be ascribed to a flow channel directed to the substorm onset location at the time of onset (Nishimura et al., 2010; Lyons et al., 2021b; Lyons et al., 2022). During the first hour, we see the flow channel from the polar cap being directed to the time and location of the onset of a small substorm over western Canada. The flow channel continued to remain connected to the substorm auroral activity as it moved westward, and appears to have been responsible for the westward expansion of the auroral activity for over 30 min. This is consistent with our previously presented evidence that a continuation of polar-cap flow channels impinging on the substorm auroral activity may be responsible for prolonging activity (Lyons et al., 2011). In addition to supporting that proposition, the observations add another interesting facet, that being that the azimuthal motion of a flow channel responsible for initiating a substorm may also be responsible for the azimuthal expansion of the substorm activity. Note that we have not discerned useful information on why this onset occurred at the particular location along the flow-channel’s westward journey or why the westward expansion of the expansion phase activity ceased when it did.
About ½-hour after the activity from the first substorm ceased, the equatorward portion of the polar cap arc moved westward at a lower speed than the poleward portion of the arc, causing the equatorward portion of the arc to bend eastward and become nearly parallel to the poleward boundary of the aurora oval. The flow channels associated with the arc turned towards the east and, and as it appears to have “laid down” along the poleward boundary of the auroral oval. The auroral oval became unusually thin, so that there was nearly contact between the polar cap arc, now lying approximately along the poleward boundary of the auroral oval, and an arc that brightened, leading to the onset of a large substorm. Such strong oval thinning substorm events were identified and referred to as “contact events” by Nishimura et al. (2011), and the observations here suggest that some of these events may be driven by polar cap flow channels that “lay down” along the auroral poleward boundary. In the event presented here, this flow channel from the polar cap continued to impact and enter the poleward expanding auroral bulge after onset for nearly 25 min, adding further support to the possibility that a continuation of polar-cap flow channels impinging on the substorm auroral activity may be responsible for prolonging auroral activity.
The observations for the event examined here highlight the importance of polar cap flow channels in controlling the time, location, and duration of space weather activity and associated energy deposition to the ionosphere and thermosphere, and indicate the importance of the duration of the flow channels and their azimuthal motion within the nightside polar cap. They also indicate a type of polar cap structure that can lead to extreme thinning of the auroral oval and “contact event” substorm onsets, and indicate the importance of longitudinally localized reconnection along the nightside open-closed magnetic field boundary driven by polar cap flow channels.
Data availability statement
Publicly available datasets were analyzed in this study. This data can be found here: SuperDARN data were obtained from: http://vt.superdarn.org. The solar wind and geomagnetic index data are provided by the NASA OMNIWeb (http://omniweb.gsfc.nasa.gov/), and the ground magnetometer data from the SuperMAG website: https://supermag.jhuapl.edu/ that uses processing described in Gjerloev. (2012). The University of Alaska ASI data is available from http://optics.gi.alaska.edu/optics/, and we thank Don Hampton for making this data available, and the THEMIS ASI data from http://themis.ssl.berkeley.edu/themisdata/. The PFISR data is available at amisr.com/database and isr.sri.com/madrigal. The THEMIS ASI data were obtained from http://themis.ssl.berkeley.edu/themisdata/.
Author contributions
LL: Conceptualization, Formal Analysis, Methodology, Writing–original draft. YN: Conceptualization, Formal Analysis, Methodology, Visualization, Writing–review and editing. JL: Visualization, Writing–review and editing. SY: Methodology, Visualization, Writing–review and editing. YZ: Methodology, Visualization, Writing–review and editing. WB: Data curation, Writing–review and editing. ED: Data curation, Writing–review and editing. NN: Data curation, Writing–review and editing.
Funding
The author(s) declare financial support was received for the research, authorship, and/or publication of this article. Work at UCLA has been supported by NSF grant AGS-2055192 and AGS-2247034, NASA grants 80NSSC20K1314 and 80NSSC22K0749, and AFOSR FA9550-23-1-0614, at Boston University by AFOSR FA9559-16-1-0364 and FA9550-23-1-0614, NASA 80NSSC18K0657 and 80NSSC23K0410, NSF AGS-1907698 and AGS-2100975, and at APL by NSF grant AGS-2331593. SuperDARN work at Penn State was supported by AFOSR FA9559-16-1-0364. SuperDARN operations and research at Pennsylvania State University are supported under NSF Grants PLR-1443504 from the Office of Polar Programs, and AGS-1934419 from the Geospace Section of NSF Division of Atmospheric and Geospace Sciences. SuperDARN is a collection of radars funded by national scientific funding agencies of Australia, Canada, China, France, Italy, Japan, Norway, South Africa, United Kingdom and the United States.
Conflict of interest
The authors declare that the research was conducted in the absence of any commercial or financial relationships that could be construed as a potential conflict of interest.
The author(s) declared that they were an editorial board member of Frontiers, at the time of submission. This had no impact on the peer review process and the final decision.
Publisher’s note
All claims expressed in this article are solely those of the authors and do not necessarily represent those of their affiliated organizations, or those of the publisher, the editors and the reviewers. Any product that may be evaluated in this article, or claim that may be made by its manufacturer, is not guaranteed or endorsed by the publisher.
Supplementary material
The Supplementary Material for this article can be found online at: https://www.frontiersin.org/articles/10.3389/fspas.2023.1309870/full#supplementary-material
References
Amm, O., Grocott, A., Lester, M., and Yeoman, T. K. (2010). Local determination of ionospheric plasma convection from coherent scatter radar data using the SECS technique. J. Geophys. Res. Space Phys. 115 (A3), 14832. doi:10.1029/2009JA014832
Bristow, W. A., Hampton, D. L., and Otto, A. (2016). High-spatial-resolution velocity measurements derived using Local Divergence-Free Fitting of SuperDARN observations. J. Geophys. Res. Space Phys. 121 (2), 1349–1361. doi:10.1002/2015JA021862
Bristow, W. A., Lyons, L. R., Nishimura, Y., Shepherd, S. G., and Donovan, E. F. (2022). High-latitude plasma convection based on SuperDARN observations and the locally divergence free criterion. J. Geophys. Res. Space Phys. 127 (12), e2022JA030883. doi:10.1029/2022JA030883
Carlson, H. C., Moen, J., Oksavik, K., Nielsen, C. P., McCrea, I. W., Pedersen, T. R., et al. (2006). Direct observations of injection events of subauroral plasma into the polar cap. Geophys. Res. Lett. 33 (5), L05103. doi:10.1029/2005GL025230
de la Beaujardière, O., Lyons, L. R., Ruohoniemi, J. M., Friis-Christensen, E., Danielsen, C., Rich, F. J., et al. (1994). Quiet-time intensifications along the poleward auroral boundary near midnight. J. Geophys. Res. 99 (A1), 287–298. doi:10.1029/93JA01947
Gjerloev, J. W. (2012). The SuperMAG data processing technique. J. Geophys. Res. Space Phys. 117 (A9), A09213. doi:10.1029/2012JA017683
Henderson, M. G., Kepko, L., Spence, H. E., Connors, M., Sigwarth, J. B., Frank, L. A., et al. (2002). “The evolution of north-south aligned auroral forms into auroral torch structures: the generation of omega bands and ps6 pulsations via flow bursts,” in Sixth international conference on substorms. Editor R. M. Winglee (Seattle: The University of Washington), 169–174.
Koustov, A. V., St.-Maurice, J.-P., Sofko, G. J., Andre, D., MacDougall, J. W., Hairston, M. R., et al. (2009). Three-way validation of the Rankin Inlet PolarDARN radar velocity measurements. Radio Sci. 44 (4), 4045. doi:10.1029/2008RS004045
Liu, J., Lyons, L. R., Archer, W. E., Gallardo-Lacourt, B., Nishimura, Y., Zou, Y., et al. (2018). Flow shears at the poleward boundary of omega bands observed during conjunctions of swarm and THEMIS ASI. Geophys. Res. Lett. 45 (3), 1218–1227. doi:10.1002/2017GL076485
Lorentzen, D. A., Moen, J., Oksavik, K., Sigernes, F., Saito, Y., and Johnsen, M. G. (2010). In situ measurement of a newly created polar cap patch. J. Geophys. Res. Space Phys. 115 (A12), A12323. doi:10.1029/2010JA015710
Lorentzen, D. A., Shumilov, N., and Moen, J. (2004). Drifting airglow patches in relation to tail reconnection. Geophys. Res. Lett. 31 (2), 17785. doi:10.1029/2003GL017785
Lyons, L. R., Liu, J., Nishimura, Y., Reimer, A. S., Bristow, W. A., Hampton, D. L., et al. (2021b). Radar observations of flows leading to substorm onset over Alaska. J. Geophys. Res. Space Phys. 126 (2), e2020JA028147. doi:10.1029/2020JA028147
Lyons, L. R., Liu, J., Nishimura, Y., Wang, C.-P., Reimer, A. S., Bristow, W. A., et al. (2021a). Radar observations of flows leading to longitudinal expansion of substorm onset over Alaska. J. Geophys. Res. Space Phys. 126 (2), e2020JA028148. doi:10.1029/2020JA028148
Lyons, L. R., Nishimura, Y., Kim, H.-J., Donovan, E., Angelopoulos, V., Sofko, G., et al. (2011). Possible connection of polar cap flows to pre- and post-substorm onset PBIs and streamers. J. Geophys. Res. 116, 14. doi:10.1029/2011ja016850
Lyons, L. R., Nishimura, Y., Liu, J., Bristow, W. A., Zou, Y., and Donovan, E. F. (2022). Verification of substorm onset from intruding flow channels with high-resolution SuperDARN radar flow maps. J. Geophys. Res. Space Phys. 127 (8), e2022JA030723. doi:10.1029/2022JA030723
Lyons, L. R., Nishimura, Y., Liu, J., Zou, Y., Bristow, W. A., Yadav, S., et al. (2023). Unsolved problems: mesoscale polar cap flow channels’ structure, propagation, and effects on space weather disturbances. Front. Astronomy Space Sci. 10, 1147531. doi:10.3389/fspas.2023.1147531
Mende, S. B., Harris, S. E., Frey, H. U., Angelopoulos, V., Russell, C. T., Donovan, E., et al. (2008). The THEMIS array of ground-based observatories for the study of auroral substorms. Space Sci. Rev. 141 (1–4), 357–387. doi:10.1007/s11214-008-9380-x
Nicolls, M. J., and Heinselman, C. J. (2007). Three-dimensional measurements of traveling ionospheric disturbances with the poker Flat incoherent scatter radar. Geophys. Res. Lett. 34 (21), 31506. doi:10.1029/2007GL031506
Nishimura, Y., Lyons, L., Zou, S., Angelopoulos, V., and Mende, S. (2010). Substorm triggering by new plasma intrusion: THEMIS all-sky imager observations. J. Geophys. Res. 115 (A7), 15166. doi:10.1029/2009JA015166
Nishimura, Y., Lyons, L. R., Shiokawa, K., Angelopoulos, V., Donovan, E. F., and Mende, S. B. (2013). Substorm onset and expansion phase intensification precursors seen in polar cap patches and arcs. J. Geophys. Res. Space Phys. 118 (5), 2034–2042. doi:10.1002/jgra.50279
Nishimura, Y., Lyons, L. R., Zou, S., Angelopoulos, V., and Mende, S. B. (2011). “Categorization of the time sequence of events leading to substorm onset based on THEMIS all-sky imager observations,” in The dynamic magnetosphere. Editors W. Liu, and M. Fujimoto (Netherlands Dordrecht: Springer), 133–142. Avaliable at: http://www.springerlink.com/content/x170k84772368516/.
Nishimura, Y., Lyons, L. R., Zou, Y., Oksavik, K., Moen, J. I., Clausen, L. B., et al. (2014). Day-night coupling by a localized flow channel visualized by polar cap patch propagation. Geophys. Res. Lett. 41 (11), 3701–3709. doi:10.1002/2014GL060301
Nishimura, Y., Verkhoglyadova., O., Deng, Y., and Zhang, S.-R. (2022). Cross-scale coupling and energy transfer in the magnetosphere-ionosphere-thermosphere system. Amsterdam: Elsevier.
Pitkänen, T., Aikio, A. T., and Juusola, L. (2013). Observations of polar cap flow channel and plasma sheet flow bursts during substorm expansion. J. Geophys. Res. Space Phys. 118 (2), 774–784. doi:10.1002/jgra.50119
Robinson, R. M., Vondrak, R. R., Miller, K., Dabbs, T., and Hardy, D. (1987). On calculating ionospheric conductances from the flux and energy of precipitating electrons. J. Geophys. Res. 92 (A3), 2565–2569. doi:10.1029/JA092iA03p02565
Valladares, C. E., and Carlson, H. C. (1991). The electrodynamic, thermal, and energetic character of intense Sun-aligned arcs in the polar cap. J. Geophys. Res. Space Phys. 96 (A2), 1379–1400. doi:10.1029/90JA01765
Wang, B., Nishimura, Y., Lyons, L. R., Zou, Y., Carlson, H. C., Frey, H. U., et al. (2016). Analysis of close conjunctions between dayside polar cap airglow patches and flow channels by all-sky imager and DMSP. Earth, Planets Space 68 (1), 150. doi:10.1186/s40623-016-0524-z
Zhang, Q.-H., Zhang, B.-C., Lockwood, M., Hu, H.-Q., Moen, J., Ruohoniemi, J. M., et al. (2013). Direct observations of the evolution of polar cap ionization patches. Science 339 (6127), 1597–1600. doi:10.1126/science.1231487
Zou, Y., Nishimura, Y., Lyons, L. R., Donovan, E. F., Ruohoniemi, J. M., Nishitani, N., et al. (2014). Statistical relationships between enhanced polar cap flows and PBIs. J. Geophys. Res. Space Phys. 119 (1), 151–162. doi:10.1002/2013JA019269
Zou, Y., Nishimura, Y., Lyons, L. R., Shiokawa, K., Donovan, E. F., Ruohoniemi, J. M., et al. (2015). Localized polar cap flow enhancement tracing using airglow patches: statistical properties, IMF dependence, and contribution to polar cap convection. J. Geophys. Res. Space Phys. 120, 4064–4078. doi:10.1002/2014JA020946
Keywords: polar cap, aurora, convection, flow channels, space weather, substorms
Citation: Lyons LR, Nishimura Y, Liu J, Yadav S, Zou Y, Bristow WA, Donovan E and Nishitani N (2024) Space weather with an arc’s ∼2 h trip across the nightside polar cap. Front. Astron. Space Sci. 10:1309870. doi: 10.3389/fspas.2023.1309870
Received: 08 October 2023; Accepted: 27 December 2023;
Published: 22 January 2024.
Edited by:
Dedong Wang, GFZ German Research Centre for Geosciences, GermanyCopyright © 2024 Lyons, Nishimura, Liu, Yadav, Zou, Bristow, Donovan and Nishitani. This is an open-access article distributed under the terms of the Creative Commons Attribution License (CC BY). The use, distribution or reproduction in other forums is permitted, provided the original author(s) and the copyright owner(s) are credited and that the original publication in this journal is cited, in accordance with accepted academic practice. No use, distribution or reproduction is permitted which does not comply with these terms.
*Correspondence: Larry R. Lyons, bGFycnlAYXRtb3MudWNsYS5lZHU=