 Alexis N. Hensley
 Harriet George
 Milla Kalliokoski3
 Leonid Olifer
- 1Physics Department, Berea College, Berea, KY, United States
- 2Laboratory for Atmospheric and Space Physics, University of Colorado Boulder, Boulder, CO, United States
- 3Department of Physics, University of Helsinki, Helsinki, Finland
- 4Department of Physics, University of Alberta, Edmonton, AB, Canada
Introduction: The Earth’s radiation belt environment is highly dynamic, with different processes acting on various particle populations over a range of timescales. Constraining the timescales over which these processes act is essential to both our physical understanding of the radiation belt environment and our ability to predict and mitigate space weather effects.
Methods: In this study, we leverage the GPS constellation to evaluate a radiation belt dropout that occurred on 14 May 2019, combining observations from 18 GPS satellites during this event to evaluate the dominant loss mechanism of the dropout and to constrain the timescale of this loss. This dropout affected the entire relativistic electron population, abruptly depleting the 4 MeV population by an order of magnitude following a strong magnetopause compression.
Results: We identify magnetopause shadowing as the dominant loss mechanism during this dropout through analysis of the electron flux data and the temporal evolution of the electron phase space density with respect to the last closed drift shell. The
Discussion: Dropout events are typically understood to occur on timescales of several hours to a day and sub-hour dropouts have previously only been reported by a handful of studies, so this is an exceptionally rapid elimination of the relativistic population. Our results therefore reinforce that radiation belt dropouts can occur on sub-hour timescales and highlight the value of the GPS constellation (which now contains 25 satellites distributed across magnetic local time) on studying these rapid, large-scale dynamics in the Earth’s radiation belts.
1 Introduction
Earth’s outer radiation belt is largely composed of electron populations with energies ranging from 100s keV to multiple MeV, and extends from
The Earth’s radiation belts pose a threat to electronics and humans in space, and are therefore a significant space weather hazard (Baker et al., 2017). The outer radiation belt has been highlighted as a particularly severe space weather hazard to spacecraft, including commercial, military and scientific spacecraft (Lanzerotti and Baker, 2017). Satellites that are located on geostationary orbit (equatorial orbits at
Radiation belt dropout events are characterized by permanent losses of radiation belt electrons, where the flux of a given population is significantly depleted or even eliminated (e.g., Turner et al., 2012). Precipitation into the atmosphere is a major pathway for the loss of radiation belt electrons. Wave-particle interactions that drive pitch-angle scattering are a major driver of precipitation; plasmaspheric hiss precipitates 10s - 100s keV electrons (Li et al., 2019; Ma et al., 2021) and electromagnetic ion cyclotron (EMIC) waves can drive precipitation of 100s keV to multi-MeV electrons (Usanova et al., 2014; Hendry et al., 2017). Radiation belt losses can also occur when particles cross the magnetopause during their drift orbit and are lost to the solar wind. This can be caused by inward motion of the magnetopause (Cohen et al., 2017; Staples et al., 2022) or outward motion of radiation belt particles (Ozeke et al., 2017; Ozeke et al., 2020; George et al., 2022). The subsolar magnetopause is generally located
Determining the dominant loss mechanism(s) and the timescale of loss during dropout events is critical for understanding these system-wide disruptions to the radiation belt environment. Dropout events may be predominantly caused by precipitation (e.g., Pham et al., 2017), dominated by loss across the magnetopause (e.g., Olifer et al., 2018), or due to a balance of these two loss pathways (e.g., Xiang et al., 2017). Statistical analysis of 1.1–1.5 MeV radiation belt electron dropouts that were driven by solar wind transients had an average loss time of 6 h (Borovsky and Denton, 2009). A large amount of recent radiation belts research on dropout events (e.g., Turner et al., 2014; Xiang et al., 2018) was performed using the Van Allen Probes (RBSP) constellation, which consisted of a pair of satellites with approximately 8 h orbital periods. RBSP data revealed that radiation belt dropout events generally occur on a timescale of a few hours (Turner and Ukhorskiy, 2020, and references within). For example, one dropout event during the RBSP era caused the relativistic electron population to be lost in
However, a small number of radiation belt dropouts have been identified that occurred significantly faster than this few-hour timescale. Through analyses that combined in-situ data from multiple constellations and/or satellite constellations that dwell within the radiation belts, a few radiation belt dropout events were found to have occurred on sub-hour timescales. As an extreme example, Kurita et al. (2018) reported that an order of magnitude loss of
In this study, we evaluate a rapid radiation belt dropout that occurred on 14 May 2019, using observations of outer radiation belt electrons from the GPS constellation. We find that the 4 MeV electron population was totally eliminated in 30 min at
2 Data and methods
2.1 GPS electron flux data
We use electron flux data (
We utilize data from all active satellites that carry a Combined X-ray Dosimeter (CXD) instrument during the 14 May 2019 event, except ns60, ns69, and ns74 for a total of 18 satellites. The CXD instrument provides omnidirectional electron counts with a 4-min time resolution. The electron count data from GPS satellites were calibrated against Van Allen Probe (RBSP) data during satellite conjunctions to derive a flux data product; a summary of the calculation of electron fluxes from GPS observations is provided in Morley et al. (2016). Satellite ns60 had intermittent noise during this event that resulted in unreliable flux fit modeling so was removed from the analysis; Smirnov et al. (2020) and Kalliokoski et al. (2023) also removed satellite ns60 from their analysis of 17 years due to long-term intermittent noise. Satellite ns69 was removed due to low-quality fits. Satellite ns74 was removed from the analysis because the
We use version v1.10 of the GPS data. We use the 4.0 MeV electron fluxes included in the GPS data product for this study and L-shell calculated with the (Tsyganenko, 1989, T89) magnetic field model combined with the International Geomagnetic Reference Field (IGRF, Alken et al., 2021) internal field.
We use the fit quality flag (F, Equation 1) defined in Smirnov et al. (2020), where the predicted and observed:.
where the predicted and observed counts are provided by the variables “model_counts_electron_fit” and “rate_electron_measured” respectively in the GPS datafiles. We remove any flux datapoints where
2.2 Phase space density calculation
Evaluation of flux data to determine the mechanism(s) driving radiation belt dynamics can sometimes be misleading, as adiabatic changes (such as the Dst effect, Kim and Chan, 1997) can drive large variations in the flux data without fundamentally changing the population. To overcome this limitation, many radiation belt studies (e.g., Reeves et al., 2013; Turner et al., 2014; Dai et al., 2015; Zou et al., 2020; Drozdov et al., 2022) evaluate the phase space density (PSD,
The electron phase space density can be calculated from the electron flux. Electron flux data are generally provided as a function of energy (
We calculate the electron phase space density from the GPS data following the approach of Hartley and Denton (2014), which has previously been applied to the GPS data in Kalliokoski et al. (2023), Olifer et al. (2024). In order to calculate the electron PSD from the GPS flux data, we first select the
The next step of the PSD calculation combines the omnidirectional electron flux data corresponding to the selected
The use of a pitch angle model to calculate the directional fluxes from the omnidirectional flux data introduces some uncertainty. When a GPS satellite is near the magnetic equator, the counts measured by the CXD instrument will encompass a large majority of the electron population, including the particles with very large equatorial pitch angles that mirror near the equator. However, as the satellite moves away from the equator, the GPS count data will represent a smaller and smaller portion of the total population, as the CXD will only be able to detect electrons that have a magnetic mirror point that is located at a magnetic latitude that is greater than the latitude of the satellite. As a consequence, the GPS count data at large
2.3 Solar wind and geomagnetic conditions
We use solar wind and interplanetary magnetic field (IMF) data accessed from the OMNI database (Papitashvili and King, 2020) to contextualize the radiation belt dropout event. We use the 1-min time resolution data from the WIND spacecraft that was timeshifted from the L1 point to the subsolar bowshock nose. We also use planetary K-index (
3 Event overview
Solar wind/IMF conditions and geomagnetic indices are shown in Figure 1 to contextualize the radiation belt dropout that occurred on 14 May 2019. Figure 1a shows the IMF components and magnitude, subplot 1b depicts the solar wind dynamic pressure, and subplot1c provides the solar wind velocity. Subplot 1d shows the
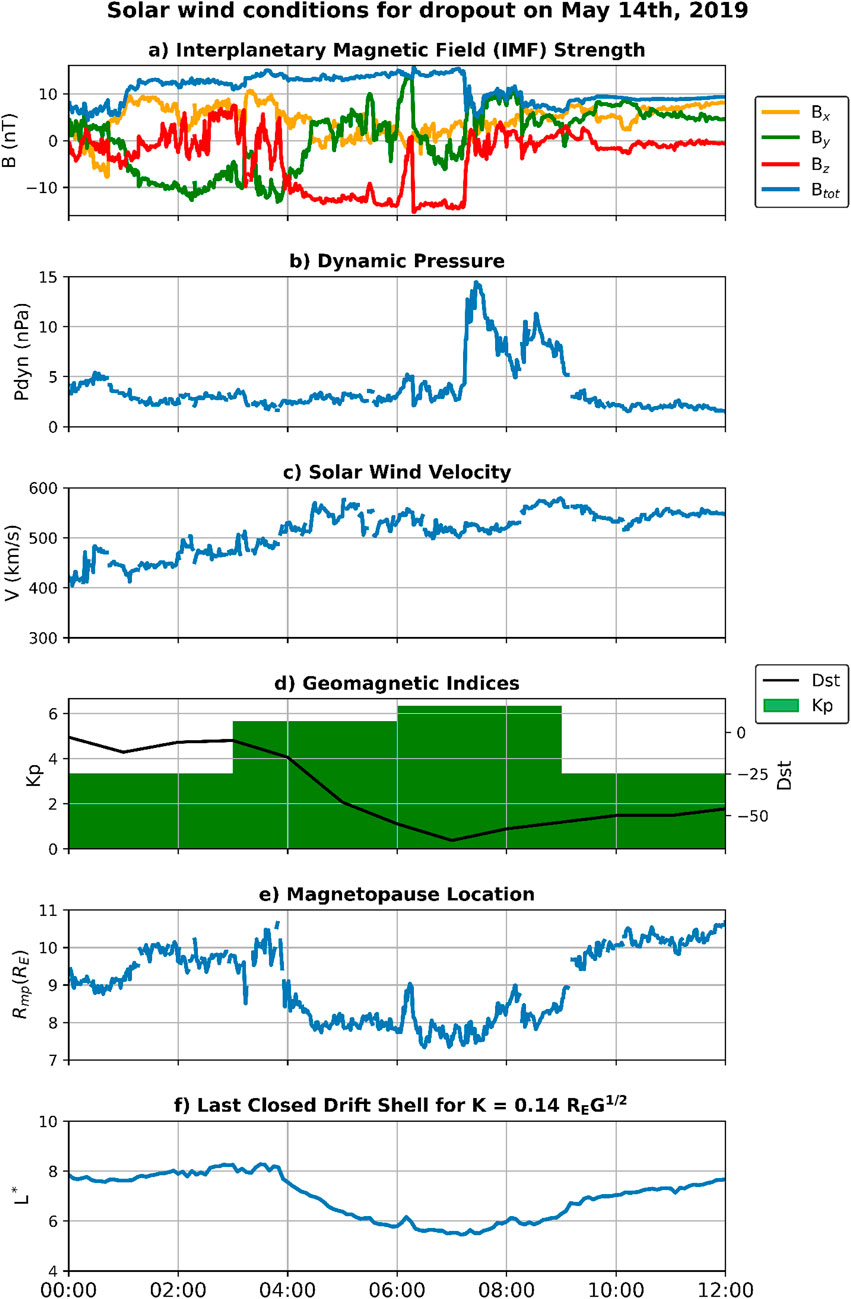
Figure 1. Solar wind driving conditions during the radiation belt dropout event. (a) Interplanetary Magnetic Field (IMF) strength and components. (b) Solar wind dynamic pressure. (c) Solar wind velocity. (d)
The solar wind velocity steadily increases from
Negative IMF
The LCDS, which represents the outer boundary of trapped outer radiation belt particles in adiabatic space (Albert et al., 2018), also demonstrates a strong compression from
4 Results
4.1 Radiation belt fluxes
Figure 2 shows the combined flux data from all 18 GPS satellites on 14 May 2019 for relativistic electron populations at energies ranging from 0.8–4 MeV. These data are binned over 30 min and 0.2
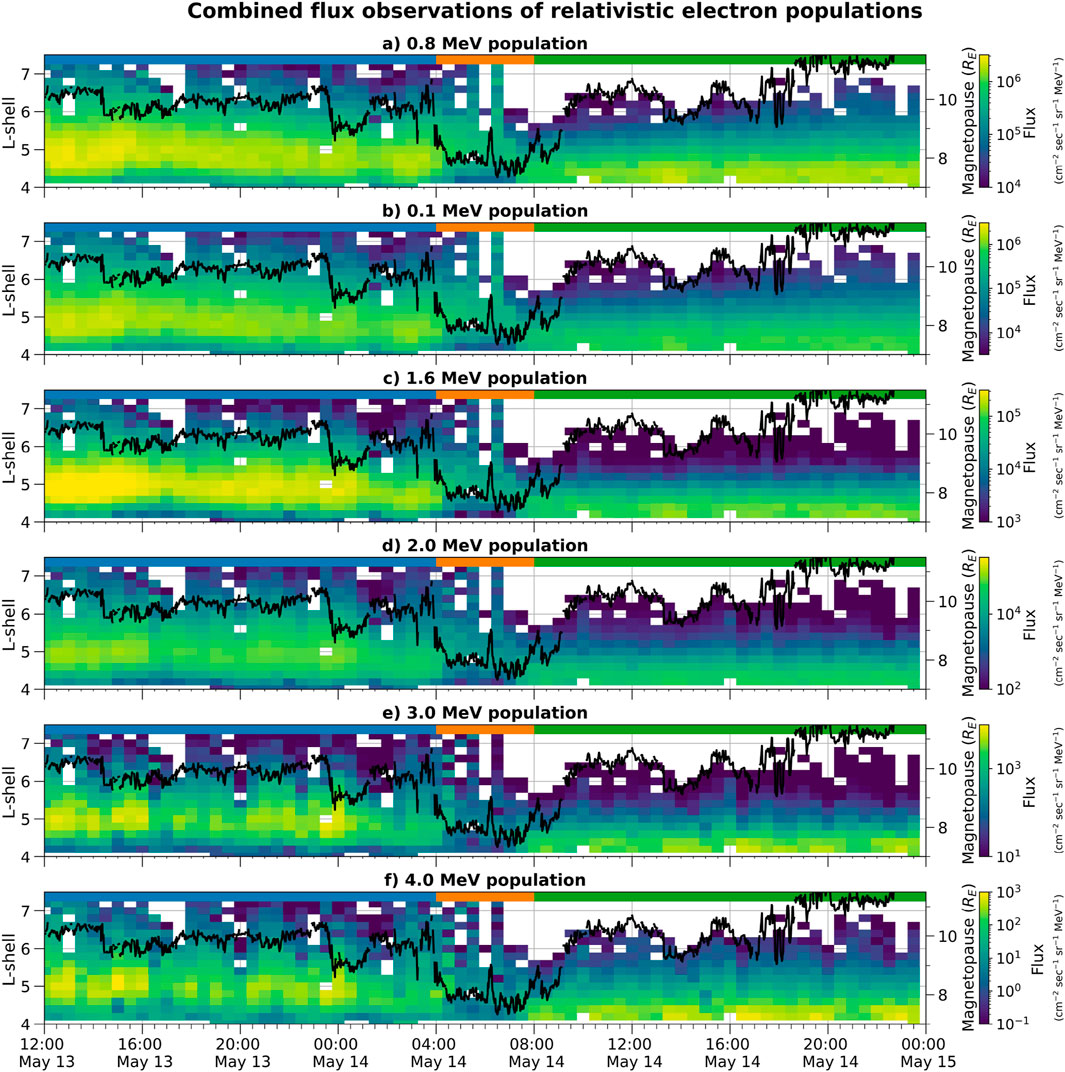
Figure 2. Combined GPS satellite observations of the 0.8, 1.0, 1.6, 2.0, 3.0, and 4.0 MeV electron fluxes, compiled from 18 satellites, spanning from noon on May 13 to the end of 14 May 2019, with the Shue et al. (1998) magnetopause model overlaid in black. The magnetopause model corresponds to the righ y-axis. On each subplot, there are three color bars illustrating the different stages of the event, with the start and end times of the event stages estimated to 1-h precision. Blue represents the pre-dropout stage, the orange color bar represents the dropout itself, and the green color bar represents the post-dropout (recovery) period. Note that the colour scale varies between subplots. (a) 0.8 MeV population, (b) 0.1 MeV population, (c) 1.6 MeV population, (d) 2.0 MeV population, (e) 3.0 MeV population, (f) 4.0 MeV population.
Figure 2 spans the time period from noon May 13 until the end of 15 May 2019 to contextualise the dropout event with respect to the pre-dropout conditions and recovery phase. There are steady fluxes for the afternoon of May 13 and early morning of May 14, with comparatively minor temporal variations in the 4 MeV electron population. These fluxes are greatest between
To more thoroughly evaluate the spatial and temporal evolution of the radiation belt dynamics during the dropout itself, we examine the observations of single GPS satellites during the dropout. Figure 3 shows the 4 MeV flux data as a function of time and L-shell from selected satellites (ns67, ns72, ns65, and ns64 respectively) during this event. The color scale shows the magnitude of the electron flux, and each subplot uses the same color bars to enable direct comparison of the electron fluxes observed by each satellite. GPS satellites are distributed along four orbital planes, and therefore sample different L-shell at different times; we selected representative examples of satellites on different orbital planes to show in Figure 3. While instrumentation limitations of the GPS satellites means that a quantitative comparison of the flux data from different satellites is not always meaningful, the different orbital trajectories of these satellites allows us to qualitatively evaluate the outer radiation belt fluxes at different phases of the dropout event and the timing of the dynamics with respect to the magnetopause location. Please note that Figure 3 shows the flux observations by individual satellites over a shorter, 12 h time frame than Figure 2.
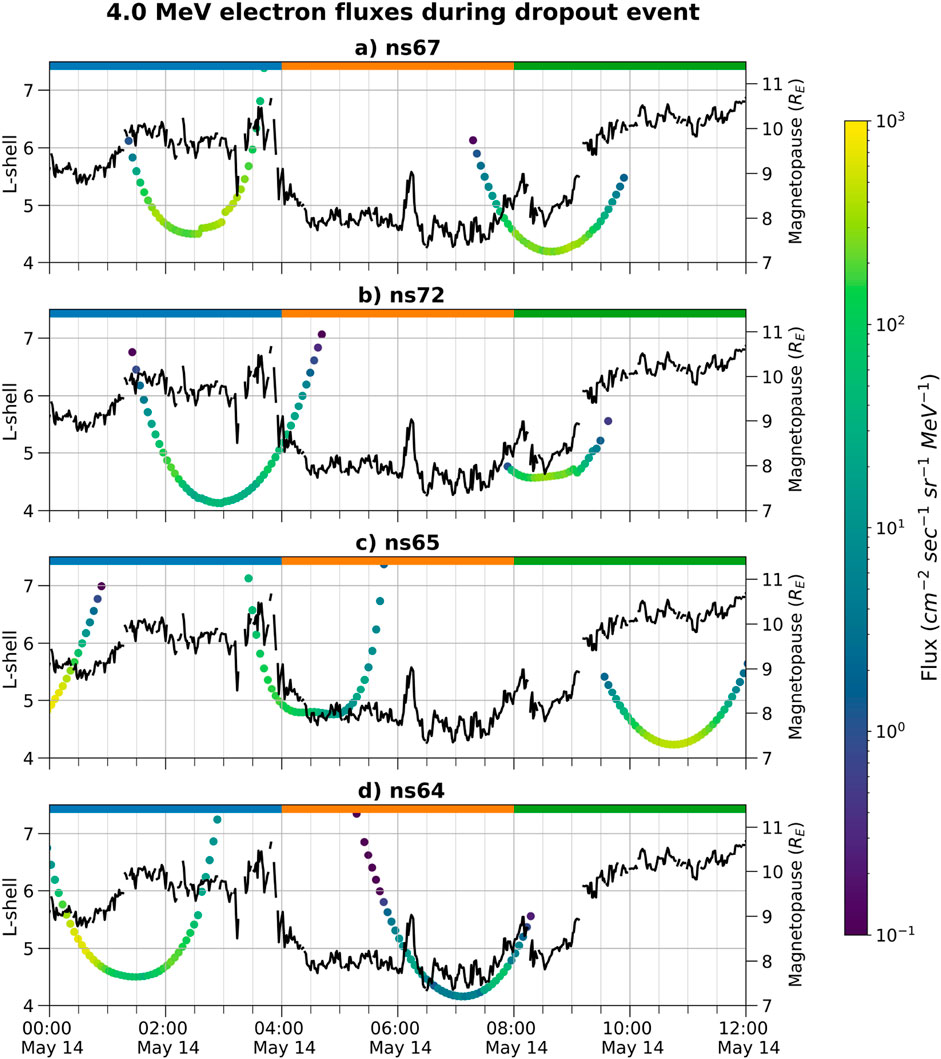
Figure 3. Each subplot shows 4 MeV flux data from individual satellites (ns67, ns72, ns65, and ns64, respectively) over 12 h on 14 May 2019. Three color bars are shown at the top of each subplot to represent the three main phases of the dropout event, in the same way as Figure 2. (a) ns67, (b) ns72, (c) ns65, (d) ns64.
The pre-dropout fluxes are shown by complete passes of ns67 (subplot a) and ns64 (subplot d), and partial passes of ns72 (subplot b) and ns65 (subplot c) prior to 4:00. The fluxes observed by each satellite are approximately temporally constant at a given L-shell until
These GPS flux data demonstrate that the 4 MeV electron population experienced a strong dropout that began at approximately 4:00 on 14 May 2019 and lasted for approximately 4 hours before beginning to recover around 8:00. Analysis of the radiation belt fluxes observed by individual GPS satellites distributed along different orbital planes demonstrates that the dropout onset closely corresponds to the beginning of the strong compression of the magnetopause, with the recovery of the radiation belt fluxes also corresponding to the relaxation of the magnetopause to its nominal location. This close timing correlation between the radiation belt flux dropout/recovery and the magnetopause compression/relaxation is a strong indicator that significant loss across the magnetopause occurred during this event.
Relativistic radiation belt electrons can also be lost via precipitation to the atmosphere by pitch-angle scattering driven by electromagnetic ion cyclotron (EMIC) waves (Usanova et al., 2014). EMIC-driven losses are characterised by the near-simultaneous precipitation of high energy electrons and low energy protons (Carson et al., 2013). Algorithms to detect relativistic electron precipitation (REP) signatures have been developed for the Polar Orbiting Environmental Satellites (POES) satellites (Hendry et al., 2016) and CALET instrument onboard the International Space Station (ISS) (Vidal-Luengo et al., 2024). Neither algorithm detected REP signatures during the dropout event on 14 May 2019, although we note that the CALet algorithm detected 5 REP events between 7:20 and 8:56 on this date. These precipitation signatures did not occur during the dropout itself but rather began during the recovery phase when there were more relativistic radiation belt electrons available to be precipitated at low L-shell. Visual inspection of the POES data indicated that multiple REP events may have occurred between midnight and 8:00 on May 14, which encompasses both the dropout event and a 4-h period prior to the dropout onset, although a high level of background proton precipitation resulted in non-detection of REP events by the algorithm. It is therefore possible that a combination of EMIC-driven precipitation and losses across the magnetopause occurred on 14 May 2019, despite the lack of unambiguous REP detections from either CALET or POES during the dropout event. However, the presence of possible REP events for 4 hours prior to the dropout in combination with the sudden dropout onset means that it is unlikely that precipitation was the driving loss mechanism of this dropout, while losses across the magnetopause are significantly more likely due to the close timing correlation between the magnetopause compression and the onset of the dropout.
4.2 Phase space density results
To constrain the timing of the dropout event and further evaluate the driving mechanism by which the radiation belt electrons were lost, we investigate the temporal evolution of the electron PSD. Figure 4 shows the electron PSD profiles for 18 satellites organized by their pass start times. The PSD is calculated from the GPS electron flux data combined with the TS04 geomagnetic field model and the REPAD model for the population with
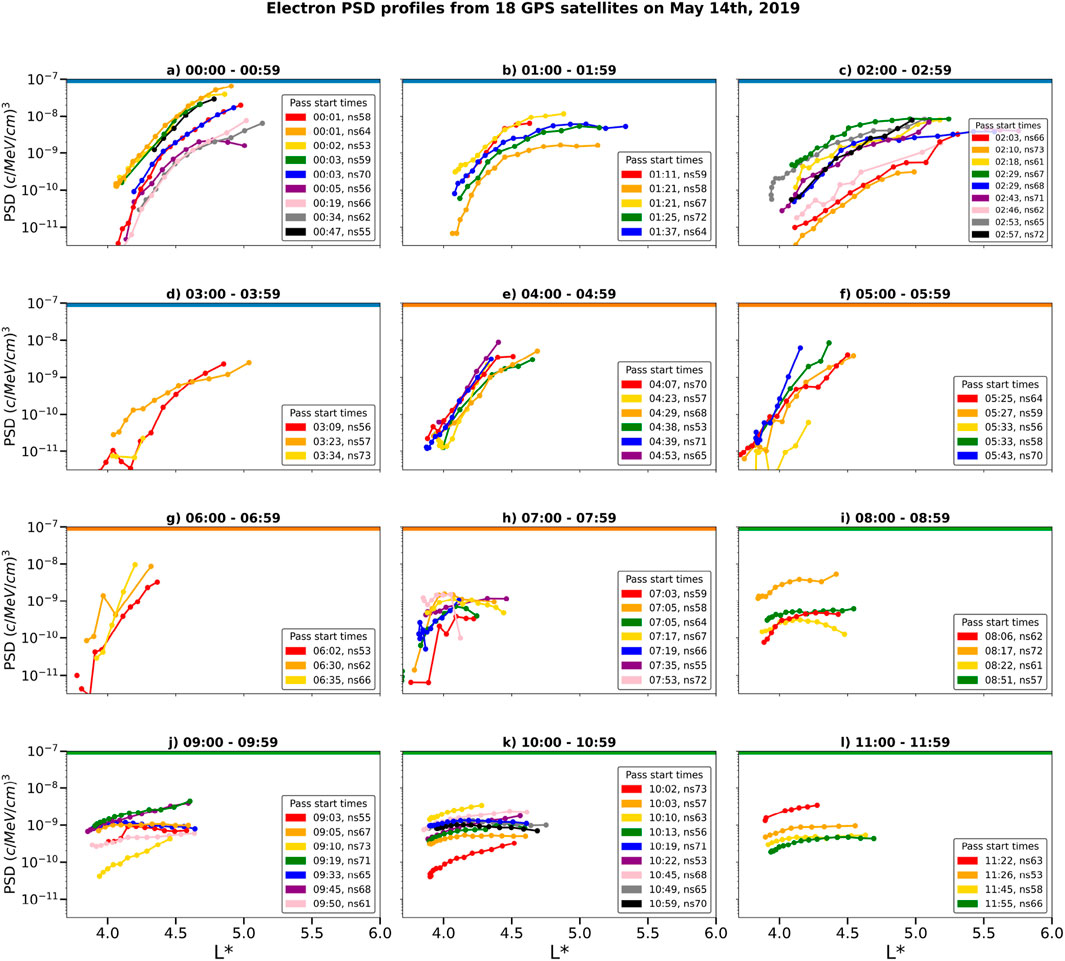
Figure 4. Electron phase space density profiles for the
Prior to the magnetopause compression and the radiation belt dropout at
In subplot 4e, which shows the observations from 4:00–4:59, the PSD profiles exhibit a distinct change from the earlier profiles. The PSD profiles in Figure 4e show a significantly steeper gradient than those from earlier in the day, and also span a shorter
The steep PSD gradient persists until the pass that begins at 6:30 (orange profile, ns62, subplot 4g). These PSD profiles are characteristic of loss at the outer boundary (i.e., across the magnetopause) that suddenly and permanently removed the particles at high
The PSD profile begins to flatten after 7:00, as observed by ns59 and shown in red in subplot 4 h. The innermost four data points, observed at 7:03–7:31 show a steep gradient, consistent with the earlier PSD profiles. The outermost three data points observed by ns59 in this pass, observed at 7:35, 7:39 and 7:43, form a distinctly flatter profile, indicating that the loss across the magnetopause is no longer dominating the system and the radial diffusion has begun to flatten the PSD profile. The other passes that began between 7:00–7:59 show the same flattening of the PSD profile; the ns55 pass, for example, that is shown in purple in subplot 4 h has an extremely shallow gradient. This PSD evolution from a steep gradient to a near-flat profile is characteristic of strong radial diffusion that acts relatively quickly to completely rearrange the outer radiation belt electrons. The flat PSD profiles then persisted for several hours; Figure 4 shows these profiles until noon and Supplementary Figure S1 in the Supplementary Material shows the PSD profiles in the same format from noon until midnight on May 14th. This evolution of the PSD profiles and the near-flat PSD profiles (see Figure 4l in particular) demonstrate that radial diffusion dominated the radiation belt dynamics from
The dynamics of the PSD profiles are tightly correlated with the timing of the magnetopause and LCDS compression and relaxation, shown in Figure 1e. The PSD extends over a broad
Figure 5 shows the PSD data in selected
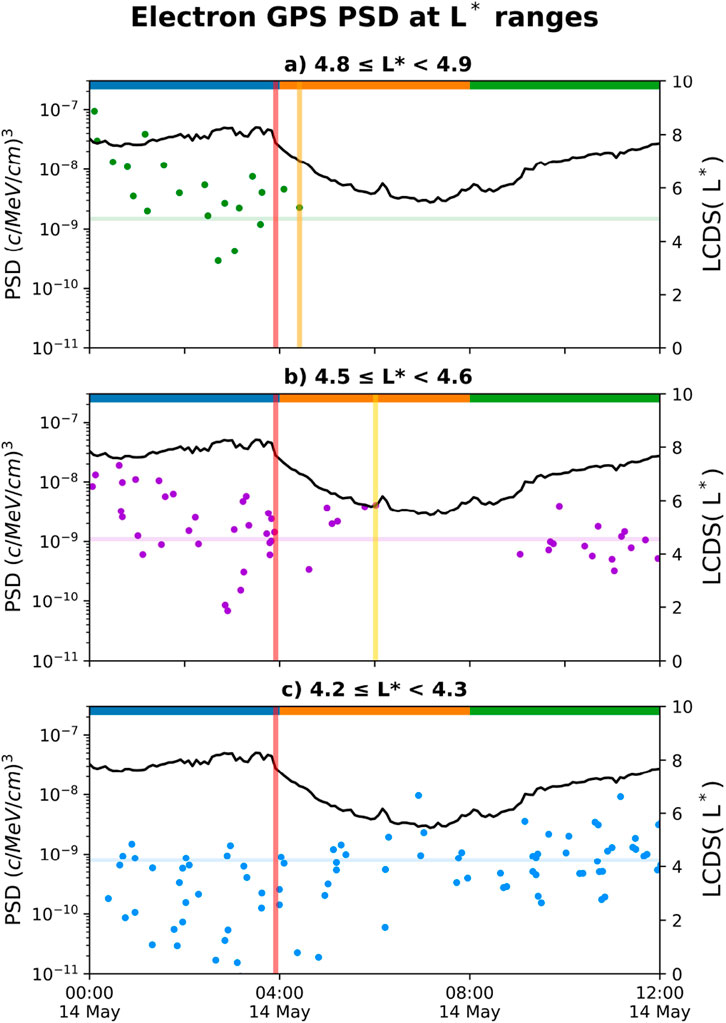
Figure 5. Temporal evolution of the electron PSD in different
Figure 5a shows that the PSD values at
The PSD at
By contrast, the PSD at the innermost
These results show that the PSD loss heavily depended on both
5 Conclusion
A strong radiation belt dropout occurred on 14 May 2019, during a moderate geomagnetic storm. This affected all electron populations
Sub-hour radiation belt dropouts are exceptionally rapid. Radiation belt dropouts are widely recognised as occurring on timescales of a few hours (Turner and Ukhorskiy, 2020, and references within), and dropouts on timescales of
Data availability statement
Publicly available datasets were analyzed in this study. This data can be found here: https://www.ngdc.noaa.gov/stp/space-weather/satellite-data/satellite-systems/lanl_gps/version_v1.10/.
Author contributions
AH: Formal Analysis, Visualization, Writing – original draft, Writing – review and editing, Investigation. HG: Formal Analysis, Visualization, Writing – original draft, Writing – review and editing, Conceptualization, Methodology, Supervision. MK: Data curation, Formal Analysis, Writing – review and editing. LO: Data curation, Formal Analysis, Writing – review and editing.
Funding
The author(s) declare that financial support was received for the research and/or publication of this article. This research was supported by the Boulder Solar Alliance Research Experience for Undergraduates Program, funded by the National Science Foundation, Award #1950911.
Acknowledgements
We thank Aaron Hendry and Sergio Vidal-Luengo for providing information on the relativistic electron precipitation signatures detected by their algorithms on the day of this dropout event.
Conflict of interest
The authors declare that the research was conducted in the absence of any commercial or financial relationships that could be construed as a potential conflict of interest.
Generative AI statement
The author(s) declare that no Generative AI was used in the creation of this manuscript.
Any alternative text (alt text) provided alongside figures in this article has been generated by Frontiers with the support of artificial intelligence and reasonable efforts have been made to ensure accuracy, including review by the authors wherever possible. If you identify any issues, please contact us.
Publisher’s note
All claims expressed in this article are solely those of the authors and do not necessarily represent those of their affiliated organizations, or those of the publisher, the editors and the reviewers. Any product that may be evaluated in this article, or claim that may be made by its manufacturer, is not guaranteed or endorsed by the publisher.
Supplementary material
The Supplementary Material for this article can be found online at: https://www.frontiersin.org/articles/10.3389/fspas.2025.1694836/full#supplementary-material
References
Albert, J. M., Selesnick, R. S., Morley, S. K., Henderson, M. G., and Kellerman, A. C. (2018). Calculation of last closed drift shells for the 2013 GEM radiation belt challenge events. J. Geophys. Res. Space Phys. 123, 9597–9611. doi:10.1029/2018JA025991
Alken, P., Thébault, E., Beggan, C. D., Amit, H., Aubert, J., Baerenzung, J., et al. (2021). International geomagnetic reference field: the thirteenth generation. Earth, Planets Space 73, 49. doi:10.1186/s40623-020-01288-x
Baker, D. N., Erickson, P. J., Fennell, J. F., Foster, J. C., Jaynes, A. N., and Verronen, P. T. (2017). Space weather effects in the earth’s radiation belts. Space Sci. Rev. 214, 17. doi:10.1007/s11214-017-0452-7
Bentley, S. N., Stout, J. R., Thompson, R. L., Ratliff, D. J., and Watt, C. E. J. (2024). Two methods to analyze radial diffusion ensembles: the perils of space- and time-dependent diffusion. Phys. Plasmas 31, 112901. doi:10.1063/5.0217268
Borovsky, J. E., and Denton, M. H. (2009). Relativistic-electron dropouts and recovery: a superposed epoch study of the magnetosphere and the solar wind. J. Geophys. Res. Space Phys. 114. doi:10.1029/2008JA013128
Carson, B. R., Rodger, C. J., and Clilverd, M. A. (2013). POES satellite observations of EMIC-Wave driven relativistic electron precipitation during 1998–2010. J. Geophys. Res. Space Phys. 118, 232–243. doi:10.1029/2012JA017998
Chen, Y., Friedel, R. H. W., Henderson, M. G., Claudepierre, S. G., Morley, S. K., and Spence, H. E. (2014). REPAD: an empirical model of pitch angle distributions for energetic electrons in the Earth’s outer radiation belt. J. Geophys. Res. Space Phys. 119, 1693–1708. doi:10.1002/2013JA019431
Cohen, I. J., Mauk, B. H., Anderson, B. J., Westlake, J. H., Sibeck, D. G., Turner, D. L., et al. (2017). Statistical analysis of mms observations of energetic electron escape observed At/beyond the dayside magnetopause. J. Geophys. Res. Space Phys. 122, 9440–9463. doi:10.1002/2017JA024401
Cowley, S. W. H., and Lockwood, M. (1992). Excitation and decay of solar wind-driven flows in the magnetosphere-ionosphere system. Ann. Geophys. 10, 103–115. Available online at: https://ui.adsabs.harvard.edu/abs/1992AnGeo..10..103C/abstract.
Dai, L., Wang, C., Duan, S., He, Z., Wygant, J. R., Cattell, C. A., et al. (2015). Near-earth injection of mev electrons associated with intense dipolarization electric fields: van allen probes observations. Geophys. Res. Lett. 42, 6170–6179. doi:10.1002/2015GL064955
Dai, L., Han, Y., Wang, C., Yao, S., Gonzalez, W., Duan, S., et al. (2023). Geoeffectiveness of Interplanetary alfvén waves. I. Magnetopause magnetic reconnection and directly driven substorms. Astrophysical J. 945, 47. doi:10.3847/1538-4357/acb267
Dai, L., Zhu, M., Ren, Y., Gonzalez, W., Wang, C., Sibeck, D., et al. (2024). Global-scale magnetosphere convection driven by dayside magnetic reconnection. Nat. Commun. 15, 639. doi:10.1038/s41467-024-44992-y
Drozdov, A. Y., Allison, H. J., Shprits, Y. Y., Usanova, M., Saikin, A., and Wang, D. (2022). Depletions of multi-mev electrons and their association to minima in phase space density. Geophys. Res. Lett. 49, e2021GL097620. doi:10.1029/2021GL097620
Fairfield, D. H. (1971). Average and unusual locations of the earth’s magnetopause and bow shock. J. Geophys. Res. (1896-1977) 76, 6700–6716. doi:10.1029/JA076i028p06700
Fu, W. D., Fu, H. S., Zhang, W. Z., Yu, Y., and Cao, J. B. (2025). Compression of earth’s magnetopause Down to 5 re during the superstorm on 10 may 2024. Geophys. Res. Lett. 52, e2024GL114040. doi:10.1029/2024GL114040
George, H., Reeves, G., Cunningham, G., Kalliokoski, M. M. H., Kilpua, E., Osmane, A., et al. (2022). Contributions to loss across the magnetopause during an electron dropout event. J. Geophys. Res. Space Phys. 127, e2022JA030751. doi:10.1029/2022JA030751
Grandin, M., Aikio, A. T., and Kozlovsky, A. (2019). Properties and geoeffectiveness of solar wind high-speed streams and stream interaction regions during solar cycles 23 and 24. J. Geophys. Res. Space Phys. 124, 3871–3892. doi:10.1029/2018JA026396
Hartley, D. P., and Denton, M. H. (2014). Solving the radiation belt riddle. Astronomy & Geophys. 55, 6.17–6.20. doi:10.1093/astrogeo/atu247
Hastings, D., and Garrett, H. (1996). The space radiation environment. Cambridge University Press: Cambridge Atmospheric and Space Science Series, 208–249.
Henderson, M., Morley, S., Niehof, J., and Larsen, B. (2018). Drsteve/lanlgeomag: v1.5.16. doi:10.5281/zenodo.1195041
Hendry, A. T., Rodger, C. J., Clilverd, M. A., Engebretson, M. J., Mann, I. R., Lessard, M. R., et al. (2016). Confirmation of EMIC wave-driven relativistic electron precipitation. J. Geophys. Res. Space Phys. 121, 5366–5383. doi:10.1002/2015JA022224
Hendry, A. T., Rodger, C. J., and Clilverd, M. A. (2017). Evidence of sub-mev emic-driven electron precipitation. Geophys. Res. Lett. 44, 1210–1218. doi:10.1002/2016GL071807
Horne, R. B., Glauert, S. A., Kirsch, P., Heynderickx, D., Bingham, S., Thorn, P., et al. (2021). The satellite risk prediction and radiation forecast system (sarif). Space weather. 19, e2021SW002823. doi:10.1029/2021SW002823
Kalliokoski, M. M. H., Henderson, M. G., Morley, S. K., Kilpua, E. K. J., Osmane, A., Olifer, L., et al. (2023). Outer radiation belt flux and phase space density response to sheath regions: Van Allen probes and GPS observations. J. Geophys. Res. Space Phys. 128, e2022JA030708. doi:10.1029/2022JA030708
Kim, H.-J., and Chan, A. A. (1997). Fully adiabatic changes in storm time relativistic electron fluxes. J. Geophys. Res. Space Phys. 102, 22107–22116. doi:10.1029/97JA01814
Koskinen, H. E. J., and Kilpua, E. K. J. (2022). Physics of earth’s radiation belts. Springer International Publishing. doi:10.1007/978-3-030-82167-8
Kurita, S., Miyoshi, Y., Shiokawa, K., Higashio, N., Mitani, T., Takashima, T., et al. (2018). Rapid loss of relativistic electrons by EMIC waves in the outer radiation belt observed by arase, Van Allen probes, and the PWING ground stations. Geophys. Res. Lett. 45 (12), 720–12. doi:10.1029/2018GL080262
Lanzerotti, L. J., and Baker, D. N. (2017). Space weather research: earth’s radiation belts. Space weather. 15, 742–745. doi:10.1002/2017SW001654
Li, W., Shen, X.-C., Ma, Q., Capannolo, L., Shi, R., Redmon, R. J., et al. (2019). Quantification of energetic electron precipitation driven by plume whistler mode waves, plasmaspheric hiss, and exohiss. Geophys. Res. Lett. 46, 3615–3624. doi:10.1029/2019GL082095
Loto’aniu, T. M., Singer, H. J., Waters, C. L., Angelopoulos, V., Mann, I. R., Elkington, S. R., et al. (2010). Relativistic electron loss due to ultralow frequency waves and enhanced outward radial diffusion. J. Geophys. Res. Space Phys. 115. doi:10.1029/2010JA015755
Ma, Q., Li, W., Zhang, X. J., Bortnik, J., Shen, X. C., Connor, H. K., et al. (2021). Global survey of electron precipitation due to hiss waves in the earth’s plasmasphere and plumes. J. Geophys. Res. Space Phys. 126, e2021JA029644. doi:10.1029/2021JA029644
Madanian, H., Gingell, I., Chen, L.-J., and Monyek, E. (2024). Drivers of magnetic field amplification at oblique shocks: in situ observations. Astrophysical J. Lett. 965, L12. doi:10.3847/2041-8213/ad3073
Milan, S., Wild, J., Grocott, A., and Draper, N. (2006). Space- and ground-based investigations of solar wind–magnetosphere–ionosphere coupling. Adv. Space Res. 38, 1671–1677. doi:10.1016/j.asr.2005.08.009
Morley, S. K., Friedel, R. H. W., Cayton, T. E., and Noveroske, E. (2010). A rapid, global and prolonged electron radiation belt dropout observed with the global positioning system constellation. Geophys. Res. Lett. 37. doi:10.1029/2010GL042772
Morley, S. K., Sullivan, J. P., Henderson, M. G., Blake, J. B., and Baker, D. N. (2016). The global positioning system constellation as a space weather monitor: comparison of electron measurements with Van allen probes data. Space weather. 14, 76–92. doi:10.1002/2015SW001339
Morley, S. K., Sullivan, J. P., Carver, M. R., Kippen, R. M., Friedel, R. H. W., Reeves, G. D., et al. (2017). Energetic particle data from the global positioning system constellation. Space weather. 15, 283–289. doi:10.1002/2017SW001604
Mourenas, D., Artemyev, A. V., Ma, Q., Agapitov, O. V., and Li, W. (2016). Fast dropouts of multi-MeV electrons due to combined effects of EMIC and whistler mode waves. Geophys. Res. Lett. 43, 4155–4163. doi:10.1002/2016GL068921
Olifer, L., Mann, I. R., Morley, S. K., Ozeke, L. G., and Choi, D. (2018). On the role of last closed drift shell dynamics in driving fast losses and Van Allen radiation belt extinction. J. Geophys. Res. Space Phys. 123, 3692–3703. doi:10.1029/2018JA025190
Olifer, L., Morley, S. K., Ozeke, L. G., Mann, I. R., Kalliokoski, M. M. H., Henderson, M. G., et al. (2024). Rapid acceleration bursts in the Van allen radiation belt. J. Geophys. Res. Space Phys. 129, e2024JA032544. doi:10.1029/2024JA032544
Ozeke, L. G., Mann, I. R., Murphy, K. R., Sibeck, D. G., and Baker, D. N. (2017). Ultra-relativistic radiation belt extinction and ulf wave radial diffusion: modeling the September 2014 extended dropout event. Geophys. Res. Lett. 44, 2624–2633. doi:10.1002/2017GL072811
Ozeke, L. G., Mann, I. R., Olifer, L., Dufresne, K. Y., Morley, S. K., Claudepierre, S. G., et al. (2020). Rapid outer radiation belt flux dropouts and fast acceleration during the March 2015 and 2013 storms: the role of ultra-low frequency wave transport from a dynamic outer boundary. J. Geophys. Res. Space Phys. 125, e2019JA027179. doi:10.1029/2019JA027179
Pham, K. H., Tu, W., and Xiang, Z. (2017). Quantifying the precipitation loss of radiation belt electrons during a rapid dropout event. J. Geophys. Res. Space Phys. 122 (10), 287–10. doi:10.1002/2017JA024519
Reeves, G. D., Spence, H. E., Henderson, M. G., Morley, S. K., Friedel, R. H. W., Funsten, H. O., et al. (2013). Electron acceleration in the heart of the van allen radiation belts. Science 341, 991–994. doi:10.1126/science.1237743
Shue, J.-H., Song, P., Russell, C. T., Steinberg, J. T., Chao, J. K., Zastenker, G., et al. (1998). Magnetopause location under extreme solar wind conditions. J. Geophys. Res. Space Phys. 103, 17691–17700. doi:10.1029/98JA01103
Smirnov, A. G., Berrendorf, M., Shprits, Y. Y., Kronberg, E. A., Allison, H. J., Aseev, N. A., et al. (2020). Medium energy electron flux in earth’s outer radiation belt (MERLIN): a machine learning model. Space weather. 18, e2020SW002532. doi:10.1029/2020SW002532
Staples, F. A., Kellerman, A., Murphy, K. R., Rae, I. J., Sandhu, J. K., and Forsyth, C. (2022). Resolving magnetopause shadowing using multimission measurements of phase space density. J. Geophys. Res. Space Phys. 127, e2021JA029298. doi:10.1029/2021JA029298
Su, Z., Gao, Z., Zheng, H., Wang, Y., Wang, S., Spence, H. E., et al. (2017). Rapid loss of radiation belt relativistic electrons by emic waves. J. Geophys. Res. Space Phys. 122, 9880–9897. doi:10.1002/2017JA024169
Tsyganenko, N. A. (1989). A magnetospheric magnetic field model with a warped tail current sheet. Planet. Space Sci. 37, 5–20. doi:10.1016/0032-0633(89)90066-4
Tsyganenko, N. A., and Sitnov, M. I. (2005). Modeling the dynamics of the inner magnetosphere during strong geomagnetic storms. J. Geophys. Res. Space Phys. 110. doi:10.1029/2004JA010798
Turner, D. L., and Ukhorskiy, A. Y. (2020). “Chapter 1 - outer radiation belt losses by magnetopause incursions and outward radial transport: new insight and outstanding questions from the Van allen probes era,” in The dynamic loss of earth’s radiation belts. Editors A. N. Jaynes, and M. E. Usanova (Elsevier), 1–28.
Turner, D. L., Shprits, Y., and Angelopoulos, V. (2012). Explaining sudden losses of outer radiation belt electrons during geomagnetic storms. Nat. Phys. 8, 208–212. doi:10.1038/nphys2185
Turner, D. L., Angelopoulos, V., Morley, S. K., Henderson, M. G., Reeves, G. D., Li, W., et al. (2014). On the cause and extent of outer radiation belt losses during the 30 September 2012 dropout event. J. Geophys. Res. Space Phys. 119, 1530–1540. doi:10.1002/2013JA019446
Usanova, M. E., Drozdov, A., Orlova, K., Mann, I. R., Shprits, Y., Robertson, M. T., et al. (2014). Effect of emic waves on relativistic and ultrarelativistic electron populations: ground-based and van allen probes observations. Geophys. Res. Lett. 41, 1375–1381. doi:10.1002/2013GL059024
Vidal-Luengo, S. E., Blum, L. W., Bruno, A., Ficklin, A. W., de Nolfo, G., Guzik, T. G., et al. (2024). Characterization of relativistic electron precipitation events observed by the calet experiment using self-organizing-maps. J. Geophys. Res. Space Phys. 129, e2024JA032481. doi:10.1029/2024JA032481
Xiang, Z., Tu, W., Li, X., Ni, B., Morley, S. K., and Baker, D. N. (2017). Understanding the mechanisms of radiation belt dropouts observed by van allen probes. J. Geophys. Res. Space Phys. 122, 9858–9879. doi:10.1002/2017JA024487
Xiang, Z., Tu, W., Ni, B., Henderson, M. G., and Cao, X. (2018). A statistical survey of radiation belt dropouts observed by van allen probes. Geophys. Res. Lett. 45, 8035–8043. doi:10.1029/2018GL078907
Zhang, X.-J., Li, W., Thorne, R. M., Angelopoulos, V., Ma, Q., Li, J., et al. (2016). Physical mechanism causing rapid changes in ultrarelativistic electron pitch angle distributions right after a shock arrival: evaluation of an electron dropout event. J. Geophys. Res. Space Phys. 121, 8300–8316. doi:10.1002/2016JA022517
Keywords: radiation belt, radiation belt dropout, dropout, phase space density, magnetopause
Citation: Hensley AN, George H, Kalliokoski M and Olifer L (2025) Extremely rapid radiation belt electron losses across the magnetopause. Front. Astron. Space Sci. 12:1694836. doi: 10.3389/fspas.2025.1694836
Received: 28 August 2025; Accepted: 16 October 2025;
Published: 10 November 2025.
Edited by:
Larry Lyons, University of California, Los Angeles, United StatesReviewed by:
Lei Dai, Chinese Academy of Sciences (CAS), ChinaDae-Young Lee, Chungbuk National University, Republic of Korea
Copyright © 2025 Hensley, George, Kalliokoski and Olifer. This is an open-access article distributed under the terms of the Creative Commons Attribution License (CC BY). The use, distribution or reproduction in other forums is permitted, provided the original author(s) and the copyright owner(s) are credited and that the original publication in this journal is cited, in accordance with accepted academic practice. No use, distribution or reproduction is permitted which does not comply with these terms.
*Correspondence: Harriet George, aGFycmlldC5nZW9yZ2VAaXJmLnNl