 Vempalli S. Varma1†
 Ariel Shabtay2*
 Moran Yishay2†
 Itzhak Mizrahi3
 Naama Shterzer3
 Shiri Freilich4
 Shlomit Medina1,4
 Rotem Agmon2
 Yael Laor1*
- 1Newe Ya'ar Research Center, Institute of Soil, Water and Environmental Sciences, Agricultural Research Organization, Ramat Yishay, Israel
- 2Newe Ya'ar Research Center, Institute of Animal Sciences, Agricultural Research Organization, Ramat Yishay, Israel
- 3Department of Life Sciences and the National Institute for Biotechnology in the Negev, Ben-Gurion University of the Negev, Beer-Sheva, Israel
- 4Newe Ya'ar Research Center, Institute of Plant Sciences, Agricultural Research Organization, Ramat Yishay, Israel
Emissions of odorous volatile organic compounds (VOCs) from livestock manure are of increasing environmental concern. Recent approaches in cattle nutrition and health make use of Mediterranean fruit byproducts, such as concentrated pomegranate peel extract (CPE) that carry antioxidant activities, which in turn may alter manure properties. This study explored the effect of CPE on odorants emission from beef calves feces. Fourteen calves were randomly assigned to control (n = 7) and pomegranate (n = 7) treatments. The latter was supplemented with 4% CPE in milk until weaning at the age of 60 d. Following weaning, 4% CPE was added to calves ration, on dry matter basis. The control treatment received only milk or solid feed, respectively. Fresh feces of the four treatments (control/pomegranate; before/after weaning) were sampled twice, 2–3 w before and 4–5 w after weaning, and then incubated (28°C) for 0, 7, 14, and 30 d. Sub-samples were placed in a flux chamber (37°C) and VOCs collected on thermal desorption (TD) tubes followed by TD-GC-MS analysis. In all treatments, flux quantities followed the general order of volatile fatty acids (VFAs) > alcohols > phenolic & aromatic > sulfuric > esters > aldehydes. Total VOCs, especially VFA fluxes, peaked on day 7 in correspondence with pH dynamics. The fractional contribution of alcohols, phenolic & aromatic and sulfuric VOCs generally increased during incubation. After weaning, short-chain VFAs flux was 5.2 times higher and the pH was 1.26 units lower in the pomegranate treatment (average on days 7&14), suggesting increased fermentation due to possible effect of CPE on gastrointestinal microflora. An automated ribosomal intergenic spacer analysis of fresh and incubated fecal DNA confirmed association between microbial fingerprinting and short chain VFAs, phenolic and sulfuric VOCs. Odorants emission after weaning, expressed as odor activity values, was 2 times higher in the pomegranate treatment (average on days 7&14) and generally dominated by VFAs, while in other treatments the contribution of phenolic and sulfuric odors increased as incubation proceeded. In conclusion, diet supplementation with CPE may be adopted with the purpose of increasing calves health and production, but it may alter odor characteristics of feces and increase feedlot nuisance if not managed properly.
Introduction
Odor emissions from livestock farms trigger daily issues at the rural-urban interface. Livestock odor results from synergistic contribution of inorganic gases (mainly ammonia and hydrogen sulfide) and a large number of volatile organic compounds (VOCs). Sulfur and nitrogen containing VOCs, volatile fatty acids (VFAs), esters, alcohols, aldehydes, ketones, phenolic and aromatic compounds, aliphatic and halogenated hydrocarbons have all been resolved in livestock manure and barn atmosphere of swine (Schiffman et al., 2001; Sunesson et al., 2001; Cai et al., 2006; Lo et al., 2008) and dairy farms (Filipy et al., 2006; Laor et al., 2008). Sulfuric, VFAs, phenolic and aromatic VOCs are considered among the most offensive and characteristic odorants associated with livestock operations (Wright et al., 2005; Bulliner et al., 2006; Koziel et al., 2006; Laor et al., 2014; Woodbury et al., 2015; Yuan et al., 2017).
Diet formulation in combination with manure management have a principal effect on odor formation. Odorous compounds are mainly generated by microbial conversion of non-utilized dietary nutrients and endogenous products secreted in the gastrointestinal tract under anaerobic conditions (Le et al., 2005). Adjustment of feed ingredients would potentially affect manure odor through more efficient use of nutrients supplied, more nearly meeting animal requirements without providing excess nutrients, changes in fermentation patterns within the animal, or changes in post-excretion decomposition patterns. As odorous compounds are formed or decomposed during manure storage, diet manipulations are expected to affect not only the composition of fresh manure but also the formation of odorants during its storage (Yasuhara et al., 1984; Powers, 1998; Gralapp et al., 2002; Le et al., 2005). Sutton et al. (1999) suggested that the primary odor causing compounds in swine manure are evolved with an excess of degradable proteins and due to lack of specific fermentable carbohydrates during microbial fermentation. Previous studies on swine diet reported decrease in nitrogen excretion upon reducing the amount of dietary proteins (Kerr, 1995; Hobbs et al., 1999; Zervas and Zijlstra, 2002). Studies on cattle manure showed the production of VFAs as a major product of starch fermentation in fresh and aged manure (Miller and Varel, 2001; Archibeque et al., 2005; Miller et al., 2006). Shabtay et al. (2009) showed distinct changes in VOC emissions from fresh and aged feces related to calves' development. At age of 7 weeks, a week before calves weaning, feces seemed to be the most offensive, presumably due to partial dietary switch from milk to solid feed that is taking place at this stage and not fully synchronized with the metabolic development of the rumen, hence, hampering the balance between animal's requirements and diet formulation.
In recent years, a growing awareness of the beneficial effects of pomegranate consumption in the human diet (Aviram et al., 2004) has triggered the development of additional industrial pomegranate products. This, in turn, has led researchers to investigate the effects of pomegranate industrial byproducts (i.e., peels) on ruminant health and production (Shabtay et al., 2008, 2012; Oliveira et al., 2010; Jami et al., 2012; Weyl-Feinstein et al., 2014). This recent interest arises from the need to explore alternative feed sources in order to supply cattle with an available and affordable ration, in light of global and local economic processes and prolonged drought periods. Moreover, pomegranate peel attracts attention especially due to its antioxidative capacities (Tzulker et al., 2007), which has often been associated with a decreased risk of various diseases and mortality. To this end, a commercial and standardized product, concentrated pomegranate peel extract (CPE), has been developed by Gan Shmuel Food Ltd. (Kibbutz Gan-Shmuel, Israel). The final CPE is standardized to ensure a uniform and constant dry matter content, and is available year round for feeding ruminants. Supplementing milk with 3.75% CPE to neonatal Holstein calves (Holstein male calves reared for meat) reduced fecal oocyst count of the intestine parasite Criptosporidium parvum and diarrhea intensity and duration with no deleterious effect on average daily gain (ADG) (Weyl-Feinstein et al., 2014). In another study, supplementing lactating cows with 4% CPE significantly increased digestibility of dry matter (DM), protein, and neutral detergent fiber, as well as milk and energy-corrected milk yields (Jami et al., 2012).
Besides its beneficial effects on ruminants' health and production (Shabtay et al., 2008, 2012; Weyl-Feinstein et al., 2014) dietary CPE was shown to significantly affect rumen bacterial communities (Jami et al., 2012). Thus, we hypothesized that CPE may also influence feces properties with consequences on odor emissions from the cattle feedlot. To address this assumption, the current study explores the effect of CPE introduced into calves' diet on odorants emission from fresh and incubated calves' feces before and after weaning. In Israel, beef cattle feedlots differ in size; housing from 50 to 100 and up to several hundred calves at a time. Being a relatively densely populated country, these feedlots may be located in close proximity to urban areas and thus odor emissions are of daily concern.
Materials and Methods
Calves' Husbandry and Nutrition
This study took place during 2012 at the research beef cattle feedlot in Newe Ya'ar Research Center of the Agricultural Research Organization (northern Israel). All procedures involving animals were approved by the Israeli committee for animal care and experimentation (AEEC—Animal Experimentation Ethics Committee—Volcani center). Fourteen Holstein calves (young horned Holstein bull calves, not castrated; Holstein male calves reared for meat) were randomly assigned to control (n = 7) and pomegranate (n = 7) treatments. Calves were born at Yagur dairy farm and fed pooled cow colostrum milk from the day of calving up to 3 days. At the age of 3 days calves were transferred (20 km distance) to a shaded nursing barn in Newe Ya'ar and housed in two adjacent pens, one for each treatment, until weaning at the age of 60 days. During this period calves of both treatments were bottle fed with 150 g of milk replacer “Halavit Platina” (23% protein, 18% fat; Koffolk, Phibro, Maabarot, Israel) mixed in 1 L of water twice daily, and supplemented with 4% CPE for the pomegranate treatment. In addition, calves were offered ad libitum suckling starter (cat# 7820, Milobar), containing 17% protein, 3% fat, 7% crude fiber, 7% ash, 1% Ca, 0.4% P, and 0.7% NaCl, on a DM basis and had free access to fresh water. Ten days before weaning, the CPE was supplemented only once a day with milk and the additional amount was poured on top of the suckling starter. After weaning, suckling starter was exclusively served ad libitum for an additional 2 months, on top of which the pomegranate treatment were supplemented with 4% CPE, on DM basis. The CPE of the “Wonderful” cultivar was supplied by Gan Shmuel Food Ltd. (Gan-Shmuel, Israel). It was made by chopping up the pomegranate parts remaining after pomegranate juice production, including peels and residual arils, followed by extraction in water, filtering, evaporation procedures and pasteurization; the final extract was standardized to ensure uniform and constant DM content (Shabtay et al., 2012). Nutritional and chemical values of CPE were (DM = 45%; other properties are expressed as percent of DM): crude protein (CP) = 2%, ash = 5%, total polyphenols (expressed as gallic acid equivalent) = 10%, total punicalagins = 3.3%, ellagic acid = 0.2%, and pH = 3.2. The CPE contained 0.75 g L−1 of sorbate as a preservative and was kept refrigerated at 4°C.
Average daily weight gain (ADG) was based on two body weight measurements, once upon arrival to Newe Ya'ar (age of ca. 3 days) and again about 2 months after weaning (age of ca. 4 months).
Feces Sampling and Incubation
The experimental protocol is described in Figure 1A. Fresh feces was sampled following a rectal massage, 2–3 weeks before and 4–5 weeks after weaning. Each sampling period extended over 1 week, during which the fecal samples of each calf were collected separately and immediately stored at −20°C. Then, the weekly pool collected from each calf was brought to room temperature, hand-mixed thoroughly, and divided into four 200-mL dark glass jars (5 cm dimeter × 10 cm height). One jar was immediately placed at −80°C (“day 0”) and the three other jars (sub-samples) were incubated at 28°C for 7, 14, and 30 days. This incubation temperature represents average daily summer temperatures during July-August in the Newe Ya'ar region (Israel Meteorological Service, 2018). To avoid spillage during incubation (the manure was inflated due to gas formation), the jars were extended up by a “sleeve” and then loosely closed with a cap, all made by folded aluminum foil. Since the jars were not aerated actively, it presumably possessed both aerobic and anaerobic conditions, as also expected at the feedlot. Moisture content was measured on a weekly basis during incubation by drying sub samples at 60°C for 24 h and adjusting the whole samples to their initial moisture with deionized water.
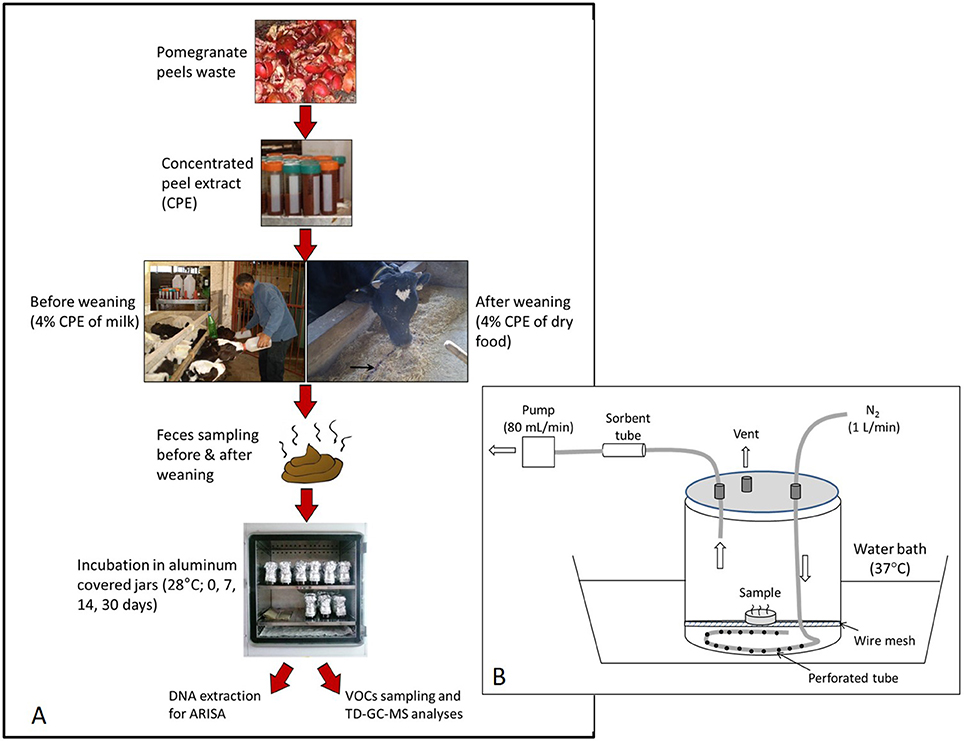
Figure 1. The experimental scheme (A) and the flux chamber used to collect VOC emissions (B). A 20 ml feces sample was placed inside an open 7-cm diameter Petri dish located inside a 9-L flux chamber. Inflow of N2 was set at 1 L min−1 while the VOCs were collected onto a sorbent tube at a rate of 80 mL min−1 during a period of 10 min.
The pH was measured directly in the fresh feces on day 0 and then by the end of each incubation period, before transferring the sample to −80°C (mobile ISFET pH meter IQ 150-77; IQ Scientific Instruments, Loveland, CO, equipped with a dry, non-glass probe; PH77-SS; IQ Scientific Instruments). Nitrogen, starch, and water soluble sugars were analyzed in fresh feces only: Total N content was determined according to method 984.13 of AOAC (1990). Crude protein was calculated as N × 6.25. Water soluble reducing sugars and starch contents were determined by Siap Laboratory (Bet Gamliel, Israel). Water soluble sugars were determined according to Miller (1959) using hydrolyzed sucrose as a standard. Starch contents in food samples (milk powder and dry food) and in fresh feces were determined using an alpha amylase assay after Pinchasov and Noy (1994), modified from Bernfeld (1955). Final starch values were obtained after subtracting the corresponding water soluble sugar values. The starch content in the milk powder was determined from the difference before and after chemical hydrolysis of the powder. Starch digestibility (Sdigest) was calculated from starch and N data, after Zinn et al. (2007) using Equation (1).
Where FN is fecal nitrogen, FS is fecal starch and DS is diet starch; all are represented as percentages of DM.
VOCs Sampling and Analyses by GC-MS With Thermal Desorption
Before analysis, each specific glass jar was first transferred (remained closed) from −80° to 4°C for a period of 24–48 h (freezing was assumed not to alter short-term VOC emissions from thawed samples based on Miller and Woodbury (2006) and Shabtay et al. (2009). Jars were then transferred to a water bath at 37°C for 1 h and finally opened and mixed thoroughly. About 20 ml of feces was transferred into an open 7-cm diameter Petri dish which was placed in a flow-through flux chamber, composed of 9-L vessel that was laid within a water bath at 37°C (Figure 1B). This temperature represents maximum daily summer temperatures during July-August in the Newe Ya'ar region (Israel Meteorological Service, 2018) and selected to simulate potential peak emissions during summer.
Prior to sampling, the chamber was flushed with nitrogen at 1 L min−1 for a period of 27 min (three chamber volumes), thereafter sampling started under the same flow conditions. Air samples were collected onto sorbent tubes (Markes, Stainless Steel, 3 1/2″ × 1/4″, 2 sorbents - Tenax TA & Carbograph 1TD), using a pocket pump (SKC210; SKC, 84, PA) set at 80 mL min−1 for 10 min. Excess outflow was released through a venting port. Replicates were obtained by repeating this procedure for another feces subsample and the GC/MS results of duplicate tubes were averaged. Loaded sorbent tubes were analyzed using thermal desorption-gas chromatography-mass spectrometry (TD-GC-MS). The TD system consisted of a Markes UNITY 2™ thermal desorber (Markes International Ltd., Llantrisant, UK). Samples were quantified with an Agilent 7890A GC with Agilent 5975C MS detector (Agilent Technologies, Inc., Santa Clara, CA, USA). The tube was desorbed for 5 min at 280°C with a carrier gas flow of 30 mL min−1 and trapped on the cold trap maintained at 20°C (graphitized carbon trap used for sampling VOCs of C4/5 to C30/32). The cold trap was heated to 300°C for 3 min with a carrier gas flow of 20 mL min−1 and was transferred to the column in the GC-MS. The general run parameters used were as follows: injector, 230°C; column oven, 45°C initial temperature for 5 min, followed by a ramp of 4°C/min to 150°C, and 10°C/min to 230°C final, and 5-min hold with a total run time of 43.25 min; carrier gas, He; mass spectrometer ionization energy, 70 eV; m/z, 41 to 300; scan time, 5.4/s. The polar analytical column was an Agilent Innowax, 30 m, 0.25 mm ID capillary column (polyethylene glycol, 0.25 μm film thickness).
Determination of VOC Fluxes
Compounds present in feces emissions were identified using two criteria: (1) matching of observed retention times with those of pure compounds run as standards; (2) matching mass spectrums of unknown compounds using ChemStation (version D.00.00.38) from Agilent and Wiley7N spectral library (if no standard existed, identifications were arbitrarily made for matching quality ≥70%). Under the analytical conditions used, peak areas greater than ~3,000 counts were considered effective to resolve. Therefore, resolved compounds which were found with peak areas greater than 3,500 were utilized for data analysis. Overall, 60 compounds were resolved; out of which we decided to follow 34 dominant or known odorous compounds, categorized into six groups (Table S1): (i) VFAs (12 compounds: acetic acid, propanoic acid, 2-methyl propanoic acid, butanoic acid, 3-methyl butanoic acid, pentanoic acid, 4-methyl pentanoic acid, hexanoic acid, heptanoic acid, octanoic acid, nonanoic acid and decanoic acid); (ii) Esters (2 compounds: ethyl hexanoate and hexyl hexanoate); (iii) Alcohols (10 compounds: sec-Butyl alcohol, iso-Butyl alcohol, n-Butanol, iso-Pentyl alcohol, 1-Pentanol, 1-Hexanol, 1-Heptanol, 2-Ethyl-1-hexanol, 2-phenyl ethanol, 3-Phenyl-1-propanol; (iv) Phenolic & Aromatic (5 compounds: phenol, p-cresol, indole, skatole and p-xylene); (v) Aldehydes (3 compounds: octanal, nonanal and decanal); and (vi) Sulfuric (2 compounds: dimethyl disulfide and dimethyl trisulfide).
For calibration, analytical grade standard solutions were prepared ranging in concentrations from 2.5 to 30 ng and up to 250–3,500 ng mL−1 by diluting known masses of pure chemicals with methanol. Each cocktail of calibration analytes (1–3 μl) was injected using a GC syringe onto clean sorbent tubes connected to a calibration solution loading rig (CSLR, Markes International Ltd., Llantrisant, UK) at nitrogen flow of 80 mL min−1. All standard loaded tubes were prepared in duplicates and results were averaged. The loaded tubes were analyzed under the same conditions as used for the other samples. Standard curves of peak area counts vs. VOC mass (ng) were fitted using both linear and power regression analyses; both yielding high regression coefficients (R2 ≥ 0.98 in most cases). However, a power regression generally yielded slightly higher R2-values and was thus used for the present study. For compounds of which we did not have pure standards, we used the average regression parameters of the respective VOCs group (Table S1).
The flux, J (μg m−2 min−1), of specific or group of VOCs was calculated using Equation (2).
Where Q is the flushing inflow (m3 min−1), C is the VOC concentration in the flushing air (μg m−3) and A is the surface area of the feces inside the Petri dish (m2). The concentration, C, was calculated from the mass of VOCs (based on calibration curves) and the volume of air sample loaded onto the tube.
Odor Activity Values (OAV)
A single-compound odor threshold (SCOT) is defined as the lowest concentration of a single compound in air that can be detected by the human olfactory sense when compared to a non-odorous sample and is comparable to odor detection threshold or dilution-to-threshold, DT (Parker et al., 2010; Laor et al., 2014). The SCOT values used in this study are the calculated geometric means of listed values found in the comprehensive review of van Gemert (2003), as used by Parker et al. (2012). The OAV (dimensionless) was calculated for each individual VOC using Equation (3).
Where C is the VOC concentration in the flushing air (μg m−3) as used for Equation (2), and SCOT is the geometric mean odor detection threshold of that individual compound (μg m−3).
DNA Extraction and Automated Ribosomal Intergenic Spacer Analysis (ARISA)
Fresh and incubated feces samples used to analyze VOCs also underwent DNA extraction and microbial fingerprinting by means of automated ribosomal intergenic spacer analysis (ARISA). For each sample, about 0.5 g was transferred into an Eppendorf tube and stored at −20°C. Before extraction, the samples were brought to room temperature and extracted using QIAmp DNA Stool Mini Kit (QIAGEN GmbH, D-40724 Hilden, Germany). DNA concertation was determined by Nanodrop (NanoDrop Technologies, Montchanin, DE, USA; ND-1000 V3.3.1 software) and ca. 10 ng μL−1 was taken for the ARISA.
Two technical replicates of DNA from each sample were subjected to PCR amplification for ARISA (Fisher and Triplett, 1999), using the primers ITSF (5′-GTCGTAACAAGGTAGCCGTA-3′) and ITSRtet (5′-GCCAAGGCATCCAAC-3′), fluorescently labeled with TET, as described previously (Welkie et al., 2010). The ARISA PCRs were carried out in 15 μL volumes containing Fermentas DreamTaq Master Mix (Fermentas, Madison, WI), 0.33 μM of each primer and 20 ng of template DNA. The PCR conditions were: 94°C for 2 min followed by 30 cycles of 94°C for 1 min, 55°C for 60 s, and 72°C for 120 s, and finally one cycle of 72°C for 5 min. The ARISA PCR products were analyzed using an ABI PRISM 3,100 Genetic Analyzer (Applied Biosystems Inc., Carlsbad, CA) along with a custom-made ROX-labeled 250- to 1,150-bp standard (BioVentures Inc., Murfreesboro, TN). Raw data generated were initially analyzed using GeneMarker software (SoftGenetics LLC, State College, PA) according to Kovacs et al. (2010). After performing accurate size calling using the program, all data were exported to Microsoft Excel for further analysis. All operational taxonomic units (OTUs) with fluorescence intensity of ≤10 relative fluorescence units were excluded. The remaining OTUs were binned as described by Brown et al. (2005) with the following parameters: bins of 3 bp (±1 bp) for fragments <700 bp in length, bins of 5 bp for fragments ≥700 and ≤1,000 bp in length, and bins of 10 bp for fragments >1,000 bp. Intensities were then summed for each bin. Relative intensities for each binned OTU in a given sample were calculated and OTUs that constituted less than 0.1% of the total intensity of the sample were excluded.
Statistical Analyses
For general feces properties, the significance of differences between treatments were analyzed by the Tukey-Kramer HSD test at P ≤ 0.05. In certain cases, specific P-values are reported for t-tests or a regression analysis coefficient. For all VOCs (log-transformed emission values), the significance of the overall effect of treatment and incubation time was analyzed by the standard least squares fit model and compared by Tukey-Kramer HSD test at P ≤ 0.05 (JMP software, SAS Institute Inc., Cary, NC). Spearman's rhos correlation coefficients between the distribution patterns of microbial OTUs obtained by ARISA and emission profiles of all 34 VOCs were calculated using cor.test function and plotted using heatmap 0.3 function in R.
Results
Calf Performance, Fresh Feces Characteristics and pH Dynamics During Incubation
The average daily gain, calculated from calving to 4 months of age, was not affected by the dietary supplementation of CPE; ADG of the control treatment (1.08 ± 0.15 kg day−1) (±standard deviation) did not differ from that of the pomegranate treatment (1.10 ± 0.11 kg day−1; P = 0.86). Selected properties of the fresh feces, before and after weaning, are summarized in Table 1. Fecal DM did not differ between control and pomegranate treatments before or after weaning. It is noteworthy, however, that the lowest DM value was obtained in the pomegranate treatment after weaning (PA), and it differed significantly only from DM of the pomegranate treatment before weaning (PB). The PA treatment was also characterized by the lowest pH, which differed significantly only from the control treatment before weaning (CB). Organic matter (OM), protein and water soluble sugars contents did not differ among the treatments. Starch content was significantly higher in the PA compared to CA and PB, but comparable to CB. Starch digestibility was compared between PA and CA treatments, using an equation designed for non-suckling calves (Equation 1; Zinn et al., 2007), revealing 7.3% lower values for the PA treatment (89.0% for CA vs. 81.7% for PA; P = 0.001). Interestingly, based on comparison of fecal starch content of the suckling treatments (for which Equation 1 is considered less relevant), it can be assumed that the effect of CPE on starch digestibility had an opposite trend, as values tended to be higher in the CB treatment (P = 0.07; Table 1).
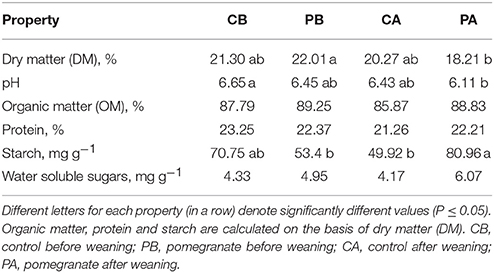
Table 1. Selected properties of fresh feces collected before and after weaning (day 0, before incubation).
The dynamics of feces pH during incubation are presented in Figure 2. The pH of the fresh feces (day 0) decreased after 1 week of incubation in three out of the four treatments. The pH of the PA treatment, which initially was the lowest among all other treatments, decreased most substantially on day 7 (pH = 4.77) and then increased gradually to reach a value of 6.40. While similar but less intense trends were observed also in the PB and CA treatments, the dynamics of the CB treatment was relatively stable.

Figure 2. Dynamics of feces pH during incubation.
VOC Emissions From Fresh and Incubated Feces
Table 2 and Tables S2, S3 summarize the average emission values of 34 VOCs on days 0, 7, 14, and 30 for the four treatments, either separately or summed in VOC groups; compound concentrations (μg m−3) and fluxes (μg m−2 min−1) are defined in Equation (2). The statistical significance of treatment and incubation time effects are summarized in Table 3. Out of the 34 VOCs, the dynamics of 6 selected compounds are plotted in Figure 3. In almost all cases, the fluxes of VOCs were lower on day 0 (significant in 18 out of 34 VOCs; Table 3), increased during incubation (days 7 and 14) and reduced thereafter. The effect of CPE diet was substantial on the emissions of short chain VFAs. The dynamics of propanoic and butanoic acids represent that pattern (Figures 3A,B), in which the flux was significantly the highest in the PA treatment and peaked on day 7 during incubation (the average total flux of acetic, propanoic and butanoic acids on days 7 and 14 was 5.2 times higher in the pomegranate treatment). On the other hand, CPE diet significantly reduced the emissions of sulfuric VOCs after weaning; dimethyl disulfide (Figure 3C) was 30.4 times lower in PA vs. CA on day 7. Similar effects after weaning were observed for p-cresol, for which the flux was 5.01 times lower in PA vs. CA on day 14 (Figure 3D) and skatole, for which the flux was 330 times lower in PA vs. CA on day 14 (Table 2). The CPE diet did not have a significant effect on most alcohol emissions; yet, n-butanol was significantly higher in PB vs. CB, mainly on day 30; Table 3).
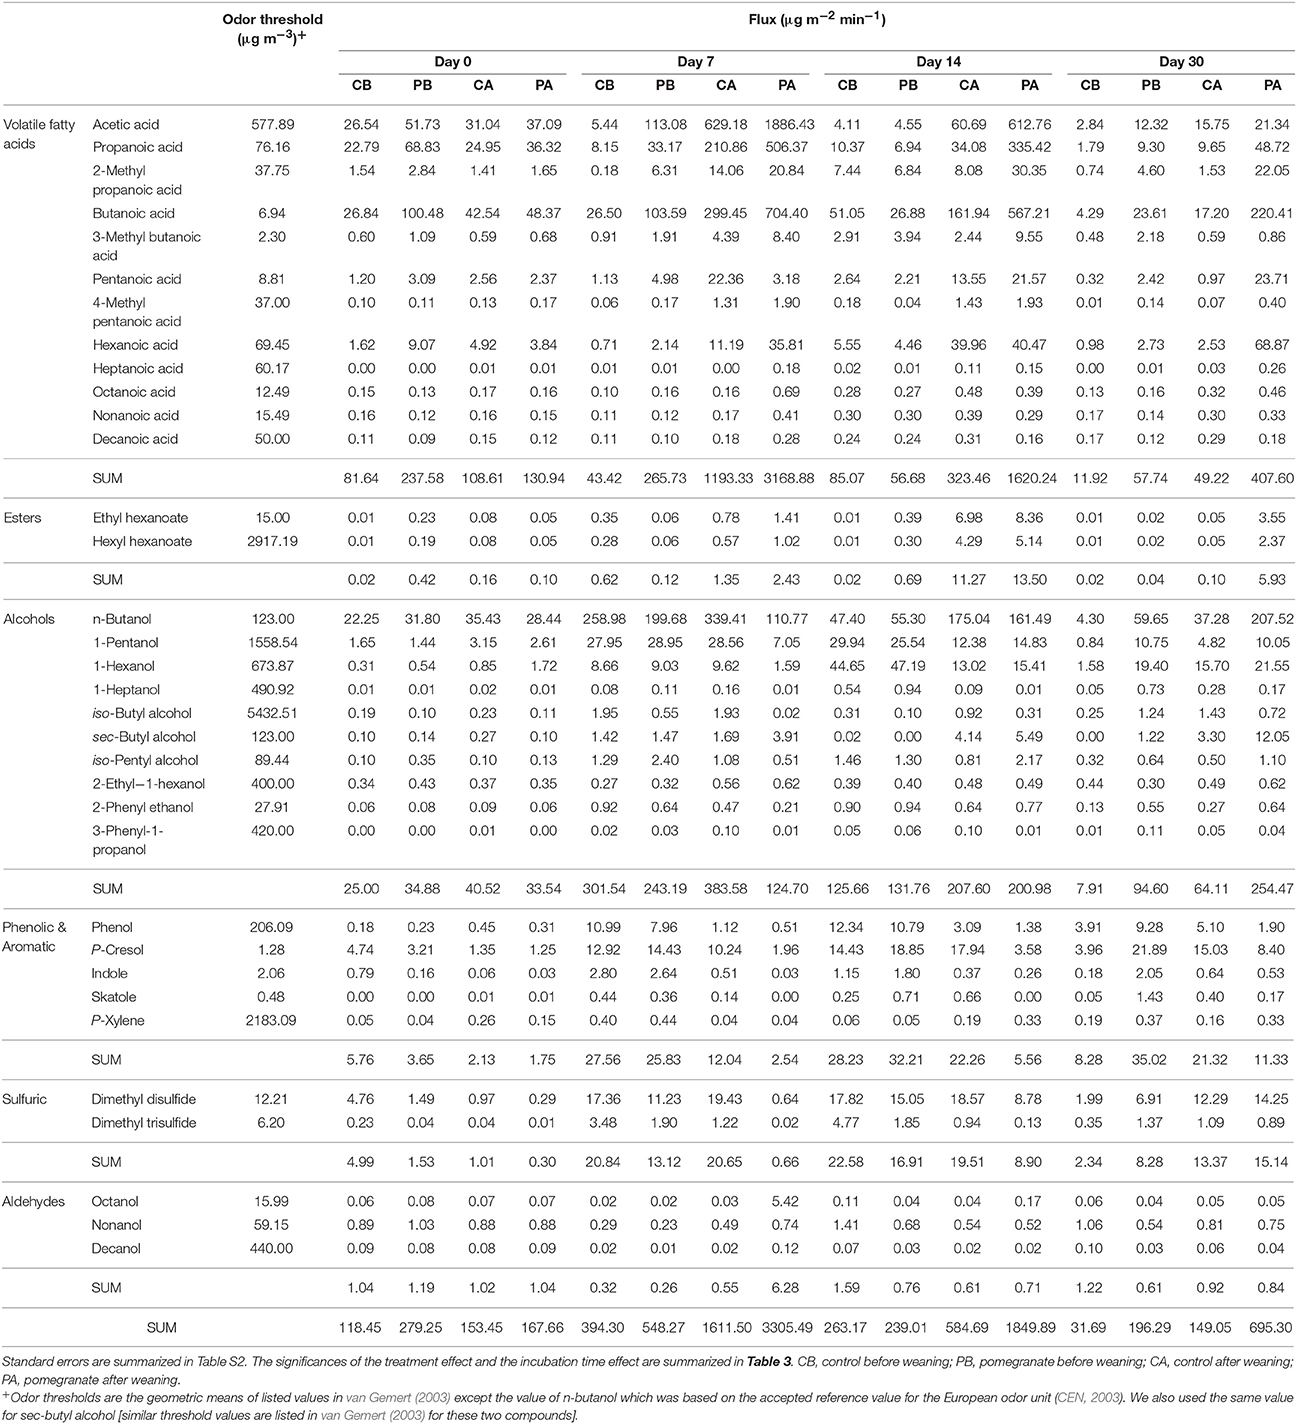
Table 2. Summary of VOC fluxes on days 0, 7, 14, and 30.
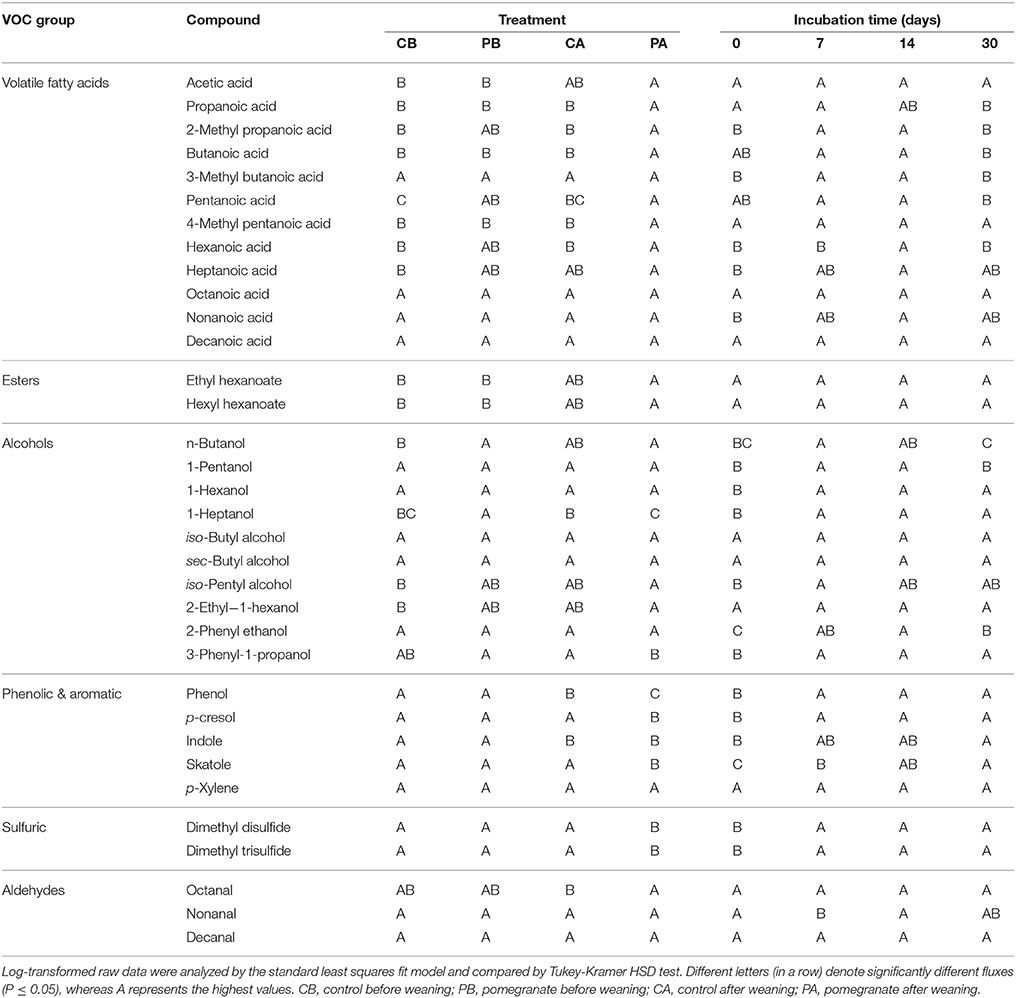
Table 3. The significances of the treatment effect and the incubation time effect on VOC Fluxes.
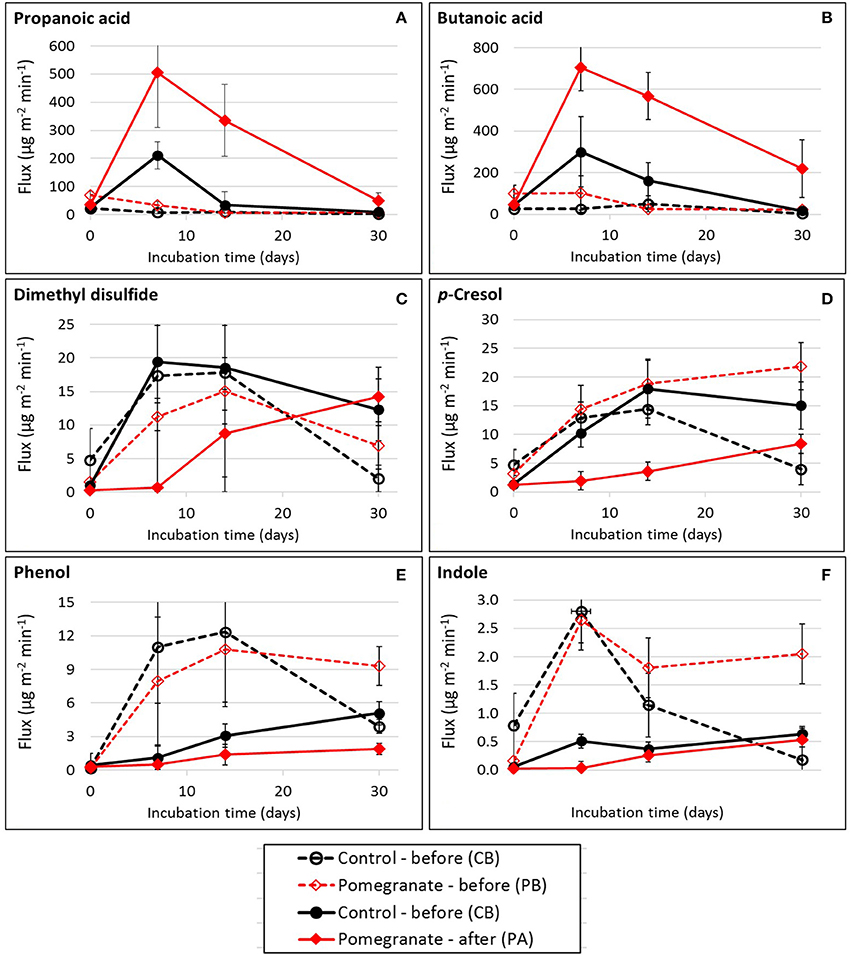
Figure 3. Flux dynamics of selected VOCs during feces incubation: (A) Propanoic acid; (B) Butanoic acid; (C) Dimethyl disulfide; (D) p-Cresol; (E) Phenol; (F) Indole. Each datapoint represents the average and standard error of specific treatment in each incubation time.
The effect of weaning on VOC fluxes is demonstrated by the dynamics of phenol (Figure 3E) and indole (Figure 3F) which were similar in the control and pomegranate treatments, but were significantly higher before weaning. On day 7, fluxes were 11.6 and 10.1 higher before than after weaning, for phenol and indole, respectively (average of CB and PB vs. CA and PA).
Figure 4 represents the dynamics of VOC fluxes and odor activity values (OAV), based on the categorized VOC groups. Flux quantities followed the general order of VFAs > alcohols > phenolic & aromatic > sulfuric > esters > aldehydes (Figures 4A,A-1). Overall, VFAs contributed 69–85% of the total fluxes on day 0, and increased up to 96% on day 7 in the PA treatment. Alcohols were the second group contributing to the total fluxes (with n-butanol being a major compound), and it increased during incubation with no clear reduction over the entire incubation period. Thus, together with VFAs and regardless of treatment and incubation time, these two groups were most dominant and contributed from 63 to nearly 100% of the total fluxes. The contribution of these two groups was nearly 100% on day 7 in the PA treatment. Notably, although alcohol fluxes did not differ significantly between treatments, n-butanol was the most dominant alcoholic compound in all treatments at the beginning of incubation. Then, on day 14, the dominance of 1-pentanol and 1-hexanol became similar to that of n-butanol.
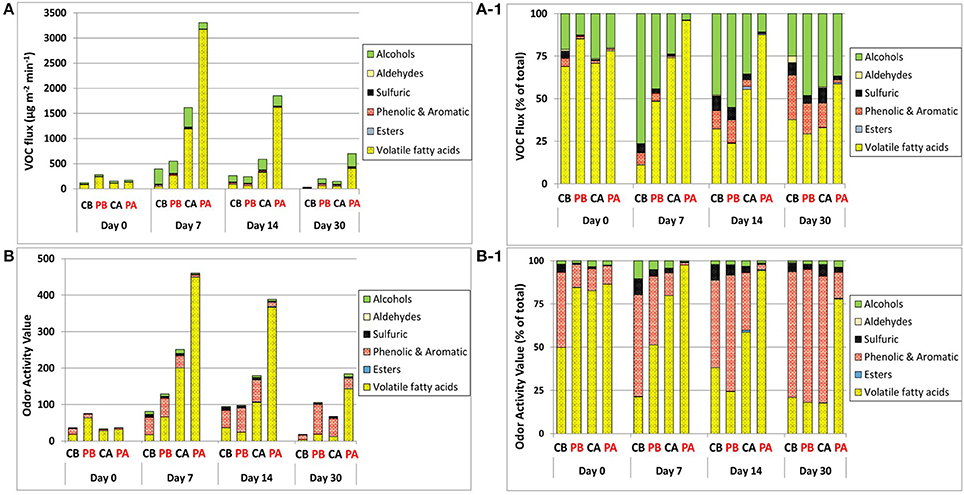
Figure 4. Flux dynamics of VOC groups (A,A-1) and related OAVs (B,B-1) during feces incubation. Emissions are represented by absolute fluxes (A,B) and fractional contribution of each VOCs group (A1,B1). CB, control before weaning; PB, pomegranate before weaning; CA, control after weaning; PA, pomegranate after weaning.
Phenolic & aromatic VOCs were the third group to contribute to the total fluxes with increased contribution as incubation proceeded, especially in the control treatment. This group together with VFAs and alcohols contributed from 88% to nearly 100% of the total fluxes. Sulfuric compounds were the fourth group, contributing from nearly 0–9% of the total emissions. Its fractional contribution to the total fluxes generally increased as incubation proceeded, especially in the control treatment, and was generally higher before weaning.
The impact of VOC fluxes on potential odor emissions is illustrated in Figures 4B,B-1, through the dynamics of OAVs. The contribution of VFAs to OAVs revealed similar pattern as the contribution of VFAs to the total fluxes. However, alcohols which was the second group to contribute to the total fluxes, was of minor importance in terms of OAV; instead, the phenolic & aromatic group became highly dominant due to the much lower SCOT values associated with the VOCs in this group. Thus, the contribution of VFAs and phenolic & aromatic VOCs to the total OAV accounted for over 90% in almost all cases and ranged up to 99%. The contribution of phenolic & aromatic VOCs to the total OAV became more dominant as incubation proceeded and was more pronounced in the control treatment, whereas the OAVs derived from VFAs remained more dominant in the pomegranate treatment group, especially after weaning. The fractional contribution of sulfuric VOCs to the total OAV was generally higher in the control vs. pomegranate treatments. Like the total sulfuric fluxes, it also generally increased as incubation proceeded until day 14, and was generally higher before weaning.
Correlating VOC Emission Profiles and Microbial OTUs Abundance Patterns
Figure 5 shows the correlation matrix between the emission profiles of the 34 VOCs monitored in this study and the distribution patterns of microbial OTUs obtained by ARISA. Pairwise correlation values between each VOC-OTU combinations were determined according to profile similarity across parallel feces sub-samples including all treatment and incubation times. A reverse pattern of correlation can be observed between certain VOC groups: whereas VFAs, esters and aldehydes are typically positively correlated with a relatively large group of OTUs (right), phenolic & aromatic (phenol, skatole, indole, p-cresol) and sulfuric VOCs are typically negatively correlated with distribution patterns of most OTUs. A small group of OTUs (left) shows a reverse pattern of correlation in comparison to most OTUs (right), with positive correlation with phenolic and sulfuric VOCs but negative correlation with VFAs, esters and aldehydes. Alcoholic compounds are distributed between these two major categories, with n-butanol, iso-pentyl alcohol and 1-pentanol typically positively correlated but other alcohols (iso-Butyl alcohol, 1-hexanol, 1-heptanol 2-phenylethanol, 3-phenyl-1-propanol) typically negatively correlated with most OTU groups. VFAs generally cluster together (except for long chains VFAs; nonanoic and decanoic acids) with close relation to esters and some alcohols. Other VOC groups also cluster together (aldehydes, phenolic, and sulfuric).
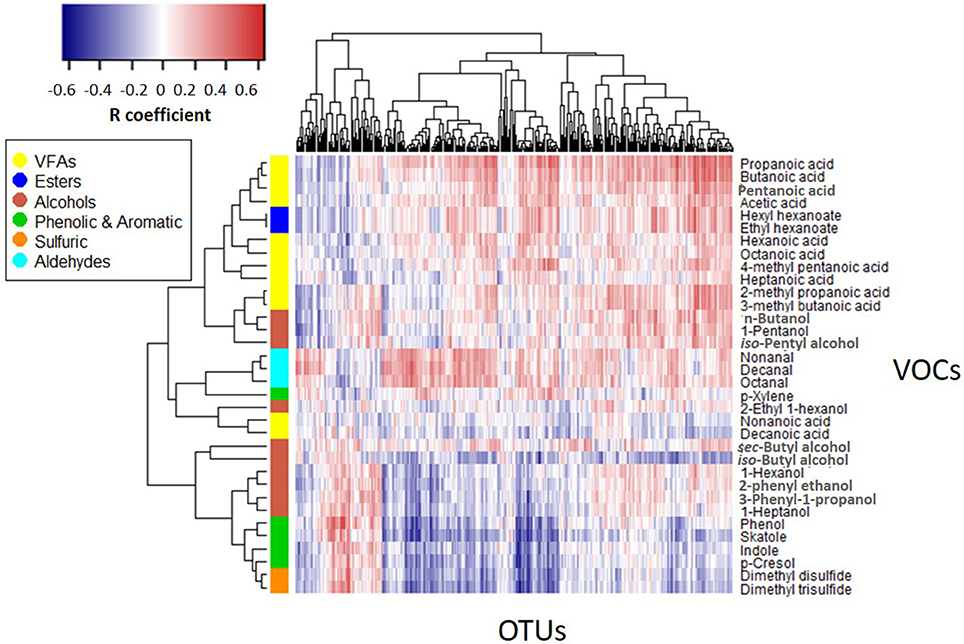
Figure 5. VOCs vs. OTUs correlation matrix (Spearman's rho coefficient). The heatmap displays correlation values between the emission flux values of 34 VOCs measured in all 4 treatments vs. distribution patterns of 345 OTUs recorded under the same conditions.
Discussion
The effect of feed additives on growth success of beef cattle calves is primarily estimated by their average daily gain (ADG). Due to the relatively high polyphenol content of pomegranate peel, their undesired effects on animal performance cannot be excluded, when supplemented in the diet. However, in previous studies (Shabtay et al., 2008; Weyl-Feinstein et al., 2014), we did not observe deleterious effects of either fresh pomegranate peel or CPE on fattened and suckling calves growth rate, respectively. In accordance with these previous observations, the CPE in the present study also did not show any negative effect on ADG. Among the various properties tested in fresh fecal samples, OM content, protein, and water soluble sugars did not differ between treatments. Protein is the most expensive component in the diet. While nitrogen is a key element in ruminants diet, its excretion receives increasing attention due to environmental concerns (Islam et al., 2002). Accurate design of protein requirement is thus cardinal for ensuring the balance between an appropriate supply of the assortments of amino acids essential for growth and maintenance, minimizing diet cost and reducing excretion of excess nitrogen. The findings reported herein imply that CPE had no effect on calves' performance.
Yet, fecal starch content, which was proved as an accurate indicator of total-tract digestibility of starch by feedlot cattle (Zinn et al., 2002; Corona et al., 2005), was significantly higher in the PA as compared with the other three treatments. Interestingly, while at the post-weaning stage fecal starch content was significantly higher in the PA treatment, at the suckling stage it tended to be higher in the CB treatment, indicating that CPE might have a development-related effect on the efficiency of dietary starch digestion. Indeed, although anatomically ruminant neonates possess the same four stomachs as an adult, their digestive metabolic systems function similarly to those of a young monogastric animal, and the rumen becomes metabolically active only at later age, upon consumption of solid feeds (Teagasc, 2017). We thus hypothesize that while CPE facilitates starch digestion from milk at the hindgut, at the suckling stage, it hampers its fermentation in the rumen at the post-weaning stage, presumably due to modulation of rumen microbe population (Jami et al., 2012) which may promote starch to bypass the rumen.
Starch digestibility is a wide-studied theme since it has economic implications due to the high cost of grains and as it can increase production yield and feed efficiency (Firkins et al., 2001). In dairy cows total-tract digestibility of starch ranges from 70 to 100% (Firkins et al., 2001; Ferraretto et al., 2013). The distribution of fecal starch observed in collective studies from 15 trials conducted at the University of Wisconsin-Madison revealed fecal starch that averaged 3% across all trials, with 60 and 36% of the fecal samples ranging from 0 to 3% and from 4 to 8% starch, respectively (Fredin et al., 2014). These results are in agreement with the findings obtained in the current study (Table 1).
A linear negative correlation was obtained in the current study between fecal starch concentration and fecal pH (R = −0.539; P = 0.0037); however, the published literature is inconsistent with regard to this relationship. Unlike studies that reported a negative relationship between fecal starch and fecal pH in calves (current study), steers, sheep and growing heifers (Wheeler and Noller, 1976, 1977), other studies have observed either weak or no relationship (Fredin et al., 2014). Fecal pH may be affected by numerous factors other than starch, mostly related to dietary forage concentration and buffer capacity of feed (Erdman et al., 1982; Gressley et al., 2011). These factors were not examined in the present study, however, it is noteworthy that fecal pH, observed herein, obeyed the accepted trend in growing beef calves to decrease with age (Shabtay et al., 2009). Yet, the slightly but significantly lower fecal pH after weaning in the PA treatment, may indicate some effects on ruminal (Jami et al., 2012) and/or post-ruminal microbial fermentation (Gressley et al., 2011).
The dynamics of pH during incubation (Figure 2) is presumably affected by the evolution of VFAs and ammonia throughout feces degradation and it was in accordance with the dynamics observed for VFAs. Peak production of VFAs was associated with pH decrease, especially in the PA and to less extent in CA and PB groups (Figures 3A,B and Table 2). Similar pH dynamics have also been observed in composting studies of livestock manure, whereas the initial drop reflected the production of organic acids and then increase in pH indicated their degradation and the release of ammonia during mineralization of proteins, peptides and amino acid (Atchley and Clark, 1979; Gigliotti et al., 2012; Kim et al., 2016). Ammonia was not measured in the present study, but was likely involved in this pH dynamics. Miller and Varel (2001) who studied the composition of fresh and aged cattle manure suggested that the accumulation of acid products is self-limiting, as low pH inhibits fermentation; they found that production of VFAs from fresh manure was inhibited when the pH fell below 4.5. In the present study, since the pH dropped only to a minimum of 4.77 it did not necessarily inhibit further VFAs production, unless feces samples had reached lower pH, which was not recorded between days 0 and 7.
The production of VFAs as well as other typical anaerobic fermentation byproducts (such as phenolic and sulfuric VOCs) indicates the presence of anaerobic or semi-anaerobic conditions during incubation. Although incubation was not carried out in sealed vessels, it can be assumed that non-optimal aerobic conditions prevailed within the jars, which were aerated only passively through the loosely covering aluminum foil cap. Moreover, previous studies showed that anaerobic byproducts were formed even in actively aerated waste systems (Brinton, 1998, 2006; Beck-Friis et al., 2003; Wu et al., 2010). It was noted by Brinton (2006) that microorganisms producing VFAs under semi-anaerobic conditions are facultative microorganisms and hence, events of oxygen replenishment will not necessarily disturb their presence; moreover, VFAs produced serve as an energy source for consequent aerobic microbial activity, once favorable aerobic conditions return. Depending on aerobic degradation rates (and hence oxygen utilization rate), it was shown that oxygen diffusion is limited to a range of several hundred micrometers around manure particles and thus a substantial portion remains anaerobic even in well aerated systems (Wang et al., 2015). The peak of VFAs shown in the present work is related to the most active degradation phase during which it is most difficult to sufficiently maintain aerobic conditions within aggregates and micro-environments. Then, when degradation rates slow down as the most energetic material is being consumed, the material undergoes mostly aerobic processes and thus VFAs production stops. Our previous study on calve's feces (Shabtay et al., 2009) also showed the production of anaerobic byproducts, both under aerobic and anaerobic systems (VFAs, sulfuric, phenols, and indoles). However, a large reduction of these compounds was shown during 21 days of incubation under aerobic conditions, whereas substantial increase was observed under anaerobic conditions. Nonetheless, in the present study, the general increase of all major VOC emissions during incubation regardless treatment, supports the conclusion that these byproducts were formed during incubation and do not reflect residual VOCs originally existed in the fresh feces.
The order of VOC fluxes, with VFAs and alcohols comprising together 63 to nearly 100% of the total fluxes (Figures 4A–B) is in accordance with the observations of Miller and Varel (2001) who found that accumulation of odorous compounds and fermentation products differed between fresh manure and aged samples but was dominated by VFAs and alcohol production. Alcohols were also suggested as major byproducts of incomplete aerobic degradation during composting and were predominant during the active phase (Smet et al., 1999). Compared to VFAs, which were significantly higher in the pomegranate treatment after weaning, alcohols did not vary significantly among the treatments, although their fractional contribution to the total fluxes varied substantially because of the varied VFAs contribution. The third group of phenolic & aromatic VOCs has been the focus of multiple studies due to their characteristic “barn odor.” For land-applied swine slurry, Parker et al. (2013) showed that p-cresol accounted for about 80% of the overall OAV, followed by skatole and VFAs. Bulliner et al. (2006) found p-cresol as a key VOC responsible for the overall characteristic swine odor, and Wright et al. (2005) ranked p-cresol as the first VOC odorant at increasing distance from a commercial cattle feedyard. The transformation of VOC patterns into potential odor emissions (as expressed by OAV) showed similar differences between treatments and times of incubations (Figure 4B). VFAs most dominantly contributed to the odor impact due to their highest fluxes and taking into consideration their relatively low odor threshold (except acetic acid). Thus, it is evident that the pomegranate treatment after weaning (PA) had the highest odor emission potential. The fractional contribution of each VOCs group to the total OAV (Figure 4B-1) shows that the odor emitted from the PA has more VFA characteristics whereas in other cases the odor will be more affected by phenolic type compounds (phenol, p-cresol, indole, skatole). Sulfuric compounds also contribute to all treatments where both phenolic & aromatic as well as sulfuric VOCs have low odor threshold, thus even low concentrations contributed substantially to odor potential. This is in contrast to alcohols; although comprising a substantial fraction of the total VOCs, they had a small contribution due to their relatively high odor threshold.
It is important to note, however, that the OAV approach used in these kind of studies can be biased because of two main reasons: (1) Large efforts are needed to quantitate and monitor all relevant odorous VOCs and possibly some known odorants of extremely low odor thresholds are not resolved due to analytical artifacts. For example, it was shown by Andersen et al. (2012) that it can be difficult to measure methanethiol, since it easily reacts to form dimethyl disulfide during sampling and/or analysis. The analysis of trimethylamine, another potent odorant, also suffers from analytical difficulties, including low precision and sensitivity (Kim and Kim, 2013). Moreover, inorganic gases, mainly hydrogen sulfide and ammonia, which were not included in the present study, are expected to affect odor annoyance. (2) The use of odor threshold values of single compounds much depends on the selected database. This study followed the same approach of Parker et al. (2012) by taking the geometric means of odor thresholds presented in the large compilation of van Gemert (2003). A clear advantage of using large databases is the increased opportunity to approach true values while the use of geometric means reduces the effect of extreme values. A disadvantage may be related to the non-criticizing approach taken by this compilation, which includes values of unclear quality. On the other hand, databases obtained by one approach (e.g., Nagata, 2003; Leonardos et al., 2012), are inevitably biased toward that single approach. Overall, the OAV approach taken in the present as well as in other studies should be considered with caution, yet it assists with the prioritization of specific odorants in different environmental odor mixtures.
With regards to the main odorants monitored in the present study, starch and proteins in manure are considered as the parent sources for VFAs and phenolic VOCs, respectively, where phenol and p-cresol are main products of tyrosine fermentation and indole and skatole are the principal end-products of tryptophan metabolism (Mackie et al., 1998). Yet, observed differences in these VOCs between treatments cannot be attributed to starch and protein contents measured in the fresh feces (Table 1). Indeed, starch content was similar in PA and CB, although VFAs production was substantially higher in PA (total VFAs was 73 times higher in PA vs. CB on day 7). Similarly, the emission of phenolic VOCs was substantially higher in CA vs. PA (total phenolic & aromatic was 4.7 times higher in CA vs. PA on day 7) and thus, it cannot be attributed to the similar protein content in these two treatments. Based on the reverse pattern correlations shown in Figure 5, it is postulated that different microbial groups (expressed by OTUs) had an associations with different VOC groups. Thus, it could be that the effect of weaning and CPE diet on gastrointestinal microflora was further expressed during incubation by the development of different microbial populations and the resultant fermentation byproducts. This hypothesis deserves more research as it may have implications on ruminant health and production. Enhanced development of short chain fatty acids producing bacteria in CPE diet may be related to the mechanism by which pomegranate additives act against inflammatory diseases. The importance of short chain fatty acids for proper gastrointestinal function has been explored in multiple studies on human (Guarner and Malagelada, 2003) and also on ruminants (Guilloteau et al., 2010) and is highly considered in prebiotic formulations (Blaut, 2002). Thus, besides air emissions that are the focus of the present study, the reported observations open new questions related to the physiological mechanisms involved with recent approaches in cattle nutrition that make use of Mediterranean fruit byproducts.
Conclusions
Supplementation of post-weaning calves' diet with CPE can alter the emissions of odorants from excreted feces. Major known odorous VOC groups can be affected by the CPE supplement, where increased VFAs in the pomegranate treatment are mostly responsible for such differences. Emissions of other key barn odorants, such as p-cresol, dimethyl disulfide and skatole, may be reduced in the pomegranate treatment; yet, due to their relatively low concentration as compared to VFAs, they only slightly affect the differences in odor potential between pomegranate and control as expressed by OAV. Possible association between VOCs and certain microbial groups in manure may open new questions related to the mechanisms by which pomegranate additives increase ruminants' health. Overall, diet supplementation with CPE may be adopted due to its health and production promoting traits; yet, holistic nutritional-environmental approaches are deserved, taking into consideration possible subsequent changes in manure odor characteristics and increased feedlot nuisance if not managed properly.
Author Contributions
VV analyzed the VOC data and wrote a full draft of the manuscript. AS led and coordinated the animals experiment and all animal health aspects and contributed to the writing of the manuscript. MY treated the feces samples and performed VOC sampling, TD-GC-MS analyses and DNA extractions. IM and NS conducted the ARISA analyses. SF and SM analyzed the ARISA data, RA managed the animals experiment. YL coordinated all VOC sampling, analyses and data treatment, and took a leading role in manuscript preparation.
Conflict of Interest Statement
The authors declare that the research was conducted in the absence of any commercial or financial relationships that could be construed as a potential conflict of interest.
Supplementary Material
The Supplementary Material for this article can be found online at: https://www.frontiersin.org/articles/10.3389/fsufs.2018.00033/full#supplementary-material
References
Andersen, K. B., Hansen, M. J., and Feilberg, A. (2012). Minimisation of artefact formation of dimethyl disulphide during sampling and analysis of methanethiol in air using solid sorbent materials. J. Chromatogr. A 1245, 24–31. doi: 10.1016/j.chroma.2012.05.020
AOAC, I. (1990). No TitleOfficial Methods of Analysis, 15th Edn. Washington, DC: Association of Official Analytical Chemist.
Archibeque, S. L., Lunt, D. K., Gilbert, C. D., Tume, R. K., and Smith, S. B. (2005). Fatty acid indices of stearoyl-CoA desaturase do not reflect actual stearoyl-CoA desaturase enzyme activities in adipose tissues of beef steers finished with corn-, flaxseed-, or sorghum-based diets. J. Anim. Sci. 83, 1153–1166. doi: 10.2527/2005.8351153x
Atchley, S. H., and Clark, J. B. (1979). Variability of temperature, pH, and moisture in an aerobic composting process. Appl. Environ. Microbiol. 38, 1040–1044.
Aviram, M., Rosenblat, M., Gaitini, D., Nitecki, S., Hoffman, A., Dornfeld, L., et al. (2004). Pomegranate juice consumption for 3 years by patients with carotid artery stenosis reduces common carotid intima-media thickness, blood pressure and LDL oxidation. Clin. Nutr. 23, 423–433. doi: 10.1016/j.clnu.2003.10.002
Beck-Friis, B., Smårs, S., Jönsson, H., Eklind, Y., and Kirchmann, H. (2003). Composting of source-separated household organics at different oxygen levels: gaining an understanding of the emission dynamics. Compost Sci. Util. 11, 41–50. doi: 10.1080/1065657X.2003.10702108
Blaut, M. (2002). Relationship of prebiotics and food to intestinal microflora. Eur. J. Nutr. 41, i11–i16. doi: 10.1007/s00394-002-1102-7
Brinton, W. F. (1998). Volatile organic acids in compost: production and odorant aspects. Compost Sci. Util. 6, 75–82. doi: 10.1080/1065657X.1998.10701912
Brinton, W. F. (2006). Compatibility of digestion and composting. BioCycle 47:42. Available online at: https://www.biocycle.net/2006/09/20/compatibility-of-digestion-and-composting/
Brown, M. V., Schwalbach, M. S., Hewson, I., and Fuhrman, J. A. (2005). Coupling 16S-ITS rDNA clone libraries and automated ribosomal intergenic spacer analysis to show marine microbial diversity: development and application to a time series. Environ. Microbiol. 7, 1466–1479. doi: 10.1111/j.1462-2920.2005.00835.x
Bulliner, E. A., Koziel, J. A., Cai, L., and Wright, D. (2006). Characterization of livestock odors using steel plates, solid-phase microextraction, and multidimensional gas chromatography-mass spectrometry-olfactometry. J. Air Waste Manag. Assoc. 56, 1391–1403. doi: 10.1080/10473289.2006.10464547
Cai, L., Koziel, J. A., Lo, Y. C., and Hoff, S. J. (2006). Characterization of volatile organic compounds and odorants associated with swine barn particulate matter using solid-phase microextraction and gas chromatography-mass spectrometry-olfactometry. J. Chromatogr. A 1102, 60–72. doi: 10.1016/j.chroma.2005.10.040
CEN (2003). Air Quality – Determination of Odour Concentration by Dynamic Olfactometry; EN13725:2003. Brussels: CEN.
Corona, L., Rodriguez, S., Ware, R. A., and Zinn, R. A. (2005). Comparative effects of whole, ground, dry-rolled, and steam-flaked corn on digestion and growth performance in feedlot cattle. Prof. Anim. Sci. 21, 200–206. doi: 10.15232/S1080-7446(15)31203-1
Erdman, R. A., Hemken, R. W., and Bull, L. S. (1982). Dietary sodium bicarbonate and magnesium oxide for early postpartum lactating dairy cows: effects of production, acid-based metabolism, and digestion. J. Dairy Sci. 65, 712–731. doi: 10.3168/jds.S0022-0302(82)82259-5
Ferraretto, L. F., Crump, P. M., and Shaver, R. D. (2013). Effect of cereal grain type and corn grain harvesting and processing methods on intake, digestion, and milk production by dairy cows through a meta-analysis. J. Dairy Sci. 96, 533–550. doi: 10.3168/jds.2012-5932
Filipy, J., Rumburg, B., Mount, G., Westberg, H., and Lamb, B. (2006). Identification and quantification of volatile organic compounds from a dairy. Atmos. Environ. 40, 1480–1494. doi: 10.1016/j.atmosenv.2005.10.048
Firkins, J. L., Eastridge, M. L., St-Pierre, N. R., and Noftsger, S. M. (2001). Effects of grain variability and processing on starch utilization by lactating dairy cattle. J. Anim. Sci. 79(E. Suppl.), E218–E238. doi: 10.2527/jas2001.79E-SupplE218x
Fisher, M. M., and Triplett, E. W. (1999). Automated apporach for ribosomal intergenic spacer analysis of microbial diversity and its application to freshwater bacterial communities. Appl. Environ. Microbiol. 65, 4630–4636.
Fredin, S. M., Ferraretto, L. F., Akins, M. S., Hoffman, P. C., and Shaver, R. D. (2014). Fecal starch as an indicator of total-tract starch digestibility by lactating dairy cows. J. Dairy Sci. 97, 1862–1871. doi: 10.3168/jds.2013-7395
Gigliotti, G., Proietti, P., Said-Pullicino, D., Nasini, L., Pezzolla, D., Rosati, L., et al. (2012). Co-composting of olive husks with high moisture contents: organic matter dynamics and compost quality. Int. Biodeterior. Biodegrad. 67, 8–14. doi: 10.1016/j.ibiod.2011.11.009
Gralapp, A. K., Powers, W. J., Faust, M. A., and Bundy, D. S. (2002). Effects of dietary ingredients on manure characteristics and odorous emissions from swine. J. Anim. Sci. 80, 1512–1519. doi: 10.2527/2002.8061512X
Gressley, T. F., Hall, M. B., and Armentano, L. E. (2011). Ruminant nutrition symposium: productivity, digestion, and health responses to hindgut acidosis in ruminants. J. Anim. Sci. 89, 1120–1130. doi: 10.2527/jas.2010-3460
Guarner, F., and Malagelada, J. R. (2003). Gut flora in health and disease. Lancet 361, 512–519. doi: 10.1016/S0140-6736(03)12489-0
Guilloteau, P., Savary, G., Jaguelin-Peyrault, Y., Rome, V., Le Normand, L., and Zabielski, R. (2010). Dietary sodium butyrate supplementation increases digestibility and pancreatic secretion in young milk-fed calves. J. Dairy Sci. 93, 5842–5850. doi: 10.3168/jds.2009-2751
Hobbs, P. J., Misselbrook, T. H., and Cumby, T. R. (1999). Production and emission of odours and gases from ageing pig waste. J. Agric. Eng. Res. 72, 291–298. doi: 10.1006/jaer.1998.0372
Islam, M. R., Ishida, M., Ando, S., and Nishida, T. (2002). In situ dry matter, nitrogen and phosphorus disappearance of different feeds for ruminants. Asian Aust. J. Anim. Sci. 15, 793–799. doi: 10.5713/ajas.2002.793
Israel Meteorological Service (2018). Multi-Annual Average Temeratures for 1995-2009. Available online at: http://www.ims.gov.il/IMSENG/All_Tahazit/homepage.htm (Accessed May 3, 2018).
Jami, E., Shabtay, A., Nikbachat, M., Yosef, E., Miron, J., and Mizrahi, I. (2012). Effects of adding a concentrated pomegranate-residue extract to the ration of lactating cows on in vivo digestibility and profile of rumen bacterial population. J. Dairy Sci. 95, 5996–6005. doi: 10.3168/jds.2012-5537
Kerr, B. J. (1995). “Nutritional strategies for waste reduction management,” in Proceedings New Horizons in Animal Nutrition and Health (Raleigh, NC), 7–8.
Kim, Y. H., and Kim, K. H. (2013). An accurate and reliable analysis of trimethylamine using thermal desorption and gas chromatography-time of flight mass spectrometry. Anal. Chim Acta 780, 46–54. doi: 10.1016/j.aca.2013.03.069
Kim, Y. H., Nagata, R., Ohtani, N., Ichijo, T., Ikuta, K., and Sato, S. (2016). Effects of dietary forage and calf starter diet on ruminal pH and bacteria in holstein calves during weaning transition. Front. Microbiol. 7, 1–12. doi: 10.3389/fmicb.2016.01575
Kovacs, A., Yacoby, K., and Gophna, U. (2010). A systematic assessment of automated ribosomal intergenic spacer analysis (ARISA) as a tool for estimating bacterial richness. Res. Microbiol. 161, 192–197. doi: 10.1016/j.resmic.2010.01.006
Koziel, J. A., Cai, L., Wright, D. W., and Hoff, S. J. (2006). Solid-Phase Microextraction as a Novel Air Sampling Technology for Improved, GC—Olfactometry-Based Assessment of Livestock Odors. J. Chromatogr. Sci. 44, 451–457. doi: 10.1093/chromsci/44.7.451
Laor, Y., Koziel, J. A., Cai, L., and Ravid, U. (2008). Chemical-sensory characterization of dairy manure odor using headspace solid-phase microextraction and multidimensional gas chromatography mass spectrometry-olfactometry. J. Air Waste Manag. Assoc. 58, 1187–1197. doi: 10.3155/1047-3289.58.9.1187
Laor, Y., Parker, D., and Pag,é, T. (2014). Measurement, prediction, and monitoring of odors in the environment: a critical review. Rev. Chem. Eng. 30, 139–166. doi: 10.1515/revce-2013-0026
Le, P. D., Aarnink, A. J. A., Ogink, N. W. M., Becker, P. M., and Verstegen, M. W. A. (2005). Odour from animal production facilities: its relationship to diet. Nutr. Res. Rev. 18:3. doi: 10.1079/NRR200592
Leonardos, G., Kendall, D., and Barnard, N. (2012). Odor threshold determinations of 53 odorant chemicals. J. Air Pollut. Control Assoc. 19, 91–95. doi: 10.1080/00022470.1969.10466465
Lo, Y. C. M., Koziel, J. A., Cai, L., Hoff, S. J., Jenks, W. S., and Xin, H. (2008). Simultaneous chemical and sensory characterization of volatile organic compounds and semi-volatile organic compounds emitted from swine manure using solid phase microextraction and multidimensional Gas Chromatography–Mass Spectrometry–Olfactometry. J. Environ. Qual. 37, 521–534. doi: 10.2134/jeq2006.0382
Mackie, R. I., Stroot, P. G., and Varel, V. H. (1998). Biochemical identification and biological origin of key odor components in livestock waste. J. Anim. Sci. 76, 1331–1342. doi: 10.2527/1998.7651331x
Miller, D. N., and Varel, V. H. (2001). In vitro study of the biochemical origin and production limits of odorous compounds in cattle feedlots. J. Anim. Sci. 79, 2949–2956. doi: 10.2527/2002.8092214x
Miller, D. N., and Woodbury, B. L. (2006). A solid-phase microextraction chamber method for analysis of manure volatiles. J. Environ. Qual. 35, 2383–2394. doi: 10.2134/jeq2006.0065
Miller, G. L. (1959). Use of dinitrosalicylic acid reagent for determination of reducing sugar. Anal. Chem. 31, 426–428. doi: 10.1021/ac60147a030
Miller, J. J., Olson, E. C. S., Chanasyk, D. S., Beasley, B. W., Larney, F. J., and Olson, B. M. (2006). Phosphorus and nitrogen in rainfall simulation runoff after fresh and composted beef cattle manure application. J. Environ. Qual. 35:1279. doi: 10.2134/jeq2005.0389
Nagata, Y. (2003). Measurement of Odor Threshold by Triangle Odor Bag Method. Odor Measurement Review. Tokyo: Office of Odor, Noise and Vibration; Environmental Management Bureau; Ministry of Environment.
Oliveira, R. A., Narciso, C. D., Bisinotto, R. S., Perdomo, M. C., Ballou, M. A., Dreher, M., et al. (2010). Effects of feeding polyphenols from pomegranate extract on health, growth, nutrient digestion, and immunocompetence of calves. J. Dairy Sci. 93, 4280–4291. doi: 10.3168/jds.2010-3314
Parker, D. B., Cai, L., Kim, K. H., Hales, K. E., Spiehs, M. J., Woodbury, B. L., et al. (2012). Reducing odorous VOC emissions from swine manure using soybean peroxidase and peroxides. Biores. Technol. 124, 95–104. doi: 10.1016/j.biortech.2012.08.031
Parker, D. B., Gilley, J., Woodbury, B., Kim, K. H., Galvin, G., Bartelt-Hunt, S. L., et al. (2013). Odorous VOC emission following land application of swine manure slurry. Atmos. Environ. 66, 91–100. doi: 10.1016/j.atmosenv.2012.01.001
Parker, D. B., Perschbacher-Buser, Z. L., Cole, N. A., and Koziel, J. A. (2010). Recovery of agricultural odors and odorous compounds from polyvinyl fluoride film bags. Sensors 10, 8536–8552. doi: 10.3390/s100908536
Pinchasov, Y., and Noy, Y. (1994). Early postnatal amylolysis in the gastrointestinal tract of turkey poults Meleagris gallopavo. Comp. Biochem. Physiol. A Physiol. 107, 221–226. doi: 10.1016/0300-9629(94)90297-6
Powers, W. J. (1998). Powers, W. J. (1998). “Dietary manipulation to alter manure odor and composition,” in Proceedings of Animal Production Systems and the Environment: An International Conference on Odor, Water Quality, Nutrient Management, and Socioeconomic Issues (Des Moines, IA). 91–96.
Schiffman, S. S., Bennett, J. L., and Raymer, J. H. (2001). Quantification of odors and odorants from swine operations in North Carolina. Agric. For. Meteorol. 108, 213–240. doi: 10.1016/S0168-1923(01)00239-8
Shabtay, A., Eitam, H., Tadmor, Y., Orlov, A., Meir, A., Weinberg, P., et al. (2008). Nutritive and antioxidative potential of fresh and stored pomegranate industrial byproduct as a novel beef cattle feed. J. Agric. Food Chem. 56, 10063–10070. doi: 10.1021/jf8016095
Shabtay, A., Nikbachat, M., Zenou, A., Yosef, E., Arkin, O., Sneer, O., et al. (2012). Effects of adding a concentrated pomegranate extract to the ration of lactating cows on performance and udder health parameters. Anim. Feed Sci. Technol. 175, 24–32. doi: 10.1016/j.anifeedsci.2012.04.004
Shabtay, A., Ravid, U., Brosh, A., Baybikov, R., Eitam, H., and Laor, Y. (2009). Dynamics of offensive gas-phase odorants in fresh and aged feces throughout the development of beef cattle. J. Anim. Sci. 87, 1835–1848. doi: 10.2527/jas.2008-1357
Smet, E., Van Langenhove, H., and De Bo, I. (1999). The emission of volatile compounds during the aerobic and the combined anaerobic/aerobic composting of biowaste. Atmos. Environ. 33, 1295–1303. doi: 10.1016/S1352-2310(98)00260-X
Sunesson, A. L., Gullberg, J., and Blomquist, G. (2001). Airborne chemical compounds on dairy farms. J. Environ. Monit. 3, 210–216. doi: 10.1039/B008873K
Sutton, A. L., Kephart, K. B., Verstegen, M. W., Canh, T. T., and Hobbs, P. J. (1999). Potential for reduction of odorous compounds in swine manure through diet modification the online version of this article, along with updated information and services, is located on the World Wide Web at. Anim. Sci. 77, 430–439. doi: 10.2527/1999.772430x
Teagasc (2017). Calf Rearing Manual. Available online at: https://www.teagasc.ie/media/website/publications/2017/Section4-Rumen-development.pdf (Accessed February 21, 2018).
Tzulker, R., Glazer, I., Bar-Ilan, I., Holland, D., Aviram, M., and Amir, R. (2007). Antioxidant activity, polyphenol content, and related compounds in different fruit juices and homogenates prepared from 29 different pomegranate accessions. J. Agric. Food Chem. 55, 9559–9570. doi: 10.1021/jf071413n
van Gemert, L. J. (2003). Odour Thresholds: Compilations of Odour Threshold Values in Air, Water and Other Media. Utrecht: Oliemans Punter Partners BV.
Wang, K., Li, W., Li, X., and Ren, N. (2015). Spatial nitrifications of microbial processes during composting of swine, cow and chicken manure. Sci. Rep. 5, 1–8. doi: 10.1038/srep14932
Welkie, D. G., Stevenson, D. M., and Weimer, P. J. (2010). ARISA analysis of ruminal bacterial community dynamics in lactating dairy cows during the feeding cycle. Anaerobe 16, 94–100. doi: 10.1016/j.anaerobe.2009.07.002
Weyl-Feinstein, S., Markovics, A., Eitam, H., Orlov, A., Yishay, M., Agmon, R., et al. (2014). Short communication: effect of pomegranate-residue supplement on Cryptosporidium parvum oocyst shedding in neonatal calves. J. Dairy Sci. 97, 5800–5805. doi: 10.3168/jds.2013-7136
Wheeler, W. E., and Noller, C. H. (1977). Gastrointestinal tract pH and starch in feces of ruminants. J. Anim. Sci. 44, 131–135. doi: 10.2527/jas1977.441131x
Wheeler, W. E., and Noller, C. H. (1976). Limestone buffers in complete mixed rations for dairy cattle. J. Dairy Sci. 59, 1788–1793. doi: 10.3168/jds.S0022-0302(76)84438-4
Woodbury, B. L., Gilley, J. E., Parker, D. B., Marx, D. B., and Eigenberg, R. A. (2015). VOC emissions from beef feedlot pen surfaces as affected by within-pen location, moisture and temperature. Biosyst. Eng. 134, 31–41. doi: 10.1016/j.biosystemseng.2015.03.014
Wright, D. W., Eaton, D. K., Nielsen, L. T., Kuhrt, F. W., Koziel, J. A., Spinhirne, J. P., et al. (2005). Multidimensional gas chromatography-olfactometry for the identification and prioritization of malodors from confined animal feeding operations. J. Agric. Food Chem. 53, 8663–8672. doi: 10.1021/jf050763b
Wu, T., Wang, X., Li, D., and Yi, Z. (2010). Emission of volatile organic sulfur compounds (VOSCs) during aerobic decomposition of food wastes. Atmos. Environ. 44, 5065–5071. doi: 10.1016/j.atmosenv.2010.09.019
Yasuhara, A., Fuwa, K., and Jimbu, M. (1984). Identification of odorous compounds in fresh and rotten swine manure. Agric. Biol. Chem. 48, 3001–3010. doi: 10.1080/00021369.1984.10866622
Yuan, B., Coggon, M. M., Koss, A. R., Warneke, C., Eilerman, S., Peischl, J., et al. (2017). Emissions of volatile organic compounds (VOCs) from concentrated animal feeding operations (CAFOs): chemical compositions and separation of sources. Atmos. Chem. Phys. 17, 4945–4956. doi: 10.5194/acp-17-4945-2017
Zervas, S., and Zijlstra, R., T (2002). Effects of dietary protein and oathull fiber on nitrogen excretion patterns and postprandial plasma urea profiles in grower pigs. J. Anim. Sci. 12, 3238–3246. doi: 10.2527/2002.80123238x
Zinn, R. A., Barreras, A., Corona, L., Owens, F. N., and Ware, R. A. (2007). Starch digestion by feedlot cattle: predictions from analysis of feed and fecal starch and nitrogen. J. Anim. Sci. 85, 1727–1730. doi: 10.2527/jas.2006-556
Keywords: diet, odor, beef cattle, manure, volatile organic compound (VOCs), odor activity values (OAVs), automated ribosomal intergenic spacer analysis (ARISA), short chain fatty acids (SCFAs)
Citation: Varma VS, Shabtay A, Yishay M, Mizrahi I, Shterzer N, Freilich S, Medina S, Agmon R and Laor Y (2018) Diet Supplementation With Pomegranate Peel Extract Altered Odorants Emission From Fresh and Incubated Calves' Feces. Front. Sustain. Food Syst. 2:33. doi: 10.3389/fsufs.2018.00033
Received: 22 February 2018; Accepted: 11 June 2018;
Published: 17 July 2018.
Edited by:
Claudia Wagner-Riddle, University of Guelph, CanadaReviewed by:
Anders Peter S. Adamsen, SEGES Agriculture and Food FmbA, DenmarkDavid Bruce Parker, Plains Area, Agricultural Research Service, United States Department of Agriculture, United States
Copyright © 2018 Varma, Shabtay, Yishay, Mizrahi, Shterzer, Freilich, Medina, Agmon and Laor. This is an open-access article distributed under the terms of the Creative Commons Attribution License (CC BY). The use, distribution or reproduction in other forums is permitted, provided the original author(s) and the copyright owner(s) are credited and that the original publication in this journal is cited, in accordance with accepted academic practice. No use, distribution or reproduction is permitted which does not comply with these terms.
*Correspondence: Ariel Shabtay, c2hhYnRheUB2b2xjYW5pLmFncmkuZ292Lmls
Yael Laor, bGFvckB2b2xjYW5pLmFncmkuZ292Lmls
†These authors have contributed equally to this work.