Abstract
The agricultural sector in the Netherlands is per unit of land the most productive and efficient sector in the European Union (EU). However, emissions of ammonia, surpluses of nitrogen and phosphorus, and use of pesticides per hectare of agricultural land are also among the highest in the EU. In spite of successful policies and farm measures to reduce this pollution, agriculture still constitutes the largest environmental pressure on biodiversity. Dutch agriculture, including horticulture, also contributes 14% (32 Mton CO2-eq in 2016) to the national emissions of greenhouse gasses (GHG). These emissions hardly decreased since 2000. In the current bid to meet the Paris Climate Agreement (PCA), the agricultural sector will need to reduce emission by 3.5 Mton in 2030. The relative reduction target for GHG by agriculture is 11% and less than the national target of 49%, but still is a challenge because the technical potential for reduction of methane and nitrous oxides is relatively small. Apart from technical measures and innovations, there is an increasing call in society for structural measures, like reduction of livestock, to assure an appropriate reduction of GHG emission from agriculture. However, there are also concerns about leakage effects when livestock production would increase elsewhere, e.g., in the EU, causing a net increase of GHG emission and increased local environmental pollution. We carried out a Life Cycle Analysis for production of milk, pork, poultry, potato, and wheat in other EU countries which disclosed that GHG emission per unit of product in the Netherlands is similar to that in Germany and France, while lower than in central and southern EU. Nitrogen and phosphorus surplus per unit of product for Dutch products often are higher due to the high use of manure. These results indicate that the risk of transboundary leakage effects likely is small when implementing PCA for agriculture in the Netherlands or stricter environmental policies, also when including reduction of livestock production. Further, growth of livestock production in other European regions might be avoided by climate policies or when consumption of livestock products would decrease due to increased consumer awareness or targeted interventions.
Introduction
Toward More Sustainable Agro-Food Systems
Sustainable and efficient management of natural resources and the environments that support (and surround) the agro-food system is imperative to sustain food production for future generations. Indicators to measure progress toward a more sustainable agro-food system are embedded in the 17 United Nations Sustainable Development Goals (SDGs). Globally and regionally the agro-food system is the dominant user of land, biodiversity, fresh water, nitrogen and phosphorus, and a major cause of biodiversity loss, soil degradation, water depletion and greenhouse gas emissions, and contributor to pollution of water and air (UNEP, 2016).
The three major intervention routes to decrease resource demand and adverse environmental and health impacts of the agro-food system are (1) increasing the efficiency of agricultural production, (2) decreasing food waste, and (3) adoption of less resource-intensive and healthier diets (Figure 1). Options (2) and (3) could be coined as increasing the efficiency of food consumption (van Grinsven et al., 2015). A fourth category of measures could be labeled as adoption of agricultural practices aimed at increasing services of the agro-food system to local biodiversity, environments, livelihoods and general well-being, and could be linked to the One Health Initiative (www.onehealthinitiative.com). Examples are practices improving soil health, local air quality or animal welfare. Adoption of some of these responsible practices without change of diets may decrease resource efficiency and increase environmental pressure, e.g., in the case of improved animal welfare. However, preferences of consumers and producers for these practices tend to go along with more sustainable food choices (Baudry et al., 2017). Particularly the change of diets has a large potential to reduce resource demand and environmental pollution, but adoption of food policies or regulation tends to meet more political and economic barriers than the other interventions routes (Westhoek et al., 2014). In this paper, we analyze the eco-efficiency and environmental pressure (footprints) of Dutch agriculture in comparison to other EU countries.
Figure 1
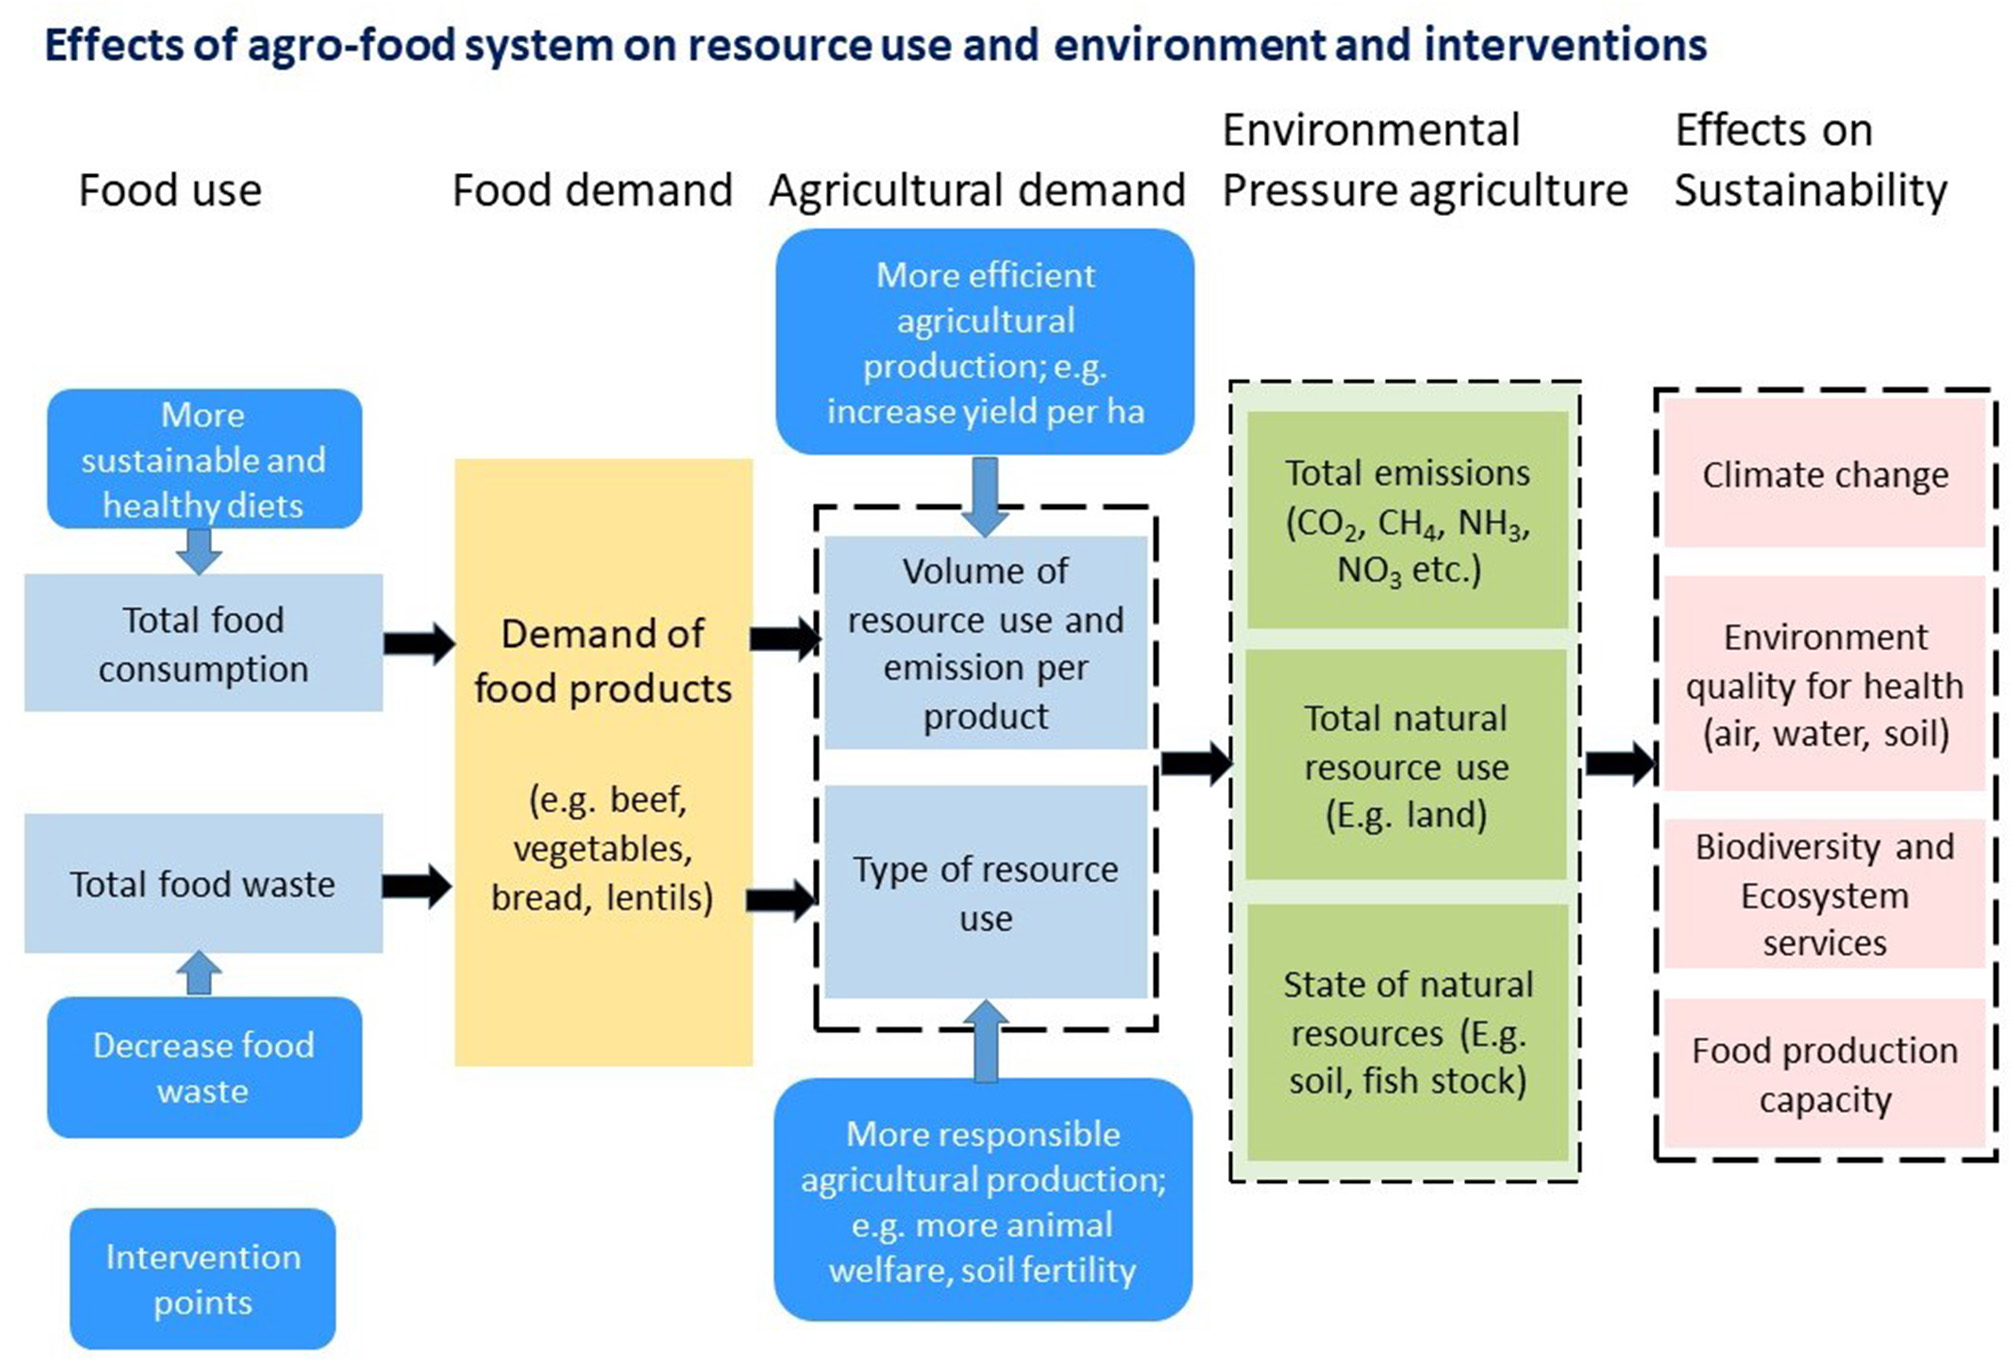
Schematic representation of the agro-food system and intervention points for increased sustainability.
Key Features and Metrics of Dutch Agriculture in EU and Global Perspective
The mean economic value of the gross export of the Dutch agro-food sector in 2016–2017 was 94 billion USD/year (United Nations Department of Economic and Social Affairs, 2018) and includes 10 billion USD for ornamental products (like live trees, flower bulbs, cut flowers, and ornamental foliage). The Netherlands ranks second in the world after the US (142 billion USD/year) and before Brazil (74), China (72) and much larger EU countries like Germany (82), France (66), and Spain (51). Ranking countries by gross export gives a distorted picture of the economic relevance of national agro-food sector as, particularly for the Netherlands, a large share of imported commodities is almost directly re-exported e.g., via Rotterdam harbor and Schiphol airport. Therefore, the net export value in 2016–2017 is more meaningful. For the Netherlands net export was 31 billion USD/year (one third of gross export) and still ranked 3rd after Brazil (63 billion USD/year), Argentine (33) but before New Zealand (17.3), Indonesia (16.2), and Australia (16.1), and EU countries like Spain (12.4), Poland (8.3), and France (5.8). This 3rd position is a remarkable achievement considering that the Netherlands (NL) only holds 0.04% of global agricultural land and 1% of that in the EU (Table 1) and inspired the claim that “A tiny country feeds the world” (National Geographic Magazine, 2017). This position is made possible by a combination of a favorable climate, fertile soils, high levels of agricultural science and technology, high cost-efficiencies, a very profitable horticultural sector (including greenhouses and ornamental), but also a high intensity primary production system with high imports of agricultural products like livestock feed. This allows NL to produce more than 9% of EU dairy production, and to house 8% of the EU pig and poultry livestock and 6% of meat production in the EU (Table 1).
Table 1
| Stock/volume 2015 | Share of NL | Relative intensity NLb | |||||
|---|---|---|---|---|---|---|---|
| World | EU28 | NL | World | EU28 | World | EU28 | |
| Population (×106) | 7,418 | 507 | 17.0 | 0.23% | 3.35% | 6.1 | 3.3 |
| Land area (106 ha) | 12,733 | 423 | 3.38 | 0.03% | 0.80% | 0.7 | 0.8 |
| Agricultural land (106 ha) | 4,775 | 179 | 1.80 | 0.04% | 1.01% | 1.0 | 1.0 |
| Cropland (106 ha) | 1,391 | 119 | 0.81 | 0.06% | 0.68% | 1.5 | 0.7 |
| Grasslanda (106 ha) | 3,384 | 59 | 0.98 | 0.03% | 1.65% | 0.8 | 1.6 |
| Nitrogen use (106 t/y) | 115 | 11.3 | 0.2 | 0.17% | 1.70% | 4.4 | 1.7 |
| Cereal production (106 t/y) | 2,519 | 317 | 1.62 | 0.06% | 0.51% | 1.7 | 0.5 |
| Milk production (106 t/y) | 656 | 153.1 | 14.3 | 2.18% | 9.35% | 57.9 | 9.3 |
| Meat production (106 t/y) | 307 | 45 | 2.72 | 0.89% | 6.04% | 23.5 | 6.0 |
| Cattle (×106) | 1,694 | 89 | 4.3 | 0.25% | 4.76% | 6.7 | 4.7 |
| Pigs (×106) | 977 | 149 | 12.5 | 1.28% | 8.39% | 33.9 | 8.3 |
| Poultry (×106) | 21,873 | 1402 | 106.4 | 0.49% | 7.59% | 12.9 | 7.5 |
| Sheep and goats (×106) | 2,177 | 98 | 1.3 | 0.06% | 1.31% | 1.6 | 1.3 |
Characteristics of Dutch agriculture as compared to the world and the EU in 2015 [source FAOstat, Eurostat and Statistics Netherlands (CBS statline)].
Permanent grassland.
per hectare of used agricultural land relative to world and EU28.
Degrees of self-sufficiency, and related to this the share of national production that is exported, are 295%/66% for eggs, 172%/41% for poultry meat, 230%/57% for pork, and 241%/58% for cheese, but the degree of self-sufficiency for cereals is only 18% and for protein rich feed stuffs 1.4% (Westhoek et al., 2011).
The national gross value added (GVA) of the Dutch agro-complex (including supply, processing and distribution) in 2015 was 48 billion euro, of which 9.5 billion euro was generated by primary agriculture, and 18 billion euro was generated from imported products (e.g., feed; PBL, 2018). Relative shares of GVA of primary agriculture based on domestic resources (30 billion euro) were 34% by horticulture, 29% by the land based livestock sector (mainly dairy), 19% by the landless livestock sector (pigs, broilers, layers, and veal) and also 19% by the arable sector.
Effects of Agri-Environmental Policies in the Netherlands
The high economic efficiency, e.g., measured as GVA per unit of end product, of the Dutch agro-food sector was made possible by the high use of inputs such as artificial fertilizer, imports of animal feed and pesticides. In the 1980s and 1990s the adverse environmental impacts of the intensive agricultural sector were revealed and gradually policies were introduced to prevent and mitigate the impacts (Table 2). Many current Dutch policies to reduce water and air pollution are national implementations of European Environmental Directives (see e.g., van Grinsven et al., 2016). In spite of these effective policies various environmental targets currently still are far from being achieved (Table 2). The steady decrease of many emissions or polluting uses of compounds since 1990 is stagnating in recent years or sometimes even reversed (Figure 2).
Table 2
| Indicator | Policy | Target | Year (ref.) | Target achievement by dutch agriculture | Contribution of dutch agriculture to total problem | Most important measures agriculture |
|---|---|---|---|---|---|---|
| NH3 emission | EU-NEC directive | 133 kton NH3-N−13% reduction relative 2005 | 2029 | 100% (2016) | 88% (2017) | Reduction of emission from housing, spreading, and manure storage |
| N deposition on terrestrial ecosystems | EU-Habitat directive | Protection Natura 2000 areas, no degradation, eventually no exceedance critical loads | No target year; no decline | 32% no exceedance, 35% exceedance <7 kg N/ha, 34%>7 kg N/ha (2010). N = 160 | 37% (2011) | Reduction of NOx emission from powerplant, industry and transport, and NH3 from agriculture |
| N and P in regional fresh waters | EU-WFD | All necessary measures are taken in 2027 to assure achievement of a good ecological status | 2027 | 50% sites meets N and P targets (N = 172) | 55% runoff from agricultural land | Reduction of emission from WWTP and direct input from agriculture |
| Biological state regional freshwater | EU-WFD | 2027 | Biological indicators 10–20% good, 60–80% good or moderate; 5% good one out all out | Unknown | ||
| NO3 in groundwater under farmland | EU-ND and NL Fertilizer and manure act | 50 mg/l | No target year; no decline | 54% of farms on sandy soils, 36% on loess, 93% on clay and 100% on peat (2012–2015) (N = 400) | >95% | Reduction of use of synthetic N fertilizer, Manure N, closed periods |
| PM concentration in ambient air | EU-Air quality Directive and national policy | Annual average PM10< 40 μg/m3, <35 d 50 μg/m3 > PM2.5 < 25 μg/m3, reduction 37% relative to 2005 TSAP ceiling 2020 PM2.5 16 kton | 2029 | No exceedance of annual PM2.5 and PM10 standards in 2009–2015 | Mass fractions - Emissions: 5% in PM2.5, 25% in PM10. - NH4NO3 aerosols contribute 40% to PM2.5 (2013) Exceedance in spring caused by ammonia emission by manure spreading | Air scrubbers, low emission application |
| GHG emission | Kyoto + NL Urgenda court case EU-UNFCCC 2017 PCA and NL draft agreement | −25% relative to 1990. −40% ETS −30% non ETS (CH4, N2O) −3.5 Mton in 2030 (11%) | 2020 2030 1995 | All sectors (2017) CO2−eq: −13% CO2: −13% CH4, N2O−50% Agriculture (2016) CO2−eq: −14% CO2: +5% CH4, N2O −32% | 14% (2016), excluding land use | Manure management and reduction of use of synthetic N-fertilizer and manure N |
| Pesticide use | EU-directive sustainable use of pesticides (SUD) + NL policies | Hardly any exceedances of water quality standards | 2023 | Exceedance on 60% of monitoring sites | >95% of national use of active substances | Spray-drift-reducing techniques, buffer strips and substitution of pesticides |
| Antibiotics use | NL | Reduction of antimicrobial resistance; −70% for livestock use relative to 2009 | 2020 | 63% in 2017 | About 70% in 2017, but human antibiotic use is not regulated | Improvement of animal welfare and robust breeds |
Policies, targets, and target achievement for emissions, environmental pressures, and use of pesticides and antibiotics in the Netherlands for environmental issues with a strong linkage to agricultural production.
NEC, National Emission Ceilings; ND, Nitrates Directive, WFD, Water Framework Directive; WWTP, Waste Water Treatment Plant; UNFCC, United Nation Framework Convention on Climate Change. Urgenda court case: case of Dutch NGL against the Dutch government, see https://www.urgenda.nl/en/themas/climate-case/climate-case-explained/.
Figure 2
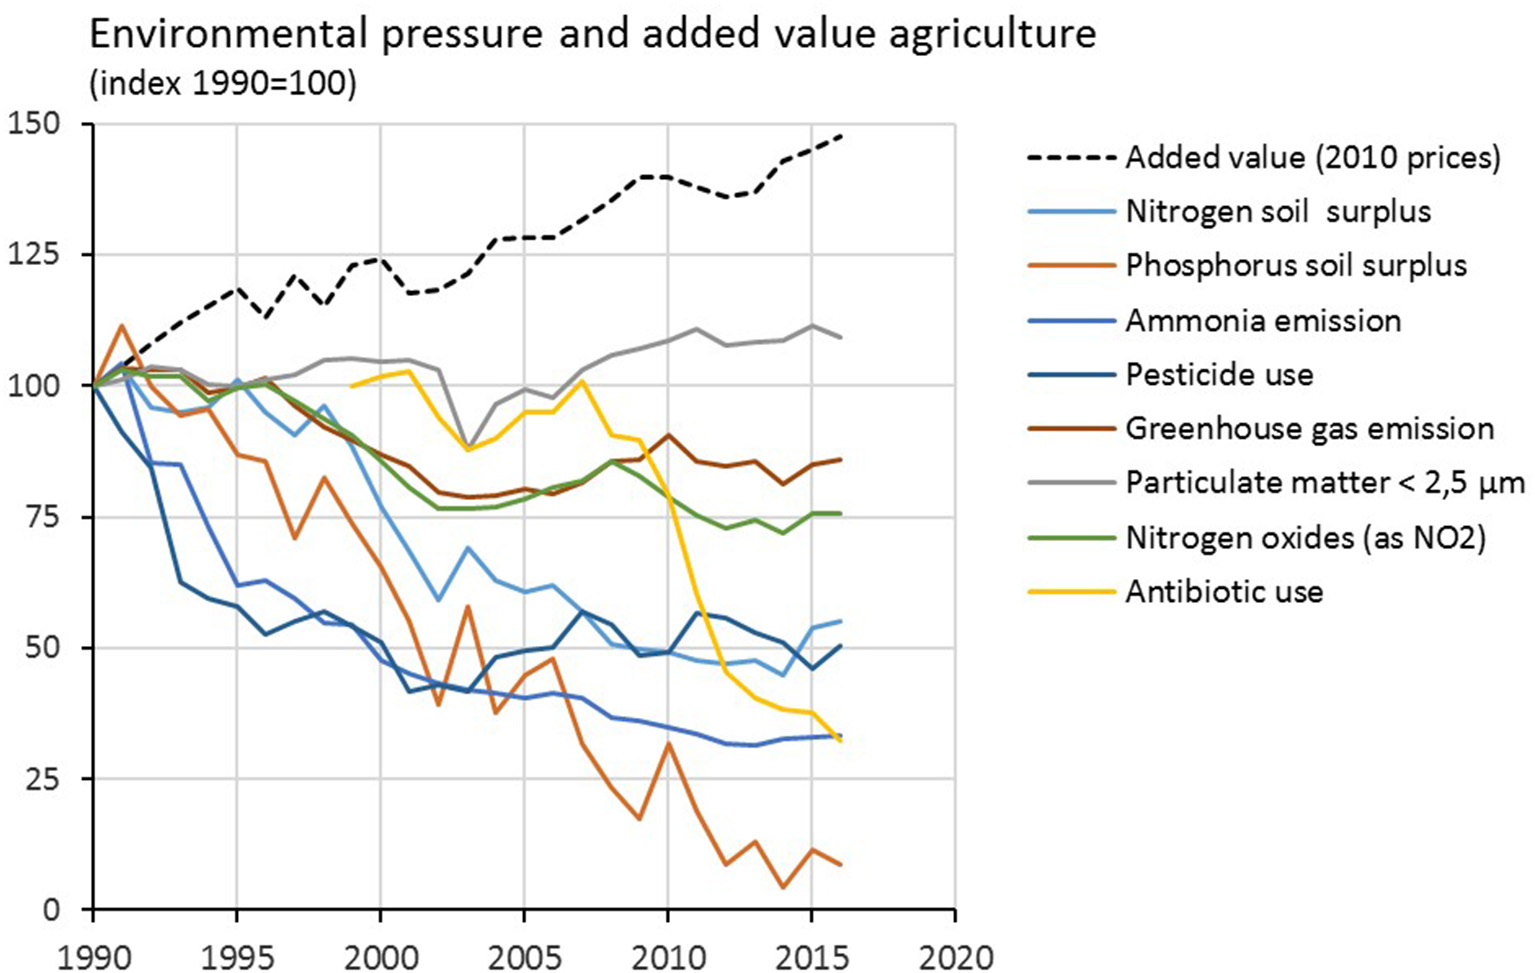
Trends of environmental pressure by agriculture in the Netherlands [Source: Pollutant Release and Transfer Register http://www.emissieregistratie.nl/erpubliek/bumper.en.aspx; adapted from PBL (2018)].
Also the emission of greenhouse gasses (GHG) by the agricultural sector has stagnated due to an increase of methane emissions by the growth of dairy livestock and dairy production in response to the abolishment of the EU milk quota system in 2015. But new policies have been introduced in 2016 and have decreased the dairy livestock to around 2012 levels.
The production volume of the agricultural sector (for which added value using constant prices is a good proxy) has steadily increased since 1990 and caused an absolute decoupling of all emissions and uses with the exception of PM2.5. The latter is the result of legislation to increase welfare for poultry.
Agriculture and Global Climate Challenge
The primary agricultural sector emitted 28 Mton CO2-eq greenhouse gasses (GHG) in 2016 as compared to a highest value of 34 Mton in the early 1990s and lowest values of 26 Mton in 2003–2004 (Figure 3). Recent increases are caused by the earlier mentioned growth of the dairy sector. The livestock sector contributes two thirds (66%) to the total emission of GHG by agriculture in 2014–2016, of which 46%-points as methane and 18%-points as nitrous oxide. Current Dutch environmental policies give the highest priority to agreed commitments in the PCA to reduce greenhouse emissions and was recently reconfirmed in view of the alarming messages in the 8th IPCC assessment report (AR8; IPCC, 2018). Although the relative reduction target for the agricultural sector of about 11% in 2030 (3.5 Mton CO2-eq) is lower than the national target of 49%, meeting the target as well as verifying achievement is an immense challenge. A large part of the reduction will have to come from land use change (LUC; reduced drainage of peatland and conversion of arable to grassland; note that in IPCC accounting GHG emissions from LUC are not attributed to the agricultural sector) and improved manure management, the effects of which cannot be directly measured and effectiveness is uncertain. Given the national task to reduce multiple emissions from agriculture to increase target achievement for water and air quality, an additional challenge is to increase positive feedbacks of climate measures in agriculture and reduce the risk of negative feedbacks (trade-offs).
Figure 3
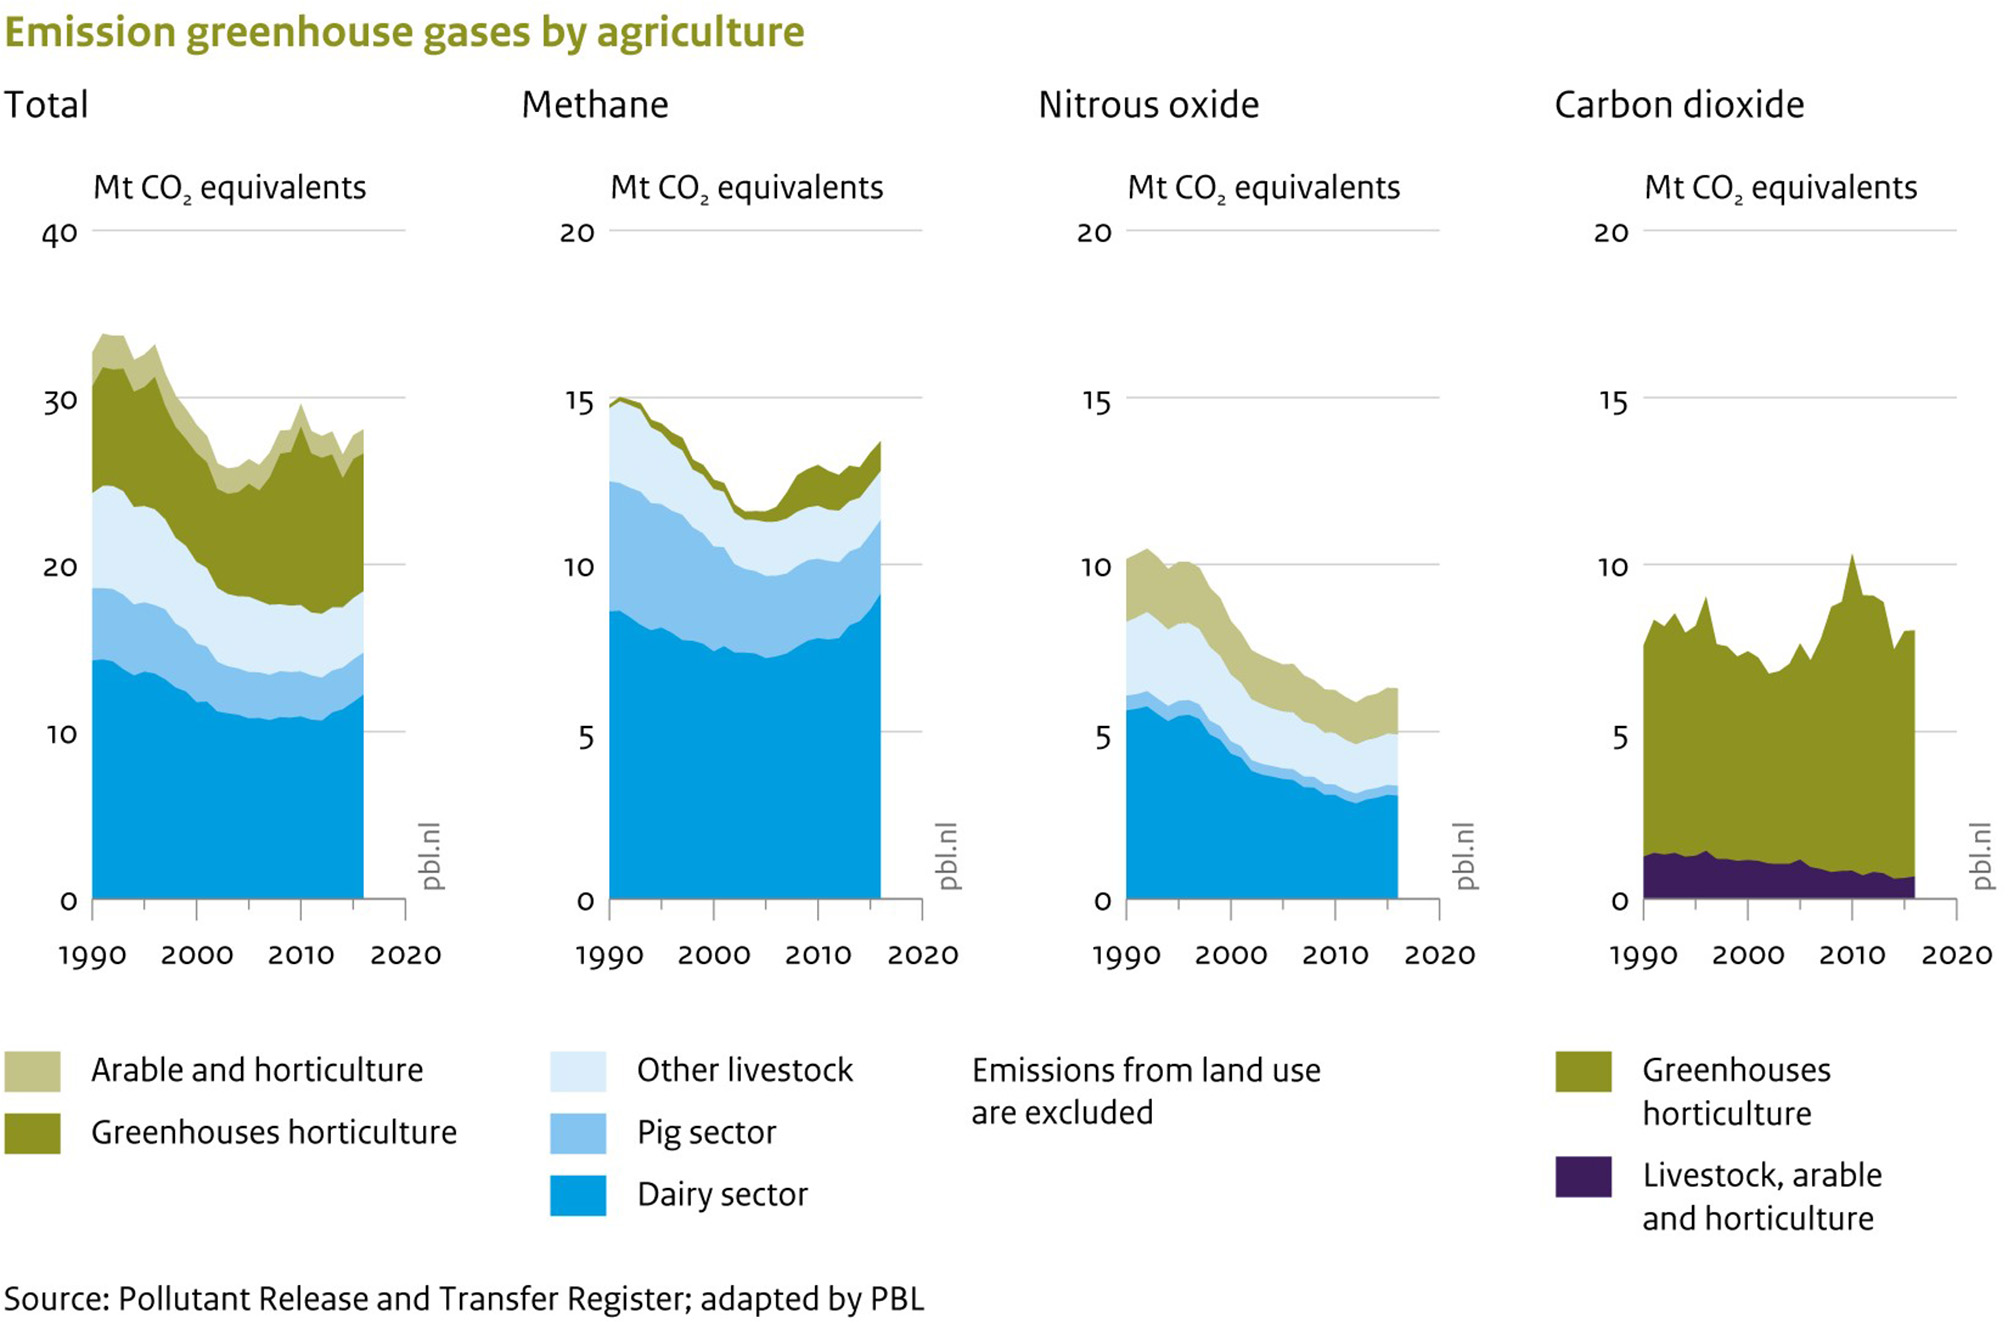
Trends of greenhouse gas emission by agriculture in the Netherlands.
Research Hypothesis and General Approach
A dominant view in Dutch society is that its agro-food sector is world leading for feeding the next generation of the world population and that can do so with “the lowest impact on the environment, climate and biodiversity per kilogram of food worldwide” (https://topsectoragrifood.nl/en/over/). Our research hypothesis is that the environmental pressure per unit of agricultural product (including greenhouse gas emissions) in the Netherlands is not significantly different from those for other Northwest European countries with similar climates and similar productivity potentials and with comparable access to agricultural science and technology. If true, this will have implications for options toward a more efficient European agricultural production system with less emissions and adverse environmental impacts. The ambition to increase the eco-efficiency of production aims at production of goods and services with minimal environmental degradation and therefore is an operationalization of the more encompassing ambition to make economies more sustainable (Kuosmanen and Kortelainen, 2005) and relates to revival of ambitions for increased circularity in the agro-foodsystem (Ministry of Agriculture Nature and Food Quality of the Netherlands, 2018).
Therefore, we chose to test our hypothesis by benchmarking the eco-efficiency (GVA per unit of resource input or pollution) and intensity (resource use or emission per unit of land or product) of agricultural production in the Netherlands and other EU countries. Intensity is also referred to as pressure of footprint. We quantify efficiencies and intensities at two levels; for national agricultural sectors and for individual products. At product level we explored efficiencies and intensities for a selection of products and EU countries giving 30 product-country combinations. We looked into to five (environmental) indicators: land use, distinguishing between grassland and arable land at home and abroad (including cattle feed); greenhouse gas emissions (including and excluding land use and land use change); N and P surplus/excretion and ammonia emission. At the national level we benchmark both eco-efficiency and environmental pressure per unit of land and make a distinction between global environmental issues (land use change as a driver of biodiversity loss, climate change by GHG emissions and antibiotic resistance), for which impacts are relatively independent of the location of emission, and local issues (NH3 emission, N and P surplus, pesticide use) where impacts on human health and biodiversity do depend on the location of emissions.
In the discussion we address the question whether the environmental impacts of the Dutch agriculture could be decreased, and the sustainability of its agro-food system can be increased by outsourcing part of the agricultural production to other EU member states. Theoretically, there is a large potential in the European Union (EU) to improve allocation of agricultural production, given common environmental regulations and policies for trade and agriculture. By this, either land use for Dutch agriculture could be decreased or agricultural production on current land use could be extensified. Such a development is a possible future direction to increase achievement of national and international policy targets for biodiversity, environment and climate change (van Grinsven et al., 2018).
Materials and Methods
Eco-Efficiencies and Environmental Pressures
Eco-efficiencies are used to quantify the environmental degradation associated with the production of goods and services. de Wit (1992) stated that efforts to increase efficiency while serving both agriculture and its environment should not be so much directed toward the search for marginal returns of variable resources, as toward the search for the minimum of each production resource that is needed to allow maximum utilization of all other resources. This is an implicit warning against narrow (or exclusive as opposed to all-inclusive) approaches to maximize eco-efficiencies. The standard definition of eco-efficiency is “economic value added per unit of environmental damage” (Kuosmanen and Kortelainen, 2005) or, more simply and applied for agriculture, the level of agricultural output per unit of input of ecological resources like land water, nutrients etc. (Keating et al., 2010). However, as for the concept of sustainability, there are many other operational definitions of eco-efficiency (Gancone et al., 2017). In assessments of eco-efficiency for agriculture, environmental emissions or pollution impacts can be considered as an input, just like e.g., input of synthetic fertilizer. An example of such a pollution input is the nitrogen surplus. The resulting value added per unit of pollution is also referred to as environmental efficiency (Reinhard et al., 1999).
We calculate efficiencies of agricultural production by accounting for resource uses and environmental emissions up to the farm gate, and therefore do not consider add-on effects of food processing, food distributions or food consumption. We benchmark eco-efficiency and environmental pressure in order to assess current performance of national agricultural sectors and systems and explore the potential to improve and combine performance on both indicators.
EU Benchmark of Emissions and Resource Use for National Agricultural Sectors
Metrics and values of efficiencies and intensities of agricultural production depend on aggregation over time and space. Using the definition of eco-efficiency as “economic value added per unit environmental damage or pressure,” we calculate national efficiencies as the ratio of an emission (or use) by the agricultural sectors per unit of Gross Added Value (GVA) of agriculture. Emissions or uses related to imports of inputs for the national agricultural sector were not taken into account. Single efficiencies were calculated for land use, emission of GHG, emission of ammonia, N surplus, P surplus for the agricultural sector as a whole. In addition such efficiencies were determined for the use of pesticides (based on sales data of kg of active ingredients in plant protection products) in the arable and horticultural sector and use of antibiotics in the livestock sector (also sales data). Data for national emissions and uses apply to the period 2010–2016 and were obtained from Eurostat (GHG, ammonia, N and P surplus and pesticide use; for data see https://ec.europa.eu/eurostat/data/statistics-a-z/abc and for further explanation https://ec.europa.eu/eurostat/statistics-explained/) and the European Medicines Agency (2017) (for Antibiotic use). Next, resulting efficiencies were indexed on the average value for the EU (Supplementary Table 1). We used equal weights to calculate mean national efficiency for the seven parameters. Values for the national N and P surplus can be both negative and positive. Positive values are an indicator of potential N and P loads to water, negative values are an indicator of soil mining. N and P mining can be valued as a positive environmental impacts when the soil N and P status is very high (e.g., due to over-fertilization in the past) or as a negative impact (resource depletion) when the soil status is low. For our calculation we valued a soil N or P surplus and depletion both as negative environmental impacts. We also benchmarked emissions, surpluses and pesticide use per hectare of agricultural land, and use of antibiotics per PCU (livestock “Population Correction Unit” which accounts for differences in livestock numbers and in animal weights at the time of treatment with antibiotics).
EU Benchmark of Emissions and Resource Use at Product Level by LCA-Analysis
The score on the 5 environmental indicators (land use, GHG, emission of ammonia, N surplus, P surplus) is based on the Life Cycle Analysis (LCA) methodology. LCA collects and evaluates the inputs and outputs of a production system and its potential environmental impacts throughout its life cycle (Guinée et al., 2004). We used an attributional LCA and followed the PEF (Product Environmental Footprint) guidelines of the European Commission (Pef Guidance 6.2; 2017; Blonk Agri-footprint, 2017). For the Netherlands, Germany, France, Poland, Spain, Romania and Italy an inventory is made of the inputs and outputs of materials, energy and emissions at each stage in the life cycle of a product. This is then translated into one or more environmental impact categories. Land use and greenhouse gas emissions are part of the regular range of impact categories used in LCA. For the other 3 indicators (production value, N and P surplus and ammonia emission) indicators have been derived on the basis of the same way of thinking. Ammonia emission factors are taken from the emission factor database of European Environment Agency (2016: https://www.eea.europa.eu/publications/emep-eea-guidebook-2016/emission-factors-database) and for greenhouse gases from IPCC (https://www.ipcc-nggip.iges.or.jp/EFDB/main.php). Land use or emission per unit of agricultural product in fact is the reciprocal of the environmental efficiency.
Six products were selected that are important for Dutch agriculture: three animal products (milk, pig meat, and poultry meat) and three crop products (wheat, ware potato, and fresh tomato). For our benchmark we selected for each product the five EU-countries with the largest production sizes in 2014–2016 (see Table 5 for the countries selected), for reasons of data availability we took pork data from the Czech republic instead of Poland. The system boundary is cradle to farm gate. The functional unit is kg live weight (LW) for pork and poultry, kg FPCM (Fat-Protein Corrected Milk) for milk and kg crop for tomato, potato, and wheat. For multifunctional production processes, allocation is required for partitioning the economic and environmental effects; economic allocation was applied for milk, ingredients for concentrates (e.g., soybean), of roughage (crop residues), wheat (straw) (Blonk Agri-footprint, 2017). For milk the guidelines of the International Dairy Federation were used (IDF, 2015).
Economic value is expressed per kg of the primary product. Land use distinguishes between direct use in country and indirect land use related to import. Considered greenhouse gases (GHG) are CO2, N2O and CH4. They are expressed in kg CO2 equivalents/kg using Global Warming Potential for 100 years and the IPCC tier 2 (IPCC, 2013) and include effects of LULUCF in the past 20 years following ISO (2013) and Technical Secretariat Dairy PEF (2016) standards. Calculation of GHG emission related to LUC from imported products for animal feed takes into account the actual countries for trade in EU and an EU average for feed stuffs imported from the actual countries outside Europe. Feed data for EU countries were taken from Britz and Witzke (2012).
Calculation of N and P surplus for tomato, potato and wheat only considers inputs of synthetic fertilizer and manure, the crop harvest accounts for N output; inputs from atmospheric deposition and biological fixation were not considered in our benchmark. The manure application rates are estimated using statistics for number of animals, the manure produced and the total area on which manure can be applied (Blonk Agri-footprint, 2017; Kuling et al., 2018). This estimate represents an average amount of manure applied per hectare (independent of the crop being cultivated). In reality, the amount of manure applied will depend on the specific crop that is being grown and on the geographic and temporal availability of manure. However, such detailed information is not available for all countries considered.
The gross N and P excretion is based on the balance of N and P by feed intake and export in milk and meat and does not account for gaseous N losses from housing and storage. Emission of ammonia is accounted for across the full production chain, including emissions from housing, storage and at application to food and feed crops, using the Tier 2 approach as proposed by the European Environment Agency (2016).
For benchmarking, the five indicators for the Netherlands efficiencies were quantified using two sets of input data. The first set only used data sources that were available for all countries in the benchmark. The second set uses the best data available for the Netherlands. An example is the calculation of emissions of ammonia and nitrous oxide where the first set uses default EU emission factors and the second set uses Dutch emission factors reflecting the effect of the most recent measures. The second set also uses more accurate values for the application of manure to cropland in the Netherlands.
Results
Benchmark of Efficiencies and Pressures for National Agricultural Sectors
The aggregated eco-efficiency for national agricultural sectors vary by a factor of five (highest over lowest index in Table 3). For individual emissions or uses the range is much larger; 4.5 for pesticide use, 5.0 for ammonia emission, 11.4 for GHG emission, 12.9 for N surplus, 20.2 for use of antibiotic, 31.5 for land use and 57.1 for P surplus. The large ranges illustrate the current differences of agricultural structure and practices in the EU and also provides an indication of the scope for improvement. The five EU members states (MS) with the highest eco-efficiency are (1) The Netherlands, (2) Greece, (3) Italy, (4) France, and (5) Sweden; the bottom five (25) Czech Republic (24) Estonia, (23) Latvia, (22) Ireland, and (21) Poland (Table 3). While the worst performing countries are mostly new EU MS in Eastern and Central Europe, the top five may is a mix of countries with either high or low levels of GDP, technology, implementation of environmental regulation and intensity of agriculture. GVA per hectare varies from 170 to 5,300 euro/ha. Typical values for new MS in Eastern Europe range from 170 (Latvia) to 970 (Slovenia), values around 1,000 euro/ha are typical for the large older MS's Germany, France Denmark and the UK, while highest values are found for Belgium, Italy and a maximum of 5,300 euro/ha in the Netherlands. Differences in GVA per ha are caused by differences in agricultural structure, yields per hectare and costs of labor and capital. One important reason for the very high GVA per hectare in the Netherlands, is the presence of a large horticultural sector (greenhouse, both food and ornamental), mainly for export, and which contributes about 60% to the national GVA of the primary agricultural sector and 34% of GVA of the agro-complex.
Table 3
| Gross value added per unit of emission or use (Index 100=mean value EU) | |||||||||||
|---|---|---|---|---|---|---|---|---|---|---|---|
| Pesticides use | Antibiotics use | Ammonia emissions | N surplus | P surplus | GHG emissions | Land use | Mean score | Rank | |||
| AU | Austria | 155 | 128 | 102 | 194 | 60 | 107 | 107 | 122 | 6 | |
| BE | Belgium | 70 | 20 | 81 | 101 | 108 | 63 | 181 | 89 | 15 | |
| BU | Bulgaria | 190 | 103 | 97 | 102 | 12 | 87 | 35 | 90 | 14 | |
| CR | Croatia | 98 | 82 | 107 | 78 | 91 | 12 | ||||
| CZ | Czech Republic | 47 | 64 | 52 | 25 | 29 | 49 | 44 | 44 | 25 | |
| DK | Denmark | 150 | 64 | 91 | 94 | 75 | 75 | 112 | 95 | 9 | |
| ES | Estonia | 98 | 83 | 63 | 56 | 7 | 62 | 32 | 58 | 24 | |
| FI | Finland | 68 | 263 | 96 | 76 | 40 | 53 | 57 | 93 | 11 | |
| FR | France | 84 | 97 | 111 | 93 | 382 | 100 | 105 | 139 | 4 | |
| GE | Germany | 82 | 31 | 69 | 64 | 300 | 78 | 118 | 106 | 8 | |
| GR | Greece | 185 | 173 | 219 | 42 | 422 | 171 | 103 | 188 | 2 | |
| HU | Hungary | 69 | 41 | 94 | 56 | 44 | 133 | 60 | 71 | 18 | |
| IR | Ireland | 133 | 52 | 44 | 69 | 56 | 31 | 49 | 62 | 21 | |
| IT | Italy | 102 | 55 | 199 | 122 | 72 | 278 | 258 | 155 | 3 | |
| LV | Latvia | 45 | 109 | 52 | 88 | 60 | 33 | 18 | 58 | 23 | |
| LT | Lithuania | 79 | 204 | 76 | 109 | 36 | 64 | 38 | 87 | 16 | |
| NL | Netherlands | 180 | 89 | 205 | 150 | 125 | 144 | 556 | 207 | 1 | |
| PO | Poland | 75 | 36 | 75 | 53 | 51 | 79 | 63 | 62 | 22 | |
| PT | Portugal | 42 | 35 | 125 | 193 | 62 | 102 | 69 | 90 | 13 | |
| RO | Romania | 128 | 63 | 107 | 323 | 37 | 106 | 53 | 117 | 7 | |
| SK | Slovakia | 55 | 102 | 44 | 59 | 121 | 53 | 31 | 66 | 20 | |
| SV | Slovenia | 88 | 193 | 66 | 83 | 53 | 74 | 102 | 94 | 10 | |
| ES | Spain | 63 | 21 | 126 | 73 | 37 | 186 | 78 | 83 | 17 | |
| SE | Sweden | 150 | 403 | 83 | 90 | 116 | 68 | 60 | 138 | 5 | |
| UK | United Kingdom | 101 | 61 | 103 | 41 | 26 | 66 | 93 | 70 | 19 | |
| EU mean | 501 | 42 | 44 | 52 | 1209 | 365 | 950 | ||||
| Unit | €/g | €/mg | €/kg | €/kg | €/kg | €/g CO2-eq | €/ha | ||||
Indexed eco-efficiencies for EU28 in period 2010–2015.
Values for the small EU members states Cyprus, Luxembourg and Malta were removed from analysis. Combination of EU mean values and indices allow calculation of national values. Use of traffic light colors of green, yellow to red for index values indicates decreasing sustainability.
The high eco-efficiency for Greek agriculture is remarkable and reflects a combination of a fairly high GVA per ha and relatively low inputs of chemistry. The high efficiency is also caused by a combination of a relatively small livestock sector and low P surpluses. For France, Ireland and the Netherlands, with a large agricultural sector and contribution to EU food supply by export, attaining the efficiency of Greek agriculture likely goes along with lower inputs of agrochemicals per hectare and smaller livestock sectors. At the low end of the spectrum, the very low eco-efficiency of the Czech Republic may illustrate that new EU MS where agriculture is in transition, the increase in GVA per hectare lags behind on the increase of environmental pressure due to increased use of agro-chemistry.
The flip side of the coin for EU member states with high eco-efficiencies can be a high environmental pressure per hectare of land and the risk of local impacts of agriculture on natural ecosystems and human health. The three countries with the highest environmental pressure (with ranking for eco-efficiency also given) are the Netherlands (25; 1), Belgium (24; 15) and Italy (23; 3); those with the lowest pressure Latvia (1; 23), Lithuania (2; 16), and Slovakia (3; 20).
While the Netherlands, Italy, Slovakia and Latvia combine high and low rankings for eco-efficiency and pressure, some countries combine high rankings (Greece, Sweden, Romania, Austria, France) or low rankings (Belgium, Czech Republic, UK). The top three countries with the highest combined score, using equal weights for all environmental issues and for eco-efficiency and environmental pressure, are (1) Greece, (2) Sweden and (3) Romania (Figure 4). Also the combined score for France (rank 4), a major agricultural sector and exporter of cereals in Europe is noteworthy and Austria (5). The lowest combined scores are found for Belgium (25), the Netherlands (24) Czech Republic (23), Spain (22), and the UK (21).
Figure 4
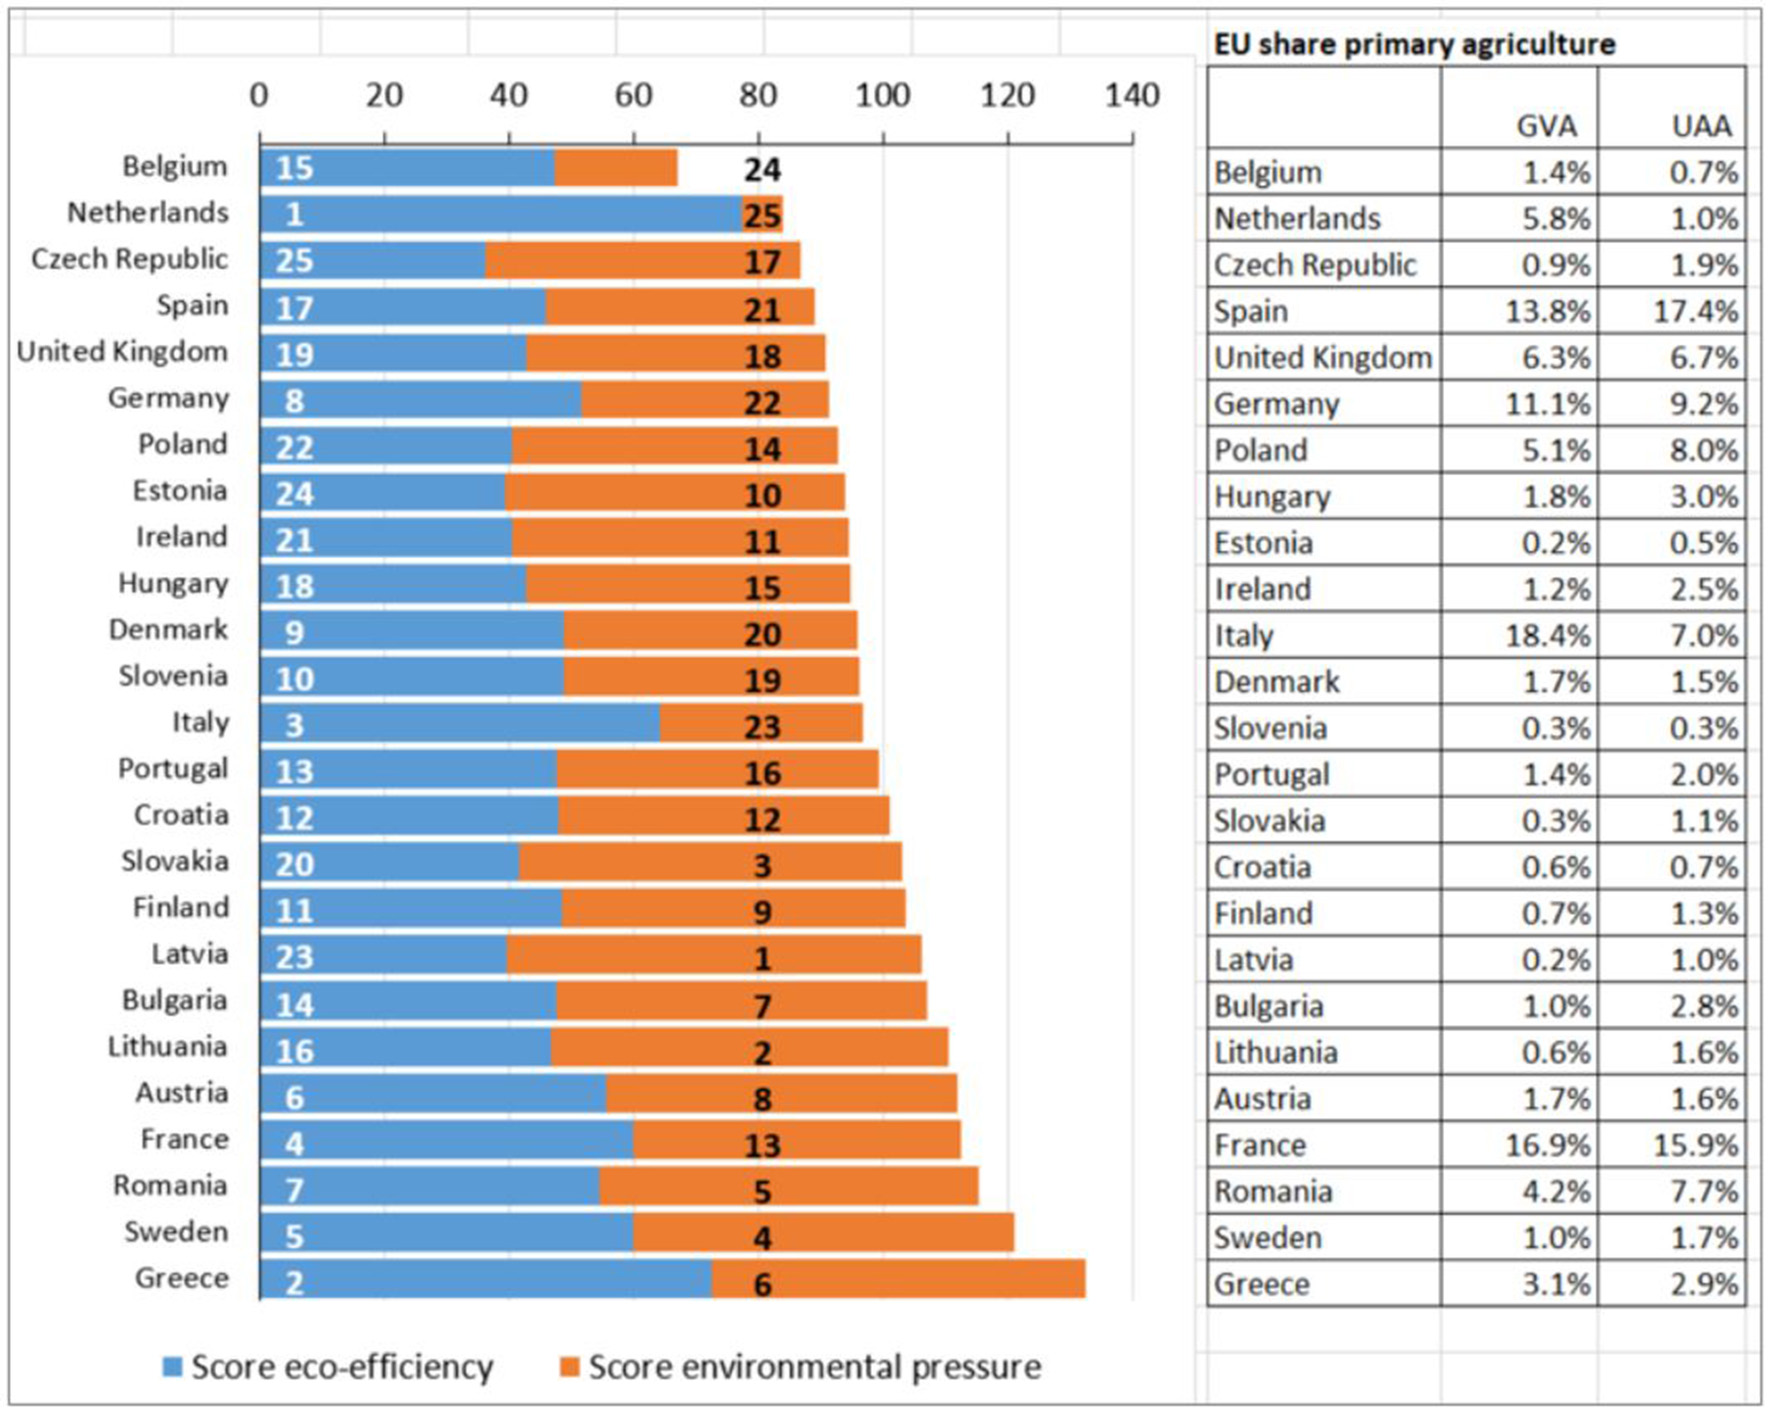
Combined score of eco-efficiency for global environmental issues in Table 3 and environmental pressure for local issues in Table 4. In order to get equal weights, both scores were indexed to obtain a mean EU score of 50. Numbers in bars are the rankings as in Tables 3, 4. In addition percentages are given for the EU share of GVA and Used Agricultural Area (UAA) of national primary agricultural sectors.
The message of the EU benchmark of eco-efficiencies and environmental pressures for national agricultural sectors seems to be that a middle of the road approach to agriculture, with a medium production intensity and use of agro-chemistry could be the way forward to increase the sustainability of European agriculture. This direction implies that environmental pressure has to decrease in the old MS and GVA has to increase in the new MS, while securing that total production satisfies current and future demand for food, fibers, fuels etc. in the EU. When developing policies in this direction, national outliers of eco-efficiency and environmental pressure should be given attention. Regarding environmental pressure (Table 4) these outliers are: pesticide use in the Netherlands, Belgium and Italy; the use of antibiotics in Spain, Italy and Hungary; ammonia emissions in the Netherlands, Belgium, Germany, and Slovenia; N and P surpluses in the Netherlands, Belgium and Denmark; nutrient mining in Estonia and Romania. Regarding low eco-efficiencies (Table 3) the outliers are: pesticide use in Portugal, Latvia and the Czech Republic; use of antibiotics in Spain, Belgium, Germany, Poland, and Portugal; ammonia emissions in Slovakia, Ireland, Latvia, Czech Republic; nutrient surplus in the Czech Republic, UK, Estonia, Poland; GHG emissions in Ireland, Czech Republic, and Latvia.
Table 4
| Emission or use per hectare UAA (PCU for antibiotics): (Index 100=mean value EU) | |||||||||
|---|---|---|---|---|---|---|---|---|---|
| Pesticides use | Antibiotics use | Ammonia emissions | N surplus | P surplus | GHG emissions | Mean score | Rank | ||
| Austria | 53 | 48 | 93 | 34 | 63 | 84 | 63 | 8 | |
| Belgium | 198 | 140 | 199 | 206 | 109 | 245 | 183 | 24 | |
| Bulgaria | 14 | 89 | 32 | 25 | 114 | 34 | 52 | 7 | |
| Croatia | 61 | 94 | 62 | 72 | 12 | ||||
| Czech Republic | 73 | 68 | 76 | 127 | 63 | 76 | 80 | 17 | |
| Denmark | 57 | 38 | 110 | 129 | 92 | 128 | 92 | 20 | |
| Estonia | 25 | 60 | 46 | 44 | 189 | 44 | 68 | 10 | |
| Finland | 64 | 19 | 53 | 80 | 86 | 93 | 66 | 9 | |
| France | 95 | 86 | 84 | 83 | 11 | 89 | 75 | 13 | |
| Germany | 111 | 147 | 154 | 143 | 17 | 128 | 117 | 22 | |
| Greece | 43 | 50 | 42 | 102 | 6 | 51 | 49 | 6 | |
| Hungary | 66 | 187 | 57 | 64 | 46 | 38 | 76 | 15 | |
| Ireland | 28 | 45 | 99 | 65 | 46 | 135 | 70 | 11 | |
| Italy | 194 | 291 | 116 | 84 | 80 | 79 | 141 | 23 | |
| Latvia | 30 | 33 | 30 | 14 | 11 | 45 | 27 | 1 | |
| Lithuania | 37 | 31 | 45 | 23 | 40 | 50 | 38 | 2 | |
| Netherlands | 236 | 68 | 242 | 286 | 195 | 329 | 226 | 25 | |
| Poland | 64 | 121 | 75 | 78 | 46 | 68 | 75 | 14 | |
| Portugal | 126 | 147 | 50 | 29 | 52 | 58 | 77 | 16 | |
| Romania | 32 | 91 | 44 | 12 | 57 | 43 | 47 | 5 | |
| Slovakia | 43 | 47 | 62 | 55 | 15 | 50 | 46 | 3 | |
| Slovenia | 89 | 29 | 139 | 91 | 80 | 117 | 91 | 19 | |
| Spain | 95 | 310 | 55 | 65 | 74 | 36 | 106 | 21 | |
| Sweden | 30 | 11 | 64 | 65 | 29 | 75 | 46 | 4 | |
| United Kingdom | 70 | 52 | 80 | 111 | 97 | 120 | 89 | 18 | |
| EU mean | 2.48 | 115 | 24.3 | 57.9 | 4.37 | 3.06 | |||
| Unit | kg/ha | mg/PCU | kg/ha | kg/ha | kg/ha | tCO2-eq/ha | |||
Indexed environmental pressure per hectare of agricultural land for EU28 in period 2010–2015 (for antibiotics per PCU).
N and P surplus were negative in some countries and therefore the absolute value was used for indexing. Values for the small EU members states Cyprus, Luxembourg and Malta were removed from analysis. Use of traffic light colors of green, yellow to red for index values indicates decreasing sustainability.
Using mean scores to rank eco-efficiency and environmental pressure in Tables 3, 4 does not yet make a distinction between global and local environmental issues. Figure 5, however, does plot mean scores for eco-efficiency for global environmental issues (land use, GHG, and antibiotics) against the score for environmental pressure for local issues (NH3 emission, N and P surplus, pesticide use) and clearly reveals that Dutch, and to a lesser extent also Belgian and Italian, agriculture take outlying positions. Agriculture in Sweden and Greece appear to be more successful in combining relatively high eco-efficiencies with low environmental pressure per hectare. We do acknowledge that giving equal weights to the five selected indicators of environmental pressure is arbitrary.
Figure 5
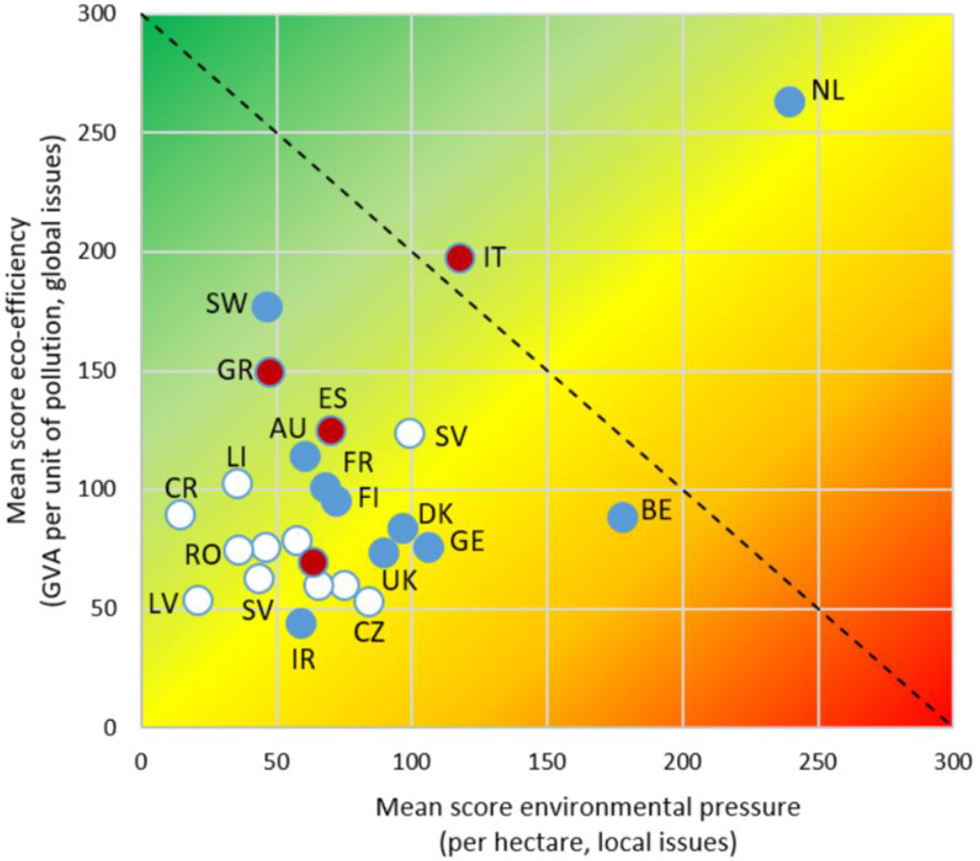
Combined score of eco-efficiency for global environmental issues (GVA per unit of land use, GHG emission, and antibiotic use) against environmental pressure for local issues (NH3 emission, N and P surplus, pesticide use). Marker colors indicate EU region, blue: northwest and central EU15 old MS, red south EU15 old MS; white Central and Eastern EU13 new MS.
Highlights of Differences in Production of Selected Agricultural Products Between Countries
To see whether the high score for eco-efficiency of the agricultural sector in the Netherlands also holds for individual products, six of them were benchmarked against other main producers in Europe. For this benchmark an important notion is that differences between national eco-efficiencies and also emission or resource per unit of agricultural product to a large extent are the result of different production systems e.g., regarding availability and use of local feeds and forages in livestock farming and manure in crop farming, or the presence of mixed or specialized farms. National production systems were analyzed in detail for the LCA approach and some highlights are summarized below to help understand results for different scores for the same product in different countries: (for details see Supplementary Table 2).
Dairy Production
Farm gate prices for dairy in Italy (IT) are with 0.40 €/kg FPCM 0.06–0.08 €/kg higher than in the Netherlands (NL), France (FR) and Germany (GE) and even 0.13 €/kg higher than in Poland (PL). High prices as in IT increase the eco-efficiency. The use of agricultural land per kg FPCM is between 1.0 and 1.2 m2 in NL, GE, FR and IT, which is almost twice as low as in Poland (PL). The share of land for feed used abroad ranges from about 20% in GE, FR and PL to 40% in IT and 47% in NL.
Pork Production
Farm gate prices for pork are around 1.2 €/kg LW in GE, Czech Republic (CZ) and Spain (ES), while being 0.1 €/kg lower in NL and 0.1 €/kg higher in France. Land use per kg LW varies considerably; from 3.5 m2 in GE, FR and NL up to 5.2 m2 in CZ and 6 m2 in ES, reflecting differences in feed conversion efficiencies. The share of land use related to imported feed ranges from 2% in CZ, to 20% in FR to almost 30% in GE and ES to over 90% in NL.
Poultry Meat Production
Farm gate prices for chicken meat range from around 0.9 €/kg LW in GE, NL and Poland (PL), to 1.2 €/kg in ES and 1.8 €/kg in France. Chicken meat is traded in regional French markets at considerably higher prices than on the common EU market. Land use per kg LW is between 2.5 and 2.8 m2 in GE, FR and NL up to 3.3 m2 in PL and 3.5 m2 in ES, reflecting lower feed conversion efficiencies in the latter two countries. The share of land used abroad ranges from 36% in PL, to 42% in FR, to around 55% in GE and ES to over 90% in NL.
Ware Potato
Farm gate prices in FR and RO (0.3–0.4 €/kg) are much higher than in GE, NL, and PL (0.1–0.2 €/kg), again, indicating the presence of local markets with higher prices. Land use per kg of potato shows an opposite pattern with low values (so high yields) ranging from 0.22 to 0.25 m2/kg in NL, GE and FR, and high values in PL (0.52) and RO (0.92).
Wheat
In contrast to potato, wheat prices are uniform across the EU around 0.21 €/kg. Sale of straw adds on an average 0.06 €/kg to the income from wheat cultivation. Land use per kg of wheat ranges from 0.96 to 1.14 m2/kg in NL, GE and FR, while in PL it is 1.9 and in RO 2.6 m2/kg.
Fresh Tomato
Price per kg ranges from 1.9 €/kg in IT to 1.2 €/kg in FR to 0.95 €/kg in NL and ES. Farm gate price differences in part are caused by different cultivars. While IT predominantly produces higher priced cherry tomatoes, other countries also grow larger and cheaper fresh tomatoes. Land use per kg shows a wide range, which in part is caused by dominant cultivation in greenhouses in NL and ES, while in FR and IT, respectively 40 and 60% of fresh tomatoes are cultivated outdoor in arable systems. Land use per kg is 0.02 m2 in NL, 0.05 m2 in FR, 0.12 m2 in ES, and 0.28 m2 in IT.
Benchmark of Greenhouse Gas Efficiencies for Agricultural Products
Greenhouse gas emissions for dairy in NL, GE, FR and IT are very comparable around 1.7 kg CO2 eq/kg FPCM (Figure 6). Main GHG sources are enteric methane formation and N2O from national forage production. In PL GHG emissions are significantly higher due to lower feed conversion ratios (FCR) and, consequently, also higher enteric methane production. Using more accurate national data on Dutch feed use as an alternative for harmonized EU data from the CAPRI model (Britz and Witzke, 2012) slightly decreases GHG emissions for NL dairy.
Figure 6

Greenhouse gas footprints and breakdown of sources for dairy, pork, and broiler systems, including contribution by land use change.
For pork, total GHG values are quite comparable around 3 kg CO2 eq/kg LW. GHG emissions in NL are slightly higher than in GE and FR in spite of more efficient feed conversion (lower FCR in kg LW per kg feed; see Supplementary Table 2) and due to higher GHG emission related to the origin of imported feed (Figure 6). GHG emissions for PL and IT are considerably higher due to lower FCRs. In NL, imported feed is by far the largest source of GHG, while in other countries contributions from domestic and imported feed are comparable. Using more accurate national data on average daily growth, litter size (number of piglets per litter), litters per sow per year, and parameters for methane losses from manure, the net CO2-eq GHG emission for the Netherlands increases, mainly due to higher estimates of methane emission from manure storages.
For broiler systems, emissions in NL, GE, FR, ES and PL are very comparable (Figure 6), ranging between 2.0 and 2.3 kg CO2 eq/kg LW, irrespective if more accurate data are used for NL, indicating that technology and management, and resulting performance in broiler systems in the five considered countries are similar and more comparable than for pigs and dairy.
In conclusion, for pork and poultry GHG footprints related to feed have the largest share in total GHG footprints. Differences between countries are related to the FCR, while whether countries import most of their feed (NL) or whether they produce it themselves (GE, FR) has a much smaller effect on the GHG footprint.
For dairy, the share of GHG emission due to LUC -historic conversion of natural land to land for cultivation of feed crops- ranges from 11% (GE and FR) to around 20% for NL and IT (Figure 6 and Supplementary Table 2). Differences are caused in the use of peat lands for grazing and origin of feed imports. Further differences are caused by differences in the relative shares of local fodder (grass, forage maize) and by regions from which feed stuffs (soy cakes, cereals) for concentrated feed are imported. For pig production the shares of GHG from LUC are similar to dairy but vary less between the selected countries (13–18%) because feed rations are more similar. For poultry the shares of GHG from LUC are much higher due to larger shares of imported soy cakes and corn in rations, ranging from 36% in PL and 42% in FR to 93% in NL. So particularly for broiler systems in the EU, the GHG footprint is fairly independent of the location. Emission related to LUC are for 90% or more due to imported feed, mainly soy products from outside the EU.
For cultivation of ware potato and wheat in Europe the dominant source of GHG is emission of N2O (Figure 7) and due to use of N fertilizers (synthetic and manure). The composition of the GHG profile of crop products is much simpler than for animal products as there are only a few upfront processes. GHG emissions due to LUC only due to discounting for local LUC in the past 20 years and therefore small for EU countries. GHG emissions for ware potatoes in NL and RO are between 0.09 and 0.10 kg CO2 eq per kg, and considerably higher than in GE, FR and PL (Figure 7). For NL this is due to the high emissions of N2O caused by the high inputs of total N from both synthetic fertilizer and manure, adding to around 300 kg/ha, as compared to 160–175 kg/ha in GE and FR and 60–70 kg/ha in PL and RO (see Supplementary Table 2). Application rates of manure and associated N2O emissions in NL are 5–15 times higher than in the other four countries (see Supplementary Materials). High manure use in NL is caused by the combination of the high national availability of manure in NL and the use of statutory fertilizer equivalencies (FEV) for manure N in the EU (Webb et al., 2013). For the Netherlands, FEVs range from 0.45 to 0.7 and allow exchange of 1 kg of synthetic N by 1.5 to more than 2 kg of manure N, as long as the maximum amount of 170 kg N is not exceeded, as required by EU Nitrates directive (van Grinsven et al., 2012). This effect cancels out the reduction of GHG emission per kg of Dutch potato production by the higher yields. These effects persist when we use best available data instead of harmonized data for NL. In the best data variant we account for export of about one quarter of the national Dutch manure production (40 million tons of P2O5 of a total national production of about 175) to allow compliance with legal application standards for N and P2O5. In RO the high GHG foot print is related to lowest yield per hectare.
Figure 7

Greenhouse gas profiles for ware potato, wheat, and fresh tomato (note different scales of Y-axes).
For wheat similar results are found as for potato, but differences between countries are smaller because, compared to potato, N fertilization of wheat in other countries is somewhat higher and for NL somewhat lower (Figure 7). In the best data variant the Dutch GHG profile becomes comparable to that of the other countries.
For Dutch tomato, the dominant source of GHG is direct and indirect use of fossil fuel. The positive effect of higher yields on the GHG profile is partly canceled out by the high use of fossil energy to heat Dutch greenhouses (Figure 7). However, Dutch greenhouse systems increasingly produce electricity and heat from renewable energy sources (solar and geothermal), which improves the GHG profile. Conversely, the decrease of GHG profiles in FR, ES and IT by growing tomato outdoor is canceled out by far lower yields than in NL.
Benchmark of Nutrient Efficiencies for Agricultural Products
While for GHG the location of the emission is irrelevant for the impact on climate, location is relevant for emission of nitrate, phosphorus, and ammonia and its impacts on human health and ecosystems. Particularly emissions of ammonia are a reason for concern in Europe in view of significant contributions to health damage by air pollution (Pozzer et al., 2017) and loss of terrestrial biodiversity (Sutton et al., 2011). Ammonia profiles for livestock products in NL, GE and FR are quite similar when using harmonized EU data (Table 5). However, when using best data for NL, accounting for effects of stringent ammonia policies both for controlling emission from housing and manure application, ammonia profiles are about twice as low. This illustrates that, in contrast to GHG profiles, end-of-pipe measures to a large extent mitigate ammonia pollution.
Table 5
| Product | NL | NL spec | GE | FR | IT | ES | PO | CZ | RO |
|---|---|---|---|---|---|---|---|---|---|
| N surplus (g N / kg product) | |||||||||
| Milk | 26.1 | 16.5 | 25.6 | 26.3 | 30.3 | 34.3 | |||
| Pork | 31.1 | 38.8 | 36.4 | 35.4 | 33.2 | 46.6 | |||
| Poultry | 20.1 | 21.8 | 19.0 | 22.7 | 22.5 | 20.1 | |||
| Ware potato | 3.7 | 2.6 | 0.5 | 0.7 | −0.1 | 0.6 | |||
| Wheat | 23.0 | 5.7 | 2.3 | 4.3 | 3.6 | −5.6 | |||
| Fresh tomato | 1.5 | 4.5 | 2.1 | 6.3 | |||||
| P surplus (g P / kg product) | |||||||||
| Milk | 3.0 | 2.4 | 2.9 | 3.3 | 3.2 | 4.4 | |||
| Pork | 4.7 | 6.7 | 5.6 | 5.5 | 5.1 | 7.5 | |||
| Poultry | 2.1 | 3.4 | 1.9 | 2.4 | 2.4 | 2.1 | |||
| Ware potato | 0.9 | 0.2 | 0.4 | 0.4 | 0.2 | 0.3 | |||
| Wheat | 2.7 | −0.9 | −1.3 | −1.7 | 1.0 | −1.7 | |||
| Fresh tomato | 0.0 | 0.1 | 1.1 | 2.0 | |||||
| Ammonia emission (g NH3/ kg product) | |||||||||
| Milk | 14.1 | 7.7 | 14.6 | 14.9 | 17.4 | 16.6 | |||
| Pork | 24.4 | 13.7 | 27.1 | 28.1 | 29.1 | 37.1 | |||
| Poultry | 15.0 | 6.6 | 13.6 | 15.6 | 16.8 | 14.9 | |||
| Ware potato | 1.4 | 0.4 | 0.6 | 0.6 | 0.6 | 0.8 | |||
| Wheat | 7.0 | 2.2 | 2.9 | 2.9 | 3.1 | 2.1 | |||
| Fresh tomato | 3.1 | 2.9 | 2.9 | 7.0 | |||||
Nutrient losses in gram per kilogram of agricultural product for a selection of commodities and EU countries (milk per kg FPCM, pork, and poultry per kg live weight).
The consequence of ammonia reduction is an increase of the nitrogen content in manure, which, on the one hand, potentially increases the beneficial use of N by crops, on the other hand, increases the risk of leaching and water pollution. For livestock products the N and P surplus is calculated at animal level and in fact are gross excretions; for crop products N and P surplus are quantified at soil level. Therefore, the surplus for livestock products are less indicative for impacts than surplus for crop product. When using harmonized EU data, the N surplus per kg milk in NL, GE, and FR is very similar and lower than for IT and PO, mainly because of higher milk yields per unit of land and cow (Table 5). Using best data for the Netherlands, N excretion decreases by 37% and is caused by lower average N in Dutch feed rations. P excretions per kg milk are similar in NL, GE, FR, and also IT, but in CZ higher due to lower yields and FCRs. Using specific Dutch data lowers P excretion by 20%, again due to use of low P feed concentrates. In NL there is an economic incentive in dairy farming to use low N and P feed, as this reduces the cost of manure disposal (van Grinsven and Bleeker, 2017). For meat production, using harmonized data results in comparable N excretions, for pork ranging from 31 (NL) to 36 (GE) g/kg and for poultry ranging from 20 (NL and PO) to 23 (FR) g/kg. For P differences between countries are similar as for N (Table 5). Excretions in CZ are higher due to lower FCR. In contrast to milk, using best data for NL increase excretions to values exceeding those in all countries but CZ. N and P contents in Dutch feed are higher than default values we used for EU feed compounds. In contrast to the dairy sector, for most Dutch pig and poultry farmers there is no economic incentive to buy feed with low N and P contents. The feed is more expensive and, as most farms are nearly landless, all manure needs to be disposed in any case.
For crops only results for potato and wheat are relevant, as the acreage for tomato is very small and tomato cultivation hardly contributes to eutrophication. Irrespective of use of harmonized data or best data, N surpluses in NL are higher than in all countries due to high fertilizer inputs and the high share of manure N. P surpluses for both crops vary strongly between countries, with generally negative values for wheat (except PO) and low P surpluses for potato (Table 5). When using harmonized values, P surpluses for NL are the highest, when using best data (correction for manure export) they are in the same range as for other countries.
Synthesis Benchmark Efficiencies for Agricultural Products
When aggregating the indexed scores for land use and the four impacts, results indicate that Dutch environmental performance for the six products studied, even when using best data, differs not very much from that in Germany and France, but generally is better than in developing agricultural systems in Poland, Czech Republic, Romania, and agriculture in the Mediterranean countries Spain, Italy (Table 6). Environmental performance of fresh tomatoes in the Netherlands stands out, but its contribution to environmental pollution and resource use is small. The position of the Dutch arable sector is somewhat ambiguous due to large differences of scores when using harmonized EU data and best national data. Further, scores for especially Germany and France could also improve when using best national data and taking their national policies into account.
Table 6
| Product | Netherlands | Germany | France | Poland Czech Republic | Spain Romania Italy | |
|---|---|---|---|---|---|---|
| EU data | Best data | |||||
| Milk | 0.91 | 0.73 | 0.91 | 0.92 | 1.28 | 0.99 |
| Pork | 0.86 | 0.88 | 0.92 | 0.91 | 1.21 | 1.10 |
| Poultry | 0.98 | 0.93 | 0.89 | 0.98 | 1.03 | 1.11 |
| Ware potatoes | 1.54 | 0.88 | 0.70 | 0.75 | 0.74 | 1.26 |
| Wheat | 1.52 | 0.70 | 0.71 | 0.81 | 0.91 | 1.05 |
| Fresh tomatoes | 0.53 | 0.53 | 0.84 | 1.18 | ||
Mean environmental pressure index for land use, greenhouse gas emission, nutrient surplus, and ammonia emission per kg of product. Scores for N and P surplus are combined, as well as the scores for tomato in Spain and Italy.
Use of traffic light colors of green, yellow to red for index values indicates decreasing sustainability.
This raises the issue of uncertainties. These were not quantified for this study, but a previous study on the GHG footprint of pig production systems in the Netherlands, Germany, Denmark and the UK estimated uncertainties at 10–15% (Kool et al., 2009). If this uncertainty would apply to indexed scores in Table 6, together with the fact that we lack best data variants for other countries, this would confirm that differences between NL, GE and FR in environmental performance for all six products, and with respect to potato and wheat also for PO, are not substantial. Differences between NL and all other countries are significant for livestock products and tomato only. Assuming a generic uncertainty of 15% also indicates that Dutch dairy may perform somewhat better than in GE and FR.
As for the analysis at national sector level, we visualize the presence trade-offs between local and global environmental impacts and the position of product performance for the different countries by plotting the aggregated score for N and P surplus and ammonia against land use and greenhouse gas emission per kg of product (Figure 8). There is weak tendency that local pollution increases with increasing use of land and emission of GHG. Countries with a high index (>1) for land use and GHG are almost exclusively in Central, Eastern and Southern EU. When using best Dutch data (NLs) most other scores are in a narrow cluster, where NL does not stand out.
Figure 8
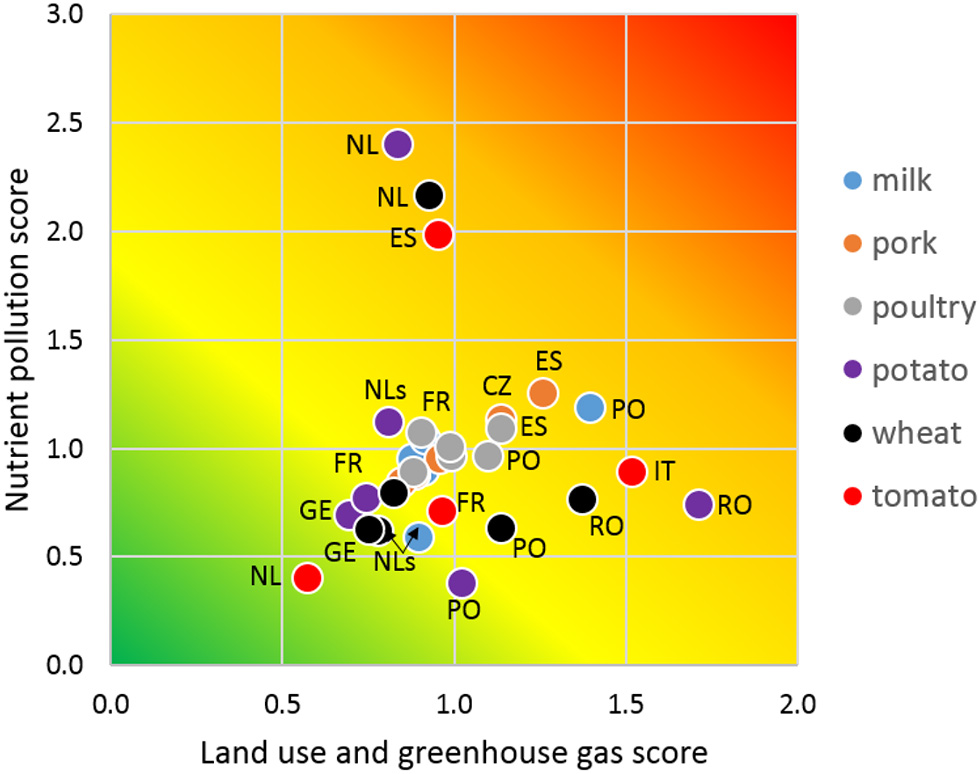
The relation between local nutrient pollution impacts of agricultural products against potentially global impacts of land use and greenhouse gas emission.
Discussion and Conclusions
Our analysis leads to acceptance of our hypothesis that environmental pressure and GHG emission per unit of agricultural product in the Netherlands are not notably different from those for other Northwest European countries. Due to high yields, land use for arable and horticultural products in the Netherlands is low compared to the other countries studied. However, nitrogen surplus and GHG emission per unit of product are relatively high for the arable products from the study, due to the large share of manure in fertilizer application. The associated increase of losses of reactive nitrogen and GHG (N2O and CH4) is not compensated by the high yields. For tomato, GHG emission per kg are average despite the large amount of natural gas used for heating greenhouse. The environmental pressure per kilogram of pork or chicken meat in the Netherlands is not much different from that in Germany or France and probably also not per liter of milk.
In view of the “hole-in-the-pipe-concept,” risks of negative feedbacks and pollution swapping regarding the environmental quality tend to be higher for end-of-pipe measures (Davidson et al., 2000) and lower for more fundamental structural measures, like restriction of consumptive demand or reduction of the most pollution economic activities. There is an ongoing and tenacious political debate in the Netherlands about reduction of the livestock sector in view of climate and environmental issues, but until now there was no political support for direct policies in this direction, or more general, interventions to change the structure of demand and supply in the Dutch agro-food system. However, structural policies are anew on the table in the implementation of PCA in the Netherlands and the negotiations on the national climate agreement. The recent vision of the Dutch government on the future of agriculture shows an increasing ambition to reduce GHG emissions, environmental impacts and make agricultural more circular and nature inclusive (Ministry of Agriculture Nature and Food Quality of the Netherlands, 2018). However, this vision does not mention the ambition to reduce the production volume of most polluting agricultural sectors, except for the pig sector. The Dutch government has reserved a budget of 120 million euro for reduction of the pig stock, which would allow a buy up of maximum of 5% of the current stock (Hekkenberg and Koelemeijer, 2018). But livestock could also be reduced as an indirect effect of increased production costs due to stricter environmental regulations to reduce emissions of GHG, ammonia, nitrate, and phosphorus. When foreign demand for livestock products remains unchanged, a reduction of livestock in the Netherlands likely would cause an increase of livestock elsewhere in the EU or in the America's.
Our results indicate that claims in politics and business that relocation of meat and dairy production to elsewhere in the EU would cause a net increase of environmental emissions are not valid. When embedded in adequate policy schemes, moving some of the Dutch livestock farming elsewhere may reduce environmental and nature problems in the Netherlands, and without risks of increased GHG emissions and land use. Important aspects to take into account for optimal allocation of agricultural production in Europe are, among others, natural differences in environmental efficiencies of regional land based agriculture and differences in sensitivities of ecosystems and emission-exposure relation for humans and ecosystems. For example, critical loads of terrestrial ecosystems in Eastern EU tend to be higher than in northwestern EU (van Grinsven et al., 2018). Concerns are legitimate that an increase of livestock production in Central, Eastern and Southern Europe on short-term will be accompanied by expansion and intensification of feed production and which would increase the total environmental impact of EU agriculture. These risks could, however, be managed and reduced by a combination of targeted EU economic and environmental, regionally differentiated, policies guiding environmentally responsible growth. Ideally, developments in this direction should be accompanied by programs to transfer knowledge and technology in order to narrow the gap between resource use efficiencies between these regions and Northwest European agriculture.
A dilemma in our analysis is the relative weighting of global vs. local environmental issues. Because the agro-food system creates a multitude of environmental effects brought about by specific agricultural practices and production systems, it is important to look for integrative indicators for the suite of possible impacts. Our analysis suggests that in Europe there are no national agricultural systems for specific products that can combine high eco-efficiencies, efficient land use and low GHG emissions, with low local environmental pressure. This dilemma touches the discussion on land sparing or land sharing. Extensive field data suggest that impacts on biodiversity would be greatly reduced through boosting yields on existing farmland so as to spare remaining natural habitats (Phalan et al., 2011). However, high-yield farming may generate high levels of externalities such as greenhouse gas emissions and nutrient losses. But these metrics also underestimate the overall impacts of lower-yield systems (Balmford et al., 2018). Therefore, accomplishment of sustainable, eco-efficient agriculture systems demands difficult societal choices, including reduction of consumption of food products with high resource use and pollution profiles (UNEP, 2016; Kok et al., 2018). Moreover, aiming for high productivity or high eco-efficiency ignores immaterial aspects of sustainability (e.g., soil fertility and animal welfare) and planetary boundaries such as those for N, P, and GHG (Steffen et al., 2015).
In conclusion, solution of the global climate and biodiversity problems and local or regional—sometimes transboundary- eutrophication problems would benefit from a European rather than a national approach. Reduction of livestock in the Netherlands could be an alternative for current choices in the draft climate agreement to reduce national GHG emissions by reduced peat drainage and improved manure managements, because of more certain national GHG reduction and more side-benefits for air and water quality. The most important barrier for such an approach, including optimal allocation of production targets and resources to European regions are loss of vested economic interests and returns from current infrastructure of the agro-food supply chain and investments in a new production infrastructure elsewhere (van Grinsven et al., 2018). Also optimization targets can be problematic in view of existing and changing national values regarding climate or biodiversity, and food and sustainability in general (Candel and Pereira, 2017; de Krom and Muilwijk, 2018). There appears to be a need for development of new narratives and scenarios for exploring options for an EU agro-food system with minimum resource use, GHG emission and environmental pollution, that consider, in addition to alternative diets, also alternative economic structure and spatial layout. These narratives could be superimposed on the current set of IPCC shared socio-economic pathway scenarios (Van Vuuren et al., 2017).
Statements
Author contributions
HvG was the lead author and carried out the analysis for national agro-food sectors. MvE synthesized the LCA results, and together with SK drafted the policy conclusions and with HW reviewed and co-authored.
Acknowledgments
We thank Lody Kuling and Hans Blonk of Blonk Consultants (Gouda, NL) for doing the LCA and for their helpful comments to the manuscript.
Conflict of interest
The authors declare that the research was conducted in the absence of any commercial or financial relationships that could be construed as a potential conflict of interest.
Supplementary material
The Supplementary Material for this article can be found online at: https://www.frontiersin.org/articles/10.3389/fsufs.2019.00013/full#supplementary-material
- EU-MS
European Union Member State
- FPCM
Fat-Protein Correct Milk
- FCR
Feed Conversion Ratio
- FEV
fertilizer equivalency
- GVA
gross value added
- NEC
National Emission Ceilings
- ND
Nitrates Directive
- LUC
Land Use Change
- LW
Live Weight
- PCA
Paris Climate Agreement
- PM
Particulate Matter
- WFD
Water Framework Directive.
Abbreviations
References
1
BalmfordA.AmanoT.BartlettH.ChadwickD.CollinsA.EdwardsD.et al. (2018). The environmental costs and benefits of high-yield farming. Nat. Sustain. 1, 477–485. 10.1038/s41893-018-0138-5
2
BaudryJ.PéneauS.AllèsB.TouvierM.HercbergS.GalanP.et al. (2017). Food choice motives when purchasing in organic and conventional consumer clusters: focus on sustainable concerns (the NutriNet-Santé cohort study). Nutrients9:88. 10.3390/nu9020088
3
Blonk Agri-footprintB. V. (2017). Agri-Footprint 3.0–Part 1: Methodology and Basic Principles, Part 2: - Description of Data. Gouda. Available online at: http://www.agri-footprint.com/users/#methodology
4
BritzW.WitzkeH.-P (Eds.). (2012). CAPRI Model Documentation 2012. University Bonn. Available online at: http://www.capri-model.org/dokuwiki/doku.php?id=starthttp
5
CandelJ. J. L.PereiraL. (2017). Towards integrated food policy: main challenges and steps ahead. Environ. Sci. Policy73, 89–92. 10.1016/j.envsci.2017.04.010
6
DavidsonE. A.KellerM.EricksonH. E.VerchotL. V.VeldkampE. (2000). Testing a conceptual model of soil emissions of nitrous and nitric oxides. AIBS Bull. 50, 667–680. 10.1641/0006-3568(2000)050%5b0667:TACMOS%5d2.0.CO;2
7
de KromM.MuilwijkH. (2018). Perspectieven op Duurzaam Voedsel. Pluriformiteit in Debat en Beleid. Den Haag: PBL.
8
de WitC. T. (1992). Resource use efficiency in agriculture. Agric. Syst. 40, 125–151. 10.1016/0308-521X(92)90018-J
9
European Environment Agency (2016). EMEP/EEA Air Pollutant Emission Inventory Guidebook 2016 Technical Guidance to Prepare National Emission Inventories. Copenhagen: European Environment Agency (EEA).
10
European Medicines Agency (2017). European Surveillance of Veterinary Antimicrobial Consumption, 2017. ‘Sales of Veterinary Antimicrobial Agents in 30 European Countries in 2015'. (EMA/184855/2017).
11
GanconeA.PubuleJ.RosaM.BlumbergaD. (2017). Evaluation of agriculture eco-efficiency in Latvia. Energy Procedia128, 309–315. 10.1016/j.egypro.2017.08.318
12
GuinéeJ. B.HeijungsR.HuppesG. (2004). Economic allocation: examples and derived decision tree. Int. J. Life Cycle Assess. 9, 23–33. 10.1007/BF02978533
13
HekkenbergM.KoelemeijerR. (2018). Analyse van het Voorstel Voor Hoofdlijnen van het Klimaatakkoord. Den Haag: PBL.
14
IDF (2015). A Common Carbon Footprint Approach for Dairy – the IDF Guide to Standard Life Cycle Assessment Methodology. Bulletin of the International Dairy Federation (2015). Available online at: https://www.fil-idf.org/wp-content/uploads/2016/09/Bulletin479-2015_A-common-carbon-footprint-approach-for-the-dairy-sector.CAT.pdf
15
IPCC (2013). Climate Change 2013 - The Physical Science Basis. Intergovernmental Panel on Climate Change.
16
IPCC (2018). Summary for Policymakers. Version as Formally Approved at the First Joint Session of Working Groups I, II and III of the IPCC and Accepted by the 48th Session of the IPCC, Incheon: IPCC.
17
ISO (2013). ISO/TS 14067: Greenhouse Gases — Carbon Footprint of Products — Requirements and Guidelines for Quantification and Communication. ISO.
18
KeatingB. A.CarberryP. S.BindrabanP. S.AssengS.MeinkeH.DixonJ. (2010). Eco-efficient agriculture: concepts, challenges, and opportunities. Crop Sci. 50 (Suppl. 1), S109–S119. 10.2135/cropsci2009.10.0594
19
KokM. T.AlkemadeR.BakkenesM.van EerdtM.JanseJ.MandrykM.et al. (2018). Pathways for agriculture and forestry to contribute to terrestrial biodiversity conservation: a global scenario-study. Biol. Conserv. 221, 137–150. 10.1016/j.biocon.2018.03.003
20
KoolA.BlonkH.PonsioenT.SukkelW.VermeerH. M.de VriesJ. W.et al. (2009). Carbon Footprints of Conventional and Organic Pork: Assessments of Typical Production Systems in the Netherlands, Denmark, England and Germany. Gouda: Blonk Milieu Advies BV.
21
KulingL.BlonkH.KoolA.van PaasenM. (2018). Verkennende Vergelijking Milieu-Efficiëntie Van Agro Productie. Gouda: Blonk Milieu Advies BV.
22
KuosmanenT.KortelainenM. (2005). Measuring eco-efficiency of production with data envelopment analysis. J. Indust. Ecol. 9, 59–72. 10.1162/108819805775247846
23
Ministry of Agriculture Nature Food Quality of the Netherlands (2018). Agriculture, Nature and Food: Valuable and Connected; The Netherlands as a Leader in Circular Agriculture. Ministry of Agriculture Nature and Food Quality of the Netherlands. Available online at: https://www.government.nl/documents/policy-notes/2018/11/19/vision-ministry-of-agriculture-nature-and-food-quality---english
24
National Geographic Magazine (2017). This Tiny Country Feeds the World: Agricultural Giant Holland is Changing the Way We Farm, by Frank Viviano. Available online at: https://www.nationalgeographic.com/magazine/2017/09/holland-agriculture-sustainable-farming/
25
PBL (2018). Balans van de Leefomgeving 2018. Nederland duurzaam vernieuwen, Den Haag.
26
PhalanB.OnialM.BalmfordA.GreenR. E. (2011). Reconciling food production and biodiversity conservation: land sharing and land sparing compared. Science333, 1289–1291. 10.1126/science.1208742
27
PozzerA.TsimpidiA. P.KarydisV. A.De MeijA.LelieveldJ. (2017). Impact of agricultural emission reductions on fine-particulate matter and public health. Atmos. Chem. Phys. 17:12813–12826. 10.5194/acp-17-12813-2017
28
ReinhardS.LovellC. K.ThijssenG. (1999). Econometric estimation of technical and environmental efficiency: an application to Dutch dairy farms. Am. J. Agric. Econ. 81, 44–60. 10.2307/1244449
29
SteffenW.RichardsonK.RockströmJ.CornellS. E.FetzerI.BennettE. M.et al. (2015). Planetary boundaries: Guiding human development on a changing planet. Science347, 1259855. 10.1126/science.1259855
30
SuttonM. A.OenemaO.ErismanJ. W.LeipA.van GrinsvenH.WiniwarterW. (2011). Too much of a good thing. Nature472:159–161. 10.1038/472159a
31
Technical Secretariat Dairy PEF. (2016). Product Environmental Footprint Category Rules Guidance for Dairy Products.
32
UNEP (2016). Food Systems and Natural Resources. A Report of the Working Group on Food Systems of the International Resource Panel, eds WesthoekH.IngramJ.Van BerkumS.ÖzayL.HajerM. UNEP.
33
United Nations Department of Economic Social Affairs (2018). Available online at: http://data.trendeconomy.com/dataviewer/trade/statistics/commodity_h2 (Accessed Decemeber 10, 2018).
34
van GrinsvenH. J.TiktakA.RougoorC. W. (2016). Evaluation of the dutch implementation of the nitrates directive, the water framework directive and the national emission ceilings directive. NJAS-Wageningen J. Life Sci. 78, 69–84. 10.1016/j.njas.2016.03.010
35
van GrinsvenH. J.van DamJ. D.LesschenJ. P.TimmersM. H.VelthofG. L.LassalettaL. (2018). Reducing external costs of nitrogen pollution by relocation of pig production between regions in the European Union. Reg. Environ. Change18, 2403–2415. 10.1007/s10113-018-1335-5
36
van GrinsvenH. J. M.BleekerA. (2017). Evaluation Manure and Fertilisers Act 2016: Synthesis Report. PBL Netherlands Environmental Assessment Agency. Available online at: https://www.pbl.nl/sites/default/files/cms/publicaties/pbl-2017-evaluation-of-the-manure-and-fertilisers-act-2016-2779.pdf.
37
van GrinsvenH. J. M.ErismanJ. W.de VriesW.WesthoekH. (2015). Potential of extensification of European agriculture for a more sustainable food system, focusing on nitrogen. Environ. Res. Lett. 10:025002. 10.1088/1748-9326/10/2/025002
38
van GrinsvenH. J. M.Ten BergeH. F. M.DalgaardT.FratersB.DurandP.HartA.et al. (2012). Management, regulation and environmental impacts of nitrogen fertilization in northwestern Europe under the Nitrates Directive: a benchmark study. Biogeosciences9, 5143–5160. 10.5194/bg-9-5143-2012
39
Van VuurenD. P.StehfestE.GernaatD. E.DoelmanJ. C.Van den BergM.HarmsenM.et al. (2017). Energy, land-use and greenhouse gas emissions trajectories under a green growth paradigm. Glob. Environ. Change42, 237–250. 10.1016/j.gloenvcha.2016.05.008
40
WebbJ.SørensenP.VelthofG.AmonB.PintoM.RodheL.et al. (2013). An assessment of the variation of manure nitrogen efficiency throughout Europe and an appraisal of means to increase manure-N efficiency. Adv. Agron. 119, 371–442. 10.1016/B978-0-12-407247-3.00007-X
41
WesthoekH.LesschenJ. P.RoodT.WagnerS.De MarcoA.Murphy-BokernD.et al. (2014). Food choices, health and environment: effects of cutting Europe's meat and dairy intake. Glob. Environ. Change26, 196–205. 10.1016/j.gloenvcha.2014.02.004
42
WesthoekH.RoodT.van den BergM.JanseJ.NijdamD.ReudinkM.et al. (2011). The Protein Puzzle: the Consumption and Production of Meat, Dairy and Fish in the European Union (No. 500166001). Netherlands Environmental Assessment Agency.
Summary
Keywords
eco-efficiency, greenhouse gas, nutrients, agriculture, European Union
Citation
van Grinsven HJM, van Eerdt MM, Westhoek H and Kruitwagen S (2019) Benchmarking Eco-Efficiency and Footprints of Dutch Agriculture in European Context and Implications for Policies for Climate and Environment. Front. Sustain. Food Syst. 3:13. doi: 10.3389/fsufs.2019.00013
Received
13 December 2018
Accepted
12 February 2019
Published
11 March 2019
Volume
3 - 2019
Edited by
Alberto Sanz Cobeña, Polytechnic University of Madrid, Spain
Reviewed by
Eduardo Aguilera, Centro de Estudios e Investigación para la Gestión de Riesgos Agrarios y Medioambientales (CEIGRAM), Spain; Pytrik Reidsma, Wageningen University & Research, Netherlands
Updates
Copyright
© 2019 van Grinsven, van Eerdt, Westhoek and Kruitwagen.
This is an open-access article distributed under the terms of the Creative Commons Attribution License (CC BY). The use, distribution or reproduction in other forums is permitted, provided the original author(s) and the copyright owner(s) are credited and that the original publication in this journal is cited, in accordance with accepted academic practice. No use, distribution or reproduction is permitted which does not comply with these terms.
*Correspondence: Hans J. M. van Grinsven hans.vangrinsven@pbl.nl
This article was submitted to Climate-Smart Food Systems, a section of the journal Frontiers in Sustainable Food Systems
Disclaimer
All claims expressed in this article are solely those of the authors and do not necessarily represent those of their affiliated organizations, or those of the publisher, the editors and the reviewers. Any product that may be evaluated in this article or claim that may be made by its manufacturer is not guaranteed or endorsed by the publisher.