 Jeferson M. Lourenco
 Michael J. Rothrock Jr.
 Francis L. Fluharty
 Todd R. Callaway
- 1Department of Animal and Dairy Science, University of Georgia, Athens, GA, United States
- 2Egg Safety and Quality Research Unit, U.S. National Poultry Research Center, USDA-ARS, Athens, GA, United States
The succession of bacterial species as birds mature can impact their growth efficiency, health, and food safety due to the ability of a mature gastrointestinal microbial population to exclude opportunistic pathogenic bacteria from colonization. There has been an increase in the number of chickens fed a soy-free diet compared to the standard soybean-containing rations in pastured poultry. Therefore, the present study was designed to describe the impacts of feeding a soy-containing (SOY) or a soy-free diet (SF) on the bacterial succession in the gut of pasture-raised chickens. In order to compare microbiome compositions as birds aged, 16s rRNA gene sequencing was performed on the gastrointestinal tract of 1-day-old birds, on fecal material obtained at different ages, and on the cecal contents collected at slaughter from broilers fed each of the 2 diets. Results showed that at the phylum level, regardless of diet and birds' stage of life, there was a predominance of the phylum Firmicutes, which ranged from 50 to 90% of all OTUs in all samples. Moreover, the number of observed OTUs significantly increased (P < 0.001) as birds in the SF diet grew older; however, no significant variations (P = 0.11) in this trait were observed as birds in the SOY diet aged. Shannon Diversity indices calculated for birds in both diets had greater values (P < 0.001) in the cecal contents of adult birds collected at slaughter, compared to samples obtained at earlier ages. Also in spite of which diet was offered, the abundance of Oscillospira, Faecalibacterium, Ruminococcus, and 2 unidentified genera from the orders Clostridiales and RF39 all increased as birds aged, while abundance of Lactobacillus decreased. The predicted metabolic functions using microbiome data showed no differences (P ≥ 0.26) in metabolism of amino acids, carbohydrates, lipids, and energy for both diets. These findings demonstrate that, under these experimental conditions, while diet modulates some microbial changes in the gut of pasture-raised chicken, overall, a similar successional pattern is observed for both diets. Moreover, the resulting metabolic functions are very similar between diets regardless of age.
Introduction
Poultry production has a very narrow profit margin and suffers from a negative public perception. A positive public perception and higher prices have motivated many producers to invest their resources in producing pasture-raised chickens (Trimble et al., 2013). While conventionally raised broilers are confined for their entire life cycle, pasture-raised birds are allowed access to a grassy area outside where they have the opportunity to graze. In addition to the grass consumed during grazing, pasture-raised chickens are normally fed supplemental feed containing cereal grains and legumes, such as soybean. However, an increasing number of consumers are seeking soy-free products, which includes the meat from broilers fed diets free of soybeans. For this reason, there are several brands of soy-free feeds currently in the market, and using them in the pasture-raised system of production of chicken is becoming increasingly common.
Numerous studies have evaluated the gastrointestinal microbiome of commercial broilers (Danzeisen et al., 2011; Oakley et al., 2014; Díaz Carrasco et al., 2018); however, information about the gut microbiome in pasture-raised chickens is more limited. Furthermore, while there is information on the succession of the gastrointestinal ecosystem of commercially produced broilers it is rather limited, and is especially limited on pasture-raised chickens. Previous research from our lab (unpublished data; submitted) has shown that feeding a soy-containing or a soy-free diet to pasture-raised chickens significantly changed their gastrointestinal microbiomes and affected the quality of their final products (carcass). Thus, the present study was designed to describe the successional changes in the gut microbiome of pasture-raised broilers during their entire life cycle—from hatching to slaughter—under two different scenarios: one in which the birds were supplemented with a soy-containing feed, and another in which the birds received a soy-free feed. In both scenarios, cecal samples collected from 1-day-old broilers were used as the “starting point” and compared to fecal material obtained subsequently at later ages, as well as to the cecal contents obtained on the day of slaughter. In order to facilitate the visualization of the microbial changes, the majority of the data presented here are in the form of figures rather than tables.
Materials and Methods
This study was exempt from animal ethics approval since a commercial farm managed and butchered all birds, thus, ethics approval was not required as per applicable institutional and national guidelines and regulations. Briefly, the only samples that were collected while birds were still alive were the fecal material from their pastures, which were obtained immediately after they left the paddocks. The cecal samples were collected after birds had already been processed. Additionally, the gastrointestinal tracts (GIT) from 1-day-old birds were collected only from the chicks that did not survive the overnight shipping to the farm (died in transit).
Birds, Diets, and Management System
A total of 5 flocks of 1 day old Freedom Ranger type chicks from a commercial hatchery (Freedom Ranger Hatchery, Reinholds, PA, USA) were delivered to a farm located in the southeastern region of the United States. Upon arrival, all chicks (n = 375 birds) were housed and reared under heat lamps and using wood shavings as bedding material. Fresh shavings were added on the top of the existing bedding each week, and the birds remained under this management for approximately 4 weeks, when they received a soy-free all natural broiler mix composed primarily of corn and oats. After this period, the young broilers were transferred to fenced pastures, which were managed according to a modified Salatin-type chicken tractor housing system. Each pasture had 3 houses and a total of 375 birds. During live production, three flocks in the three pastures were provided a soy-containing feed (SOY), whereas the other two flocks in two pastures received a soy-free feed (SF). The flocks were grown side-by-side, and SOY flocks never overlapped the pasture areas of SF flocks and vice versa. Feed and water were offered ad libitum and broilers were moved onto a fresh piece of pasture every day using plastic temporary fencing that was moved daily to determine the grazing area. The composition of SOY and SF is presented in Table 3.
Sample Collections
Throughout the rearing cycle, five samplings were performed from the broilers and were transported to a laboratory on ice and processed within 2 h of collection. The first type of sample was obtained from 1-day-old chicks that did not survive the overnight shipping to the farm. A total of 25 day-old chicks did not survive this transportation and had their GIT collected. The second, third, and fourth types of samples were obtained when broilers were approximately 4, 7, and 12 weeks old, respectively. These samples consisted of excreta obtained from the pasture where the flocks were residing at the time of sampling. At each sampling time, the pasture area was divided into five separate sections, and five composite samples were taken. Samples were collected from fresh excreta on the soil surface, and gloves were changed between sampling areas. When broilers were approximately 12 weeks old, they were transported to a USDA-inspected facility where they were slaughtered and the fifth type of sample was acquired. These samples consisted of cecal sacs from 25 broilers from each group (SOY and SF), which were combined in groups of 5 for a total of 5 pooled samples from each treatment group. In order to prepare the samples for homogenization, the ceca were combined within filtered stomacher bags (Seward Laboratory Systems, Inc., Davie, FL), and diluted 1:3 using 10 mM PBS. All samples were homogenized for 60 s and these homogenates were used for DNA extractions.
DNA Extraction and Purification
DNA extractions were performed using either 0.5 ml of cecal homogenate, or 0.33 g of feces, depending on the type of sample. DNA was extracted according to a semi-automated hybrid DNA extraction protocol previously described (Rothrock et al., 2014). In summary, this method uses a combination of a mechanical and enzymatic methods. The mechanical portion uses the FastDNA Spin Kit for Feces (MP Biomedicals, Solon, OH, USA) and the enzymatic portion utilizes the QIAamp DNA Stool Mini Kit (QIAGEN, Valencia, CA, USA). DNA purification was performed using the DNA Stool–Human Stool–Pathogen Detection Protocol of the QIAcube Robotic Workstation. After purification, the DNA concentration in each sample was determined spectrophotometrically using the Take3 plate in conjunction with the Synergy H4 multimode plate reader (BioTek, Winooski, VT).
16S rRNA Gene Sequencing and Analysis
Library construction and sequencing were performed by the Earth Microbiome Project Laboratory at the U.S. Department of Energy, Argonne National Laboratory (Argonne, IL, USA). Briefly, the hypervariable V4 domain of bacterial 16S rRNA gene was amplified using the F515 (5′-CACGGTCGKCGGCGCCATT-3′) and R806 (5′-GGACTACHVGGGTWTCT AAT-3′) primer set with each primer containing Illumina adapter regions (Illumina, Inc., San Diego, CA, USA) and the reverse primer containing the Golay barcodes to facilitate multiplexing (Caporaso et al., 2011). The initial demultiplexing and quality filtering steps were performed using the QIIME pipeline v1.9.1 (Caporaso et al., 2010b). The 16S rRNA gene amplicon pool was demultiplexed by internal barcodes to identify individual samples and primers were removed. Sequences were then chimera-checked against the Greengenes 13_8 database (DeSantis et al., 2006) and clustered into Operational Taxonomic Units (OTUs) according to a similarity set at 97%. The open-reference OTU picking protocol was used. A representative sequence for each OTU was selected and used for taxonomic assignment using UCLUST and the Greengenes 13_8 database. Sequences were aligned using PyNAST (Caporaso et al., 2010a), and filtered. A phylogenetic tree was subsequently produced, and singleton OTUs and OTUs whose representative sequences could not be aligned with PyNAST were removed.
For further analyses, sample size was standardized to 4,400 sequences per sample, as this value allowed elimination of sampling depth heterogeneity while considering the vast majority of the samples in the calculations. The alpha diversity/richness indexes calculated were: Chao1, Shannon index, Evenness, and the number of observed OTUs. For beta diversity, two metrics were computed: unweighted and weighted UniFrac distances. These were chosen because they account for phylogenetic relationships when measuring beta diversity (Lozupone and Knight, 2005). In addition to the diversity metrics, inferences on the function of the microbial community using the 16S rRNA gene as a marker were accomplished using PICRUSt (Langille et al., 2013). Predicted metagenome functions were performed at second-level KEGG pathways for the metabolism of amino acids, carbohydrates, lipids, and energy.
Statistical Analysis
Statistical analyses were performed using the software Minitab 18® and R v2.15.1 [R Foundation for Statistical Computing, Vienna, Austria (R Core Team, 2013)]. Comparisons between the two treatments–SOY and SF–were performed by two-sample t-test with a confidence level of 95%. Analyses of the alpha diversity indexes and bacterial relative abundances were performed by ANOVA using the type of sample collected as a factor. This procedure was replicated for both the SOY and SF diets. Comparisons between all pairs of groups were achieved using Tukey's method for multiple comparisons with an error rate for comparisons of 5%. Beta diversity was computed using the Unweighted and Weighted UniFrac distances matrices obtained for the 2 distinct situations: the SOY and SF diet. All results were considered significant at P ≤ 0.05, and were treated as trends when their associated P-values were between 0.05 and 0.10.
Results and Discussion
Figures 1, 2 gather different types of samples (gastrointestinal and fecal samples) for comparison of alpha diversity. Previous research have demonstrated that although chicken fecal and cecal microbiotas are not exactly the same, fecal samples can be used to reflect the presence and absence of the vast majority of the members of the cecal community; therefore, fecal samples can be effectively used to detect shifts in the cecal microbiota (Stanley et al., 2015). Figure 1 shows the Shannon diversity index calculated for the different stages of broilers' life cycle. Regardless of the diet offered to the broilers, bacterial diversity was greatest (P ≤ 0.05) in the cecal samples that were collected during the slaughter/carcass processing of birds. For all the other types of sample, diversity remained relatively constant despite of the diet offered to birds, the only exception being the feces collected at 7 vs. 12 weeks of age in broilers fed SF. Lastly, it can be noticed that microbial diversity for both diets was greater in the cecal samples than they were in the fecal samples of 12-week-old birds, despite the fact that these samples were obtained on the same day. This finding is in line with the ones reported by Oakley and Kogut (2016). These authors found significantly greater diversity in the cecal samples compared to the fecal samples of 1-week-old broilers. This greater diversity in the cecal samples remained numerically higher until the end of their trial, when birds were 6 weeks-old. Likewise, in spite of their conclusion that fecal samples can be effectively used to predict the microbiomes of ceca, Stanley et al. (2015) also reported greater microbial diversity in cecal samples, relative to fecal samples.
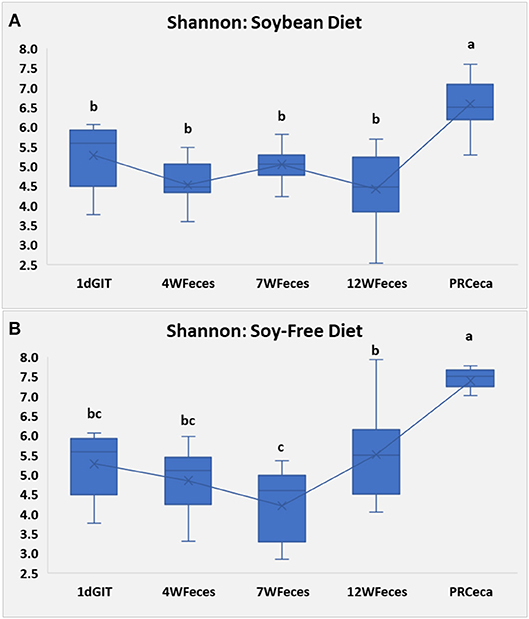
Figure 1. Shannon Index for pasture-raised chicken over different stages of their lives: 1dGIT, Gastrointestinal contents from 1-day-old broilers; 4WFeces, Feces from 4-week-old broilers; 7WFeces, Feces from 7-week-old broilers; 12WFeces, Feces from 12-week-old broilers; PRCeca, Cecal contents collected during slaughter. (A) Broilers fed a soy-containing diet; (B) Broilers fed a soy-free diet. The lack of a common superscript letter (within the same diet) indicates significant differences (P ≤ 0.05).
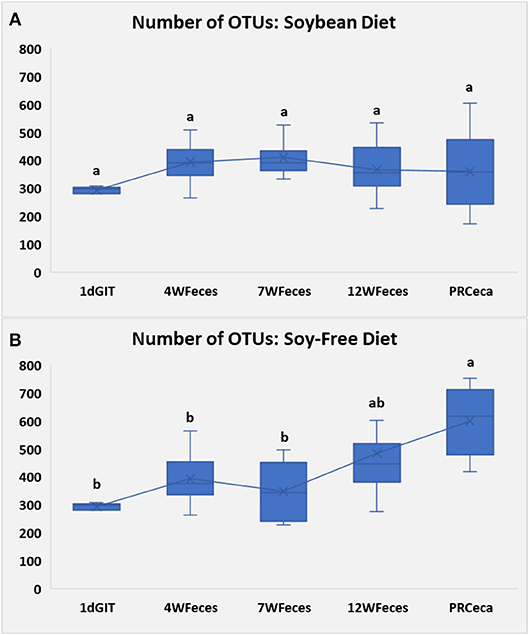
Figure 2. Number of observed OTUs for pasture-raised chicken over different stages of their lives: 1dGIT, Gastrointestinal contents from 1-day-old broilers; 4WFeces, Feces from 4-week-old broilers; 7WFeces, Feces from 7-week-old broilers; 12WFeces, Feces from 12-week-old broilers; PRCeca, Cecal contents collected during slaughter. (A) Broilers fed a soy-containing diet; (B) Broilers fed a soy-free diet. The lack of a common superscript letter (within the same diet) indicates significant differences (P ≤ 0.05).
Sample richness, expressed as the number of observed OTUs, is presented in Figure 2. In the group of broilers fed SOY, the number of OTUs remained constant throughout their entire life cycle. However, in the group fed the SF diet, the number of OTUs tended to increase as birds aged, and was greatest (P ≤ 0.05) in the cecal samples obtained at slaughter. Similarly, Danzeisen et al. (2011) observed an increase in microbiome diversity and richness as commercial birds aged, however, in their study, birds were only raised until they were 5 weeks old, whereas in our study broilers were slaughtered when they were 12 weeks old. Díaz Carrasco et al. (2018) did not find significant variations in microbial diversity (Shannon index) in commercial birds fed a control diet for the first 30 days of their lives, which is somehow similar to what we observed, however, once again, since they were working with commercial birds, they were slaughtered at an earlier age, thus there is no data to compare to our pasture-raised birds at the end of their cycle (12 weeks).
Bacterial relative abundances at the phylum level are presented in Figure 3. When birds were fed SOY, significant differences throughout their life cycle (P ≤ 0.05) were found in Firmicutes, Cyanobacteria, and Tenericutes. Compared to 1-day-old chicks, Firmicutes numerically increased and remained relatively constant during the later stages of their lives. Cyanobacteria were only found at high levels in the gastrointestinal tract of 1-day-old chicks and in the cecal contents collected during slaughter, and Tenericutes were only found in the latter type of samples. For broilers fed SF, differences were observed (P ≤ 0.05) in all of the seven phyla shown, as broilers aged. Similarly to what was observed in broilers fed SOY, Cyanobacteria were only found in the gastrointestinal tract of 1-day-old chicks and in the cecal contents collected during slaughter. Furthermore, Tenericutes and Chlamydiae were only found in the cecal contents obtained at slaughter. All of the other main phyla studied were present in all of the types of sample, and although their abundances varied across the different sample types, there was no clear pattern of variation. Interested readers can refer to Supplementary Material to visualize the phylum-level changes that occurred only in the ceca of the birds.
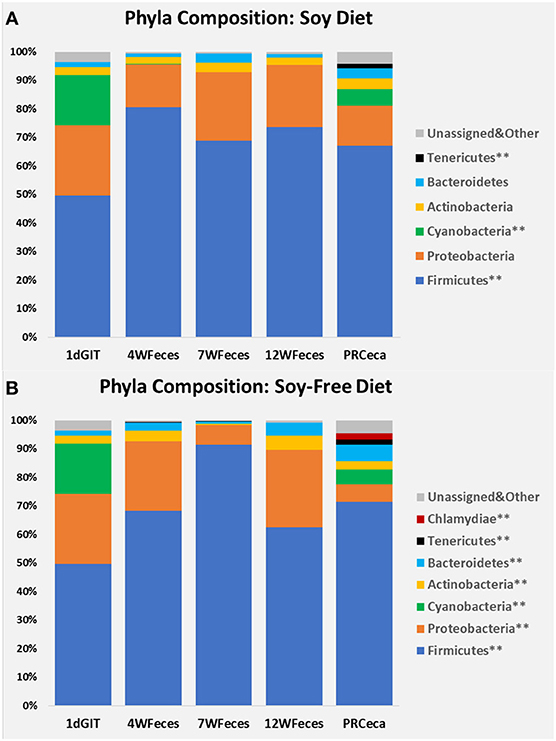
Figure 3. Bacterial phyla composition of pasture-raised chicken over different stages of their lives: 1dGIT, Gastrointestinal contents from 1-day-old broilers; 4WFeces, Feces from 4-week-old broilers; 7WFeces, Feces from 7-week-old broilers; 12WFeces, Feces from 12-week-old broilers; PRCeca, Cecal contents collected during slaughter. (A) Broilers fed a soy-containing diet; (B) Broilers fed a soy-free diet.** Indicates that there were differences (P ≤ 0.05) across the different sample types for the bacterial group (within the same diet).
Principal coordinate analysis (PCoA) of beta-diversity using the Unweighted UniFrac distances are shown in Figure 4. For both diets, there was an effect (P ≤ 0.001) of the type of sample on this metric. Moreover, the cecal contents collected during slaughter tended to scatter more broadly than other sample types. Similarly, PCoA of beta-diversity using the Weighted UniFrac distances (Figure 5) revealed the same trend: a separation between the cecal samples collected at slaughter and all the other types of sample. However, for the Weighted UniFrac metric the separation between those samples was even more evident. In addition, separations were consistent for both the SOY and SF groups. In a study that followed the successional changes in the cecal microbiome of commercial chickens, Oakley et al. (2014) identified an effect of bird age (7, 21, or 42 days-old) on clustering of their samples, which was similar to what we observed.
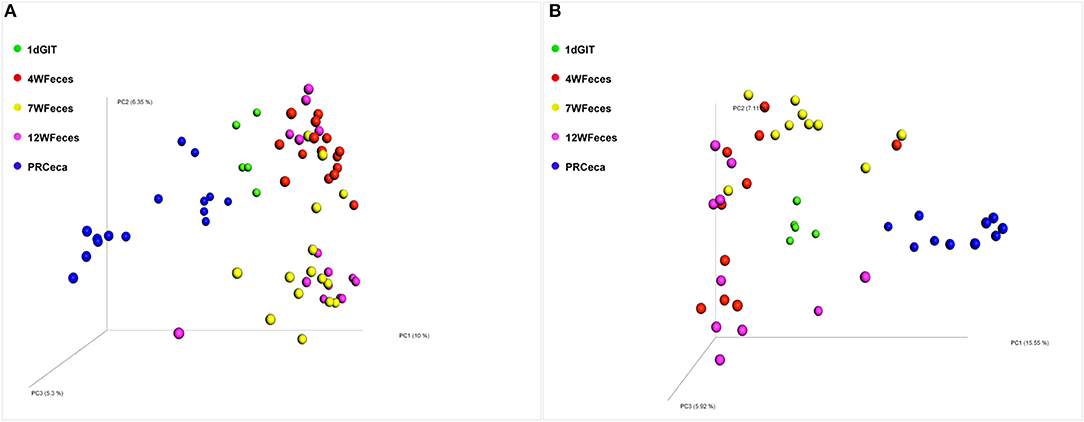
Figure 4. Principal coordinate analysis (PCoA) of beta-diversity of pasture-raised chicken using Unweighted UniFrac distances: 1dGIT, Gastrointestinal contents from 1-day-old broilers; 4WFeces, Feces from 4-week-old broilers; 7WFeces, Feces from 7-week-old broilers; 12WFeces, Feces from 12-week-old broilers; PRCeca, Cecal contents collected during slaughter. (A) Broilers fed a soy-containing diet; (B) Broilers fed a soy-free diet. Beta-diversity was significantly different (P ≤ 0.001) across the sample types analyzed in both groups (A,B).
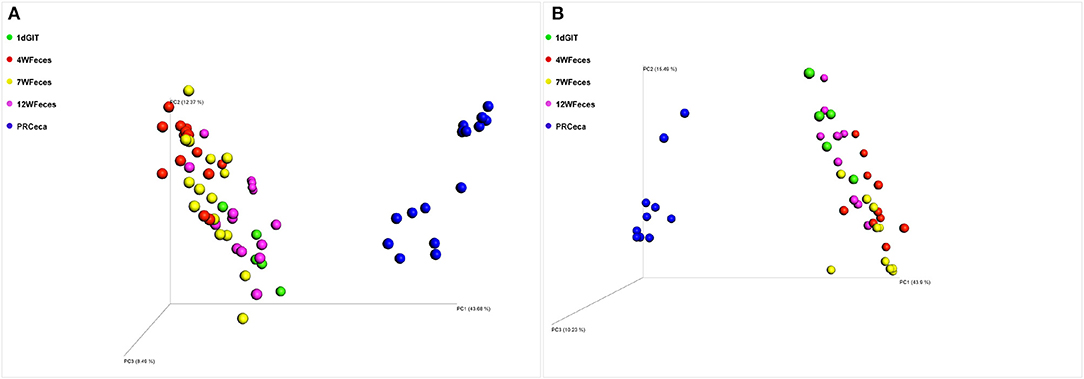
Figure 5. Principal coordinate analysis (PCoA) of beta-diversity of pasture-raised chicken using Weighted UniFrac distances: 1dGIT, Gastrointestinal contents from 1-day-old broilers; 4WFeces, Feces from 4-week-old broilers; 7WFeces, Feces from 7-week-old broilers; 12WFeces, Feces from 12-week-old broilers; PRCeca, Cecal contents collected during slaughter. (A) Broilers fed a soy-containing diet; (B) Broilers fed a soy-free diet. Beta-diversity was significantly different (P ≤ 0.001) across the sample types analyzed in both groups (A,B).
Figure 6 shows the predicted metabolic functions of level 2 KEGG pathways using the microbiome data of birds fed the SOY and SF diets. No differences were detected between the two diets (P ≥ 0.26) for any of the pathways shown. The level 2 pathways associated with the metabolism of amino acids were similar (P ≥ 0.39) for all types of sample across diets. Likewise, pathways associated with the metabolism of carbohydrates were similar (P ≥ 0.34), and were also observed for the metabolism of lipids (P ≥ 0.26), and energy (P ≥ 0.52).
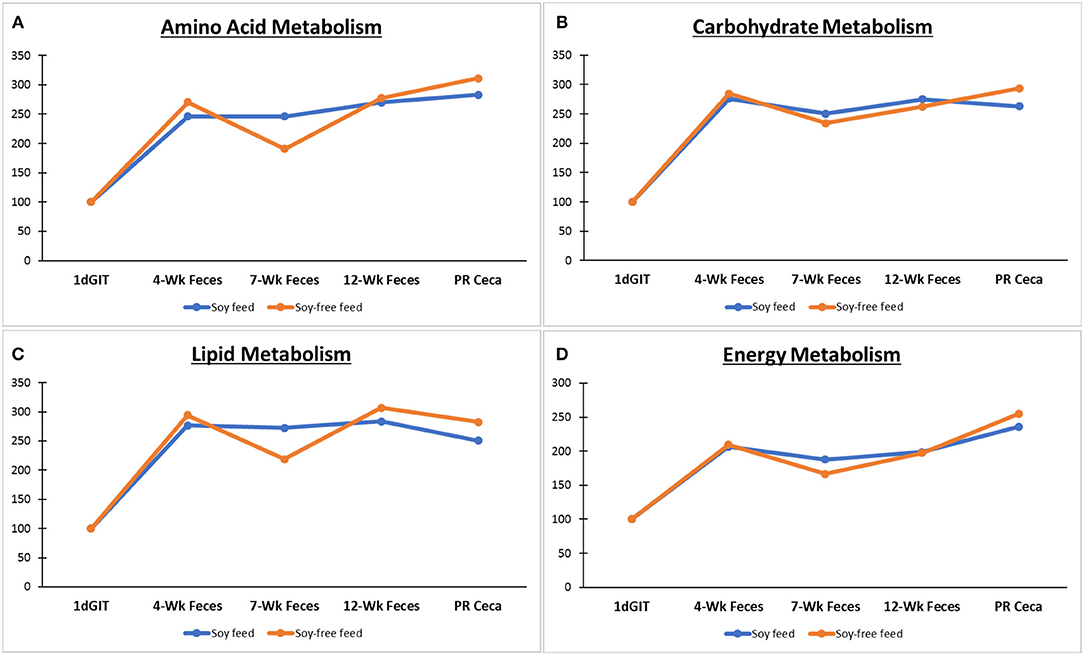
Figure 6. Predicted metabolic functions (level 2 KEGG pathways using PICRUSt) based on the microbiome of broilers fed the soy-containing and soy-free diets: 1dGIT, Gastrointestinal contents from 1-day-old broilers; 4WFeces, Feces from 4-week-old broilers; 7WFeces, Feces from 7-week-old broilers; 12WFeces, Feces from 12-week-old broilers; PRCeca, Cecal contents collected during slaughter. Pathways associated with the metabolism of: (A) Amino acids; (B) Carbohydrates; (C) Lipids; and (D) Energy. No differences were detected between the 2 diets (P ≥ 0.26) for any of the pathways.
In order to evaluate how the abundance of specific microorganisms changed as the pasture-raised broilers aged, correlation matrices were constructed for the SOY and SF birds (Tables 1, 2, respectively). Only bacteria that had high correlation (ρ = ± 0.55; P ≤ 0.01) with bird age were selected and presented here. Under these conditions, seven bacterial groups were identified as highly correlated (P ≤ 0.001) with bird age in the SOY group: Lactobacillus, Oscillospira, Faecalibacterium, Ruminococcus, one unidentified genus from the family Ruminococcaceae, one from the order Clostridiales, and another from the order RF39. Of these bacteria, Lactobacillus decreased as birds aged, while the others increased. For broilers fed SF, although abundance of Lactobacillus decreased as birds aged, the decrease in abundance was not as high as observed in the SOY group (ρ = −0.45; P = 0.03; data not shown). However, six other bacterial groups were positively correlated (P ≤ 0.001) with broilers' age in the SF group: Oscillospira, Faecalibacterium, Ruminococcus, one unidentified genus from the family Ruminococcaceae, one from the order Clostridiales, and one from the order RF39. The bacterial groups that were positively correlated with bird age in SF were the same that were positively correlated with age in SOY, which indicates that these bacteria increase in the gastrointestinal tract of pasture-raised broilers as they age, independently of the diet offered.
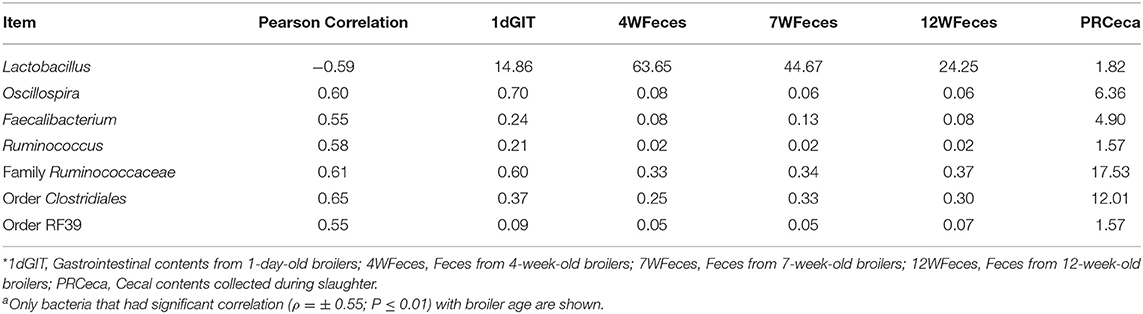
Table 1. Correlations between broiler age and selected bacteriaa as well as their respective relative abundances for birds fed the soy-containing feed*.
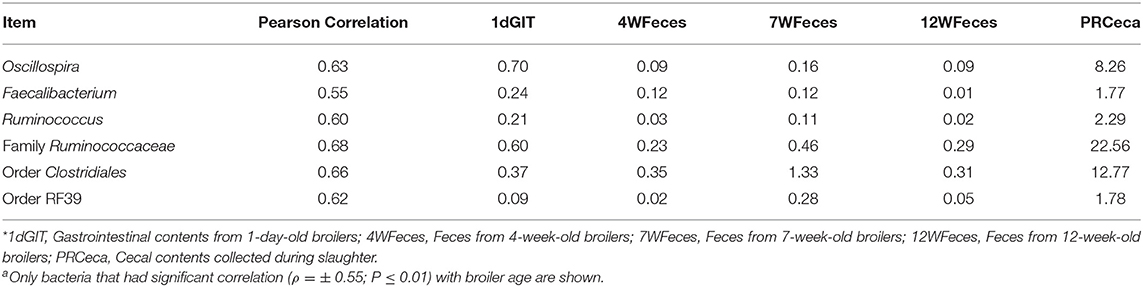
Table 2. Correlations between broiler age and selected bacteriaa as well as their respective relative abundances for birds fed the soy-free feed*.
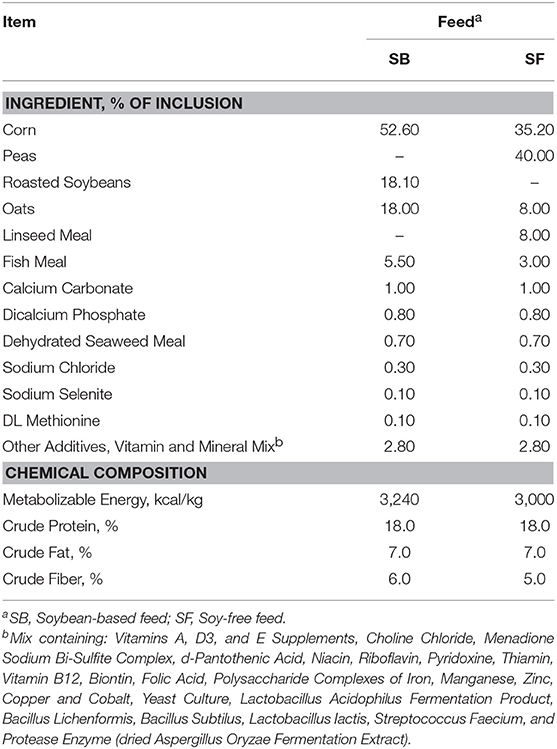
Table 3. Composition and nutrient contents of the feeds offered to pasture-raised broilers.
In conclusion, the 2 different diets stimulated a few distinct responses in the gut microbiome of birds. However, overall, our findings showed that the microbial changes in the gastrointestinal tract of pastured-raised chickens followed a similar pattern regardless of the diet offered to them. In addition, the predicted metabolic functions from the microbiome of broilers fed either the SOY or SF diets were similar for all of the KEGG pathways analyzed. Furthermore, in line with previous research performed with conventional broilers, our findings showed that the cecal contents obtained when birds were slaughtered/processed were substantially different from the fecal material obtained on the same day (12 weeks-old), and had greater microbial diversity than the feces. Indeed, beta diversity analyses revealed that the cecal samples were significantly different from all the other types of sample collected during this study.
Author Contributions
All authors listed have made a substantial, direct and intellectual contribution to the work, and approved it for publication.
Funding
This study was supported by the Agricultural Research Service, USDA CRIS Projects Genetic Analysis of Poultry-Associated Salmonella enterica to Identify and Characterize Properties and Markers Associated with Egg-Borne Transmission of Illness #6040-32000-007- 00 and Molecular Approaches for the Characterization of Foodborne Pathogens in Poultry #6612-32000-059-00.
Conflict of Interest Statement
The authors declare that the research was conducted in the absence of any commercial or financial relationships that could be construed as a potential conflict of interest.
Acknowledgments
The authors thank Kelli Hiett for initial conception of the overall parent study that this study was contained within. We would also like to thank Laura Lee Rutherford, Cheryl Gresham-Pearson, Latoya Wiggins, Katelyn Griffin, and Tori McIntosh for assistance in sample acquisition and processing, and Sarah Owens at the US-DOE Argonne National Laboratory for assistance with sample preparation guidance for Illumina MiSeq sequencing.
Supplementary Material
The Supplementary Material for this article can be found online at: https://www.frontiersin.org/articles/10.3389/fsufs.2019.00035/full#supplementary-material
References
Caporaso, J. G., Bittinger, K., Bushman, F. D., DeSantis, T. Z., Andersen, G. L., and Knight, R. (2010a). PyNAST: a flexible tool for aligning sequences to a template alignment. Bioinformatics 26, 266–267. doi: 10.1093/bioinformatics/btp636
Caporaso, J. G., Kuczynski, J., Stombaugh, J., Bittinger, K., Bushman, F. D., Costello, E. K., et al. (2010b). QIIME allows analysis of high-throughput community sequencing data. Nat. Methods 7, 335–336. doi: 10.1038/nmeth.f.303
Caporaso, J. G., Lauber, C. L., Walters, W. A., Berg-Lyons, D., Lozupone, C. A., Turnbaugh, P. J., et al. (2011). Global patterns of 16S rRNA diversity at a depth of millions of sequences per sample. Proc. Natl. Acad. Sci. U.S.A. 108(Suppl. 1), 4516–4522. doi: 10.1073/pnas.1000080107
Danzeisen, J. L., Kim, H. B., Isaacson, R. E., Tu, Z. J., and Johnson, T. J. (2011). Modulations of the chicken cecal microbiome and metagenome in response to anticoccidial and growth promoter treatment. PLoS ONE 6:e27949. doi: 10.1371/journal.pone.0027949
DeSantis, T. Z., Hugenholtz, P., Larsen, N., Rojas, M., Brodie, E. L., Keller, K., et al. (2006). Greengenes, a chimera-checked 16S rRNA gene database and workbench compatible with ARB. Appl. Environ. Microbiol. 72, 5069–5072. doi: 10.1128/AEM.03006-05
Díaz Carrasco, J. M., Redondo, E. A., Pin Viso, N. D., Redondo, L. M., Farber, M. D., and Fernández Miyakawa, M. E. (2018). Tannins and bacitracin differentially modulate gut microbiota of broiler chickens. BioMed Res. Int. 2018:1879168. doi: 10.1155/2018/1879168
Langille, M. G., Zaneveld, J., Caporaso, J. G., McDonald, D., Knights, D., Reyes, J. A., et al. (2013). Predictive functional profiling of microbial communities using 16S rRNA marker gene sequences. Nat. Biotechnol. 31, 814–821. doi: 10.1038/nbt.2676
Lozupone, C., and Knight, R. (2005). UniFrac: a new phylogenetic method for comparing microbial communities. Appl. Environ. Microbiol. 71, 8228–8235. doi: 10.1128/AEM.71.12.8228-8235.2005
Oakley, B. B., Buhr, R. J., Ritz, C. W., Kiepper, B. H., Berrang, M. E., Seal, B. S., et al. (2014). Successionalchanges in the chicken cecal microbiome during 42 days of growth are independent of organic acid feed additives. BMC Vet. Res. 10:282. doi: 10.1186/s12917-014-0282-8
Oakley, B. B., and Kogut, M. H. (2016). Spatial and temporal changes in the broiler chicken cecal and fecal microbiomes and correlations of bacterial taxa with cytokine gene expression. Front. Vet. Sci. 3:11. doi: 10.3389/fvets.2016.00011
R Core Team (2013). R: A Language and Environment for Statistical Computing. R Foundation for Statistical Computing. Vienna. Available online at: http://www.R-project.org/
Rothrock, M. J. Jr., Hiett, K. L., Gamble, J., Caudill, A. C., Cicconi-Hogan, K. M., and Caporaso, J. G. (2014). A hybrid DNA extraction method for the qualitative and quantitative assessment of bacterial communities from poultry production samples. Vis. Exp. 94:52161. doi: 10.3791/52161
Stanley, D., Geier, M. S., Chen, H., Hughes, R. J., and Moore, R. J. (2015). Comparison of fecal and cecal microbiotas reveals qualitative similarities but quantitative differences. BMC Microbiol. 15:51. doi: 10.1186/s12866-015-0388-6
Trimble, L. M., Alali, W. Q., Gibson, K. E., Ricke, S. C., Crandall, P., Jaroni, D., et al. (2013). Salmonella and Campylobacter prevalence and concentration on pasture-raised broilers processed on-farm, in a mobile processing unit, and at small USDA-inspected facilities. Food Control 34, 177–182. doi: 10.1016/j.foodcont.2013.04.024
Keywords: 16S rRNA, life cycle, microbiome, pastured poultry, soybean
Citation: Lourenco JM, Rothrock MJ Jr, Fluharty FL and Callaway TR (2019) The Successional Changes in the Gut Microbiome of Pasture-Raised Chickens Fed Soy-Containing and Soy-Free Diets. Front. Sustain. Food Syst. 3:35. doi: 10.3389/fsufs.2019.00035
Received: 12 December 2018; Accepted: 25 April 2019;
Published: 15 May 2019.
Edited by:
Joshua B. Gurtler, Agricultural Research Service, United States Department of Agriculture, United StatesReviewed by:
Young Min Kwon, University of Arkansas, United StatesLisa Bielke, The Ohio State University, United States
Vincenzo Tufarelli, University of Bari Aldo Moro, Italy
Copyright © 2019 Lourenco, Rothrock, Fluharty and Callaway. This is an open-access article distributed under the terms of the Creative Commons Attribution License (CC BY). The use, distribution or reproduction in other forums is permitted, provided the original author(s) and the copyright owner(s) are credited and that the original publication in this journal is cited, in accordance with accepted academic practice. No use, distribution or reproduction is permitted which does not comply with these terms.
*Correspondence: Todd R. Callaway, dG9kZC5jYWxsYXdheUB1Z2EuZWR1