Abstract
The last few years, a lot of measures addressing food waste have been proposed and implemented. Recent literature reviews call for more evidence on the effectiveness or food waste reduction potential of these measures. Furthermore, very few information is available on the extent to which food waste measures have been evaluated based on their economic, environmental and social performance. This review closes this knowledge gap by looking at the methodologies currently used in literature to evaluate food waste prevention measures, using a pre-defined assessment framework with quantitative evaluation criteria. In total, evaluations were examined for 25 implemented measures with measured outcomes and 23 proposed measures with projected outcomes. The paper concludes that there is a great variety in how an evaluation is performed. Additionally, in many cases, economic, environmental, or social assessments are incomplete or missing, and efficiency is only seldom calculated. This is particularly true for implemented measures whereas proposed measures with projected outcomes tend to have a more thorough evaluation. This hampers practitioners and decision-makers to see which measures have worked in the past, and which ones to prioritize in the future. Moreover, more complete information on the effectiveness and efficiency of measures would make incentives for reducing food waste at various levels along the food chain more visible. At European level, work is ongoing on the development of a reporting framework to evaluate food waste actions. This paper complements these efforts by providing an overview of the current gaps in evaluation methodologies found in literature regarding food waste prevention measures within EU and beyond.
Introduction
Urgency of Tackling Food Waste
Food losses and wastes are generated throughout the food chain, from cultivation, over harvest, processing, storage and distribution up until the final consumption by private households and the food service sector. In 2011, the FAO provided a comprehensive overview of the amount of food losses and waste generated at global level (Gustavvson et al., 2011). Globally, about 1.3 billion tons of edible food, or about one third of the mass of edible food produced for human consumption, is annually lost or wasted. At EU level, 88 million tons of edible and inedible food was lost or wasted in 2012. This equals about 20% of the total food produced in the EU and up to 173 kg of food waste per person per year (FUSIONS, 2016).
Based on the 2011 Food Balance Sheets, the FAO estimates that the annual global volume of food wastage generated has a carbon footprint of 3.6 Gt of CO2 eq (excluding land use change). If food wastage were a country, it would be the third largest emitter in the world, after USA and China (FAO, 2015). Furthermore, 24% of freshwater resources and 23% of the cropland used to produce food in 2011, was lost throughout the food supply chain (Kummu et al., 2012). At EU level, food waste has an annual climate change impact of 186 Mt CO2 eq., representing almost 16% of the carbon footprint of the total food chain (Scherhaufer et al., 2018).
Based on 2009 commodity prices at producer level, the FAO estimates the economic costs of global wastage of agricultural food products, thus excluding fish and seafood, at $750 billion (FAO, 2013a). In 2014, FAO adapted the figures to 2012 prices and replaced the producer prices for post-agricultural wastage with import/export market prices. This leads to a final monetary value of $936 billion for global food wastage (FAO, 2014). At European level, costs of edible waste are estimated to be at around €143 billion for EU-28 in 2012, based on the value of the edible food at each specific stage along the food chain where it is lost (FUSIONS, 2016). Two-thirds of these costs, or €98 billion, relates to food waste from households whereas the second largest contributor is the food service sector, with a food wastage cost of €20 billion.
Finding the Most Promising Measures to Tackle Food Waste
In order to reduce or prevent food waste, many measures have been put forward of which a great deal of them has been implemented. To know which measures provide the best opportunities and what actions are the most promising, a thorough evaluation of food waste interventions is needed.
For businesses, applying food waste prevention measures only makes sense if there is an economic incentive to do so. As preventing food waste comes at a cost, actors along the food chain could be expected to only implement a certain measure if the benefits resulting from saving food gone wasted outweigh the costs associated with the implementation of the measure (HLPE, 2014; WRAP, 2015). At production level, not harvesting all crops may be a strategic decision in case of low market prices or in case these leftover crops positively affect the yield of the next season. At business level, transaction costs associated with food waste prevention may be so high that it becomes “rational” to let food go wasted. This could be the case for correctly matching food supply and demand or for increasing delivery frequency and buying smaller quantities. At household level as well, consumers might prefer buying more products at once to going shopping on a more frequent basis, with the risk of a part of them not being consumed in time (FAO, 2014; Teuber and Jensen, 2016). In these cases, one might say there is an “optimal” amount of food waste (Teuber and Jensen, 2016).
To overcome these challenges, players along the food chain need an economic incentive for tackling food waste. Other than economic concerns, there may be ethical, social, or ecological benefits resulting from food waste prevention measures that could for example contribute to a company's positive image or corporate social responsibility (FAO, 2014; WRAP, 2015). For private consumers as well, ethical, social, or ecological concerns, next to economic ones, may results in generating less food waste.
A clear understanding of the net economic benefits associated with each measure, as well as its associated environmental and social effects, increases transparency, and could create incentives for (further) reducing food waste by the various players along the food chain.
The Knowledge Gap Regarding the Performance of Food Waste Measures
In its review on food waste literature, Schneider (2013) stated that “papers introducing evaluation methodology or presenting reliable results of evaluating implemented food waste prevention measures are lacking.” Rutten et al. (2013) further concluded that literature on the quantification of food waste reduction potential is scarce and that impacts of food waste prevention initiatives are often not quantified.
Since 2013, a couple of reviews were published looking into the extent to which reports or studies consider the food waste diversion potential of food waste measures. Pirani and Arafat (2014) reviewed solid waste management in the hospitality sector. For many of the food waste initiatives they collected, information on the associated food waste reduction potential is missing. Aschemann-Witzel et al. (2017) collected information on the key characteristics and success factors of 26 supply chain initiatives tackling consumer-related food waste. It is however, from this review, not clear whether these initiatives actually led to measurable food waste reduction, as “success was not defined as an actual reduction of food waste, given it was expected that few initiatives can actually measure this.” As such, actual proof of success might as well be “the extent to which information or supportive items had been distributed to consumers” (e.g., measuring cups for preparing the right amount of rice or pasta) as this is assumed to lead to food waste reduction on the long run. Stöckli et al. (2018b) and Reynolds et al. (2019) both looked at the effectiveness of food waste interventions at consumption level. Interestingly, informational interventions were found to be the most commonly used intervention type while at the same time they are seldom evaluated, resulting in a lack of proof of their effectiveness (Stöckli et al., 2018b). Furthermore, for some initiatives that are often reported to be effective and promising, such as cooking classes, food sharing apps, advertising and information sharing, no actual evidence could be found on whether or not they were effective (Reynolds et al., 2019). From these reviews, it can be concluded that the potential of food waste measures to reduce food waste is only being evaluated to a limited extent. Stöckli et al. (2018b) and Reynolds et al. (2019) therefore specifically call for more information on the actual effectiveness of food waste measures.
Given the fact that the amount of food waste prevented by a measure is seldom taken into account, neither the ecological impacts nor monetary costs associated with food waste measures can be assessed. To our best knowledge, no reviews currently exist assessing the extent to which ecological impacts, monetary costs or savings, and efficiency of food waste measures are considered. Several authors have however stressed that, in case monetary aspects are taken into account, these tend to be restricted to the costs embodied in the food itself (based on for example retail prices), whereas disposal related costs are neglected (Rutten et al., 2013; Teuber and Jensen, 2016; Cristóbal et al., 2018; Koester et al., 2018). Furthermore, Koester et al. (2018) concluded that costs incurred by the measure itself, namely the costs for implementing a measure, are rarely considered. Cristóbal et al. (2018) further conclude there is only “limited knowledge on the evaluation of food waste prevention and management strategies including both economic and environmental dimensions” and that data on performance of measures is scarce.
To close this knowledge gap on the evaluation of measures, the present paper reviews the methodologies applied in literature for evaluating food waste prevention measures, focussing on a wide range of factors beyond food waste diversion potential. This is done through a three-step literature search and analysis. Firstly, information is gathered on the range of prevention measures currently being proposed in literature to tackle food waste. Secondly, the search is narrowed to those sources containing an evaluation of the proposed food waste measure(s). Finally, an assessment is made on how the evaluation has been performed in the respective studies. This paper thereto proposes an assessment framework with quantitative criteria against which the evaluation methodologies are assessed.
This paper hereby builds on and complements ongoing work of the EU Platform on Food Losses and Food Waste1, and more particularly the framework for evaluating food waste prevention measures that is currently being developed by the EU Joint Research Centre (JRC) in Ispra (EU FLW, 2017). The innovation in this paper therefore does not lay in the assessment framework proposed, but rather in providing an overview of recent advancements in literature and the state of art of the extent to which measures have been evaluated so far.
This paper was written within the context of the German ELoFoS research project on “Efficient Lowering of Food waste in the Out-of-home Sector”2. As such, focus is given to the food service or out-of-home (OoH) sector whereas other sectors along the food chain are investigated to a lesser extent. Nevertheless, as the paper focusses on methodologies for evaluating food waste prevention measures rather than the measures itself, the findings of this paper apply to all sectors along the chain.
Materials and Methods
Food Waste Definition and Categorization of Food Waste Measures
The definition of food waste used within this paper follows the definition proposed by the European FUSIONS project: “Food waste is any food, and inedible parts of food, removed from the food supply chain to be recovered or disposed (including composted, crops plowed in/not harvested, anaerobic digestion, bio-energy production, co-generation, incineration, disposal to sewer, landfill or discarded to sea)” (Östergren et al., 2014). The food supply chain hereby consists of a “connected series of activities used to produce, process, distribute and consume food,” starting with raw materials and products ready for harvest or slaughter (Östergren et al., 2014), thus including those products that are in the end not harvested/slaughtered and for example left on the field.
Using this definition, food (or inedible parts of food) that is removed from the food supply chain and sent to animal feed, bio-material processing or other industrial uses is not considered as “food waste,” but as “valorization and conversion.”
Based on the definitional framework set out by Östergren et al. (2014) and the management hierarchy from Huber-Humer et al. (2017), food waste measures are categorized as follows:
- Measures preventing food from becoming food waste:
° Category 1: Avoidance measures aimed at reduction of food surplus at source, such as avoiding food overproduction and avoiding purchasing more than what is needed;
° Category 2: Redistribution or donation measures such as redirecting food surplus to people in need;
° Category 3: Valorization or conversion of food and inedible parts of food removed from the food supply chain, such as redirecting food waste to the bio-based industry or to animal feed;
- Measures managing food waste:
° Category 4: Recycling (anaerobic digestion or composting) and recovery (energy recovery) of food and inedible parts of food removed from the food supply chain in order to avoid landfilling.
Literature Search
The literature search was conducted between September 2018 and February 2019 and comprised both searching gray literature as well as academic literature. The search was done using Web of Science, Scopus, Science Direct, Directory of Open Access Journals and Google (Scholar) search engines. For practical reasons, the academic literature search was conducted in English whereas the search for gray literature entailed publications in English and in German. No date restrictions were set.
Following the focus of the ELoFoS project, the literature search concentrates on developed regions and the OoH sector. Furthermore, this paper concentrates on those measures aimed at preventing food from leaving the food supply chain, namely avoidance measures (Category 1) and redistribution or donation measures (Category 2).
The methodology used for the literature search is based on the rapid review approach as a less time-consuming alternative to a systematic review. The search and subsequent analysis followed a three-step approach as illustrated in Figure 1. Step 1 aimed at collecting measures dealing with food waste throughout the food chain, in order to get an insight in the measures that have been proposed in literature. In total, the search resulted in a collection of 88 sources (academic and gray literature) listing in total over 200 food waste prevention measures, with the majority of sources proposing or describing more than one measure. All found sources (with the exception of two studies) were published after 2010.
Figure 1
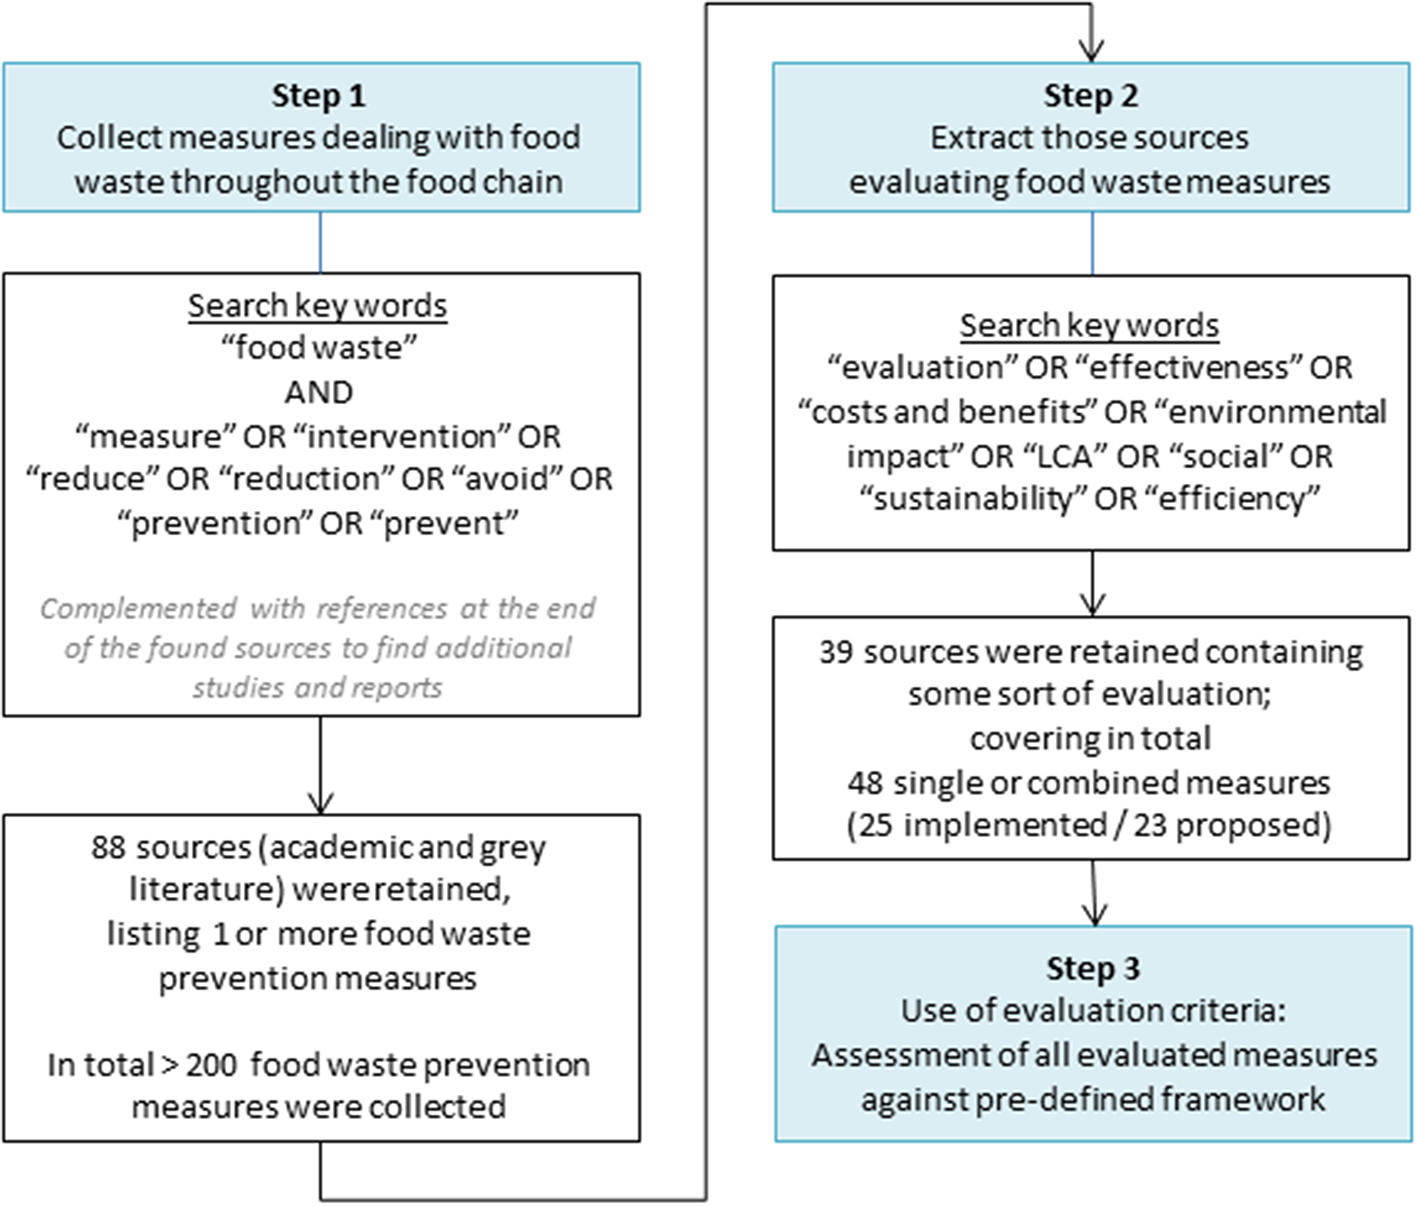
Flowchart and outline of the literature search methodology.
Step 2 of the search narrowed the sources to those studies or reports containing an evaluation of implemented or proposed measures to prevent food waste. In total, 39 sources were retained containing some sort of evaluation of one single measure or of combined measures. Combined measures hereby refer to measures applied and evaluated simultaneously or grouped into for example a voluntary agreement or a large-scale campaign.
Of the 39 retained sources, 15 were peer reviewed journal articles, 2 referred to proceedings or presentations at a scientific congress, whereas the remainder are gray literature or reports (see also Supplementary Table S3). These 39 sources included the evaluation of in total 48 single and combined measures. For the evaluated (combined) measure(s), the following metadata was collected: life cycle stage or sector in focus, country and scale of application, and nature of evaluation results (measured vs. projected outcomes).
During Step 3 of the process, the methodologies and criteria used for evaluating food waste measures were put against a predefined framework for evaluating measures (as described in section Assessment Framework: Evaluation Criteria for Food Waste Measures). The assessment done hereby focussed on the methodologies used in literature, rather than on identifying the best performing measure. Additionally, no attempt was made to evaluate the measures ourselves; only readily available information on the performance of the food waste measures was collected. The evaluation assessment itself comprised looking at the extent to which each of the evaluation criteria was taken into account. A distinction is hereby made into (sets of combined) measures that have been implemented and for which outcomes were measured, and measures that have not been implemented but for which projected outcomes are given. In case the information available online did not allow for a conclusive answer on whether or not a certain criterion was assessed, this is indicated with a question mark (“?”). For practical reasons, these were later on in the analysis treated as “criterion not considered.”
Assessment Framework: Evaluation Criteria for Food Waste Measures
The assessment framework proposed within the context of this paper builds on publicly available information on the ongoing work within the EU Platform on Food Losses and Food Waste (EC-JRC, 2018a,b, 2019). The framework is based on three overarching quantitative criteria that need to be considered when evaluating food waste measures. The first criterion refers to the potential of a measure to reduce food waste: its effectiveness. Secondly the extent to which all three dimensions of sustainability have been taken into account is assessed: environmental impacts or savings brought about by the measure (such as emission savings), economic costs and benefits, and resulting social effects. Lastly, we look at how the efficiency of a measure is calculated.
Figure 2 provides for a schematic overview of the criteria and their sub-criteria; a detailed description of the framework is presented in the following sections.
Figure 2
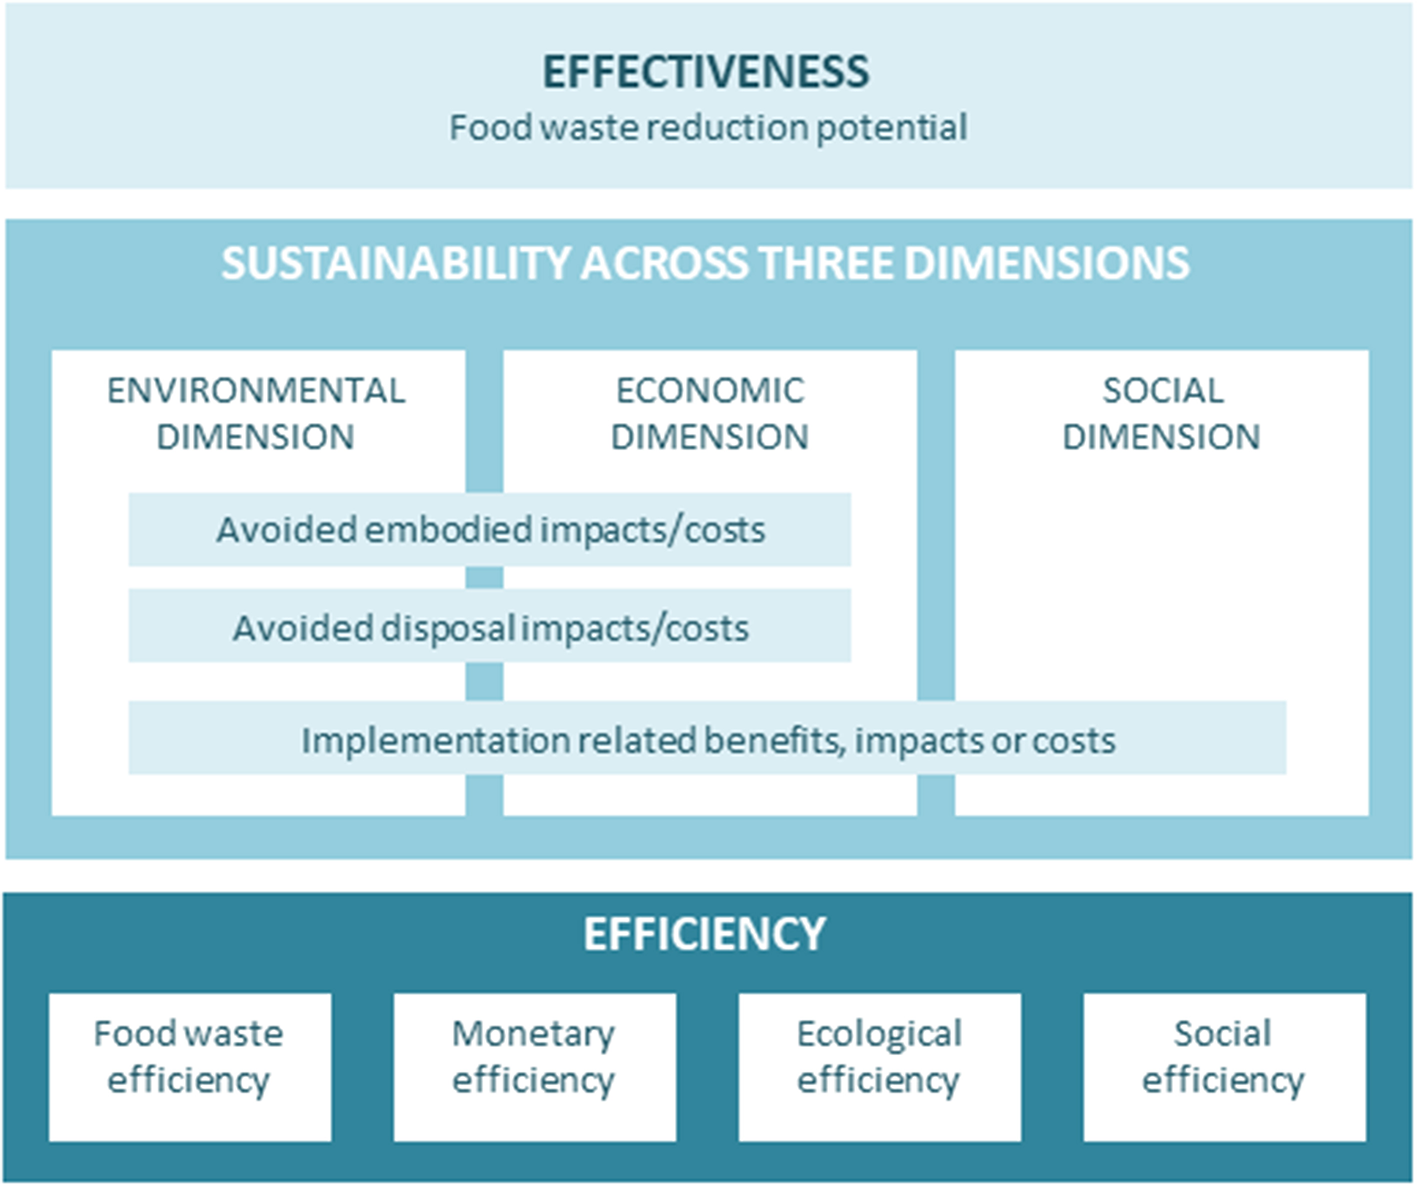
Assessment framework—Quantitative evaluation criteria for food waste prevention measures, inspired by the reporting template developed by the EU JRC within the context of the EU Platform on Food Losses and Food Waste.
Effectiveness or Food Waste Reduction Potential
The effectiveness of a measure or its potential to decrease food waste requires a quantification on a mass basis of food waste prevented (Cristóbal et al., 2018). An assessment of methodologies for quantifying food waste is out of scope of this paper. Guidance on how to measure food waste can be found in the global Food Loss and Waste Accounting and Reporting Standard developed by the Food Loss and Waste Protocol, which is a multi-stakeholder initiative (WRI, 2016). A recent overview of existing methodologies for food waste accounting, as well as an identification of current challenges and opportunities can further be found in the studies from Caldeira et al. (2017), Corrado and Sala (2018), and Corrado et al. (2019).
Sustainability Assessment
Secondly, the sustainability of a measure needs to be analyzed. This involves looking at the three dimensions of sustainability (environmental, economic and social dimension).
Environmental dimension
Environmental impacts or savings arising from the implementation of a food waste prevention measure can be calculated using a life cycle assessment (LCA) approach. As food waste is being prevented, the embodied impacts associated with the food that is now no longer being wasted are avoided. These include all the impacts generated along the different stages of a product's life cycle. The further along the chain food is wasted, the higher its associated embodied impacts as these accumulate along the chain.
The prevention of food waste further means that the end-of-life (EoL) stage is being eliminated. The associated avoided disposal impact hereby depends on the formerly chosen waste management option (FAO, 2013b). These avoided impacts relate to both the waste collection as well as the waste treatment.
Note that for measures belonging to Category 3 (valorization/conversion) or Category 4 (recycling/recovery), the avoided disposal impacts would need to be complemented with other impacts related to what happens with food leaving the food chain. These measures are however out of scope of this paper.
Both the avoided embodied impacts as well as the avoided disposal impacts directly refer to the amount of food waste that is prevented or reduced. An additional source of environmental impacts relates to the implementation of the measure itself. This could refer to changes in logistics or transport (related to for example food redistribution to charities), changes in electricity or water usage, changes in use of packaging or additional use of paper for leaflets and brochures.
Economic dimension
In line with the approach taken in the environmental dimension, food waste prevention measures need to be assessed based on the avoided economic embodied costs, the avoided disposal costs and the implementation costs or savings.
The avoided economic value or embodied cost of food can be determined using the commodity price of a product. Commodity or market prices incorporate the (overhead) costs borne by several actors along the food chain up until the moment of sale, complemented with a certain percentage of profit gain (mark-up) between each of the actors along the chain. In the case of restaurants for example, menu prices are based on the procurement price of each ingredient complemented with operational costs (such as energy and water use, waste management, and cleaning) and personnel costs for preparing and cooking the food. Along the same lines, retail prices incorporate operational and personnel costs borne by a supermarket. As each stage adds up to the cost of food, commodity prices go up as the product moves further along the food supply chain with lowest prices at grower level and highest prices at the end of the supply chain (Teuber and Jensen, 2016; Bellemare et al., 2017). Both menu prices and retail prices however also include a mark-up charged by the restaurant or seller in order to make profit. As a result, using menu and retail prices to estimate the value of food gone wasted, leads to an overestimation of its value (Bellemare et al., 2017).
The avoided costs for food waste disposal include costs for waste sorting (such as removing bad and spoiled produce in supermarkets), waste collection and treatment, as well as all related administrative costs.
In 2013, WRAP (2013d) calculated “the true cost of food waste” in the UK hospitality sector. Food purchasing prices were found to contribute 52.2% to the total cost of food waste. The second largest contributors were labor costs for kitchen staff associated with preparation and cooking of meals (37.4%). Other cost elements referred to energy and water use for preparation and cooking of meals (excl. fixed costs such as energy costs for lighting, water costs for cleaning the restaurant), waste management, and transport costs associated with the collection of food supplies.
Another approach to calculate the costs associated with the food that is no longer being wasted (and its avoided disposal), is the Life Cycle Costing (LCC) approach which takes into account all costs associated with a product or service over its entire life cycle. Next to the obvious costs related to raw materials acquisition, manufacturing and distribution, LCC considers operating and labor costs, research expenditures and waste collection and disposal costs as well, thereby also including foreseeable costs in the future (Hunkeler et al., 2008; Kim et al., 2011; Swarr et al., 2011; Asselin-Balençon and Jolliet, 2014; Martinez-Sanchez et al., 2015; De Menna et al., 2016, 2018). This approach is particularly important in case of Category 3 and 4 measures to fully account for by-products such as animal feed, compost, and electricity.
The third cost item refers to the implementation costs and savings associated with the food waste measure itself, covering both fixed and variable costs. Fixed costs for example include investments in new technologies or materials, investments in new logistics, expenses for printing leaflets and brochures at the start of a campaign, or expenses for personnel training. Variable costs or savings on the other hand refer to changes in daily or continuous activities such as time spent for food production, time spent for waste administration, personnel hours, daily campaign costs, or changes in electricity and water usage.
Social dimension
Next to the environmental and economic effects, there may also be social effects. Redistribution of food waste to food charities for example results in a number of meals given to people. As such, the number of meals saved and subsequently donated can serve as a social indicator.
Another indicator relates to the opportunities for job creation brought about by food waste measures. New jobs may be created in the life cycle stage where food waste is being prevented, as well as in other sectors or stages along the food chain where the food is being reused, recovered, or recycled, such as in food charities or food recycling.
Efficiency
Finally, the efficiency of a measure needs to be calculated using the indicators mentioned above. Evaluating the efficiency of a measure can be done by putting the costs of a measure against its economic benefits, against its waste diversion potential (the amount of food waste that was reduced or prevented), or against the resulting ecological savings such as avoided emissions (Teuber and Jensen, 2016; Cristóbal et al., 2018).
Economic or monetary efficiency
The most common methods to calculate the efficiency of a measure are the benefit-cost ratio and the net benefits. The benefit-cost ratio is obtained through division of the benefits resulting from the implementation of a measure by the costs it took to get there (Investopedia, 2018). The net benefits on the other hand are obtained by subtracting the costs from the benefits.
The investment payback period refers to the amount of time it takes to recover the cost of an investment. The return on investment (ROI) can be calculated by dividing the net benefits by the costs, and expressing this ratio as a percentage (Investopedia, 2019a,b).
For these calculations, only monetary data is taken into account. As such, there are no clear linkages to the food waste reduction volumes or to the ecological savings resulting from food waste reductions. However, if these reduced food waste volumes or ecological savings are expressed in monetary values (such as the economic retail value of food no longer gone wasted or the economic value of the avoided emissions), these could be included in the benefits obtained through the implementation of a food waste measure.
Food waste efficiency, ecological efficiency and social efficiency
The cost for reducing 1 ton of food waste or for abating 1 ton of carbon emissions (CO2 eq.) through a specific measure is calculated through the ratio of the costs of this measure to its food waste reduction potential or emission savings. The most preferable measures would then be those with the lowest per unit cost for food waste reduction or for emission abatement.
A marginal abatement cost (MAC) curve facilitates the visualization of the efficiency of different measures and, more specifically, of these measures with the greatest cost efficiency in terms of reducing food waste volumes or abating carbon emissions. It is based on the costs for reducing 1 ton of food waste or 1 ton of carbon emissions as it plots the cost of each of the measures against the cumulative amount of waste saved by the various measures. The waste diversion or emissions abatement potential of each measure is hereby visualized (Defra, 2012; ReFED, 2016a).
Along the same lines as ecological or food waste efficiency, social efficiency of for example a donation measure can be calculated as the cost for donating 1 meal.
In line with the benefit-cost ratio for monetary efficiency, one could also calculate how much food waste can be reduced, how much emissions can be abated or how many meals can be donated for each euro or dollar put in.
Results
Food Waste Measures and Their Evaluation in Literature
During Step 1 of the literature search, a wide range of measures was found, covering the various players and actors along the food chain from primary production, over storage and processing, retail and wholesale to private consumers and OoH consumption. Supplementary Table S1 gives an overview of over 200 collected measures. To deal with the multitude of measures and/or descriptions of measures found, measures were organized and grouped based on the main theme or aspect the measures focus on. The “Food service—Portion sizes and side dishes” group for example (see group 61 in Supplementary Table S1) contains measures related to adapting portion sizes to target groups, offering smaller portion sizes, offering customers to choose their side dishes, and providing bread or butter on demand. The grouping of the many measures found in literature resulted in 75 groups of measures: 73 groups of avoidance measures and 2 groups of redistribution/donation measures.
Supplementary Table S1 further lists which actors or sectors are, according to their literature sources, involved in each measure. Since this paper focusses on methodologies for evaluating measures rather than on evaluating the measures itself, no further analysis of the measures obtained through this exercise is done.
Step 2 of the literature search resulted in a list of 48 measures for which an evaluation could be found, as shown in Table 1. Following the focus of this paper, those measures identified in Step 1 of the literature search for which no evaluation could be found, are not considered any further. The practical and academic interventions included in Table 1 widely differ in scale: whereas some measures were applied at society level, others were applied within one single company. Furthermore, some of the measures listed in the table, refer to a combined measures applied and evaluated simultaneously or grouped into for example a voluntary agreement or a large-scale campaign, whereas others refer to a single intervention.
Table 1
| Measure (Source) | LC stage or sector in focus | Location & scale | Effectiveness | Sustainability across three dimensions | Efficiency | ||||||||||
|---|---|---|---|---|---|---|---|---|---|---|---|---|---|---|---|
| Environmental | Economic | Social | |||||||||||||
| p | d | i | p | d | i | m | fw | e | s | ||||||
| • Imperfect produce: co-op “Fruta Feia” buys ugly produce from farmers and sells it to consumers through delivery points (Ribeiro et al., 2018) | Agric. | PT, 1 co-op | + | + | + | + | + | – | + | + | + | – | – | – | |
| • Reduced storage temperature for cheese, dairy, deli, and meat (Eriksson et al., 2016) | Retail | SWE, 6 supermarkets | + | + | – | + | + | – | + | – | + | – | – | – | |
| ° Better use of fridges (WRAP, 2013b, 2015; Brown et al., 2014b) | Households | UK, society | + | + | – | + | + | - | + | – | + | – | – | – | |
| ° Freezing at home (Brown et al., 2014a) | Households | UK, society | + | + | – | + | + | – | + | – | + | – | – | – | |
| • Love Food Hate Waste (LFHW) campaign: large-scale communications campaigns, local engagement and changes to products, packaging, labeling, media advertising (WRAP, 2015; Hanson and Mitchell, 2017) | Households, authorities, businesses | UK, society | + | + | + | – | + | + | + | – | + | – | – | – | |
| • Courtauld Commitment—Voluntary agreement (phase 1 and 2). Example measures: setting of clear targets; communication campaigns; improved packaging; community engagement and support; design changes; improved forecasting in retail; provision of tools, guidance and support to supply chain (WRAP, 2010, 2013a,c) | Households, supply chain | UK, society and business level | + | + | + | – | + | + | ? | – | – | – | – | – | |
| ° Novel portion packs for fresh meat (WRAP, 2015) | Households | UK, society | + | – | – | – | – | – | + | – | – | – | – | – | |
| • Campaign “Food: Too Good to Waste (FTGTW)”: behavior change strategies and tools, messaging and outreach tools (EPA, 2016) | Households | US, society | + | – | – | – | – | – | + | – | – | – | – | – | |
| • Bin Cam system capturing and sharing images of waste to online platform (Thieme et al., 2012; Comber and Thieme, 2013) | Households | US, 4 shared households | – | – | – | – | – | – | – | – | – | – | – | – | |
| • Written messages in student dining hall reminding diners to “eat what you take” (Whitehair et al., 2013) | OoH, university dining | US, 1 mensa | + | – | – | – | – | – | – | – | – | – | – | – | |
| • Using 2nd grade vegetables in commercial kitchens (Lynnerup, 2016; Teuber and Jensen, 2016) | OoH | DK, 8 industrial kitchens | + | – | – | – | + | – | + | – | + | – | – | – | |
| • Reduce amounts of food being ordered or prepared; change menus (more child friendly), reduce continuous availability of food on the buffet (Schmidt et al., 2018) | OoH, schools | DE, several schools | + | + | – | – | + | – | – | – | (+) | – | – | – | |
| • The business case for hotels: measure FW, engage staff, rethink the buffet, reduce food overproduction, and repurpose excess food (Clowes et al., 2018b) | OoH, hotels | Global, 42 hotel sites in 15 countries | + | – | – | – | + | + | + | – | + | – | – | – | |
| • The business case for catering: measure FW, engage staff, start small and get creative, reduce overproduction, and repurpose excess food (Clowes et al., 2018a) | OoH, catering | Global, 86 catering sites in 6 countries | + | – | – | – | + | + | + | – | + | – | – | – | |
| • The business case for restaurants: measure FW, engage staff, reduce overproduction, rethink inventory and purchasing practices, and repurpose excess food (Clowes et al., 2019) | OoH, restaurants | Global, 114 restaurants, 12 countries | + | – | – | – | + | + | + | – | + | – | – | – | |
| • Mobile catering in hospitals (Snels and Wassenaar, 2011; Kranert et al., 2012) | OoH, care | NL, 1 hospital | + | – | – | – | + | – | + | – | – | – | – | – | |
| • Trayless system in a buffet-style university dining hall (Thiagarajah and Getty, 2013) | OoH, university dining | US, 1 mensa | + | – | – | – | – | – | – | – | – | – | – | – | |
| • University dining hall: education campaign (Ellison et al., 2017) | OoH, university dining | US, 2 mensas | + | – | – | – | – | – | – | – | – | – | – | – | |
| • Smart scale—Tracking FW with LEANPATH. Case study: Intel's corporate cafeterias (City of Hillsboro, 2010) | OoH, business cafeteria | US, 2 cafeterias | + | + | + | – | + | – | + | – | – | – | – | – | |
| • Smart scale RESOURCE MANAGERFOOD to monitor FW; smaller portions on buffet, changes in buffet refilling, staff awareness (Leverenz et al., 2016) | OoH, hotel | DE, 1 hotel | + | – | – | – | + | – | – | – | – | – | – | – | |
| • Smart scale WINNOW to monitor FW in IKEA (Winnow, 2018a,b) | OoH, restaurant | BE & NL, both 1 business | + | + | ? | – | + | – | – | – | – | – | – | – | |
| • Nudges: reduce plate size and put signs at buffet (Kallbekken and Sælen, 2013) | OoH, hotels | NO, 14 hotels (7 per nudge) + 38 hotels in control group | + | – | – | – | – | – | – | – | – | – | – | – | |
| • Nudges: smaller plate size at buffet (Wansink and van Ittersum, 2013) | OoH, restaurant | US, 43 guests in 1 restaurant | + | – | – | – | – | – | – | – | – | – | – | – | |
| • Use of disposable vs. permanent plates (Williamson et al., 2016) | OoH, lab test + school & university buffet | USA, 2 lab tests + 3 field tests (buffet lunch at school and university) | + | – | – | – | – | – | – | – | – | – | – | – | |
| • Informational and normative prompts in restaurants (related to leftover take-away; Stöckli et al., 2018a) | OoH, restaurant | SWI, business | + | – | – | – | – | – | – | – | – | – | – | – | |
| ° Reduce plate waste by bread on demand, bulk meal delivery, choice of portion size, menu options or quicker status update (Dias-Ferreira et al., 2015) | OoH, hospital | PT, 1 hospital (8,000 meals) | + | + | + | – | + | + | – | – | – | – | – | – | |
| • Improved meal presentation (Navarro et al., 2016) | OoH, hospital | IL, 1 hospital, 206 patients (1/2 control group) | + | – | – | – | – | – | – | – | – | – | – | – | |
| • Redistribution of food to charity (Cicatiello et al., 2016) | retail | IT, 1 supermarket | + | + | – | – | + | – | + | + | + | – | – | – | |
| ° REFED roadmap with 12 avoidance measures (each of them evaluated separately). Example measures: consumer education, waste tracking, trayless dining, packaging adjustments, cold chain management (ReFED, 2016a,b) | Entire food chain | US, society and business | + | + | + | – | + | – | + | – | + | + | – | – | |
| ° REFED roadmap with 7 redistribution measures (each of them evaluated separately). Example measures: donation transportation, donation tax incentives (ReFED, 2016a,b) | Entire food chain | US, society and business | + | + | + | – | + | – | + | + | + | + | – | – | |
| • HaFs Hospitality and Food service Agreement—Voluntary agreement with combined measures. Example measures: setting of clear prevention and waste management targets; define baseline and set up implementation plan; staff awareness, FW monitoring, changes in amounts of food prepared/served; better menu planning; maximize ingredient use (WRAP, 2014, 2017) | OoH | UK, sector | + | + | – | – | + | + | – | – | – | – | – | – | |
Use of evaluation criteria in literature—Summarizing table: Degree to which effectiveness (food waste reduction), sustainability (environmental, economic and social dimension), and efficiency are considered or calculated when evaluating food waste prevention measures.
“+” considered, “–” not considered, “?” not clear, “(+)” considered to a limited extent, “n.a.” not applicable.
For the environmental and economic assessment, a differentiation is made into the consideration of avoided embodied or product-related impacts/costs (p), avoided disposal impacts/costs (d), and implementation impacts/costs (i). For efficiency calculations, a differentiation is made into economic or monetary (m), food waste (fw), ecological (e) or social (s) efficiency. The non-exhaustive table contains both implemented measures (•) as well as proposed measures with projected outcomes (°), with a focus on Out of Home (OoH) sector. Full details on the applied methodologies as found in literature, as well as the results, are provided for in Supplementary Table S2.
Out of the 48 (combined) measures, 25 refer to implemented single and combined measures. The other 23 cases concern single interventions that have been proposed but have not necessarily been implemented and for which the evaluation data refers to projected (not measured) food waste reductions, complemented with foreseen (not measured) environmental, economic, and social impacts where applicable.
The last few years have seen a wide range of (proposed) food waste measures, especially in the UK. Many interventions were part of (or followed from) the UK “Love Food hate Waste” campaign set up by the Waste & Resources Action Programme (WRAP) or from voluntary agreements with the retail sector (“the Courtauld Commitment”) or with the hospitality and food service (HaFS) sector (“HaFS Agreement”). Many of these measures have been evaluated and a wide range of case studies can be found on the WRAP website. In the US, the multi-stakeholder group ReFED (“Rethink Food Waste through Economics and Data”) was set up in 2015 to tackle food waste. In 2016, they presented “A Roadmap to Reduce US Food Waste by 20%” entailing 27 single solutions (12 avoidance, 7 redistribution, and 8 recycling/recovery) together with their projected outcomes for each individual proposed measure (ReFED, 2016a).
It can be noted that many of the evaluations found, concern interventions taking place in the UK and in the US. One important reason being the fact that the literature search was conducted in English. This does however not mean that non-English speaking countries have not evaluated food waste measures. It may merely be that these are to a lesser extent documented in English.
Assessment of Use of Evaluation Criteria in Literature
Step 3 of the literature search involved looking at the extent to which the various evaluation criteria contained in the assessment framework as visualized in Figure 2 are considered and calculated in literature.
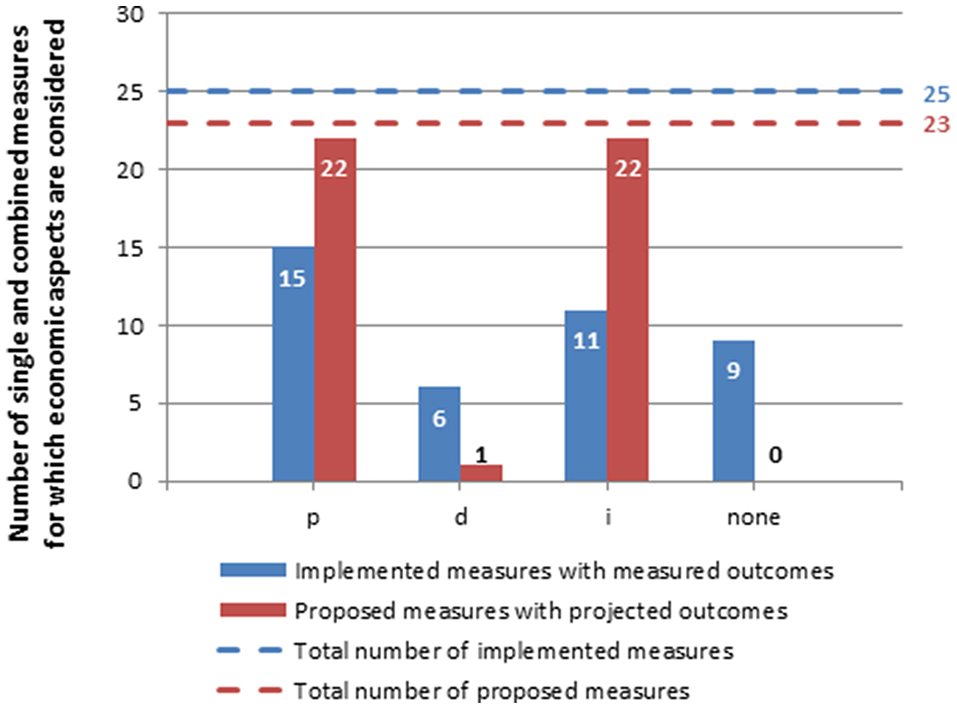
Figure 3 summarizes the number of single and combined measures for which effectiveness, sustainability across the three dimensions and efficiency have been evaluated. Results are given for both the implemented measures with measured outcomes as well as for proposed measures with projected outcomes.
Figure 3
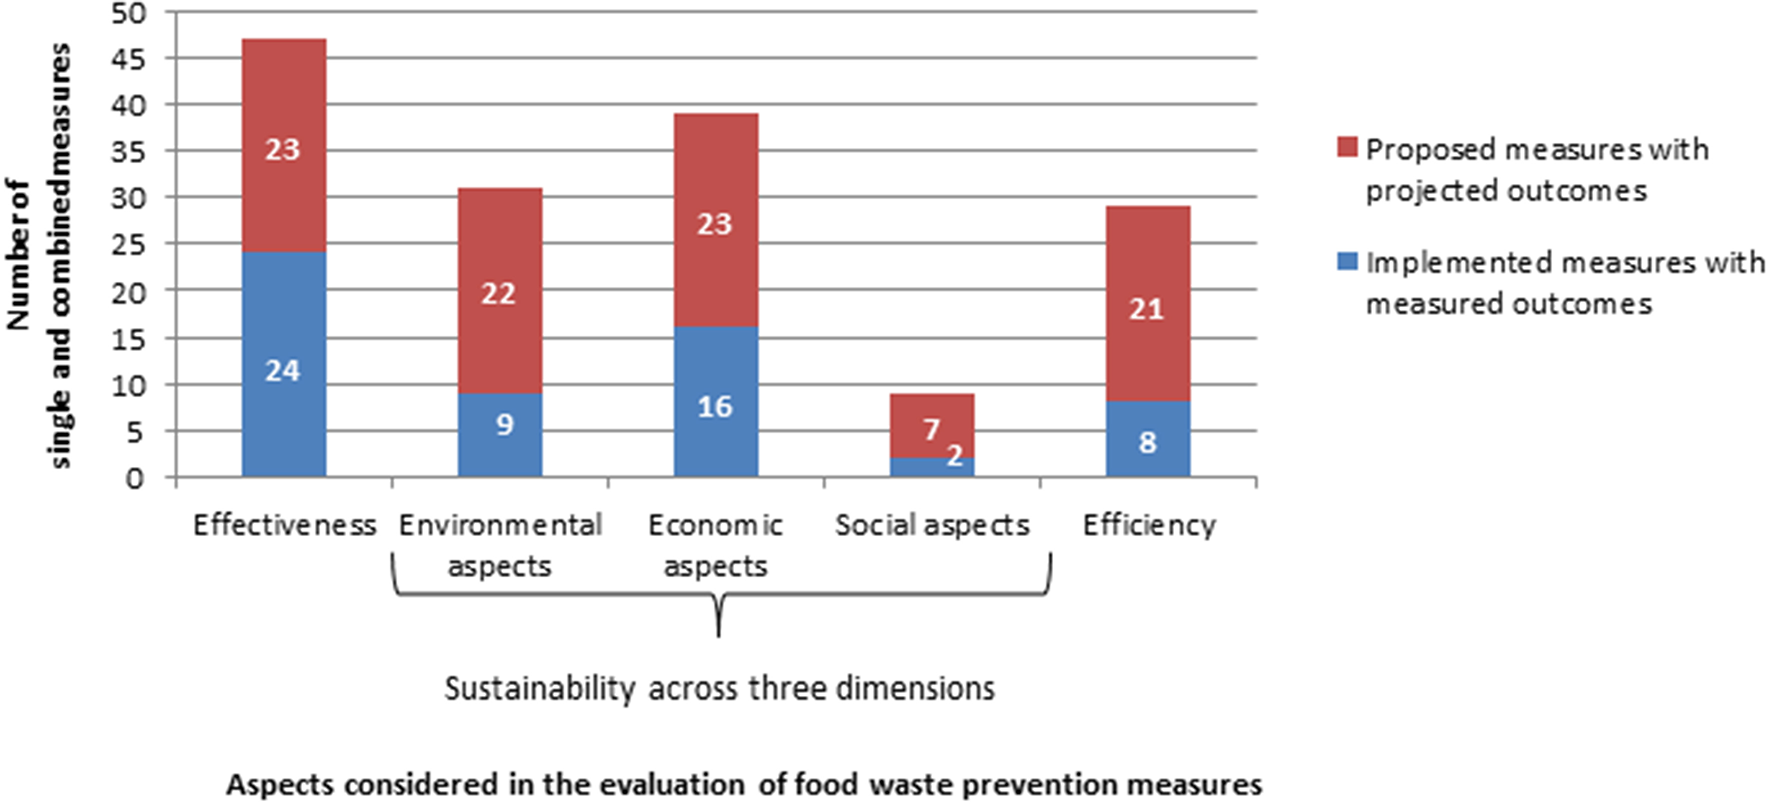
Number of (combined) measures for which effectiveness, sustainability across the three dimensions and efficiency has been evaluated. Overall, 25 implemented single and combined measures, and 23 single proposed measures with projected outcomes are assessed.
Table 1 provides for a schematic summary of the findings for each (combined) measure assessed. These findings are discussed in the next sections; more details on the actual methodology applied in literature for evaluating each (combined) measure, as well as the associated results, can be found in Supplementary Table S2.
It should be noted that all 12 avoidance measures and all 7 donation measures proposed within the ReFED Roadmap are evaluated according to the same methodology when it comes to foreseen food waste reductions, and foreseen environmental, economic, and social effects. As such, the avoidance and donation are taken up together in two single lines in Table 1, whereas in the analysis they count as 19 separate measures with different projected outcomes.
Effectiveness
For 47 out of 48 (combined) measures listed in Table 1, an assessment was made of the effectiveness of an intervention, thereby quantifying (projected) food waste reductions. The only measure for which no actual data on food waste reductions was given (even though it seems it was monitored), is the implemented measure using a so-called “Bin-Cam” which captures and shares images of waste on an online platform (Thieme et al., 2012; Comber and Thieme, 2013). Focus of this measure was assessing impacts on awareness and self-reflection, as well as analyzing social influences rather than actual food waste accounting.
Sustainability Across Three Dimensions
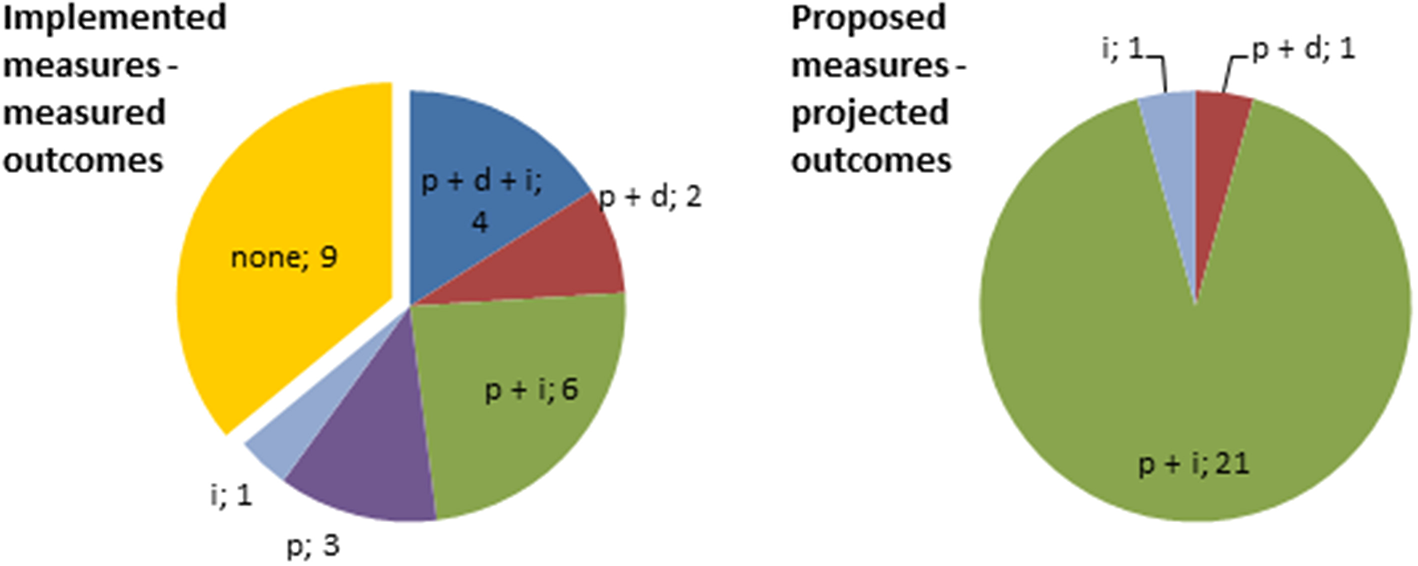
Environmental dimension
Figures 4, 5 show the number of single and combined measures for which environmental aspects are considered during the evaluation. Figure 4 hereby focusses on each sub-criterion on itself, whereas Figure 5 focusses on the combination of sub-criteria assessed simultaneously.
Figure 4
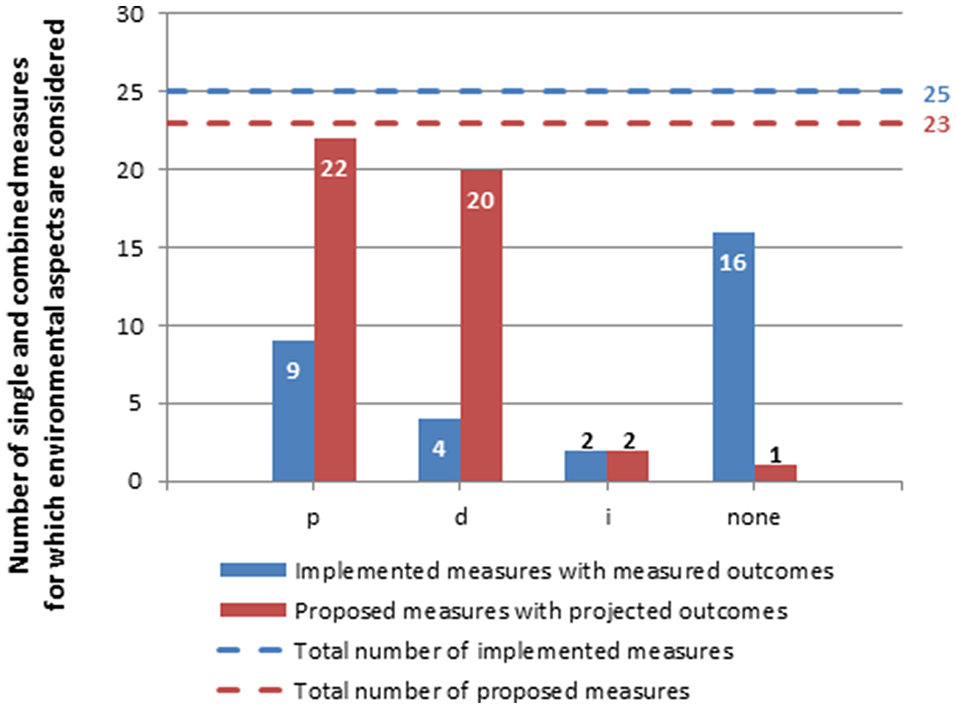
Consideration of environmental aspects in the evaluation of food waste prevention measures: number of single and combined measures for which avoided embodied or product-related impacts (p), avoided disposal impacts (d), and implementation impacts (i) are assessed.
Figure 5
Consideration of environmental aspects in the evaluation of food waste prevention measures: number of single and combined measures for which avoided embodied or product-related impacts (p), avoided disposal impacts (d), and implementation impacts (i) are simultaneously assessed.
The literature search has shown that for 16 out of 25 (combined) implemented measures, and for 1 out of 23 proposed measures, no environmental assessment whatsoever was conducted. The (expected) embodied impacts of the food that no longer goes wasted was calculated for the other 9 implemented and 22 proposed measures. For four implemented measures, the environmental savings related to avoided disposal were also taken into account, next to the embodied impacts. For the proposed measures, this was the case for 20 measures.
Only four cases consider environmental impacts directly or indirectly resulting from the implementation of measures. In three cases, implementation impacts related to electricity use from fridges or freezers were considered next to the embodied emissions of food no longer wasted. This concerns foreseen changes in electricity use from reducing storage temperature of refrigerated items and placing additional items in household fridges (WRAP, 2013b, 2015; Brown et al., 2014b), foreseen changes from freezing food by households to be consumed later on (Brown et al., 2014a), or changes in electricity use from reducing storage temperature at retail level (Eriksson et al., 2016). Avoided disposal was not assessed in these cases.
Only one case, the “Fruta Feia” co-op in Lisbon (Portugal) which buys “ugly” produce form farmers and sells it to consumers, takes into account all three impact elements. The implementation impacts hereby consider additional transport for bringing the ugly produce from the farm to a consumer delivery point, as well as the production of bags and baskets used for distribution (Ribeiro et al., 2018).
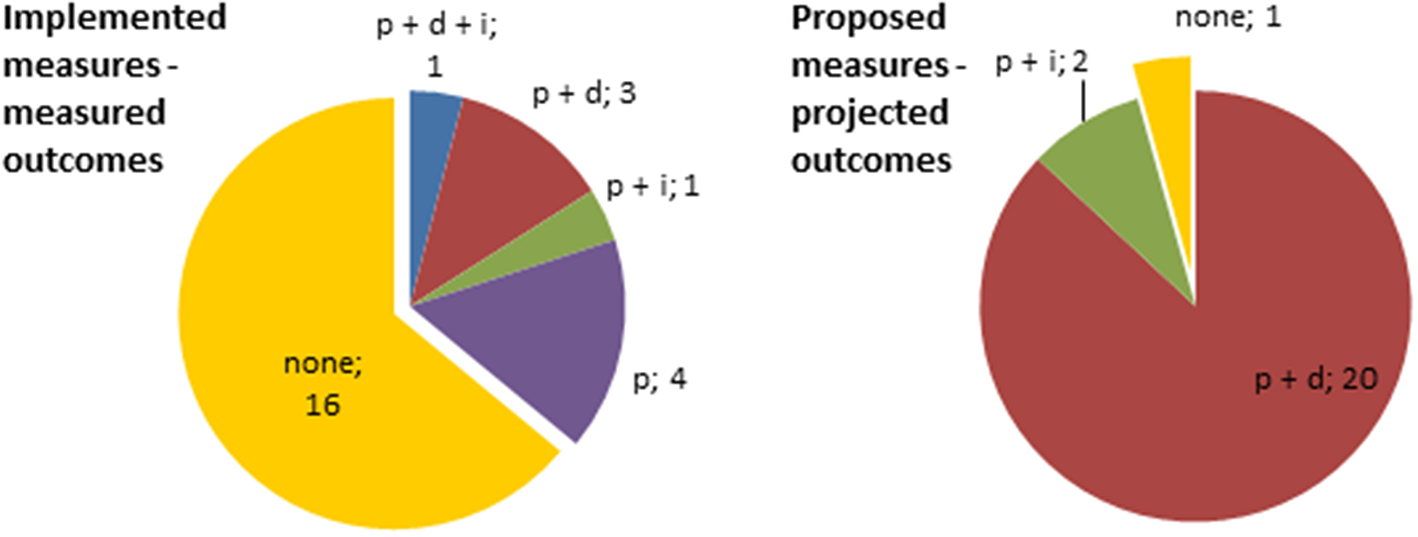
Economic costs or benefits
The literature search has shown that 9 out of 25 implemented measures did not take into account any economic aspect in their evaluation; the proposed measures with projected outcomes all performed some kind of economic evaluation (Figure 6).
Figure 6
Consideration of economic aspects in the evaluation of food waste prevention measures: number of single and combined measures for which avoided embodied or product-related costs (p), avoided disposal costs (d), and implementation costs (i) are assessed.
In 37 of the (combined) implemented and proposed measures, the cost or value of the food that no longer ends up in the bin has been calculated. This is mainly done based on market prices at producer or retail level; the exception being the proposed donation solution from the ReFED Roadmap for which the expected value of saved and donated food is based on data from the US food banks network “Feeding America.”
For six implemented (combined) measures and one proposed measure with projected outcomes, the (expected) avoided costs for waste disposal were also taken into account next to avoided embodied costs (Figure 7). Note that the ReFED roadmap only considers expected avoided disposal costs for recycling/recovery solutions, not for avoidance or donation measures (ReFED, 2016a); hence the “–” in Table 1.
Figure 7
Consideration of economic aspects in the evaluation of food waste prevention measures: number of single and combined measures for which avoided embodied or product-related costs (p), avoided disposal costs (d), and implementation costs (i) are simultaneously assessed.
Costs or benefits directly or indirectly resulting from the implementation of measures have been considered in in total 33 (combined) measures. These refer to investments in logistics, website and computer hardware and recurring costs for transport and personnel (Ribeiro et al., 2018); (expected) additional costs for electricity use from better use of fridges at household (WRAP, 2013b, 2015; Brown et al., 2014b) or retail level (Eriksson et al., 2016); expected additional costs for electricity resulting from freezing food in households to be consumed later on (Brown et al., 2014a); campaign costs for the “Love Food Hate Waste” campaign in the UK (WRAP, 2015; Hanson and Mitchell, 2017) and for the “Food: Too Good to Waste” campaign in the US (EPA, 2016); expected packaging costs for novel portion packs for fresh meat (WRAP, 2015); time spent for trimming second grade vegetables in commercial kitchens (Lynnerup, 2016); time spent for weighting food waste using a smart scale in a business cafeteria (City of Hillsboro, 2010); cost for using smart scales for measuring food waste in restaurants, hotels and catering businesses, as well as other equipment costs, costs for staff training and consulting, and costs associated with menu redesign (Clowes et al., 2018a,b, 2019); personnel savings from mobile catering in hospitals (Snels and Wassenaar, 2011); costs for recovery of food fit for consumption from supermarkets and redistribution to charity (Cicatiello et al., 2016); and projected initial capital expenditures and annual operating expenses throughout the US society and businesses for all 19 prevention interventions proposed within the ReFED Roadmap (ReFED, 2016a).
Only in a limited number of cases all three cost elements of a (combined) measure were considered. This is the case for the evaluation of the UK “Love Food Hate Waste” campaign (WRAP, 2015; Hanson and Mitchell, 2017) and the three Champions 12.3 publications entailing various measures and stressing the financial business case for reducing food waste and losses in restaurants, catering, and hotels (Clowes et al., 2018a,b, 2019).
Social impacts
Social effects have been considered in only nine cases.
When it comes to implemented measures, a social life cycle assessment was performed for the Portuguese “Fruta Feia” project that commercializes imperfect produce. The assessment includes the project's contribution to local employment and community engagement, revenue for local farmers, staff working hours, and the possibility for consumers to buy produce at low prices. Finally, its awareness raising effect is mentioned, resulting in project replication in other regions (Ribeiro et al., 2018). Cicatiello et al. (2016) recovered food waste in supermarkets by redistributing food that is still perfectly fit for consumption to charity. Based on the amounts of food recovered, the authors calculated the number of full meals and dessert and bread portions that could be prepared on a daily basis.
When it comes to proposed measures with projected outcomes, the ReFED roadmap calculates the projected number of meals to be recovered for each of the seven donation measures proposed in the roadmap. Additionally, the Roadmap lists the expected number of jobs that will be created for three out of seven donation measures (ReFED, 2016a).
Efficiency
Efficiency calculations were only performed for 8 out of 25 implemented (combined) measures (Figure 8), even though in some cases the data needed to perform such calculations was available. For proposed measures with projected outcomes, efficiency was calculated in all but two cases.
Figure 8
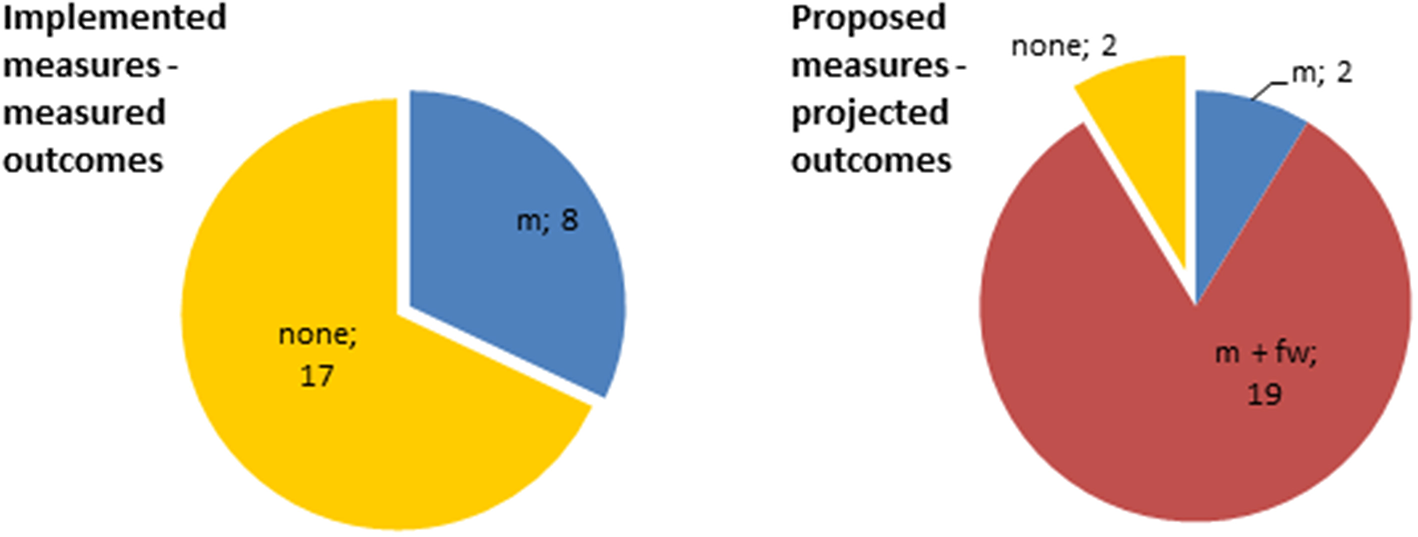
Consideration of efficiency in the evaluation of food waste prevention measures: number of single and combined measures for which economic or monetary (m), food waste (fw), ecological (e) or social (s) efficiency are simultaneously assessed.
Economic or monetary efficiency
The investment pay-back period for the Portuguese “Fruta feia” project has been calculated, and this for two scenarios, namely in case of one or three consumer delivery points (Ribeiro et al., 2018). Additionally, the authors calculated the Social Return on Investment (SROI) to assess the project's contribution to society by monetizing the economic, environmental and social value created. Carbon emissions were hereby assigned a value of €52.7 per ton CO2. The SROI was found to be positive at all times. Thus, for every €1 invested, the social value generation is higher than €1.
Net (expected) benefits resulting from the value of foods no longer being wasted and additional costs from electricity use by fridges or freezers were calculated at household (WRAP, 2013b, 2015; Brown et al., 2014a,b) and retail level (Eriksson et al., 2016). Net benefits were further also calculated for use of second grade vegetables in commercial kitchens, based on the price of the raw products and the time spent for trimming these second grade vegetables (Lynnerup, 2016).
The benefit-cost ratio was applied for evaluating the Love Food Hate Waste (LFHW) campaign in the UK (WRAP, 2015; Hanson and Mitchell, 2017). Benefits hereby referred to avoided disposal costs for local authorities and savings for households in terms of avoiding throwing away food (embodied economic retail value of food that is no longer wasted). Costs on the other hand, referred to the costs of the campaign itself, namely all expenditures by WRAP, local authorities, Courtauld Commitment signatories, and community groups. Based on this approach, they concluded that every £1 spent by the public and private sector contributed to over £250 of savings. Ecological efficiency was not calculated even though environmental impact savings calculations were made.
The benefit-cost ratio was also applied in the Champions 12.3 publications on the business case for reducing food waste and loss by hotels, catering and restaurants (Clowes et al., 2018a,b, 2019). On average, every $1 spent in hotels and restaurants, realized a return of $7. In the catering business, the average return was found to be $6. Based on these data, the Return on Investment (ROI) was calculated as well as the investment payback period. Within 2 years, 95% of the hotels, 80% of the catering companies and 89% of the restaurants had their investments paid back. Since the ecological savings brought about by the food waste measures were not calculated in the first place, no linkage could be made to the ecological efficiency of the measures in each sector.
In its case study to recover food waste from an Italian supermarket and redistribute it to charity, Cicatiello et al. (2016) calculated the efficiency of the intervention by putting the investment costs against the value of the food recovered. For each € 1 invested in the project, about € 4.6 worth of food could be donated.
Based on the upfront and operating expenses (costs) and the cost savings and revenues (benefits) associated with each solution, ReFED (2016a) calculated the expected annual net economic value associated with each of the 19 proposed avoidance and donation solutions put forward. Combining these 19 prevention solutions with the 8 proposed recycling/recovery solutions, ReFED states that with a $18 billion investment, the Roadmap is expected to yield $100 billion in societal Economic Value over a decade (ReFED, 2016a).
Food waste efficiency, ecological efficiency, and social efficiency
Specific calculations indicating food waste efficiency in terms of costs per kilogram of food waste prevented tend to be missing even though the needed data was often available. The only exception is the ReFED roadmap which, based on per unit costs, visualizes the waste diversion potential of all solutions under study (including recycling/recovery solutions) using a MAC curve. The curve “ranks all 27 solutions based on their cost-effectiveness, or societal Economic Value generated per ton of waste reduced, while also visualizing the total diversion potential of each solution” (ReFED, 2016a).
In none of the cases, ecological efficiency was calculated. Following monetization of the emission savings, the study on the Fruta Feia project did however incorporate ecological impacts into its monetary efficiency calculations (Ribeiro et al., 2018).
Similarly, none of the cases calculated social efficiency even though it is implicitly taken on board by Cicatiello et al. (2016) through its monetary efficiency calculations stating that each euro invested resulted in €4.6 worth of food being donated.
Multi-objective or pareto optimization
Cristóbal et al. (2018) propose a novel methodology, based on LCA and mathematical programming, to visualize efficiency and help decision makers identify the most preferable measure. The model involves multi-objective optimization (or Pareto optimization) of environmental and economic objectives. Taken into consideration are the economic costs associated with each measure, the total budget available for reducing food waste, and the total environmental impacts that can be avoided by implementing the measure (and thus by reducing food waste). The model aims at maximizing environmental savings while constraining the costs of the measures within the limited budget available. Afterwards, a Pareto front can be obtained whereby each point in the Pareto front or graph corresponds to a different combination of measures that for each budget maximizes the total environmental impact avoided.
Using a selection of the 27 solutions mentioned in the ReFED roadmap, Cristóbal et al. (2018) performed a multi-objective optimization of the total environmental impact avoided (TEIA) by each measure within the constraints of a specific budget. Doing so, the authors identified which actions to prioritize for obtaining the highest TEIA, and this for 16 scenarios with each a specific budget available.
Discussion
Main Findings
The present paper has shown that a wide range of measures and activities is being proposed, both at scientific as well as at practical level, and this for all stages and actors along the food chain. In total, over 200 measures were identified through the first step of the literature search.
The second step of the second literature search showed that only for a limited number of measures, an evaluation was conducted. The measures for which an evaluation was available refer to both single measures (such as monitoring of food waste in a commercial kitchen) as well as combined actions (such as voluntary agreements or large-scale campaigns). Based on the analysis made, it seems that not all measures found during Step 1 of the literature search have been evaluated. However, this paper is based on the rapid review approach as a less time-consuming alternative to a systematic review. This resulted in non-exhaustive lists of proposed and/or evaluated food waste measures which may not capture the full spectrum of measures (and their evaluations) being available in literature. Additionally, due to language restrictions in the literature search, the results are biased toward measures and their evaluations published in English (and German). As such, no statements can be made at this point on the percentage of measures for which an evaluation has been conducted.
Effectiveness or Food Waste Reduction Potential
In total, evaluations were found for 48 (combined) measures with 25 of them referring to implemented measures and 23 to proposed measures with projected outcomes. The collected evaluations all include information on the food waste reductions achieved by the measure applied or proposed, with the exception of one measure for which monitoring of food waste reductions seemed to be present but for which no data was published.
For the purpose of this paper, no analysis was made whether or not targets were set for each (combined) measure and to what extent these targets were (or will be) achieved.
Sustainability: Environmental Dimension
When it comes to environmental evaluation of measures, avoided embodied impacts associated with food waste reductions were considered in 65% of the cases and avoided disposal impacts were calculated in 50% of the cases. Implementation impacts on the other hand were only regarded in 8% of the cases. There are however differences in how implemented and proposed measures are evaluated. In case of implemented measures, avoided embodied impacts are only assessed in 36% of the (combined) measures whereas this percentage goes up to 96% in the case of proposed measures. Similarly, avoided disposal impacts are assessed in 16% of the implemented measures and 87% of the proposed measures. Consideration of implementation impacts is comparable with 8% for implemented measures and 9% for proposed measures.
In total, only four cases considered environmental implementation impacts. We could however expect (minor) changes in environmental impacts for other measures as well in case for example operational parameters such as water and electricity use change, in case more or other packaging is applied to increase shelf life or improve portioning, or in case food is donated to charity requiring additional transport.
The lower share of implemented measures having received an environmental evaluation as compared to the proposed measures may indicate that making projections for foreseen impact reductions is easier than actually measuring and calculating impact savings for implemented measures in practice.
Looking at the combinations of environmental evaluation criteria simultaneously considered and thus at the completeness of the environmental evaluation performed, only one study had a complete environmental evaluation whereby all three environmental impact elements (product-related, avoided disposal and implementation impacts) were assessed. For 30 (combined) measures, only one or two out of the three environmental impact elements were considered (incomplete evaluation), whereas for 17 (combined) measures, the environmental assessment was missing as a whole (evaluation missing).
Sustainability: Economic Dimension
More information was found for economic costs and benefits associated with food waste measures. In 77% of the cases, the economic value of the food that is no longer being thrown away is calculated; avoided disposal costs are calculated in 15% of the cases. Specific costs associated with the implementation of measure(s) are assessed in 69% of the collected (combined) measures. We hereby note that for two of these cases, these were the only costs provided as embodied cost savings or savings from avoided waste disposal were not taken up.
Here as well, discrepancies are found in how implemented measures are evaluated as compared to proposed measures with projected outcomes. For both avoided embodied costs and implementation costs, a lower share of the implemented measures take into account these sub-criteria in their evaluation (respectively 77 and 69% as compared to twice 96% for the proposed measures). The avoided disposal costs on the other hand are more frequently addressed in the evaluation of implemented measures (24% as compared to only 4% for proposed measures) as none of the 19 prevention solutions in the ReFED roadmap takes this into consideration.
Looking at the completeness of each economic evaluation, four implemented measures were evaluated using all three economic cost elements (product-related, avoided disposal, and implementation costs), resulting in a complete evaluation. For 12 implemented and all 23 proposed measures, one or two out of three cost elements were taken into account (incomplete evaluation), whereas for nine implemented measures, the economic evaluation was missing as a whole.
In general, the “implementation costs and impacts” sub-criterion is more frequently considered in the economic evaluation than it is in the environmental evaluation. Unfortunately, our literature search did not allow for drawing conclusions on the reason behind this. One explanation may be that the (expected) environmental impacts associated with the implementation of a specific measure are harder to calculate than the economic ones. It may however also be that practitioners are less aware of the importance of including this factor in their evaluation.
Sustainability: Social Dimension
Only nine measures considered social effects, reporting job creation, number of meals saved through donation, or a combination of both.
Efficiency
Many studies omitted efficiency calculations even though the necessary data was available. Economic or monetary efficiency was calculated in 60% of the collected (combined) measures, mostly by calculating net benefits or the benefit-cost ratio. Again, the share of implemented measures for which monetary efficiency was calculated (32%) was lower than the share of proposed measures (91%).
None of the studies under research calculated ecological or social efficiency.
Food waste efficiency on the other hand was calculated in the ReFED roadmap, with results for all solutions being visualized in a MAC curve. This results in 40% of all measures considering this criterion, or 83% of the proposed measures (and 0% of the implemented measures).
One study provided for a novel approach in optimizing avoided environmental impacts and measure implementation costs within budget constraints using Pareto optimization.
Framework for Evaluating Food Waste Actions and Selection of Evaluation Criteria
Quantitative Criteria
The evaluation criteria considered in the present paper are limited to quantitative criteria such as effectiveness, sustainability across three dimensions, and efficiency. Both effectiveness and sustainability across three dimensions are also taken up in the JRC reporting template for evaluating food waste prevention measures under the overarching heading of the evaluation criterion “efficiency” (EC-JRC, 2018a,b). It is not clear if specific efficiency calculations as considered within the context of the present paper are also to be reported within the JRC reporting template. The JRC template further includes the additional aspect of “outreach impact” as one of the sub-criteria for assessing efficiency of measures (EC-JRC, 2018a,b).
Qualitative Evaluation Criteria Complementing Quantitative Criteria
The JRC reporting template further includes the following qualitative and descriptive criteria: quality of the action design (problem identification; setting of aims, objectives, and key performance indicators; implementation plan), sustainability over time (continuity of the action; long term strategic plans), transferability and scalability (ability to be transferred from one place/situation to another; ability to grow or to be made larger), and inter-sectorial cooperation (EC-JRC, 2018a,b, 2019).
The assessment performed in the context of this paper focussed on quantitative criteria for evaluating food waste prevention measures. Some evaluations found in literature however also included qualitative aspects complementing or replacing quantitative data. In their evaluation of measures addressing food waste in schools for example, Schmidt et al. (2018) indicated the estimated time, labor, and costs that go with a selection of measures as well as staff willingness to implement these measures. Expenses, costs, or willingness to implement the measure are hereby expressed as “low,” “average,” or “high.” In 2018, ReFED published a food waste action guide specifically targeted to the restaurant sector (ReFED, 2018). The guide includes a “Restaurant Solution Matrix” helping restaurants prioritize solutions based on a combination of profit potential and feasibility of each measure. Profit potential refers to the net annual business benefits and/or cost savings of a given solution, thereby excluding initial investments. Feasibility combines the level of effort (e.g., the behavior, systems, and process changes required) with the initial financial capital needed to implement a solution (ReFED, 2018). The resulting feasibility matrix thus links quantitative data to qualitative data.
Such qualitative data sheds light on existing barriers for implementation and thus provides valuable information for transferring and upscaling measures addressing food waste.
Singling Out Effects
The evaluation of food waste measures is often hampered by the fact that it can be hard to single out the effects of one specific measure, as also pointed out in literature (Stöckli et al., 2018a,b). Multiple interventions are often ongoing at the same time, making it hard to say how much of the food waste reduction is attributable to each specific measure. This paper also identified various combined measures (with some of them being implemented together as a package), for which evaluations were done for all measures together as a whole.
The 19 promising prevention measures proposed within the ReFED Roadmap are evaluated on an individual basis, and projected outcomes are given for each measure. In practice however, it may be harder to isolate the effects of each individual measure as other (possibly less promising) measures may be applied at the same time.
Additionally, there might be societal influences. For its evaluation of the Love Food Hate Waste (LFHW) campaign for example, WRAP (2015) stressed that, next to the campaign, also deep recession and rapidly rising food prices contributed to lowering food waste during the period of evaluation.
Rebound Effect and Market Feedback Links
Next to the direct impacts and costs, some less visible or indirect feedback mechanisms take place when implementing food waste prevention measures. The first one is “the rebound effect.” The prevention of food waste in households for example, might result in less money being spent on purchasing food. The money that becomes available can then be spent on other goods or services. The way it is spent, will greatly affect the environmental benefits from preventing the food ending up as waste. In case the money is spent on more environmentally damaging food and non-food products and/or services, the final benefits from food waste reduction are offset, which is called the rebound effect (Rutten et al., 2013; Bernstad Saraiva Schott and Cánovas, 2015; WRAP, 2015; Martinez-Sanchez et al., 2016; Teuber and Jensen, 2016; Beretta et al., 2017; Salemdeeb et al., 2017; Cristóbal et al., 2018; Wunder et al., 2019).
A second issue relates to market feedback links: as food waste prevention measures affect the demand side for food, also the interactions between demand and supply will be affected, thereby having its repercussions on the entire food market system (Britz et al., 2014). These aspects could also be considered when evaluating measures. The present paper did however not look into whether existing evaluations of food waste measures included rebound effects or market feedback links. The JRC reporting template does not consider these criteria either.
Way Forward
To get an insight in ongoing measures, the EU Platform on Food Losses and Food Waste (see above) asked its members and other relevant stakeholders to provide information on existing food waste prevention activities (EU FLW, 2017). Using its reporting template for evaluating food waste measures, the EU JRC is currently evaluating the collected information (EU FLW, 2017; EC-JRC, 2018a). The present paper complements ongoing work at EU level by providing information on the quantitative evaluation of food waste measures (applied within the EU and beyond) available in literature, and more specifically by providing information on the evaluation methodologies applied hitherto.
This paper concludes that there is a great variety in how measures are evaluated in literature. Additionally, in many cases, economic, environmental, or social assessments are incomplete or missing, and efficiency is only seldom calculated. This hampers practitioners and decision-makers to compare food waste interventions, identify trade-offs and prioritize actions. A more aligned approach on which evaluation criteria to consider and how to calculate the associated indicators would give more insight in which actions are most promising. Moreover, more complete information on the effectiveness and efficiency of measures would make incentives for reducing food waste at various levels along the food chain more visible.
To facilitate the evaluation of food waste measures in the future, it is important to determine essential evaluation criteria and how these should be assessed, ideally before the implementation of a measure. This is exactly what the JRC reporting template is working toward to ensure that, from the early start on, the right data can be gathered at the right time, thereby avoiding data gaps.
A reflection on the various evaluation criteria across the different dimensions (effectiveness, efficiency, scalability…) at the very beginning of the development of food waste actions may create greater awareness by those in charge of defining and implementing measures. This in turn might already result in more effective and efficient measures as practitioners might pursue to perform well in all domains, whereas before, they might have only focused on for example the economic benefits of a measure.
This paper therefore calls for a thorough evaluation of proposed and implemented measures tackling food waste, using a harmonized approach based on an agreed set of evaluation criteria. The authors welcome the developments at EU level, in particular the JRC reporting template, and hope both practitioners and researchers will follow or be inspired by this approach to successfully contribute to a reduction of food waste along the entire chain.
Statements
Author contributions
YG performed the literature search and subsequent analysis, and wrote the first draft of the manuscript. AW and TS contributed to conception and design of the study, as well as to redrafting the manuscript during the review process. All authors contributed to manuscript revision, read, and approved the submitted version.
Conflict of interest
The authors declare that the research was conducted in the absence of any commercial or financial relationships that could be construed as a potential conflict of interest.
Supplementary material
The Supplementary Material for this article can be found online at: https://www.frontiersin.org/articles/10.3389/fsufs.2019.00090/full#supplementary-material
References
1
Aschemann-WitzelJ.HoogeI. E.de RohmH.NormannA.BossleM. B.GrønhøjA.et al. (2017). Key characteristics and success factors of supply chain initiatives tackling consumer-related food waste – A multiple case study. J. Clean. Prod.155, 33–45. 10.1016/j.jclepro.2016.11.173
2
Asselin-BalençonA. C.JollietO. (2014). Metrics and indices to assess the life cycle costs and greenhouse gas impacts of a dairy digester. J. Clean. Prod.79, 98–107. 10.1016/j.jclepro.2014.05.024
3
BellemareM. F.ÇakirM.PetersonH. H.NovakL.RudiJ. (2017). On the measurement of food waste. Am. J. Agric. Econ.99, 1148–1158. 10.1093/ajae/aax034
4
BerettaC.StuckiM.HellwegS. (2017). Environmental impacts and hotspots of food losses: value chain analysis of swiss food consumption. Environ. Sci. Technol.51, 11165–11173. 10.1021/acs.est.6b06179
5
Bernstad Saraiva SchottA.CánovasA. (2015). Current practice, challenges and potential methodological improvements in environmental evaluations of food waste prevention – a discussion paper. Resour. Conserv. Recyc.101, 132–142. 10.1016/j.resconrec.2015.05.004
6
BritzW.DuduH.FerrariE. (2014). Economy-wide impacts of food waste reduction: a general equilibrium approach, in Agri-Food and Rural Innovations for Healthier Societies: EAAE 2014 Congress (Ljubljana).
7
BrownT.HippsN. A.EastealS.ParryA.EvansJ. A. (2014a). Reducing domestic food waste by freezing at home. Int. J. Refrig.40, 362–369. 10.1016/j.ijrefrig.2013.12.009
8
BrownT.HippsN. A.EastealS.ParryA.EvansJ. A. (2014b). Reducing domestic food waste by lowering home refrigerator temperatures. Int. J. Refrig.40, 246–253. 10.1016/j.ijrefrig.2013.11.021
9
CaldeiraC.CorradoS.SalaS. (2017). Food Waste Accounting: Methodologies, Challenges and Opportunities: JRC Technical Reports. Ispra: EC-JRC, European Commission Joint Research Centre.
10
CicatielloC.FrancoS.PancinoB.BlasiE. (2016). The value of food waste: an exploratory study on retailing. J. Retail. Consum. Services30, 96–104. 10.1016/j.jretconser.2016.01.004
11
City of Hillsboro (2010). Food Waste Prevention Case Study: Intel Corporation's Cafés.City of Hillsboro.
12
ClowesA.HansonC.SwannellR. (2019). The Business Case for Reducing Food Loss and Waste: Restaurants. Champions 12.3.
13
ClowesA.MitchellP.HansonC. (2018a). The Business Case for Reducing Food Loss and Waste: Catering. Champions 12.3.
14
ClowesA.MitchellP.HansonC. (2018b). The Business Case for Reducing Food Loss and Waste: Hotels. Champions 12.3.
15
ComberR.ThiemeA. (2013). Designing beyond habit: opening space for improved recycling and food waste behaviors through processes of persuasion, social influence and aversive affect. Pers Ubiquit Comput.17, 1197–1210. 10.1007/s00779-012-0587-1
16
CorradoS.CaldeiraC.ErikssonM.HanssenO. J.HauserH.-E.van HolsteijnF.et al. (2019). Food waste accounting methodologies: challenges, opportunities, and further advancements. Glob. Food Secur.20, 93–100. 10.1016/j.gfs.2019.01.002
17
CorradoS.SalaS. (2018). Food waste accounting along global and European food supply chains: state of the art and outlook. Waste Manage.79, 120–131. 10.1016/j.wasman.2018.07.032
18
CristóbalJ.CastellaniV.ManfrediS.SalaS. (2018). Prioritizing and optimizing sustainable measures for food waste prevention and management. Waste Manage.72, 3–16. 10.1016/j.wasman.2017.11.007
19
De MennaF.DietershagenJ.LoubiereM.VittuariM. (2018). Life cycle costing of food waste: a review of methodological approaches. Waste Manage.73, 1–13. 10.1016/j.wasman.2017.12.032
20
De MennaF.LoubiereM.DietershagenJ.UngerN.VittuariM. (2016). Methodology for Evaluating LCC.Deliverable 5.2, REFRESH.
21
Defra (2012). Waste Prevention Actions for Priority Wastes. Economic Assessment Through Marginal Abatement Cost Curves. Final report, Defra.
22
Dias-FerreiraC.SantosT.OliveiraV. (2015). Hospital food waste and environmental and economic indicators–A Portuguese case study. Waste Manage.46, 146–154. 10.1016/j.wasman.2015.09.025
23
EC-JRC (2018a). Collection and assessment of food waste prevention actions: meeting of the subgroup on action and implementation, 19.03.2018, in EU Platform on Food Losses and Food Waste, 2018 (EC-JRC). Available online at: https://ec.europa.eu/food/sites/food/files/safety/docs/fw_eu-platform_20180319_sub-ai_pres-04.pdf (accessed May 08, 2019).
24
EC-JRC (2018b). Framework for the assessment of food waste prevention actions: meeting of the subgroup on action and implementation, in EU Platform on Food Losses and Food Waste, 2018 (EC-JRC). Available online at: https://ec.europa.eu/food/sites/food/files/safety/docs/fw_eu-platform_20181001_sub-ai_pres-05.pdf
25
EC-JRC (2019). Collection and evaluation of food waste prevention actions: meeting of the subgroup on action and implementation, in EU Platform on Food Losses and Food Waste, 2019 (EC-JRC). Available online at: https://ec.europa.eu/food/sites/food/files/safety/docs/fw_eu-platform_20190318_sub-ai_pres-01.pdf (accessed May 08, 2019).
26
EllisonB.NehrlingE. W.NikolausC. J.DuffB. R. L. (2017). Evaluation of a food waste reduction campaign in a University Dining Hall. J. Nutr. Educ. Behav.49, S9–S10. 10.1016/j.jneb.2017.05.032
27
EPA (2016). Food: Too Good To Waste.An Evaluation Report for the Consumption Workgroup of the West Coast Climate and Materials Management Forum, EPA.
28
ErikssonM.StridI.HanssonP.-A. (2016). Food waste reduction in supermarkets – net costs and benefits of reduced storage temperature. Resour. Conserv. Recycl.107, 73–81. 10.1016/j.resconrec.2015.11.022
29
EU FLW (2017). Roadmap for the ‘Action and Implementation' Sub-Group: Key Milestones and Deliverables. EU Platform on Food Losses and Food Waste (FLW).
30
FAO (2013a). Food Wastage Footprint: Impacts on Natural Resources. Summary Report, FAO.
31
FAO (2013b). Toolkit - Reducing the Food Wastage Footprint. FAO.
32
FAO (2014). Food Wastage Footprint: Full-Cost Accounting. Final Report, FAO.
33
FAO (2015). Food Wastage Footprint & Climate Change. FAO.
34
FUSIONS (2016). Estimates of European Food Waste Levels. FUSIONS.
35
GustavvsonJ.CederbergC.SonessonU.van OtterdijkR.MeybeckA. (2011). Global Food Losses and Food Waste: Extent, Causes and Prevention. Rome: FAO.
36
HansonC.MitchellP. (2017). The Business Case for Reducing Food Loss and Waste. Champions 12.3.
37
HLPE (2014). Food Losses and Waste in the Context of Sustainable Food Systems. HLPE.
38
Huber-HumerM.ScherhauferS.ObersteinerG.UngerN. (2017). Selected material stocks and flows: food waste (Section 3.9), in Circular Economy - A Fact Book on the Circular Economy, ed ScharffC. (Vienna: Circular Economy Coalition for Europe (CEC4Europe)).
39
HunkelerD.LichtenvortK.RebitzerG. (2008). Environmental Life Cycle Costing. Hoboken, NJ: CRC Press. 10.1201/9781420054736
40
Investopedia (2018). Cost-Benefit Analysis (CBA). Available online at: https://www.investopedia.com/terms/c/cost-benefitanalysis.asp (accessed February 20, 2019).
41
Investopedia (2019a). Pay-Back Period. Available online at: https://www.investopedia.com/terms/p/paybackperiod.asp (accessed February 20, 2019).
42
Investopedia (2019b). Return on Investment (ROI). Available online at: https://www.investopedia.com/terms/r/returnoninvestment.asp (accessed February 20, 2019).
43
KallbekkenS.SælenH. (2013). ‘Nudging' hotel guests to reduce food waste as a win–win environmental measure. Econ. Lett.119, 325–327. 10.1016/j.econlet.2013.03.019
44
KimM.-H.SongY.-E.SongH.-B.KimJ.-W.HwangS.-J. (2011). Evaluation of food waste disposal options by LCC analysis from the perspective of global warming: jungnang case, South Korea. Waste Manage.31, 2112–2120. 10.1016/j.wasman.2011.04.019
45
KoesterU.LoyJ.-P.RenY. (2018). Measurement and Reduction of Food Loss and Waste – Reconsidered. IAMO Policy Brief, 34.
46
KranertM.HafnerG.BaraboszJ.SchullerH.LeverenzD.KölbigA.et al. (2012). Ermittlung der Weggeworfenen Lebensmittelmengen und Vorschläge zur Verminderung der Wegwerfrate bei Lebensmitteln in Deutschland: Projektförderung. Bundesanstalt für Landwirtschaft und Ernährung (BLE).
47
KummuM.MoelH.de PorkkaM.SiebertS.VarisO.WardP. J. (2012). Lost food, wasted resources: global food supply chain losses and their impacts on freshwater, cropland, and fertiliser use. Sci. Total Environ.438, 477–489. 10.1016/j.scitotenv.2012.08.092
48
LeverenzD.PilslP.HafnerG. (2016). Entwicklung einer Anwendung zur Erfassung, Bewertung und Vermeidung von Lebensmittelabfällen in gastronomischen Einrichtungen, in 6. Wissenschaftskongress “Abfall- und Ressourcenwirtschaft” 2016 (Berlin: Deutsche Gesellschaft für Abfallwirtschaft DGAW).
49
LynnerupD. (2016). Mindre Madspild ved Anvendelse af 2. Sorterings Grøntsager i Storkøkkener: Less Food Waste by Using 2nd Grade Vegetables in Industrial Kitchens. Copenhagen: Ministry of Evironment (Miljøstyrelsen).
50
Martinez-SanchezV.KromannM. A.AstrupT. F. (2015). Life cycle costing of waste management systems: overview, calculation principles and case studies. Waste Manage.36, 343–355. 10.1016/j.wasman.2014.10.033
51
Martinez-SanchezV.ToniniD.MøllerF.AstrupT. F. (2016). Life-cycle costing of food waste management in Denmark: importance of indirect effects. Environ. Sci. Technol.50, 4513–4523. 10.1021/acs.est.5b03536
52
NavarroD. A.BoazM.KrauseI.ElisA.ChernovK.GiabraM.et al. (2016). Improved meal presentation increases food intake and decreases readmission rate in hospitalized patients. Clin. Nutr.35, 1153–1158. 10.1016/j.clnu.2015.09.012
53
ÖstergrenK.GustavvsonJ.Bos-BrouwersH.TimmermansT.HanssenO. J.MøllerH.et al. (2014). FUSIONS Definitional Framework for Food Waste: Full Report. FUSIONS (Food Use for Social Innovation by Optimising Waste Prevention Strategies), EU FP7 Project.
54
PiraniS. I.ArafatH. A. (2014). Solid waste management in the hospitality industry: a review. J. Environ. Manage.146, 320–336. 10.1016/j.jenvman.2014.07.038
55
ReFED (2016a). A Roadmap to Reduce US Food Waste by 20%.ReFED.
56
ReFED (2016b). A Roadmap to Reduce US Food Waste by 20%. Technical Appendix, ReFED.
57
ReFED (2018). Restaurant Food Waste Action Guide. ReFED.
58
ReynoldsC.GoucherL.QuestedT.BromleyS.GillickS.WellsV. K.et al. (2019). Review: consumption-stage food waste reduction interventions - What works and how to design better interventions. Food Policy83, 7–27. 10.1016/j.foodpol.2019.01.009
59
RibeiroI.SobralP.PeçasP.HenriquesE. (2018). A sustainable business model to fight food waste. J. Clean. Prod.177, 262–275. 10.1016/j.jclepro.2017.12.200
60
RuttenM.NowickiP.BogaardtM.-J.AramyanL. (2013). Reducing Food Waste by Households and in Retail in the EU – A Prioritisation Using Economic, Land Use and Food Security Impacts. LEI Wageningen UR.
61
SalemdeebR.Font VivancoD.Al-TabbaaA.ErmgassenE. K. H. J. (2017). A holistic approach to the environmental evaluation of food waste prevention. Waste Manage.59, 442–450. 10.1016/j.wasman.2016.09.042
62
ScherhauferS.MoatesG.HartikainenH.WaldronK.ObersteinerG. (2018). Environmental Impacts of Food Waste in Europe. New York, NY: Waste Management.
63
SchmidtT.BaumgartdS.BlumenthalA.BurdickB.ClaupeinE.DirksmeyerW.et al. (2018). Wege zur Reduzierung von Lebensmittelabfällen - Pathways to Reduce Food Waste (REFOWAS). Dritter Zwischenbericht zu Nr. 3.1 BNBest-BMBF 98. Thünen Institute/REFOWAS Project.
64
SchneiderF. (2013). Review of food waste prevention on an international level. Proc. Instit. Civil Eng.166, 187–203. 10.1680/warm.13.00016
65
SnelsJ.WassenaarN. (2011). Maaltijdservice Máx à la Carte. Effecten van een Nieuw Maaltijdconcept Binnen Máxima Medisch Centrum. Wageningen: UR Food & Biobased Research.
66
StöckliS.DornM.LiechtiS. (2018a). Normative prompts reduce consumer food waste in restaurants. Waste Manage.77, 532–536. 10.1016/j.wasman.2018.04.047
67
StöckliS.NiklausE.DornM. (2018b). Call for testing interventions to prevent consumer food waste. Resour. Conserv. Recycl.136, 445–462. 10.1016/j.resconrec.2018.03.029
68
SwarrT. E.HunkelerD.KlopfferW.PesonenH.-L.CirothA.BrentA. C.et al. (2011). Environmental Life Cycle Costing: A Code of Practice. Pensacola, FL: Society of Environmental Chemistry and Toxicology (SETAC).
69
TeuberR.JensenJ. D. (2016). Food Losses and Food Waste - Extent, Underlying Drivers and Impact Assessment: IFRO Report. Copenhagen: Institute of Food and Resource Economics (IFRO).
70
ThiagarajahK.GettyV. M. (2013). Impact on plate waste of switching from a tray to a trayless delivery system in a university dining hall and employee response to the switch. J. Acad. Nutr. Diet.113, 141–145. 10.1016/j.jand.2012.07.004
71
ThiemeA.ComberR.MiebachJ.WeedenJ.KraemerN.LawsonS.et al. (2012). “We've bin watching you”-designing for reflection and social persuasion to promote sustainable lifestyles, in Proceedings of the 2012 ACM Annual Conference on Human Factors in Computing Systems - CHI '12, eds KonstanJ. A.ChiE. H.HöökK. (New York, NY: ACM Press), 2337–2346. 10.1145/2207676.2208394
72
WansinkB.van IttersumK. (2013). Portion size me: plate-size induced consumption norms and win-win solutions for reducing food intake and waste. J. Exp. Psychol.19, 320–332. 10.1037/a0035053
73
WhitehairK. J.ShanklinC. W.BrannonL. A. (2013). Written messages improve edible food waste behaviors in a university dining facility. J. Acad. Nutr. Diet.113, 63–69. 10.1016/j.jand.2012.09.015
74
WilliamsonS.BlockL. G.KellerP. A. (2016). Of waste and waists: the effect of plate material on food consumption and waste. J. Assoc. Consum. Res.1, 147–160. 10.1086/684287
75
Winnow (2018a). Case Study: Food is Precious for IKEA Gent Which Plans to Halve Food Waste by August 2020.Winnow.
76
Winnow (2018b). Case Study: See How an IKEA Store in Netherlands Is Saving Over €100,000 Annually by Reducing Food Waste. Winnow.
77
WRAP (2010). Courtauld Commitment 1 (2005-2010). Case studies. WRAP.
78
WRAP (2013a). Courtauld Commitment 2 - Household Food Waste. Technical report, WRAP.
79
WRAP (2013b). Impact of More Effective Use of the Fridge and Freezer. WRAP.
80
WRAP (2013c). The Courtauld Commitment, Phase 2.Final Results. WRAP.
81
WRAP (2013d). The True Cost of Food Waste within Hospitality and Food Service. WRAP.
82
WRAP (2014). The Hospitality and Food Service Agreement. Signatory Pack Sept. 2014. WRAP.
83
WRAP (2015). Strategies to Achieve Economic and Environmental Gains by Reducing Food Waste.WRAP.
84
WRAP (2017). The Hospitality and Food Service Agreement. Taking action on waste. WRAP.
85
WRI (2016). Food Loss and Waste Accounting and Reporting Standard (Version 1.0).WRAP.
86
WunderS.van HerpenE.McFarlandK.RitterA.van GeffenL.StenmarckÅ.et al. (2019). Policies Against Consumer Food Waste. Policy Options for Behaviour Change Including Public Campaigns.Background Report, REFRESH Policy Brief, Reducing consumer food waste, D3.4.
Summary
Keywords
food waste, prevention, measure, evaluation, performance, effectiveness, efficiency, sustainability
Citation
Goossens Y, Wegner A and Schmidt T (2019) Sustainability Assessment of Food Waste Prevention Measures: Review of Existing Evaluation Practices. Front. Sustain. Food Syst. 3:90. doi: 10.3389/fsufs.2019.00090
Received
04 July 2019
Accepted
23 September 2019
Published
10 October 2019
Volume
3 - 2019
Edited by
Christian John Reynolds, University of Sheffield, United Kingdom
Reviewed by
Matteo Vittuari, University of Bologna, Italy; Jorge Sierra-Pérez, University of Zaragoza, Spain; Fabio De Menna, University of Bologna, Italy
Updates
Copyright
© 2019 Goossens, Wegner and Schmidt.
This is an open-access article distributed under the terms of the Creative Commons Attribution License (CC BY). The use, distribution or reproduction in other forums is permitted, provided the original author(s) and the copyright owner(s) are credited and that the original publication in this journal is cited, in accordance with accepted academic practice. No use, distribution or reproduction is permitted which does not comply with these terms.
*Correspondence: Yanne Goossens yanne.goossens@thuenen.de
This article was submitted to Nutrition and Sustainable Diets, a section of the journal Frontiers in Sustainable Food Systems
Disclaimer
All claims expressed in this article are solely those of the authors and do not necessarily represent those of their affiliated organizations, or those of the publisher, the editors and the reviewers. Any product that may be evaluated in this article or claim that may be made by its manufacturer is not guaranteed or endorsed by the publisher.