 Randy Nathaniel Mulia
 Hideyuki Doi
- Doi Laboratory, Graduate School of Simulation Studies, University of Hyogo, Kobe, Japan
The world's population could exceed nine billion by 2050, putting future global food security at risk. To fulfill the increased food demand, food production should be increased. However, with limited land use, current livestock production is not sustainable. To tackle this problem, insect meat can be used as an alternative to conventional livestock. With its high nutritional component and a low land use area, insect has many potentials. However, it is largely unknown how much land can be saved if we replace current conventional livestock with insects, especially under different climate change scenarios. Here, we examine the land use effectiveness of raising insects as food, together with using other conventional meat sources under different climate scenarios outlined in the Special Report on Emissions Scenarios (A1, A2, B1, B2). Then, the current livestock meat ratio is analyzed to examine the readiness of each country to fulfill its needs. We also simulated land use changes with different proportions of insect meat production. Based on the land use simulation in different SRES scenarios, insect meat would be effective in fulfilling animal-based energy demands. We statistically examined the relationship of livestock land ratio with countries' variables (GDP, population, forest area, protected area, government efficiency). Based on an analysis involving the use of various meat composition policies in the four SRES scenarios, insect meat with its high efficiency of land use can be more effective in fulfilling animal-based energy demands than other livestock types. However, to achieve food security in the future, it is a necessity that insect meat be used alongside other alternative solutions that are suitable to each country/area.
Introduction
It is a known projection that by 2050, the world population could exceed nine billion (The Worldwide Governance Indicators (WGI) project, 2013; Van Huis et al., 2013). However, the current food production cannot cater to this expected population, so it will need to be increased to provide for all people. Because land is a limited resource, expanding the farming area may not be a sustainable option as it will compete with the need for land to be used as living space. Furthermore, the use of land for animal farming would contribute to increasing CO2 emission into the atmosphere (Sachs, 2010; Gerber et al., 2013). To ensure sustainable and sufficient food production in the future, what we eat and how we produce food needs to be re-evaluated, along with the introduction of new ways of growing food.
Alternative solutions to conventional livestock and feed sources urgently need to be found. One of the novel ways to grow food is by rearing insects. Insects already form a part of many traditional diets, with more than 1,900 species reportedly being used as food by at least 2 billion people (FAO/WUR, 2012; Jongema, 2012). Edible insects have always been part of human diets; however, in many societies, there is a degree of aversion to their consumption as food (Hinder, 2016). This attitude has resulted in insects being neglected in agricultural research and other sustainability sciences in the past (Holden, 1991). Despite historical references to the use of insects as food, the topic of the consumption of insects as food, i.e., entomophagy, has started to capture public attention worldwide only very recently (FAO/WUR, 2012). Many edible insects have been gathered from forest habitats traditionally; however, innovations in mass-rearing systems for insect larvae have been introduced and are already in use (Dennis and Oonincx, 2012; Sanchez-Muros and Manzano-Agugliaro, 2014). Such steps in innovative food production offer an important opportunity to acquire insect-based food, especially as a protein source.
The environmental benefits of rearing insects for food and feed are attributed to the high feed conversion efficiency of insects. Crickets, for example, require only 1.7 kg of feed for every 1 kg increase of their body weight (Collavo et al., 2005). Insects are reported to emit fewer greenhouse gases and less ammonia than cattle or pigs; rearing them requires significantly less land and water than raising cattle (Dennis and Oonincx, 2012). In addition, insects can be reared on side-streams of organic waste (including human and animal waste), which could potentially increase the profitability of rearing them (Veldkamp et al., 2012). Entomophagy, therefore, contributes positively to the environment, as well as to the sustainability of human society and land use.
Insects have much potential for use as an alternative to conventional livestock. However, the effect of changing livestock compositions on land use is unknown, and it is currently unreasonable to assume that insect meat can fully replace current conventional livestock to meet future demands that arise from population growth and climate change. Thus, in this research, land use efficiency of insect-based food production will be examined together with the use of other conventional meats, such as beef, pork, lamb, poultry, and fish, in accordance with the predicted climate change scenarios. This application of Bodirsky's et al. (2015) calorie demand model with various proportions of conventional livestock, including insects, in different climate scenarios, makes this study different from previous studies that did not use the model (e.g., Dennis and Oonincx, 2012; Clark and Tilman, 2017).
This research will also analyze the relationship between land use for livestock by different countries and the available agricultural land, forest land, protected land, and government initiatives to understand the driving factors for future land use for livestock rearing in different countries.
Methods
Summary of Simulation Methods
We utilized nutritional data for livestock meat for comparison with insects. Based on the nutritive value, the energy provided by each livestock meat can be calculated. We also simulated land use for production of enough livestock meat to sustain the human population as per the predicted energy demand in the four different Special Report on Emissions Scenarios (SRES) from 2020 to 2100. Furthermore, we analyzed the future land use in 2100 in each country; the driving factors behind land use were also analyzed using generalized linear mixed models.
The analysis in this simulation utilize SRES as the basis of the analysis. However, currently the SRES has been superseded by the Shared Socioeconomic Pathways (SSPs, Riahi et al., 2017), the five narratives describing (SSP1–SSP5) general socioeconomic trends that shape the future. The difference between SRES and SSPs is in their climate mitigation policies. SSPs set a baseline scenario without new climate policies outside of those already in place and can be combined to assess a various emission mitigation target. Nevertheless, there are similar narratives between SRES and SSPs and although the result shown in this study is based on SRES, it can be corresponded to its SSPs equivalent. For example, the globalized and high economic growth of SRES A1 scenario is similar to the high fossil-fuel reliant and high growth SSP5. The regionalized economic growth scenario of SRES A2 is close to the globally fragmented SSP3. Next, for the globalized and environmentally focused SRES B1 scenario is most close to the sustainable SSP1 and lastly the regionalized and environmentally focused SRES B2 scenario correspond with the “middle of the road” historical based scenario of SSP2 (Van Vuuren and Carter, 2014; Riahi et al., 2017).
Dataset
The livestock meats that were analyzed were beef, pork, lamb, poultry, fish, as well as insects. Macronutrient (carbohydrate, protein, and fat content) data for each type of livestock meat were obtained from FAO's BioComp4 database (FAO. FAO/INFOODS., 2017) and USDA's National Nutrient Database1. The macronutrient value of each livestock meat was given by these agencies in g/100 g of edible weight. The overall nutrient values of these various types of meat were calculated as averages to be used in further simulation analysis. For insects, cricket and mealworm were used as representative populations; systems for breeding them have already been established (Dennis and Oonincx, 2012; Van Huis et al., 2013).
Another form of data that was utilized was the national data on agricultural land, total land area, GDP, population, forest area, and protected area for different countries; this data was obtained from the World Bank Open Database2. The effectiveness index of the countries considered here was obtained from the World Governance Indicator (The Worldwide Governance Indicators (WGI) project, 2013). It was used to capture the efficacy of public services, the civil service quality, the degree of independence of government from political pressures, the quality of policy formulation and implementation, and the credibility of the government's commitment Indicator (The Worldwide Governance Indicators (WGI) project, 2013).
Nutrient Calculation
Based on the average value obtained from FAO's BioComp4 database (FAO. FAO/INFOODS., 2017) and USDA's National Nutrient Database2, each macronutrient's energy was calculated based on the convention established by the Atwater System (Southgate, 1981). Each gram of macronutrient was converted into equivalent kcal and J as shown in Table 1.
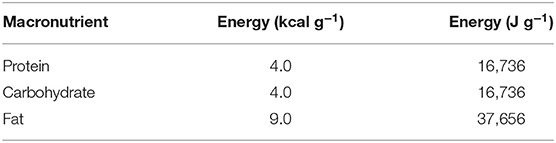
Table 1. Amount of energy from 1 g of each macronutrient.
CO2 Emission Scenarios
Based on IPCC's assessment report, the Special Report on Emissions Scenarios (Nakićenović and Swart, 2000; Table 2), we used the climate change (environmental) and economic development scenarios in this study to predict the overall calorie demand in the future. Because projections of climate change depend heavily on human activity, climate models were run with 40 different scenarios making different assumptions of future greenhouse gas emission, land use, and other climatic variables. Future technological and economic development was considered in each scenario; all scenarios were organized into four different families that were similar to each other. All SRES are considered “neutral,” and thus, do not project future disaster (Nakićenović and Swart, 2000). The differences between each scenario are shown in Table 2.
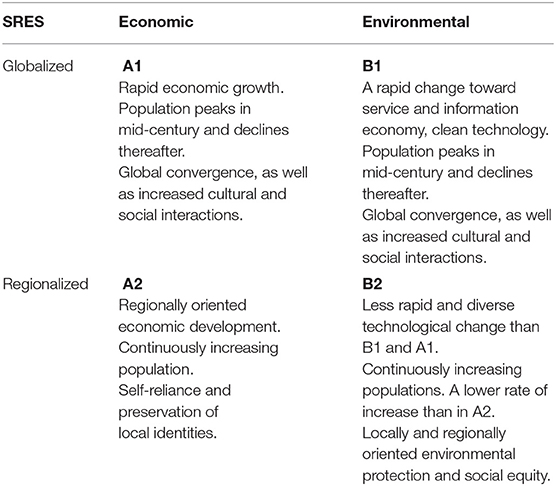
Table 2. General description of the four SRESs.
Livestock Percentage
To fulfill future supply of livestock-based calorie demand in food, the total global livestock calorie demand was divided into various percentage groups among the six livestock types of meat considered here. The percentage of each livestock meat that was used ranged from 0 to 100% with 10% increments. A code was assigned to each policy available regarding a given livestock to identify each of them in the following analysis. For example, policy code 1 consisted of 100% use of beef to fulfill the calorie demand and 0% usage of any other livestock meat. Another example that involved varying degrees of other livestock meat is policy code 975, which consists of 20% beef, 20% pork, 20% lamb, 20% poultry, 10% fish, and 10% insect.
Calorie Demand Model
A model developed by Bodirsky et al. (2015) was used to calculate future world calorie demand and livestock percentage based on the gross domestic product (GDP) and population, which are key indicators of many future economic scenarios. Despite the simple approach, the result based on this model was in accordance with other studies. The input data based on GDP and population projections were based on the four SRES (Table 1; Bodirsky et al., 2015).
The model assumed that the total calorie demand increases with economic growth of the countries. For low-income countries, the proportion of animal-based calories is estimated to rise with income, while for high-income countries, it is expected to decrease with an increase in income due to the high-income groups in the population becoming more health-conscious (Cirera and Masset, 2010). Regardless, in all scenarios, an increase in global food demand until 2050 was found, with an increasing proportion of animal-based products, especially in developing countries.
The model has been provided as a package named “CalorieDemand” in the language R; this study used the calorie food demand data and livestock share for 159 countries, starting from the year 2020 up to 2100 in five-year intervals.
Land Use Calculation
The calculation of land use utilized the nutrition data from FAO's BioComp4 database, along with USDA's National Nutrient Database, as described before. The total energy demand and livestock share data from the calorie demand model was used to calculate the livestock energy demand globally or of a given area or country.
The global and country level total energy from livestock were calculated for each SRES, policy code, and year (ranging from 2020 to 2100 with 5-year increments) using the following equations.
Ecn = Energy from carbohydrates (J/100 g of e.w.)
Epn = Energy from proteins (J/100 g of e.w.)
Efn = Energy from fat (J/100 g of e.w.)
En = Total energy from livestock n (J/100 g of e.w.)
Cn = Carbohydrate content in livestock n (g/100 gof e.w.)
Pn = Protein content in livestock n (g /100 gof e.w.)
Fn = Fat content in livestock n (g/100 g of e.w.)
*e.w. means edible weight.
As shown above, n represents each of the six livestock types (beef, pork, lamb, poultry, fish, and insect). To obtain the energy for each macronutrient (Ecn, Epn, and Efn), the average amount of each macronutrient, carbonhydrate, protein and fat (Cn, Pn, and Fn) was multiplied by the constants given in Table 1; the formula is as shown in equations (1)–(3). Subsequently, the total amount of energy (En) of the n livestock meat was calculated as shown in the calculation (4).
LS = Livestock share
EDT = Total energy demand (J)
EDL = Livestock energy demand (J)
EDn = Energy provided by livestock n(J)
Pcn = Percentage of livestock n used in policy c
Mn = livestock n required to meet energy demand (100 g of e.w)
The livestock energy demand (EDL) is obtained by multiple livestock shares (LS) with the total energy demand (EDT) as shown in equation (5). Subsequently, the energy provided by each of the n livestock (EDn) was calculated by multiplying the percentage used for livestock n in policy c (Pcn) (as described in section Dataset) with livestock energy demand (EDL). This was done by using equation (6). With that, the amount of livestock n required to meet its respective energy demand (Mn) was calculated by dividing EDn with En, which is shown in equation (7).
The land use required to meet the demands of livestock n (Mn) was surmised based on the studies by Dennis and Oonincx (2012) and Clark and Tilman (2017). The land use required to produce 1 kg of a given livestock type is presented in Table 3.
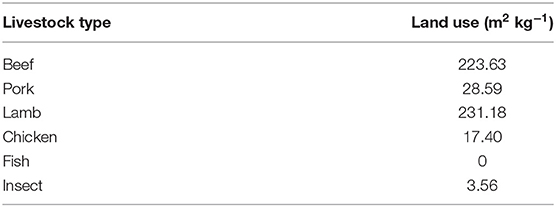
Table 3. Land use required to produce 1 kg of each livestock.
It should be noted that fish does not increase land use, because it is not reared like the other livestock types. However, there is still an environmental impact depending on the type of production or fishing method used (Clark and Tilman, 2017).
LUn = Land use of livestock n (m2 kg−1)
TLUn = Total land use of livestock n (m2)
TL = Total livestock land use (m2)
With the amount of Mn known, after conversion to kg, the total land use for livestock n (TLUn) was calculated by equation (8). Subsequently, the total land use (TL) was calculated by equation (9).
According to Eitelberg et al. the current global cropland area is 1,550 Mha (Eitelberg et al., 2015). Although according to Eitelberg et al. (2015), the future world cropland expansion may range from 1,552 Mha to 5,131 Mha; the current value was chosen as the limiting factor. The global land use limit was assumed to have this value throughout the analysis.
Statistical Analysis
All statistical and graphical analyses were performed using the R software, version 3.2.3 (R Core Team, 2018). In all statistical analyses, the significance value was set to 0.05.
A generalized linear mixed model (GLMM) was adopted to evaluate the relationship between each country's livestock land ratio and its population, the proportion of forest area and of protected area, and government efficiency. Government efficiency could affect total land use albeit differently depending on the priority of each country. For example, a country with high government efficiency which has increasing the livestock land use as a priority will have a positive correlation and vice versa. Government efficiency is used to examine whether the ability of a government to carry out its policy might affect the country's land use. A random effect was introduced in the GLMM by dividing the world into five regions where the countries considered in this study were present, namely Africa, America, Asia, Europe, and Oceania. Prior to the calculation of the GLMM, each dataset was mathematically treated with the equations given below.
Results
Nutrient Content Analysis
For carbohydrate content per 100 g of edible weight (e.w.), fish has the largest average values with variance ranging approximately from 2.5 g to 7.5 g (SEM, Figure S1). For poultry, although the average values are quite low, there are only some high-quality species that have high carbohydrate content as compared to the average value for this livestock meat type. For insects, the average carbohydrate content is second to fish. Overall, for livestock meats, the carbohydrate content is expected to be low. It can be seen that all types of livestock have a comparatively high amount of protein with the average being above 20 g per 100 g of e.w. (Figure S2). With this result, insect meat may be considered comparable to other conventional meats in terms of protein value. For fat content, the lowest values were observed for fish with the other livestock types being quite close to each other in terms of average values (Figure S3). It should be noted that there are several types of beef and pork that have a considerable large amount of fat as compared to the average values for these meat types. Aside from that, insect meat has a similar amount of fat to poultry.
Land Use Analysis
In the land use simulation, differences in global land use for livestock production were found among all four SRES (Figure 1, Table 4). The highest land use was observed for scenarios A1 and A2, which are the economically focused scenarios. For scenarios B1 and B2, which are the environmentally focused scenarios, on the other hand, the results showed less dependency on land use (Figure 1, Table 4). Similarly, there were differences between the globalized and regionalized scenarios as well. The land use requirement in scenario A1 was less than in A2, while B1 had a lower land use requirement than B2. It can be concluded that a globalized and environmentally focused scenario will have less requirement for land to rear livestock. Also, increasing insect production may decrease land use in all the scenarios with time.
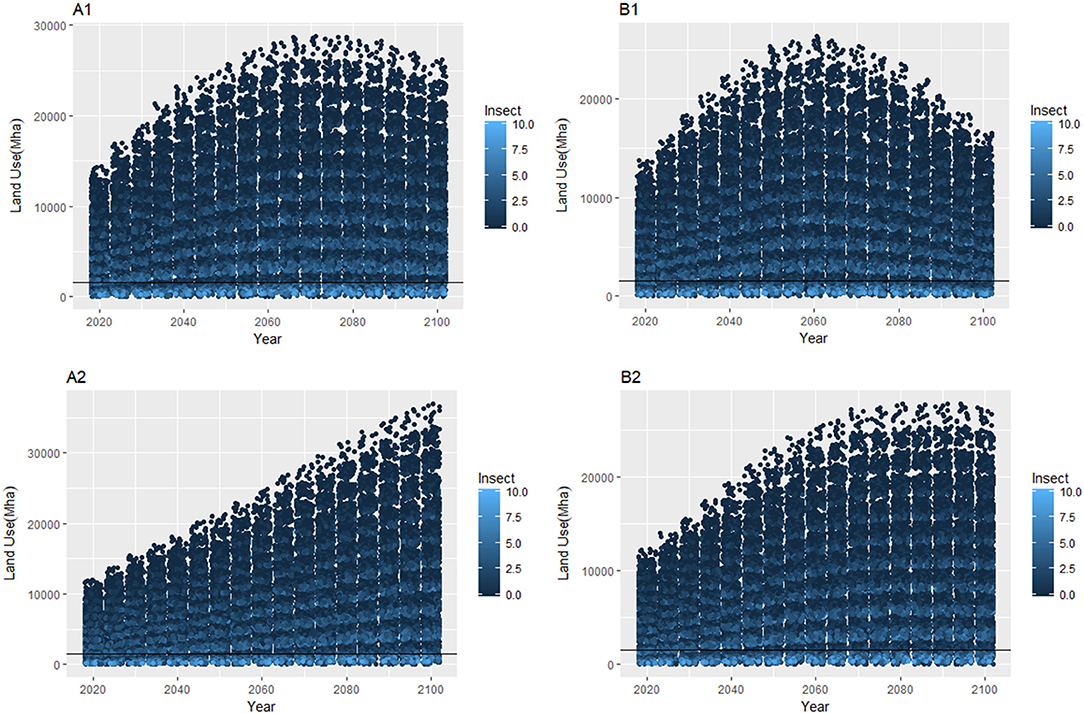
Figure 1. Total land use for livestock needed to fulfill the calorie demands in SRES A1–B2. Each dot represents a single policy code of livestock composition. The color of the dot represents the rate of insects to be used by that respective policy to meet the calorie demand (right-hand scale). The black horizontal line represents the current cropland, which is 1,550 Mha.
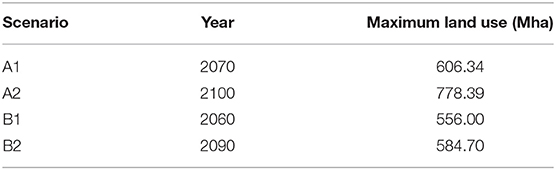
Table 4. Maximum land use and the corresponding year in each scenario.
For further analysis we use the policy closest to the latest livestock meat ratio available on FAOSTAT3, which is policy code 904 (beef 20%, pork 30%, chicken 20%, and fish 30%). The total land use of policy code 904 is shown in Figure 2. Afterward, for each scenario the year of maximum land use was determined. Based on the results, scenario A2 had the highest maximum land use in the year 2100 and many countries will not be able to supply their needs with available cropland at the current level. The lowest land use was observed in scenario B1; however, some countries might still have problems when available cropland remains at the current level.
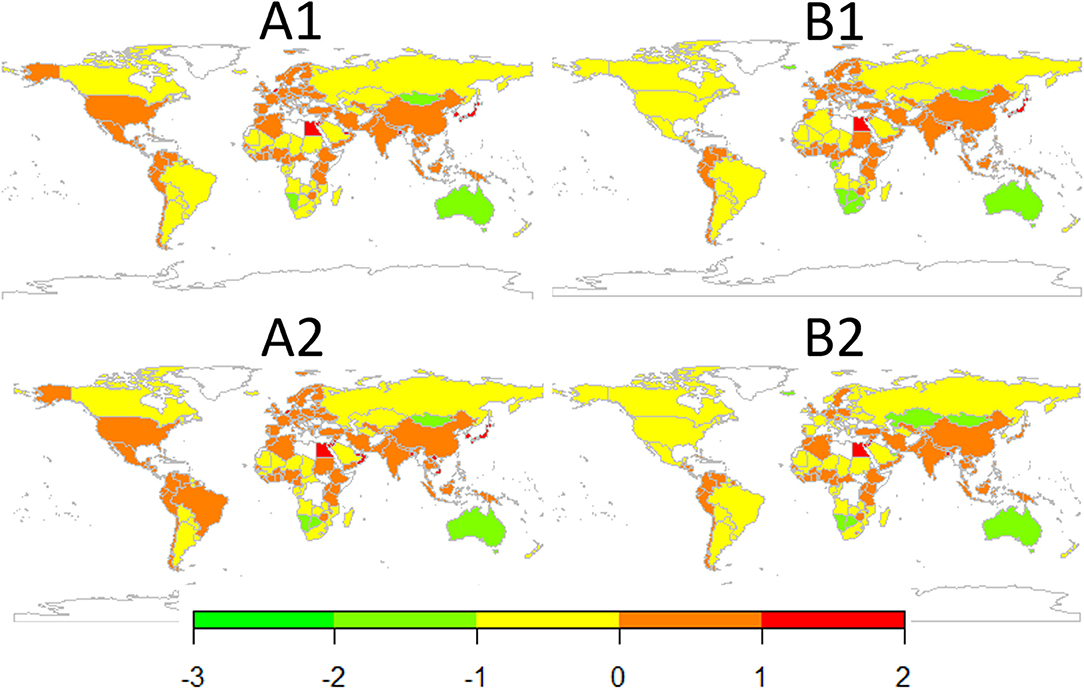
Figure 2. The ratio of each country's land needed to meet animal-based energy demands in the scenarios A1–B2 in the year 2070, 2060, 2060, 2090, respectively, to its current agricultural land use, using policy code 904. A log10 scale is employed.
Figure 3 illustrate the land use if we change the current percentage of beef to insect. As the current livestock ratio has beef at 20%, only the corresponding policy code is shown with 100% insect meat usage also shown for reference.
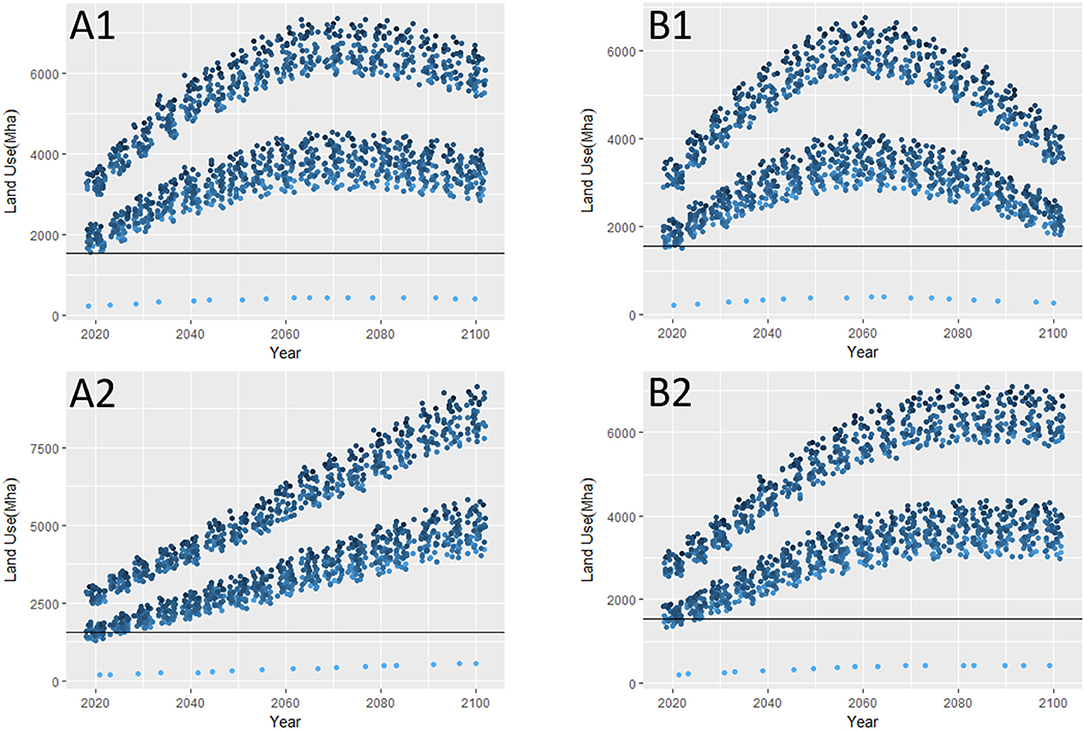
Figure 3. Total land use for livestock needed to fulfill the calorie demands in SRES A1–B2 with only the corresponding policy code shown (top to bottom: current ratio, change of beef into insect, and 100% insect). The dots, the color of the dots, and the black horizontal line have the same meaning as in Figure 1.
GLMM Results
Results of the GLMM analysis to correlate livestock animal land use with the different driving factors, show that the correlation between population and protected land area is positive (Table 5, Figures 5, 7). A negative correlation was observed for GDP, forest ratio, and government efficiency Figures 4, 6, 8). However, only countries' protected land area parameters were statistically insignificant as indicated by the p-values, which were above 0.05.
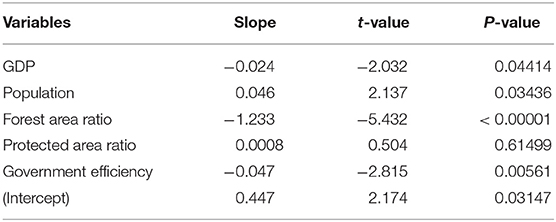
Table 5. Statistical results for the GLMM.
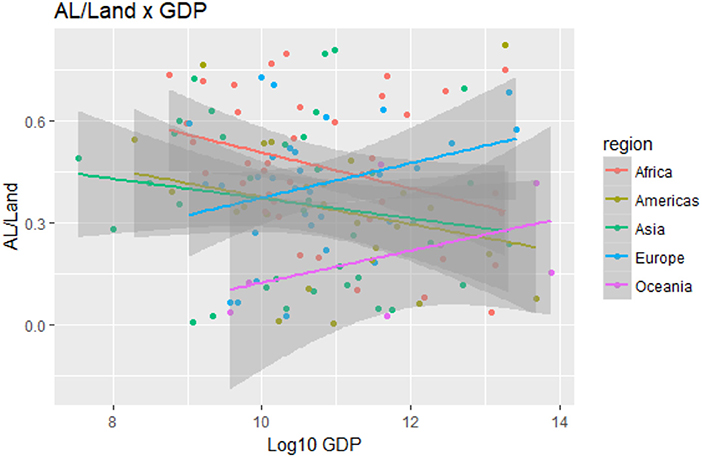
Figure 4. Relationship of agricultural land ratio (a country's agricultural land/a country's total land area) and GDP in various countries.
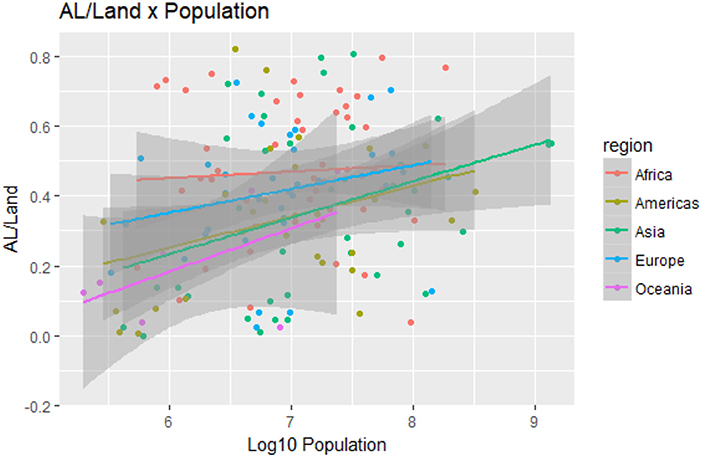
Figure 5. Relationship of agricultural land ratio (a country's agricultural land/a country's total land area) and population in various countries.
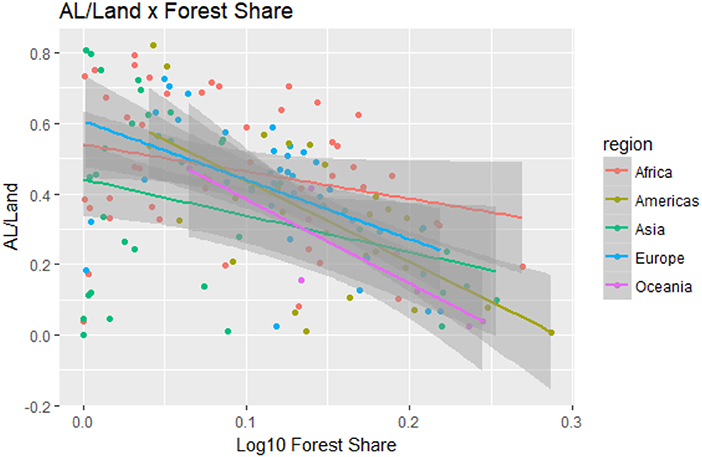
Figure 6. Relationship of agricultural land ratio (a country's agricultural land area/a country's total land area) and forest ratio (a country's forest area/a country's total land area) in various countries.
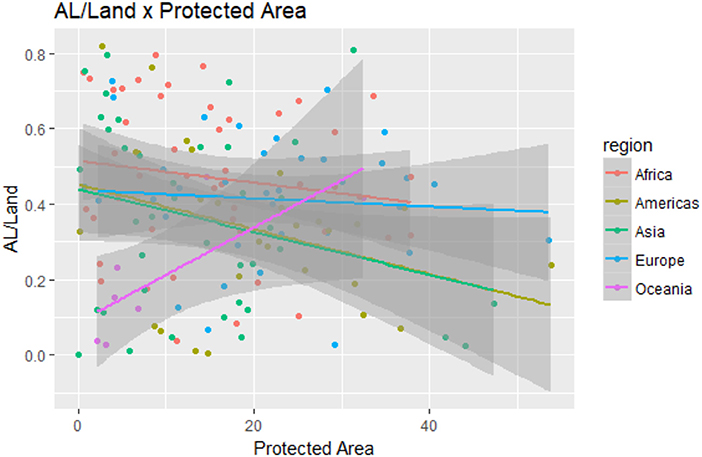
Figure 7. Relationship of agricultural land ratio (a country's agricultural land/a country's total land area) and protected area ratio in various countries.
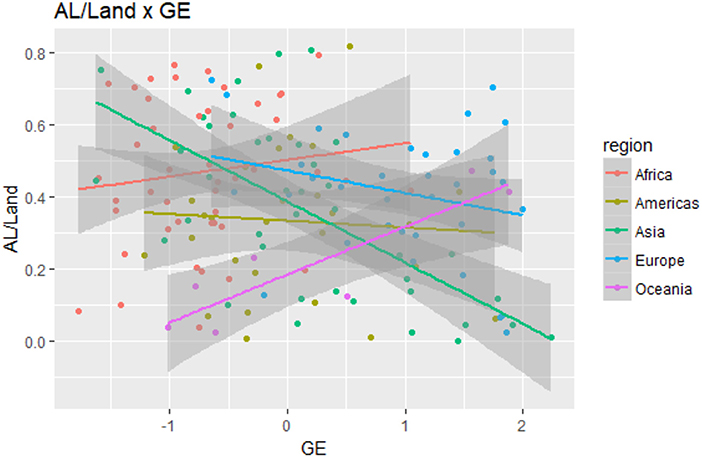
Figure 8. Relationship of agricultural land ratio (a country's agricultural land/a country's total land area) and government efficiency in various countries.
Discussion
Nutrient Contents of Livestock
Insect meat was found to be comparable to the other conventional livestock meat types, such as beef, lamb, poultry, and fish. In this study, insect meat species were limited to cricket and mealworm because they are commonly used as feed and already have established rearing systems (Dennis and Oonincx, 2012; Sanchez-Muros and Manzano-Agugliaro, 2014). Other insect types are also harvested locally by certain cultures (Van Huis et al., 2013). Although still limited as compared to data on other livestock types, there extensive studies have been made of the various species of insects harvested in different regions as traditional food (Nowak et al., 2015; FAO. FAO/INFOODS., 2017). Not only is insect meat rich in proteins, as shown in this study, but it is also rich in micronutrients, such as essential amino acids (Belluco et al., 2013).
However, one advantage of insect meat as compared to other terrestrial livestock is their feed efficiency. For example, to produce 1 kg of crickets, only 1.7 kg of feed is required (Collavo et al., 2005), much less than other livestock, such as chicken (2.5 kg), pork (5 kg), and beef (10 kg) (Smil, 2002). Their need of feed being much smaller is a major reason why the land use for insect rearing is relatively lower than for other livestock.
Land Use Simulation
Most of the policies that have insect meat as one their components fulfill the criteria of total land use remaining under 1,550 Mha in all four scenarios. This proves the effectiveness of insect meat in reducing land use, while also meeting the energy demands. Differences between the SRES could also be observed, and they corresponded to the characteristics of each scenario. For scenario A1, land use increased until after the middle of the century, where it reached its peak, and then declined at the end of the century. This can be attributed to the increased human population and economic growth as projected in scenario A1. With an increasing human population, the energy demand will also increase, and thus, it is to be expected that land use will also increase. Furthermore, with economic growth, the GDP that was used as input in the food demand model will increase, and thus, its contribution to the increasing land use will enhance as well. The decline at the end of the century can be attributed to the increasing GDP. As described by Cirera and Masset (2010) and Bodirsky et al. (2015), higher income contributes to increased animal-based livestock demand at first, but the demand will eventually diminish with better education and increased health consciousness leading to a more vegetable-based diet.
In scenario A2, although it is also economically focused like A1, the focus on regions, and therefore land use in scenario A2 continuously increases until the end of the century. Because of the regionalized nature of A2, it could be assumed that each country in this scenario maintains their own economic growth, which makes the outcome different from A1, as this leads to a more homogenized economic growth. The increase in economic growth will lead to an increase in livestock demand, but not as fast as in scenario A1. The land use demand grows continuously till the year 2100 because the increased economic growth is not fast enough to reach a level where an affluent health-conscious society is formed.
Scenarios, B1 and B2 are the environmentally focused scenarios; the results match this nature as the land use demands in these scenarios are much lower than those in scenarios A1 and A2. The difference between B1 and B2 is in how fast the maximum land use is achieved; i.e., in scenario B1, the maximum is reached by 2060, while in B2, it is achieved later, in 2090. These patterns are similar to the differences between scenarios A1 and A2, because the economic growth in scenario B1 is faster than in B2, due to the former being more globalized than the latter. However, both scenarios B1 and B2 show a decline in global land use, unlike in scenario A2. This could be attributed to their environmentally focused approach. In addition, it can also be caused by the lower human population sizes projected in both B1 and B2.
In the results for each country's land use ratio to available agricultural land, only scenario B2 was highlighted as the one being sustainable among all four scenarios. This result indicates that although most of the scenarios show that a majority of countries manages to fulfill the animal-based calorie demand within the range of their available land, some countries will still be unable to meet the calorie demand as indicated by the ratio exceeding a value of 1. Only in scenario B2 were all countries included here able to meet their calorie demands. This could be caused by the differences in available agricultural land in each country. As it is assumed that each country will only produce for itself, the analysis did not take into account those countries that have little agricultural land available to support their populations. However, in all the scenarios except B2, it could be seen that countries with large populations, such as India and China, tend to have a higher ratio of land use to available land despite their land sizes. Although they have more agricultural lands, they also have high populations, which leads to increased demand. The success of B2 can be attributed to it being environmentally focused and its projection of low population numbers globally. So, the current agricultural land can suffice to meet the future demands under scenario B2. In this study, we did not consider the trade of livestock between different countries, although such trade between the counties will greatly modify the land use for each country. This is a first step to evaluate country-level land use with food composition changes including insect meat. However, future studies need to investigate and model the land use effect while considering the trade of livestock production.
Next, based on the results of the last analysis, of livestock meat's ratio, scenario A2 has the highest maximum land use in the year 2100 and many countries cannot supply their needs with available cropland at the current level. The lowest land use is observed in scenario B1, but some countries might still have problems with the available cropland at the current level. Maintaining the current livestock ratio could pose a food shortage in some countries, especially countries with low agricultural production in their land. To tackle this problem, insect meat could be used as a substitute for meat.
Figure 3 illustrate the effectivity of insect meat usage in lowering the total land use. The upper band of data points shown are represent the policy in which only 10% of beef is replaced with insect, resulting in a higher land use; the lower band shows results of the policy code that replaces 20% of the beef. The total land use decreases as the insect meat ratio increases although most results are still above the estimated world cropland area because of the high amount of land use for beef production. However, aside from scenario A1, a small number of policy codes can be seen to lie just below the estimated world cropland area line.
The linear model used here demonstrates the relationship between a country's livestock land use ratio and various factors such as GDP, population, forest area ratio, protected area ratio, and government efficiency. Only the correlation with protected area ratio is statistically not significant. Among the remaining variables, GDP varies amongst regions, with a positive correlation in Europe and Oceania while correlation is negative in Africa, the Americas, and Asia. This might be due to the land area in Europe and Oceania being smaller than in the other regions. Regarding population, it correlates positively with livestock land use ratio. This is understandable as more people also increase the demand for food and thus lead to an increased ratio of land used for producing it. Next, the forest share ratio is found to show a negative correlation in all regions. This is due to most conventional livestock needing a clear open space. Lastly, the relation with government efficiency is different in each region, with only Africa and Oceania showing a positive correlation. This simply shows the priorities of each country regarding the ratio of land allocated to livestock. For countries with a positive correlation, it might be surmised that the more efficient governments prioritize increased food production by allocating more land area for livestock and vice versa.
In this study, our model and discussion focused on land use and emphasized the changes in land use needed, but did not fully consider changes in greenhouse gas emissions, although these are also important on our society. Further studies therefore need to develop the model to consider changes in greenhouse gas emission. We should note that changes in the food trade between countries also significantly impacted the model results and predictions. Therefore, further studies need to incorporate assumptions of food trade changes in our and related models to predict future food production.
Conclusion
Based on our analysis involving the use of various meat composition policies in the four SRESs, insect meat with its high efficiency of land use can be more effective in fulfilling animal-based energy demands than other livestock types. Our model and findings can be used as reference data revealing the implications when deciding on future food policies in each country as well as globally. For example, a country can try to decide whether it is possible to obtain a sufficient supply of their food from the available livestock land and if it should increase insect production to relax demands for livestock land in the country. However, it might be a challenge to meet the future livestock energy demands, and a locally focused effort is needed because the relationship of livestock land ratio and a country's variables are complex, with each country having its own priorities and conditions. To achieve food security in the future, it is a necessity that insect meat be used alongside other alternative solutions and that global diet preferences be changed accordingly.
Data Availability Statement
All data used in this study can be downloaded from the data sources, including the websites for the FAO, FAOSTAT, BioComp4, and the World Bank.
Author Contributions
RM and HD conceived the idea and hypothesis, designed the experiments, analyzed the data and performed the simulation, and wrote the manuscript.
Conflict of Interest
The authors declare that the research was conducted in the absence of any commercial or financial relationships that could be construed as a potential conflict of interest.
Acknowledgments
We thank the agency for providing the dataset in FAO and Worldbank.
Supplementary Material
The Supplementary Material for this article can be found online at: https://www.frontiersin.org/articles/10.3389/fsufs.2019.00091/full#supplementary-material
Footnotes
1. ^USDA National Nutrient Database for Standard Reference 28 Software v.3.8.6.4 2017-10-02. Available online at: https://ndb.nal.usda.gov/ndb/.
2. ^World Bank Open Database. Available online at: https://data.worldbank.org/.
3. ^FAOSTAT. Available online at: http://www.fao.org/faostat/en/#home.
References
Belluco, S., Losasso, C., Maggioletti, M., Alonzi, C. C., Paoletti, M. G., and Ricci, A. (2013). Edible insects in a food safety and nutritional perspective: A Critical Review. Comp. Rev. Food Sci. Food Safety. 12, 296–313. doi: 10.1111/1541-4337.12014
Bodirsky, B. L., Rolinski, S., Biewald, A., Weindl, I., Popp, A., and Lotze-Campen, H. (2015). Global food demand scenarios for the 21st Century. PLoS ONE 10:e0139201. doi: 10.1371/journal.pone.0139201
Cirera, X., and Masset, E. (2010). Income distribution trends and future food demand. 365:2821–2834. doi: 10.1098/rstb.2010.0164
Clark, M., and Tilman, D. (2017). Comparative analysis of environmental impacts of agricultural production systems, agricultural input efficiency, and food choice. Environ. Res. Lett. 12:111002. doi: 10.1088/1748-9326/aa6cd5
Collavo, A., Glew, R. H., Huang, Y. S., Chuang, L. T., Bosse, R., and Paoletti, M. G. (2005). “House cricket small-scale farming,” in Ecological Implications of Minilivestock: Potential of Insects, Rodents, Frogs, and Snails, ed M. G. Paoletti (New Hampshire: Science Publishers, 519–544.
Dennis, G. A. B., and Oonincx, I. J. M. B. (2012). Environmental impact of the production of mealworms as a protein source for humans – a life cycle assessment. department of plant sciences, wageningen university, wageningen, the netherlands, 2 animal department of animal sciences, Wageningen University, Wageningen, The Netherlands. PLoS ONE 7:e51145. doi: 10.1371/journal.pone.0051145
Eitelberg, D. A., Vliet, J. V., and Verburg, P. H. (2015). A review of global potentially available cropland estimates and their consequences for model-based assessments. GCB 21, 1236–1248 doi: 10.1111/gcb.12733
FAO/WUR (2012). “Expert consultation meeting: assessing the potential of insects as food and feed in assuring food security,” in Summary Report, 23–25 January 2012, eds P. Vantomme, E. Mertens, A. van Huis and H. Klunder (Rome:FAO), Available online at: http://www.fao.org/docrep/015/an233e/an233e00.pdf
FAO. FAO/INFOODS. (2017). Food Composition Database for Biodiversity Version 4.0 – BioFoodComp4.0 (FAO/INFOODS: Rome). Available online at: http://www.fao.org/3/a-i7364e.pdf (accessed January 19, 2018).
Gerber, P. J., Steinfeld, H., Henderson, B., Mottet, A., Opio, C., Dijkman, J., et al. (2013). Tackling Climate Change Through Livestock – A Global Assessment of Emissions and Mitigation Opportunities. Rom: Food and Agriculture Organization of the United Nations (FAO).
Hinder, J. (2016). Overcoming the “Yuck Factor:” The Potential of Entomophagy to Provide a More Environmentally Sustainable Protein Source. Chestertown, MD: Washington College Department of Environmental Science and Studies Department of Anthropology. doi: 10.13140/RG.2.1.4020.3125
Holden, S. (1991). Edible caterpillars: a potential agroforestry resource? They are appreciated by local people, neglected by scientists. Food Insects Newsletter 4, 3–4.
Jongema, Y. (2012). List of Edible Insect Species of the World. Wageningen, Laboratory of Entomology, Wageningen University. Available online at: http://www.ent.wur.nl/UK/Edible+insects/~Worldwide+species+list/ (accessed January 19, 2018).
Nakićenović, N., and Swart, R. (eds.). (2000). Special Report on Emissions Scenarios: A Special report of Working Group III of the Intergovernmental Panel on Climate Change. Cambridge, UK: Cambridge University Press.
Nowak, V., Persijn, D., Rittenschober, D., and Charrondiere, R. (2015). Review of food composition data for edible insects. Food Chem. 193, 39–46. doi: 10.1016/j.foodchem.2014.10.114
R Core Team (2018). R: A Language and Environment for Statistical Computing. Vienna: R Foundation for Statistical Computing. Available online at : https://www.R-project.org/
Riahi, K., Van Vuuren, D. P., Kriegler, E., Edmonds, J., O'neill, B. C., and Fujimori, S. (2017). The shared socioeconomic pathways and their energy, land use, and greenhouse gas emissions implications: an overview. Global Env. Change 42, 153–168. doi: 10.1016/j.gloenvcha.2016.10.009
Sachs, J. (2010). Rethinking macroeconomics: knitting together global society. Broker 10, 1–3. doi: 10.2202/1932-0213.1065
Sanchez-Muros, M. J., and Manzano-Agugliaro, F. (2014). Insect meal as a renewable source of food for animal feeding: a review. J. Cleaner Prod. 65, 16–27. doi: 10.1016/j.jclepro.2013.11.068
Smil, V. (2002). Worldwide transformation of diets, burdens of meat production and opportunities for novel food proteins. Enzyme Microb. Technol. 30, 305–311. doi: 10.1016/S0141-0229(01)00504-X
Southgate, D. A. T. (1981). Food Research Institute, Norwich, UK (October 1981). “The Relationship Between Food composition and Available Energy”. Provisional Agenda Item 4.1.3, Joint FAO/WHO/UNU Expert Consultation on Energy and Protein Requirements, Rome, 5 to 17 October 1981. Food and Agriculture Organization of the United Nations, World Health Organization, The United Nations University. ESN: FAO/WHO/UNU EPR/81/41
The Worldwide Governance Indicators (WGI) project (2013). United Nations, Department of Economic and Social Affairs, Population Division. World Population Prospects – The 2012 Revision - Key Findings and Advance Tables (Working Paper No. ESA/P/WP.227). New York, NY. Available online at: https://info.worldbank.org/governance/wgi/
Van Huis, A., Van Itterbeeck, J., Klunder, H., Mertens, E., Halloran, A., Muir, G., et al. (2013). Edible Insects: Future Prospects For Food and Feed Security. Rome: FAO
Van Vuuren, D. P., and Carter, T. R. (2014). Climate and socio-economic scenarios for climate change research and assessment: reconciling the new with the old. Clim. Change 122, 415–429. doi: 10.1007/s10584-013-0974-2
Keywords: food security, livestock, climate change scenarios, energy demand land area, global analysis
Citation: Mulia RN and Doi H (2019) Global Simulation of Insect Meat Production Under Climate Change. Front. Sustain. Food Syst. 3:91. doi: 10.3389/fsufs.2019.00091
Received: 24 January 2019; Accepted: 30 September 2019;
Published: 16 October 2019.
Edited by:
Ademola Braimoh, World Bank Group, United StatesReviewed by:
Alisher Mirzabaev, Center for Development Research (ZEF), GermanyWil De Jong, Kyoto University, Japan
Copyright © 2019 Mulia and Doi. This is an open-access article distributed under the terms of the Creative Commons Attribution License (CC BY). The use, distribution or reproduction in other forums is permitted, provided the original author(s) and the copyright owner(s) are credited and that the original publication in this journal is cited, in accordance with accepted academic practice. No use, distribution or reproduction is permitted which does not comply with these terms.
*Correspondence: Hideyuki Doi, aGlkZXl1a2kuZG9pQGljbG91ZC5jb20=