Abstract
A diverse diet is important to address micronutrient deficiencies and other forms of malnutrition, one of the greatest challenges of today's food systems. In tropical countries, several studies have found a positive association between forest cover and dietary diversity, although the actual mechanisms of this has yet to be identified and quantified. Three complementary pathways may link forests to diets: a direct pathway (e.g., consumption of forest food), an income pathway (income from forest products used to purchase food from markets), and an agroecological pathway (forests and trees sustaining farm production). We used piece-wise structural equation modeling to test and quantify the relative contribution of these three pathways for households in seven tropical landscapes in Bangladesh, Burkina Faso, Cameroon, Ethiopia, Indonesia, Nicaragua, and Zambia. We used survey data from 1,783 households and determined forest cover within a 2-km radius of each household. The quality of household diets was assessed through four indicators: household dietary diversity and consumption of fruits, vegetables, and meat, based on a 24-h recall. We found evidence of a direct pathway in four landscapes (Bangladesh, Cameroon, Ethiopia, and Zambia), an income pathway in none of the landscapes considered, and an agroecological pathway in three landscapes (Bangladesh, Ethiopia, and Indonesia). We also found evidence of improved crop and livestock production with greater forest cover in five landscapes (Bangladesh, Burkina Faso, Cameroon, Ethiopia, and Indonesia). Conversely, we found negative associations between forest cover and crop and livestock production in three landscapes (Cameroon, Indonesia, and Zambia). In addition, we found evidence of forest cover being negatively related to at least one indicator of diet quality in three landscapes (Indonesia, Nicaragua, and Zambia) and to integration to the cash economy in three landscapes (Cameroon, Ethiopia, and Nicaragua). This is one of the first studies to quantify the different mechanisms linking forest cover and diet. Our work illuminates the fact that these mechanisms can vary significantly from one site to another, calling for site-specific interventions. Our results also suggest that the positive contributions of forests to rural livelihoods cannot be generalized and should not be idealized.
Introduction
An estimated two billion people are currently affected by “hidden hunger,” i.e., micronutrient deficiencies (Muthayya et al., 2013; IFPRI, 2014; HLPE, 2017). Poor quality diet is now one of the leading risk factors for mortality globally (Afshin et al., 2019; Willett et al., 2019) and nutrition-related chronic diseases are increasingly a problem in developing counties (IFPRI, 2014). Poor diet quality contributes to both micronutrient deficiency and chronic nutrition-related diseases. Dietary diversity is increasingly accepted as a good measure of diet quality (Foote et al., 2004; Steyn et al., 2006; Kennedy et al., 2010). Dietary diversity may increase with improved market access (Sibhatu et al., 2015). However, protein-rich and micronutrient-rich food can be several times more expensive than staple food, particularly in low-income countries (Headey and Masters, 2019). In such countries, with largely rural population, dietary diversity may thus be improved through diversity in farm production (Jones et al., 2014; Powell et al., 2015; Jones, 2017).
Several studies have also found more diverse and nutritious diets consumed by people living in or near areas with greater tree cover (Dounias and Froment, 2006; Powell et al., 2011; Johnson et al., 2013; Ickowitz et al., 2014; Baudron et al., 2017; Galway et al., 2018; Rasolofoson et al., 2018). Three main complementary pathways may link forest cover to dietary diversity: (1) a “direct pathway,” (2) an “income pathway,” and (3) an “agroecological pathway” (Figure 1). (1) Forests may contribute directly to people's diets through the harvest of bushmeat, wild fruits, wild vegetables, and other forest-sourced foods (Hladik et al., 1990; Fa et al., 2003; Vinceti et al., 2008; Nasi et al., 2011; Termote et al., 2011; Powell et al., 2015; Rowland et al., 2017). (2) The sale of non-timber forest products, and timber to a lesser extent, may contribute to people's income (Williams, 1998; Beck and Nesmith, 2001; Kaschula et al., 2005; Pfund et al., 2011; Angelsen et al., 2014), potentially leading to the purchase of a diversity of food items from markets. (3) Finally, forests and trees may support diverse crop and livestock production through an array of ecosystem services (Reed et al., 2017) such as maintenance of soil fertility and water regulation (Young, 1989; Sanchez et al., 1997; Ong et al., 2000), pollination (Garibaldi et al., 2011), pest control (Dix et al., 1995), and regulation of micro- and regional climate (Zheng and Eltahir, 1998; Fu, 2003; Shiferaw Sida et al., 2018). Forests may also be grazed and sustain livestock production (Baudron et al., 2017). An additional aspect of this agroecological pathway may come from the availability of fuelwood from forests allowing the production of nutritious crops, which, on average, require a long cooking time, e.g., pulses (Wan et al., 2011; Remans et al., 2012). The availability of fuelwood from forests may also result in the use of more crop residues and livestock dung as soil amendment rather than as fuel, with positive impact in soil fertility and crop diversity (Baudron et al., 2017).
Figure 1
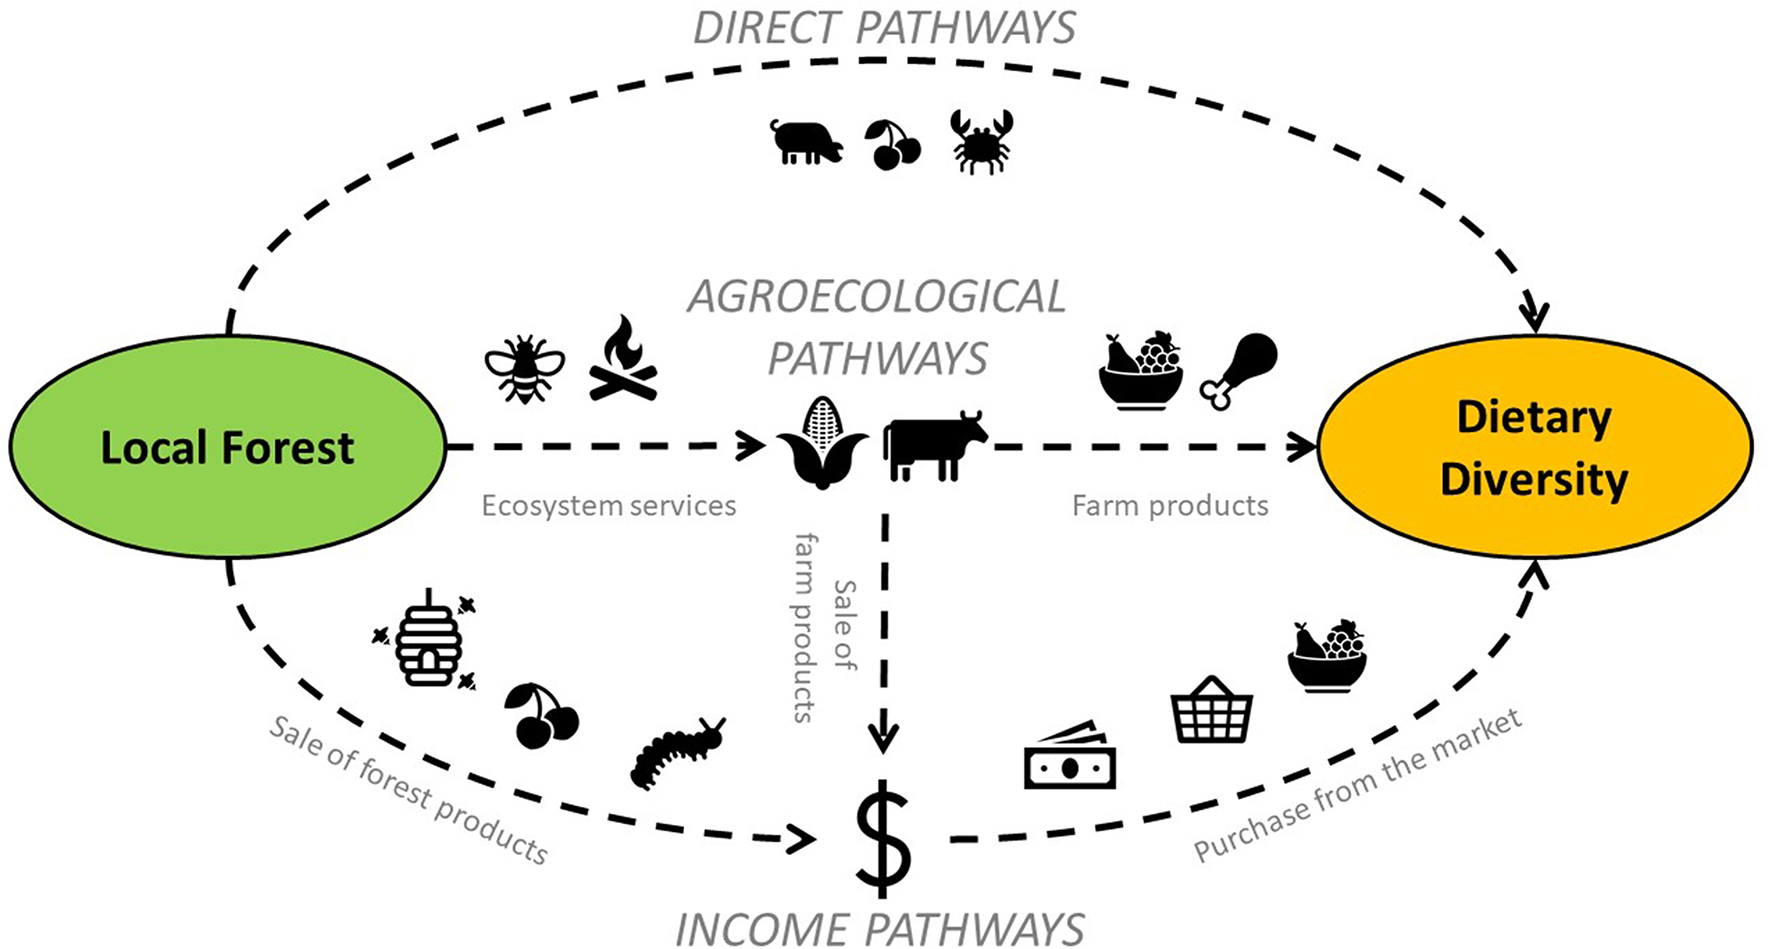
Conceptual diagram representing the three main pathways linking forest cover to dietary diversity.
While there is a growing body of evidence in support of each of the above pathways, their relative importance to each other remains poorly understood. This is the first study to our knowledge to attempt to quantify the relative contribution of different pathways. The objective of this study was to test and quantify the various pathways linking forest cover to dietary diversity—direct, income, and agroecological—using piece-wise structural equation modeling spanning seven contrasting tropical landscapes with a novel combination of household and forest cover information. Due to the importance of these food groups for adequate nutrition and because they are most commonly missing in households with low dietary diversity, the linkages between forest cover and the consumption of (1) fruit, (2) vegetable, and (3) meat (and other animal products, excluding dairy products) were also tested.
Materials and Methods
Household Survey Data From Seven Study Sites
We use previously published and publicly available household survey data from the Agrarian Change Project implemented by the Center for International Forest Research (CIFOR)1. This dataset was collected through a standardized questionnaire that addressed household composition, dietary diversity, crop and livestock management, and income. Seven tropical landscapes spanning three continents were selected for the study: (1) the Bosawas Biosphere Reserve in Nicaragua, (2) Cassou District in Burkina Faso, (3) Nguti District in Cameroon, (4) Arsi Negele in Ethiopia, (5) Nyimba District in Zambia, (6) Chittagong Hill Tracts Region in Bangladesh, and (7) Kapuas Hulu Region in Indonesia (Figure 2). While we will refer to these locations by their respective country names in the rest of the paper, it should be noted they are not representative of national-level conditions. Although each landscape is very different in some respects (e.g., differing forest types, levels of biodiversity, agricultural practices, market influence, and forest dependency; Table 1), the main characteristic comparable across all seven landscapes is that they exemplify clear gradients of agricultural expansion and intensification across the forest transition (Deakin et al., 2016; Sunderland et al., 2017). In this regard, they are representative of similar sites throughout the tropics exhibiting rapid rural change.
Figure 2
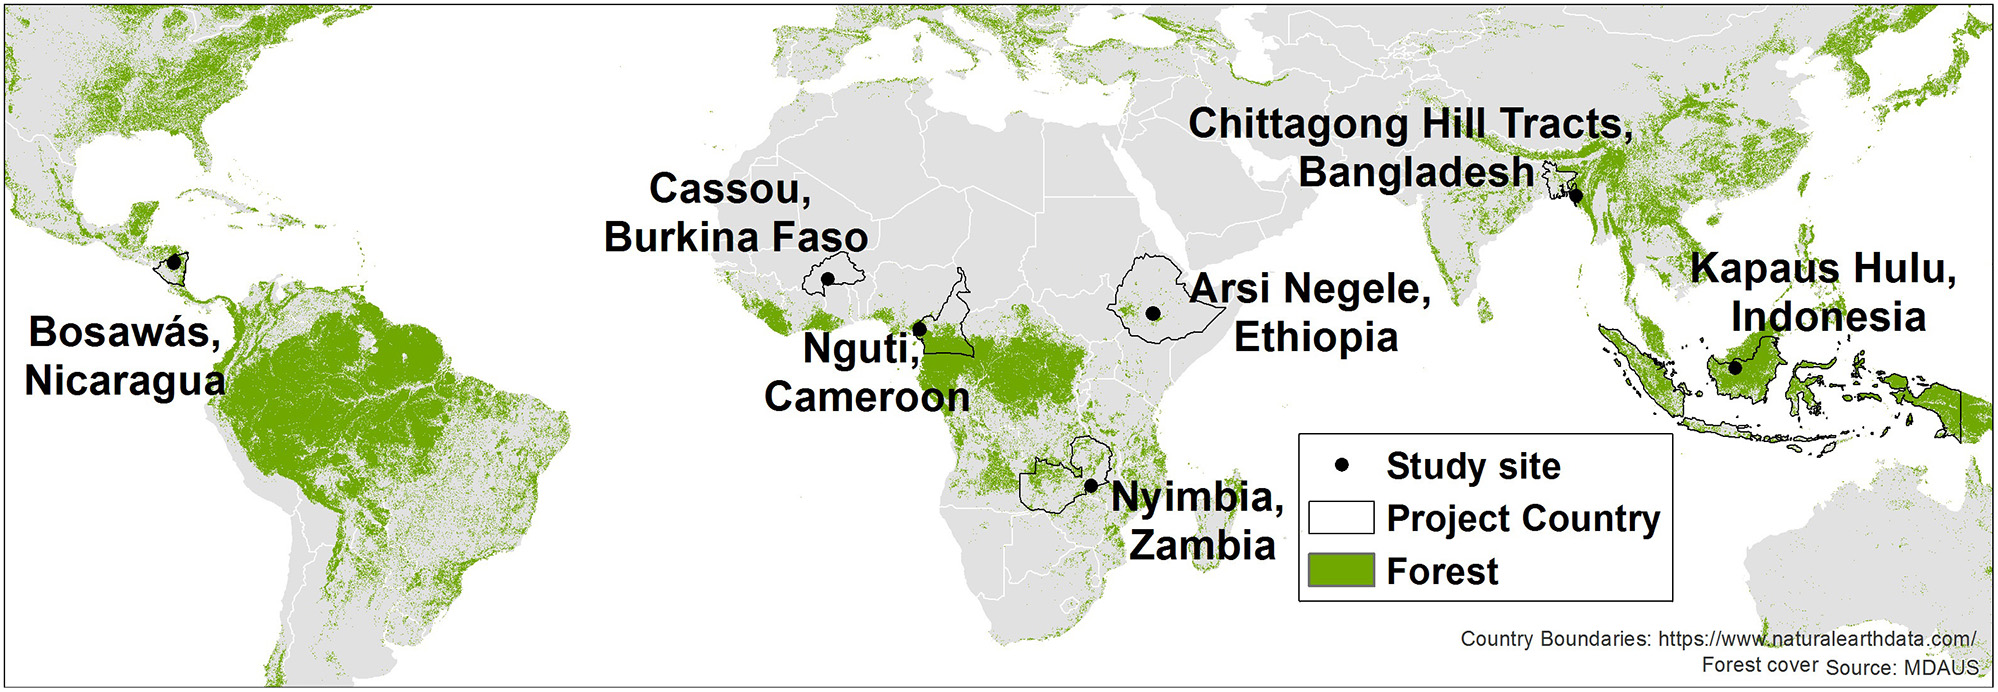
Location of the seven study landscapes. For the global context, forest cover shown here is derived from the commercially available MDA US dataset produced from Landsat 8. However, for our analysis, we conducted site-specific forest cover mapping to ensure locally accurate results.
Table 1
| Chittagong Hill Tracts Region (Bangladesh) | Cassou District (Burkina Faso) | Nguti District (Cameroon) | Arsi Negele (Ethiopia) | Kapuas Hulu Region (Indonesia) | Bosawas Biosphere Reserve (Nicaragua) | Nyimba District (Zambia) | |
|---|---|---|---|---|---|---|---|
| Natural vegetation | Tropical wet evergreen/semi-evergreen and deciduous forest | Mixture of gallery forest, tree savannah, shrub savannah and grass savannah | Atlantic Biafran forest | Dry afromontane Forest | Tropical forest | Humid broadleaf evergreen forest | Mopane woodland, scrub woodland, Zambezian miombo woodland |
| Elevation (m.a.s.l.) | 300–1,000 | 300 | 1,600 | 2,050–2,214 | 25–500 | 150–580 | 300–800 |
| Precipitation (mm) | 2,540 | 800–1,000 | 2,864 | 1,075 | 3530 | 2,500–3,500 | 700–900 |
| Average temperature (°C) | 23 | 27.6 | 26 | 15 | 27 | 25.7 | 29 |
| Population density | 120 | 35 | 47 | 142 | 7.7 | 14 | 8.1 |
| Main crop | Rice, maize, fruits, vegetables, tobacco, sugarcane, cotton, teak plantation | Sorghum, maize, yam, sweet potatoes, cotton, sesame, rice | Maize, cassava, cocoyam, cocoa, yam, oil palm, groundnut, coffee, plantain, banana, rubber | Wheat, maize, potato, enset, bean, barley, teff, sorghum | Rice, palm oil, rubber, vegetables | Maize, rice, beans, banana, plantain, cacao, coffee | Maize, sunflower, groundnut, soybean, cotton, sweet potato |
| Main livestock | Cattle, pigs, chickens | Cattle, sheep, goats, poultry | Goats, pigs, sheep, chickens | Cattle, sheep, goats, horses, donkeys, and chickens | Chickens | Cattle, pigs, chickens, horses | Goats, chickens, pigs, cattle and ducks |
| Diets and culture | Strong reliance on wilds foods and agroforestry systems | Well-developed agroforestry systems and strong market integration | Very strong cultural attachment to forest foods. Considerable rural to urban transfer of forest foods for sale in urban centers | Fast moving shift into greater market integration | Diet transition already taken place across the landscape. Heavy emphasis on processed foods and marketed products | Site with least reliance on wild foods due to loss of availability and strong market access | Currently strong traditional food culture but moving fast toward greater market integration and western foodstuffs |
Description of the seven study landscapes.
The data were collected between December 2014 and August 2016 from 275 farming households in Bangladesh, 281 in Burkina Faso, 242 in Cameroon, 219 in Ethiopia, 239 in Indonesia, 253 in Nicaragua, and 274 in Zambia, for a total of 1783 households (see survey questionnaire in Supplementary Material). In each landscape, households were selected using a stratified random sampling scheme across a gradient of forest-agricultural intensification (see Sunderland et al., 2017). As such, approximately a third of households were distributed in each of three zones: relatively high tree cover/low level of agricultural intensification; relatively low tree cover/high agricultural intensification; and intermediate tree cover/agricultural intensification. While differences between zones were not the focus of this analysis, it is possible that this stratified sampling introduced confounding social, cultural, or economic factors our analysis was not completely able to control for (such as differences in diet between social–ecological systems of different ethnic groups) (see Sunderland et al., 2017 for more description).
The survey data contained information on presence or absence of a home garden, total area farmed (as estimated by the head of the household, and referred to as “farm area” in the rest of the paper), numbers of different livestock species, ownership of various assets, main sources of income, and consumption or not of 11 food groups in the household during the 24 h that preceded the survey: (1) cereals, grains, and cereal products; (2) roots and tubers; (3) pulses and nuts; (4) vegetables; (5) meat and animal products; (6) fruits; (7) milk and milk products; (8) oils and fats; (9) sugar, sugar products, and honey; (10) spices and condiments; and (11) snacks and processed foods. These 11 food groups were used to construct dietary diversity scores following the Food and Agriculture Organization of the United Nations' Household Dietary Diversity Score (HDDS; Kennedy et al., 2010), modified to match food groups used in another research project (the Sentinel Landscapes Project, https://www1.cifor.org/sentinel-landscapes/home.html). The 24-h household dietary diversity score is referred to as “dietary diversity” in the rest of the paper, and the consumption of fruits, vegetables, and meat and other animal products, excluding dairy products, in the 24-h preceding the interview are referred to as “fruit consumption,” “vegetable consumption,” and “meat consumption,” respectively.
Remote Sensing
Contemporary forest cover surrounding all households included in the household survey data was characterized with Landsat imagery (30-m resolution) using the best available imagery from years closest to the dates of household surveys within each country gathered from the United States Geological Survey's GLOVIS earth explorer tool (http://glovis.usgs.gov/). Images contained varying amounts of cloud cover and atmospheric haze, which presented challenges for identifying forest cover. Dry season imagery was selected to help minimize cloud cover and to help distinguish agricultural land from other vegetation types, except in Burkina Faso where tree canopies were most visible during the wet season. Selected years resulted in 2010 for Indonesia; 2013 for Burkina Faso, Ethiopia, and Zambia; 2014 for Bangladesh; and 2015 for Cameroon and Nicaragua. Images were classified into three basic classes: forest, non-forest, and no data (consisting of clouds, water bodies, and cloud shadows) using ENVI software (Exelis Visual Information Solutions, Boulder, Colorado). We used a combination of image thresholding (based on vegetation indices such as the Normalized Burn Ratio, Tasseled Cap Transformations, and Disturbance Index, Healey et al., 2005) and Maximum Likelihood-based classifications, as well as Support Vector Machine (SVM) classifiers, as appropriate, to best capture forest/non-forest at sites. Because image availability due to excessive cloud cover made image analysis most challenging at the Indonesia sites, we adapted published forest cover maps (from Hansen et al., 2013) that became available near the end of the project. Thus, rather than create our own forest cover maps in Indonesia, we used forest cover (as defined by Hansen et al., 2013) and further conducted a supervised classification within the forested areas to distinguish several types of plantations (rubber and oil palm) that we then reclassified as agriculture. Classification accuracy was assessed with a combination of field verification and high-resolution imagery (e.g., RapidEye, Google Earth) which aimed to use a minimum of 100–200 verification points at each site, as available. The proportion of forest within a 2-km radius of each household (termed “forest cover” here) was then determined using R package raster. A 2-km buffer approximated the average travel distance to forests at most sites, as determined in scoping exercises and key informant interviews conducted at all sites.
Indicators of Farm Production and Wealth
For each farming household, livestock numbers reported in the survey were converted into Tropical Livestock Units (TLU). Following the method of Jahnke (1982), sheep and goats were assumed to be equivalent to 0.1 TLU; donkeys, 0.5 TLU; and all types of cattle, 0.7 TLU.
In addition, each farm was qualified as integrated to the cash economy or not based on their reported sources of income. If the household reported wage labor, salary, a trade, or any form of business, they were classified as market integrated, while other households were classified as not market integrated. Approximately 45% of households were classified as market integrated by this method.
Piece-Wise Structural Equation Modeling
To test and quantify the various pathways linking forest and dietary diversity, fruit, vegetable, and meat consumptions, structural equation models were used. Structural equation modeling has been used extensively in psychology, and increasingly in natural science. Structural equation modeling can be defined as “the use of two or more structural [cause-effect] equations to model multivariate relationships” (Grace, 2006). As such, structural equation models are generally represented as more or less complex networks of relationships. Structural equation modeling is related to regression, principal components analysis, and path analysis (McCune and Grace, 2002). However, a major difference is that structural equation modeling provides a means to evaluate the structure of the model (pattern of relationships among variables) as well as the model parameters using observed data (McCune and Grace, 2002). By model structure, we mean the correlations, direct, and indirect relationships among variables. Therefore, structural equation modeling can be used to test construct models (i.e., hypothesized models) and quantify relationships between model components (Grace, 2006). Although not used in this study, structural equation modeling also allows for the inclusion of unobserved (latent) variables as theoretical variables reflected by several indirect observed (manifest) variables (Grace et al., 2010).
A construct model was developed to test the three pathways linking forest cover to dietary diversity (Figure 3). Dietary diversity was hypothesized to be influenced by (1) forest cover (e.g., Ickowitz et al., 2014), representing the direct pathway described in the introduction; by (2) farm production (e.g., Jones, 2017), proxied by farm area, presence/absence of a home garden, and livestock ownership; and by (3) improved market access (e.g., Sibhatu et al., 2015), proxied by integration to the cash economy. Relationships between forest cover and farm area, between forest cover and presence/absence of a home garden, and between forest cover and livestock ownership were included to represent different ways in which forests can support farm production (e.g., Reed et al., 2017), i.e., different dimensions of the agroecological pathway described in the introduction. As crop residues and weeds often represent a major part of the diet of livestock in tropical countries (e.g., Baudron et al., 2014), a relationship between farm area and livestock ownership was included. Similarly, manure produced by livestock being often concentrated in home gardens (e.g., Baudron et al., 2017), a relationship between livestock ownership and presence/absence of a home garden was also included. In addition, a relationship between farm area and presence/absence of a home garden was included to test possible correlation between these two dimensions of crop production. Finally, a relationship between forest cover and integration to the cash economy was included to represent the possible sale of forest product (e.g., Angelsen et al., 2014), i.e., income pathway described in the introduction, and relationships between farm area, presence/absence of a home garden, livestock ownership, and integration to the cash economy, to represent the possible sale of farm products. A continuous variable was used for livestock ownership in the models representing Burkina Faso and Ethiopia, but a binary variable (presence/absence) for the models representing the five other landscapes, as a large fraction of households in these sites did not own any livestock. The same model was used for fruit consumption, vegetable consumption, and meat consumption, giving a total of 28 models (four per country). Global goodness of fit of the models was assessed by tests of directional separation. We ensured through these tests that all interactions were included, e.g., with Fisher's C of 0 and P-value of 1.
Figure 3
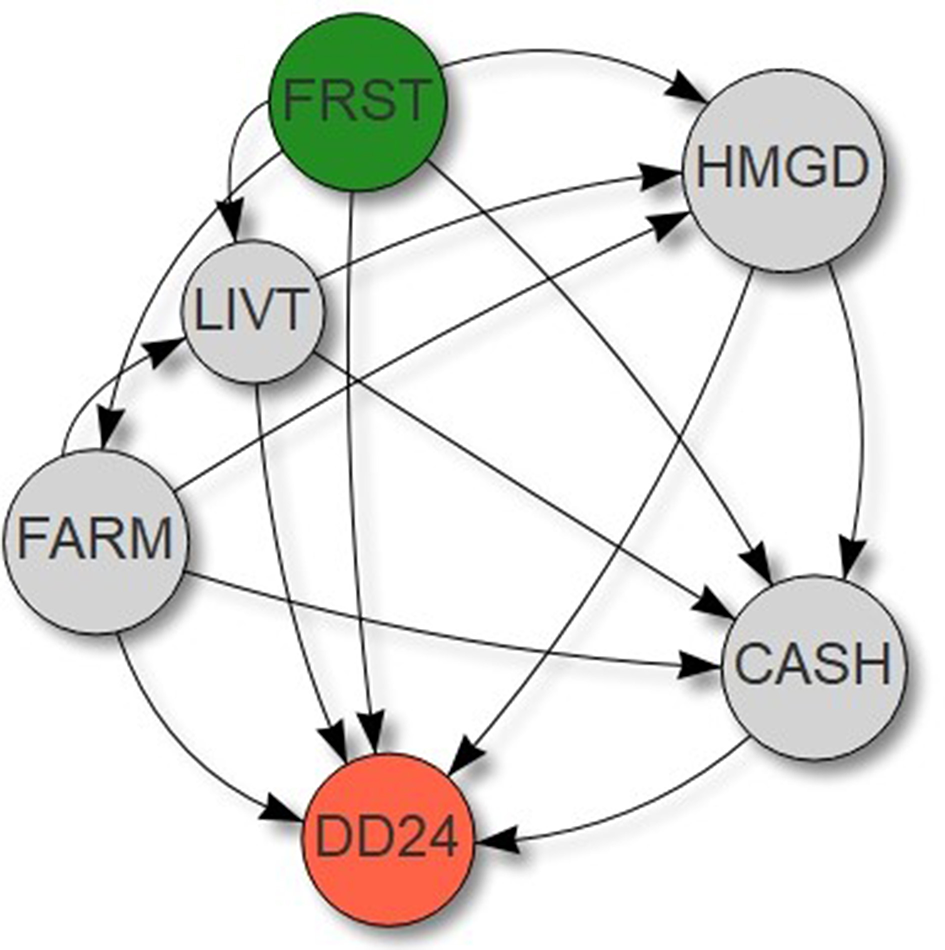
Construct models used to test and quantify the pathways from Figure 1 using piece-wise structural equation modeling. FRST: percentage of forest in a 2-km radius surrounding each household, DD24: household dietary diversity score recorded over the past 24 h, FARM: farm size (ha), HMGD: presence/absence of a home garden, LIVT: livestock ownership (TLU), CASH: integration to the cash economy (yes/no). See text for detailed description of the interactions included in this model. The same model was used with the other dietary measures: consumption of fruits in the past 24 h (yes/no), consumption of vegetables in the past 24 h, and consumption of meat and other animal product (excluding milk and milk products) in the past 24 h.
Structural equation modeling assumes that all variables are derived from a normal distribution, while dietary diversity can be assumed to follow a Poisson distribution, and fruit, vegetable, and meat consumption, presence/absence of a home garden, integration to the cash economy, and livestock ownership in five of the seven countries can be assumed to follow a binomial distribution. In response, piece-wise structural equation modeling is recommended, whereby paths are estimated in individual models and then pieced together to construct the causal model (www.jonlefcheck.net/2014/07/06/piecewise-structural-equation-modeling-in-ecological-research). This was performed using the R package piecewiseSEM.
Results and Discussion
Forest and non-forest were distinguished with quite high accuracy, with a few clear exceptions, as simplified land cover classifications with few classes (such as the ones we used) tend to be quite accurate. Overall accuracies exceeded 90–95% at most sites and at a few locations approached or surpassed only 80%. In Indonesia, the rubber and oil palm plantations were accurately discriminated from other forest cover to 93% accuracy. Locations with lower overall map accuracy were evident, as follows. In Bangladesh, teak plantations could not be discriminated from surrounding forests as they were spectrally similar and mostly quite small (<1 ha). In addition, this landscape also encompassed narrow, small linear non-forest features that were not well captured using 30-m imagery. Dry tropical forests, such as in Burkina Faso, achieved overall accuracy of only 86% largely driven by errors of omission whereby scattered trees as well as small forest patches with very sparse canopy cover were not detected by the 30-m Landsat imagery.
All piece-wise structural models fitted the observed data well, with a Fisher's C-value of 0 and a P-value of 1.
General Characteristics of the Seven Landscapes Studied
The seven landscapes were found to be characterized by varying levels of forest cover, with Bangladesh having the highest average proportion of forest surrounding (2 km radius) the studied farming households (88.1%) and Ethiopia having the lowest (12.0%) (Table 2). The variability in forest cover—measured by standard deviations in Table 2—was the greatest in Indonesia and the lowest in Burkina Faso.
Table 2
| Bangladesh | Burkina Faso | Cameroon | Ethiopia | Indonesia | Nicaragua | Zambia | |
|---|---|---|---|---|---|---|---|
| Proportion of forest in the 2-km radius surrounding the farm (%) | 88.1 ± 5.0 | 22.8 ± 4.0 | 78.3 ± 8.2 | 12.0 ± 13.1 | 27.4 ± 30.4 | 30.2 ± 11.1 | 19.4 ± 9.8 |
| Farm size (ha) | 2.35 ± 2.62 | 5.81 ± 3.93 | 4.97 ± 3.93 | 1.01 ± 0.63 | 6.84 ± 12.22 | 10.97 ± 23.03 | 2.08 ± 2.79 |
| Presence of a home garden (%) | 54.9 | 62.3 | 74.4 | 71.7 | 82 | 77.1 | 11.3 |
| Livestock ownership (TLU) | 2.42 ± 4.02 | 6.18 ± 8.31 | 0.10 ± 0.35 | 2.85 ± 2.24 | 0.75 ± 6.66 | 3.16 ± 9.84 | 3.08 ± 4.74 |
| Integration to the cash economy (%) | 67.6 | 29.9 | 39.7 | 15.1 | 83.7 | 17.8 | 44.5 |
| 24-h household dietary diversity score | 8.07 ± 1.48 | 6.14 ± 1.53 | 6.75 ± 1.68 | 7.75 ± 1.99 | 8.04 ± 1.44 | 8.74 ± 1.94 | 8.31 ± 2.46 |
| Fruit consumption in the last 24 h (%) | 39.8 | 52 | 39.5 | 54.4 | 47.8 | 65.1 | 56.7 |
| Vegetable consumption in the last 24 h (%) | 99.7 | 81.1 | 84.9 | 99.1 | 98.4 | 76.6 | 94.2 |
| Meat consumption in the last 24 h (%) | 91.2 | 84.7 | 89.3 | 47.3 | 91.6 | 79.1 | 79.6 |
General characteristics of the 1,783 farms in the seven study landscapes analyzed in this study (% and mean ± standard deviation).
The largest farms were found in Nicaragua (average of 10.97 ha) and the smallest ones were found in Ethiopia (average of 1.01 ha). About or more of the farms were cultivating a home garden in Cameroon, Ethiopia, Indonesia, and Nicaragua. The lowest proportion of farms cultivating a home garden was found in Zambia (11.3%). The largest livestock herds were found in Burkina Faso (average of 6.18 TLU) and the smallest ones were found in Indonesia (average of 0.75 TLU). The majority of households were considered integrated to the cash economy in Bangladesh and Indonesia. The lowest proportion of households considered integrated to the market was found in Ethiopia (15.1%).
The highest dietary diversity was recorded in Nicaragua (average score of 8.74) and lowest in Burkina Faso (average score of 6.14). The largest variability in dietary diversity was found in Zambia and the lowest was found in Indonesia. The majority of households consumed fruits in the 24 h that preceded the interview in Burkina Faso, Ethiopia, Nicaragua, and Zambia. Fruit consumption was the lowest in Bangladesh and Cameroon (around 40% in both landscapes). More than 90% of households consumed vegetables in the 24 h that preceded the interview in Bangladesh, Ethiopia, Indonesia, and Zambia. The lowest proportion of households consuming vegetables (but still high) was found in Nicaragua (76.6%). In all the landscapes except Ethiopia, about 80% of households or more consumed meat in the 24 h that preceded the interview (the percentage was 47.3% in Ethiopia).
Forest and the Direct Pathway to Diet Quality
The results of this piece-wise structural equation modeling identified a direct relationship or pathway between forest cover and dietary diversity in two landscapes: Bangladesh and Ethiopia (Figure 4 and Table 3). This appeared to be linked, at least in part, to meat consumption in Bangladesh, and meat and fruit consumption in Ethiopia (Table 3). In addition, forest was found to support fruit consumption in Cameroon and meat consumption in Zambia (although no association between forest cover and dietary diversity was found for these landscapes; Table 3). No link between forest cover and vegetable consumption was found in any of the landscapes investigated (Table 3). This lack of relationship could be in part due to the high percentage of households that had consumed vegetables during the 24 h preceding the interview (Table 2).
Figure 4
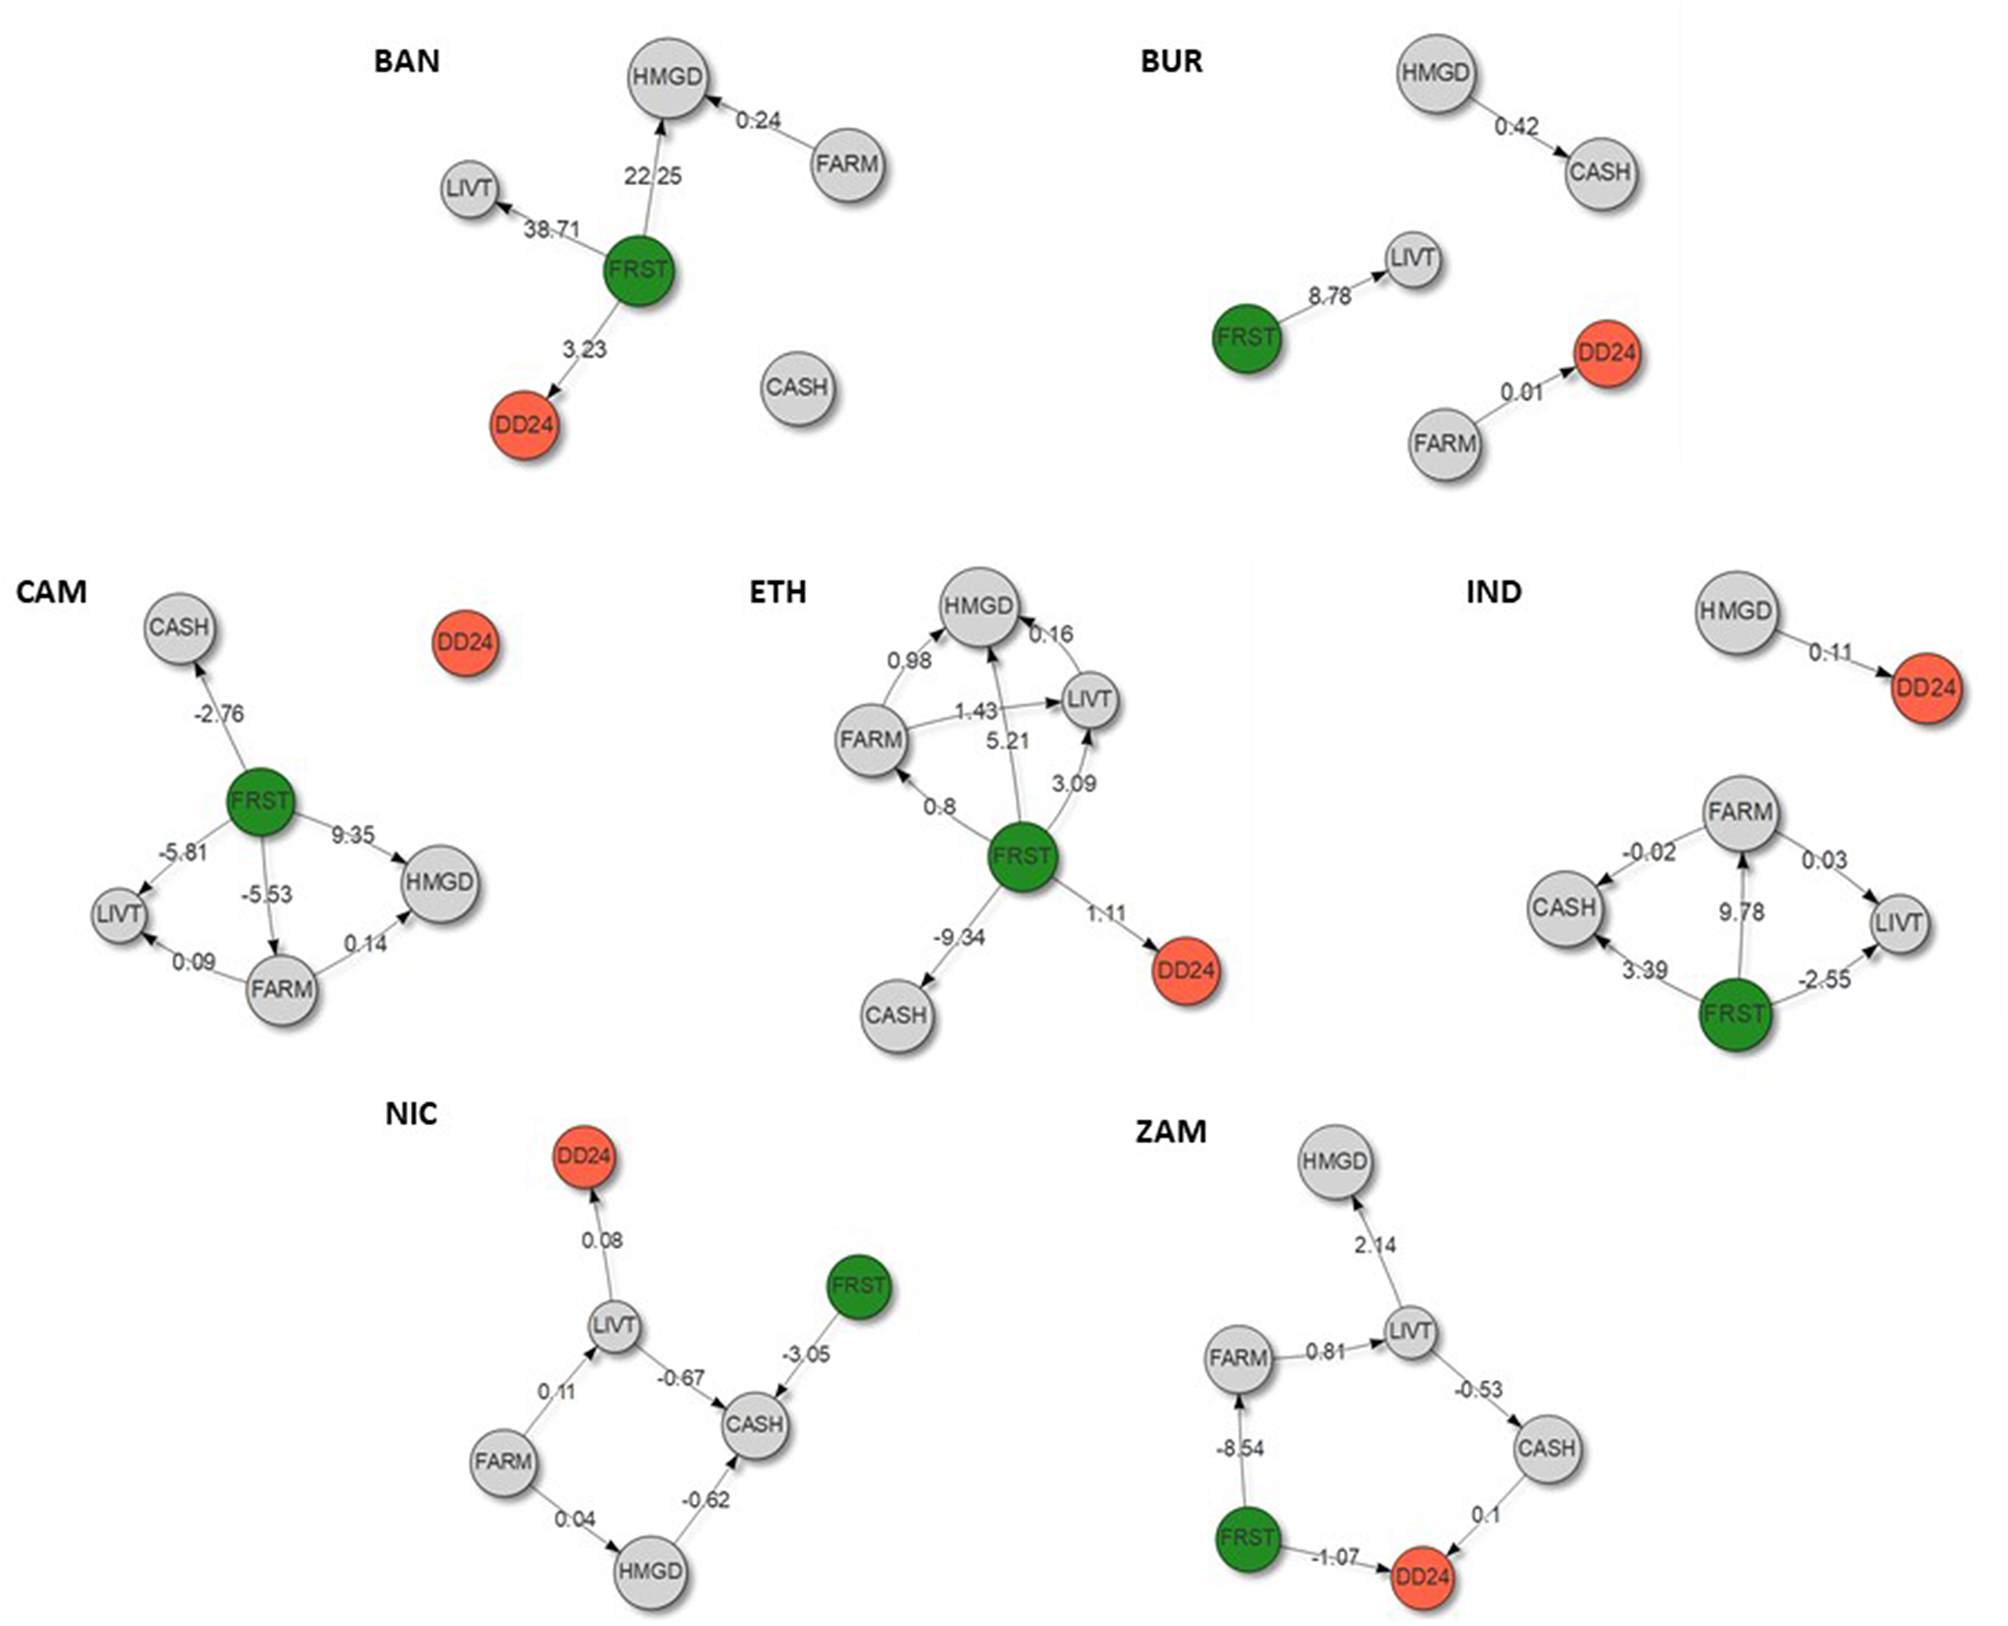
Piece-wise structural equation models linking the percentage of forest in a 2-km radius surrounding each household (FRST) to its household dietary diversity score recorded over the past 24 h (DD24) for Bangladesh (BAN), Burkina Faso (BUR), Cameroon (CAM), Ethiopia (ETH), Indonesia (IND), Nicaragua (NIC), and Zambia (ZAM). Only relationships that are statistically significant (P < 0.1) are represented with their coefficient in the networks. FARM: farm size (ha), HMGD: presence/absence of a home garden, LIVT: livestock ownership (TLU or presence/absence), CASH: integration or not to the cash economy.
Table 3
| Pred | Bangladesh | Burkina Faso | Cameroon | Ethiopia | Indonesia | Nicaragua | Zambia | ||||||||||||||
|---|---|---|---|---|---|---|---|---|---|---|---|---|---|---|---|---|---|---|---|---|---|
| Est | Std | P-val | Est | Std | P-val | Est | Std | P-val | Est | Std | P-val | Est | Std | P-val | Est | Std | P-val | Est | Std | P-val | |
| DD24 | |||||||||||||||||||||
| FRST | 3.23 | 1.65 | 0.05 | 0.07 | 0.17 | 0.68 | 0.43 | 0.33 | 0.19 | 1.11 | 0.19 | 0.00 | 0.00 | 0.08 | 0.97 | −0.32 | 0.20 | 0.10 | −1.07 | 0.24 | 0.00 |
| CASH | 0.00 | 0.05 | 0.97 | 0.01 | 0.05 | 0.89 | 0.08 | 0.05 | 0.12 | 0.01 | 0.07 | 0.84 | 0.07 | 0.06 | 0.28 | −0.06 | 0.06 | 0.34 | 0.10 | 0.04 | 0.02 |
| FARM | 0.00 | 0.01 | 0.76 | 0.01 | 0.01 | 0.07 | 0.00 | 0.01 | 0.58 | 0.05 | 0.04 | 0.20 | 0.00 | 0.00 | 0.30 | 0.00 | 0.00 | 0.65 | 0.01 | 0.01 | 0.25 |
| HMGD | 0.01 | 0.05 | 0.82 | 0.07 | 0.05 | 0.19 | −0.01 | 0.06 | 0.89 | 0.06 | 0.06 | 0.31 | 0.11 | 0.06 | 0.08 | 0.04 | 0.05 | 0.50 | 0.10 | 0.06 | 0.13 |
| LIVT | 0.01 | 0.05 | 0.89 | 0.00 | 0.00 | 0.48 | 0.01 | 0.06 | 0.94 | 0.01 | 0.01 | 0.37 | 0.00 | 0.07 | 0.98 | 0.08 | 0.05 | 0.09 | 0.04 | 0.05 | 0.43 |
| FT24 | |||||||||||||||||||||
| FRST | −4.35 | 9.74 | 0.66 | 0.86 | 0.91 | 0.35 | 5.34 | 1.68 | <0.01 | 11.22 | 1.81 | 0.00 | −1.54 | 0.49 | 0.00 | 1.17 | 1.29 | 0.37 | −7.00 | 1.61 | 0.00 |
| CASH | 0.23 | 0.33 | 0.48 | 0.11 | 0.28 | 0.68 | 0.27 | 0.27 | 0.33 | 0.68 | 0.41 | 0.10 | 0.04 | 0.36 | 0.91 | −0.64 | 0.34 | 0.06 | 0.80 | 0.28 | 0.00 |
| FARM | −0.02 | 0.05 | 0.69 | 0.07 | 0.04 | 0.06 | −0.05 | 0.04 | 0.22 | 0.46 | 0.29 | 0.12 | 0.00 | 0.01 | 0.82 | 0.00 | 0.01 | 0.81 | 0.12 | 0.09 | 0.18 |
| HMGD | 0.31 | 0.31 | 0.31 | 1.11 | 0.26 | <0.01 | 0.13 | 0.31 | 0.68 | −0.07 | 0.38 | 0.86 | 0.48 | 0.34 | 0.16 | 0.17 | 0.32 | 0.60 | 0.63 | 0.44 | 0.15 |
| LIVT | 0.71 | 0.32 | 0.03 | 0.01 | 0.02 | 0.73 | −0.31 | 0.37 | 0.41 | 0.08 | 0.09 | 0.37 | 0.13 | 0.39 | 0.75 | 0.50 | 0.30 | 0.10 | −0.09 | 0.30 | 0.76 |
| VG24 | |||||||||||||||||||||
| FRST | 0.62 | 1.15 | 0.59 | −2.76 | 2.30 | 0.23 | 40.20 | 86.20 | 0.64 | 0.52 | 2.32 | 0.82 | −2.96 | 1.33 | 0.03 | −2.57 | 2.74 | 0.35 | |||
| CASH | 0.69 | 0.39 | 0.08 | −0.02 | 0.37 | 0.96 | −2.82 | 3.61 | 0.44 | 0.50 | 1.22 | 0.68 | −0.39 | 0.38 | 0.30 | −0.49 | 0.53 | 0.35 | |||
| FARM | 0.19 | 0.06 | <0.01 | 0.02 | 0.05 | 0.63 | −0.48 | 1.40 | 0.73 | 0.28 | 0.26 | 0.29 | 0.03 | 0.02 | 0.09 | 0.11 | 0.21 | 0.60 | |||
| HMGD | −0.41 | 0.34 | 0.24 | −0.10 | 0.43 | 0.82 | 18.37 | 3181 | 1.00 | 0.30 | 1.19 | 0.80 | −0.09 | 0.37 | 0.81 | 0.82 | 1.07 | 0.44 | |||
| LIVT | 0.01 | 0.02 | 0.62 | −1.08 | 0.42 | 0.01 | 0.55 | 0.75 | 0.47 | −1.05 | 1.21 | 0.39 | 0.34 | 0.33 | 0.30 | −0.83 | 0.62 | 0.18 | |||
| MT24 | |||||||||||||||||||||
| FRST | 31.92 | 16.23 | 0.05 | 0.42 | 1.23 | 0.73 | −1.64 | 2.54 | 0.52 | 8.62 | 1.61 | <0.01 | 0.96 | 1.12 | 0.39 | −2.20 | 1.41 | 0.12 | 4.05 | 1.94 | 0.04 |
| CASH | −0.24 | 0.61 | 0.70 | 0.70 | 0.42 | 0.09 | 0.65 | 0.44 | 0.14 | −1.06 | 0.51 | 0.04 | 0.53 | 0.58 | 0.36 | −0.71 | 0.38 | 0.07 | 0.46 | 0.32 | 0.15 |
| FARM | 0.02 | 0.10 | 0.87 | 0.08 | 0.05 | 0.16 | 0.08 | 0.07 | 0.24 | 0.42 | 0.30 | 0.17 | 0.18 | 0.10 | 0.06 | 0.04 | 0.02 | 0.07 | 0.15 | 0.13 | 0.24 |
| HMGD | 0.83 | 0.54 | 0.13 | −2.03 | 0.55 | <0.01 | −0.12 | 0.48 | 0.80 | 0.84 | 0.40 | 0.04 | 1.29 | 0.49 | 0.01 | −0.58 | 0.41 | 0.16 | 0.46 | 0.57 | 0.42 |
| LIVT | 0.17 | 0.50 | 0.74 | −0.01 | 0.02 | 0.48 | 0.66 | 0.65 | 0.31 | 0.10 | 0.09 | 0.24 | −0.73 | 0.63 | 0.25 | 0.55 | 0.34 | 0.10 | 0.55 | 0.34 | 0.11 |
Estimates and their confidence intervals and associated P-values for the predictors of household dietary diversity scores (DD24), fruit consumption (FT24), vegetable consumption (VG24), and meat (and other animal product excluding dairy) consumption (MT24) for Bangladesh (BAN), Burkina Faso (BUR), Cameroon (CAM), Ethiopia (ETH), Indonesia (IND), Nicaragua (NIC), and Zambia (ZAM).
Predictors with an associated P-value lower than 0.1 are in bold.
Forest cover was positively associated with fruit consumption in Cameroon and Ethiopia. It was the only statistically significant predictor of fruit consumption in Cameroon and the predictor with the largest value in Ethiopia, thus underscoring the importance of forest access in these two landscapes (Table 3). Wild fruits are important food items in the diet of many rural communities around the world. These wild fruits are partly harvested not only from forests but also from trees retained on farmland (Campbell, 1987; Herzog et al., 1994; Kalenga Saka and Msonthi, 1994). Similar to wild fruits, wild vegetables are also often harvested from the farmland, as part of a “hidden harvest” (Scoones et al., 1992; Powell et al., 2015). Therefore, part of the positive associations found between farm area and fruit consumption in Cameroon (Table 3) and between farm area and vegetable consumption in Burkina Faso and Nicaragua (Table 3) may be explained by wild fruits and wild vegetables harvested from the farmland, not only from cultivated sources. Part of the positive association between farm area and meat consumption in Indonesia and Nicaragua may also be explained by wild animals that are often hunted from the farmland and not exclusively from forests (e.g., Smith, 2005). Similarly, the positive association found between livestock ownership and fruit consumption in Bangladesh and Nicaragua may be explained by collection of wild fruits during herding.
Forest cover was positively associated with meat consumption in three out of the seven landscapes considered (Bangladesh, Ethiopia, and Zambia; Table 3). Forest cover was the only statistically significant predictor of meat consumption in Bangladesh and Zambia, and the predictor with the largest value in Ethiopia, pointing to the importance of bushmeat and wild fish in many of the sites considered (Table 3). Nasi et al. (2011) estimated the total quantity of bushmeat extracted annually from tropical forests of Africa and South America to six million tons. Many of the African countries considered in their assessment do not produce enough non-bushmeat animal products to meet the requirements of their growing populations (Fa et al., 2003). Indeed, in large parts of tropical Africa, livestock production is limited by diseases such as trypanosomiasis (Kristjanson et al., 1999). Bushmeat and wild fish thus represent a critical source of quality proteins and readily available micronutrients to millions in and around tropical forests. In Northeastern Madagascar, it was established that the loss of bushmeat in local diets would increase the incidence of anemia in children by 30% (Golden et al., 2011).
Securing access to forest food where it is of critical importance to local diets may be challenged when these forests are protected (Pimbert and Pretty, 2013), which is the case in Cameroon, Indonesia, and Zambia in particular. Forest protection, and enforcement of stricter conservation legislations, can limit access to critical resources that contribute to diets and there is often a trade-off between biodiversity conservation and dietary diversity (Hutton et al., 2005; Sylvester et al., 2016). The issue is particularly sensitive for bushmeat, as bushmeat harvesting for subsistence generally coexists with—often very lucrative—bushmeat trades and may affect endangered species (Maxwell et al., 2016). Commercial hunting for meat is seldom sustainable (Robinson and Bennett, 2004; Maxwell et al., 2016), but see Cowlishaw et al. (2005).
In addition to the positive associations between forest cover and diet quality reported above, negative associations were also uncovered. Forest cover was found to be negatively related to dietary diversity and fruit consumption in Zambia, and to fruit consumption in Indonesia (Figure 4 and Table 3). In some circumstances, forest people may be vulnerable to seasonal gaps in some or all food groups, if wild food availability or access fluctuates seasonally (De Souza, 2006; Gabriele and Schettino, 2007). There may also be cultural differences and different dietary habits between populations living in the more forested and in the less forested parts of the same study site. Cultural differences may explain why we see positive relationships with forests in some sites and negative or neutral ones in others. For example, the communities in the Nicaragua site were non-Indigenous and lack the knowledge and tradition of wild food use (fruits, vegetables, bushmeat, etc.) seen in Indigenous populations of central America (Sylvester et al., 2016), helping to explain the lack of significant relationship between forest cover and any of the indicators of diet quality found in the Nicaragua site. The fact that forest cover covaried with ethnicity in some sites may also help to explain some of the weak and variable relationships seen (cultural variation in diet can be very large and could account for a lot of variation in our dietary variables). For example, in the Indonesian site, the communities with most forest cover were largely Dayak while the less forested communities were a mix of ethnic groups, including many immigrants from Java who have very different dietary traditions to the Dayak (Dove, 1999).
Forest, Integration to the Cash Economy, and the Income Pathway to Diet Quality
A positive association between integration to the cash economy and diet quality was found in three landscapes: Burkina Faso, Ethiopia, and Zambia. Integration to the cash economy was positively related to vegetable and meat consumptions in Burkina Faso, to fruit consumption in Ethiopia, and to dietary diversity and fruit consumption in Zambia (Table 3). These results concur with past findings that highlight the fact that improved market access tends to be associated with improved dietary diversity (Jones, 2017).
However, a positive association between forest cover and integration to the cash economy as well as a positive association between integration to the cash economy and diet quality—i.e., evidence of an income pathway—was not found in any of the landscapes studied. A positive association between forest cover and integration to the cash economy was found in Indonesia—where high-value forest products such as resin (e.g., “gaharu”) and swiflet nests are harvested and traded (Leonald and Rowland, 2016)—but no association between integration to the cash economy and dietary quality was found in this landscape (Tables 3, 4).
Table 4
| Pred | Bangladesh | Burkina Faso | Cameroon | Ethiopia | Indonesia | Nicaragua | Zambia | ||||||||||||||
|---|---|---|---|---|---|---|---|---|---|---|---|---|---|---|---|---|---|---|---|---|---|
| Est | Std | P-val | Est | Std | P-val | Est | Std | P-val | Est | Std | P-val | Est | Std | P-val | Est | Std | P-val | Est | Std | P-val | |
| CASH | |||||||||||||||||||||
| FRST | −4.89 | 5.73 | 0.39 | 0.06 | 0.78 | 0.94 | −2.76 | 1.40 | 0.05 | −9.34 | 2.95 | <0.01 | 3.39 | 1.11 | <0.01 | −3.05 | 1.80 | 0.09 | 1.21 | 1.40 | 0.39 |
| FARM | 0.00 | 0.03 | 0.91 | 0.03 | 0.02 | 0.13 | −0.01 | 0.03 | 0.83 | 0.33 | 0.34 | 0.33 | −0.02 | 0.01 | 0.10 | −0.03 | 0.02 | 0.16 | −0.10 | 0.08 | 0.22 |
| HMGD | −0.25 | 0.17 | 0.15 | 0.42 | 0.24 | 0.09 | −0.11 | 0.24 | 0.63 | 0.51 | 0.45 | 0.26 | −0.08 | 0.47 | 0.86 | −0.62 | 0.37 | 0.09 | 0.26 | 0.40 | 0.51 |
| LIVT | −0.18 | 0.17 | 0.31 | 0.00 | 0.01 | 0.74 | −0.33 | 0.28 | 0.24 | −0.06 | 0.11 | 0.57 | 0.00 | 0.49 | 1.00 | −0.67 | 0.36 | 0.06 | −0.53 | 0.28 | 0.05 |
| FARM | |||||||||||||||||||||
| FRST | −7.82 | 12.30 | 0.53 | −0.74 | 1.68 | 0.66 | −5.53 | 3.06 | 0.07 | 0.80 | 0.32 | 0.01 | 9.78 | 2.53 | <0.01 | −11.12 | 13.06 | 0.40 | −8.54 | 1.65 | <0.01 |
| HMGD | |||||||||||||||||||||
| FRST | 22.25 | 10.03 | 0.03 | 1.21 | 0.92 | 0.19 | 9.35 | 2.18 | 0.00 | 5.21 | 1.66 | <0.01 | 0.63 | 0.63 | 0.31 | 2.32 | 1.52 | 0.13 | −0.29 | 2.23 | 0.90 |
| FARM | 0.24 | 0.07 | <0.01 | −0.03 | 0.03 | 0.31 | 0.14 | 0.06 | 0.01 | 0.98 | 0.38 | 0.01 | 0.02 | 0.02 | 0.48 | 0.04 | 0.02 | 0.05 | 2.14 | 0.75 | <0.01 |
| LIVT | 0.14 | 0.30 | 0.64 | 0.02 | 0.02 | 0.21 | 0.68 | 0.43 | 0.11 | 0.16 | 0.09 | 0.09 | 0.28 | 0.53 | 0.60 | 0.01 | 0.34 | 0.97 | −0.01 | 0.07 | 0.88 |
| LIVT | |||||||||||||||||||||
| FRST | 38.71 | 10.13 | <0.01 | 8.78 | 3.53 | 0.01 | −5.81 | 2.23 | 0.01 | 3.09 | 1.04 | <0.01 | −2.55 | 1.00 | 0.01 | −0.75 | 1.32 | 0.57 | −0.15 | 1.60 | 0.93 |
| FARM | 0.05 | 0.05 | 0.36 | 0.10 | 0.13 | 0.41 | 0.09 | 0.04 | 0.01 | 1.43 | 0.22 | <0.01 | 0.03 | 0.01 | 0.02 | 0.11 | 0.03 | <0.01 | 0.81 | 0.18 | <0.01 |
Estimates and their confidence intervals and associated P values for the predictors of integration to the cash economy (CASH), farm size (FARM), home garden presence/absence (HMGD), and livestock ownership (LIVT) for Bangladesh, Burkina Faso, Cameroon, Ethiopia, Indonesia, Nicaragua, and Zambia, derived from the piece-wise structural equation models using household dietary diversity scores.
Predictors with an associated P-value lower than 0.1 are in bold.
A negative association between forest cover and integration to the cash economy was found in three landscapes: Cameroon, Ethiopia, and Nicaragua (Table 4). Forested areas of the tropics tend to be remote rural areas, which are often characterized by poverty (Bird et al., 2011). Income-earning opportunities tend to be limited, and markets distant (Angelsen and Wunder, 2003).
Forest, Crop and Livestock Production, and the Agroecological Pathway
Our results suggest that agricultural production supports diet quality in five out of the seven countries studied. Farm area was positively associated with dietary diversity and fruit and vegetable consumptions in Burkina Faso, with vegetable and meat consumptions in Nicaragua, and with meat consumption in Indonesia. Home gardens were positively associated with dietary diversity and meat consumption in Indonesia, with fruit consumption in Burkina Faso, and with meat consumption in Ethiopia. Finally, livestock ownership was positively associated with improved dietary diversity and fruit and meat consumptions in Nicaragua and with improved fruit consumption in Bangladesh (Figure 4 and Table 3).
We found evidence of an agroecological pathway—positive associations between forest and agricultural production (farm, home garden, or livestock), combined with a positive association between agricultural production and diet quality—in three landscapes: Bangladesh, Ethiopia, and Indonesia. This was characterized by positive associations between forest cover and livestock ownership, and between livestock ownership and fruit consumption in Bangladesh; positive associations between forest cover and presence of a home garden, and between presence of a home garden and meat consumption in Ethiopia; and by positive associations between forest cover and farm area, and between farm area and meat consumption in Indonesia.
Though generally not combined with positive relationships with diet quality, evidence of positive association between forest cover and crop and livestock production was found in five landscapes. Forest cover was positively related to farm area in Ethiopia and Indonesia; to the presence of a home garden in Bangladesh, Cameroon, and Ethiopia; and to livestock ownership in Bangladesh, Burkina Faso, and Ethiopia (Table 4). This positive relationship could be explained by ecosystem services provided by forests. In particular, soil fertility maintenance, micro-climate regulation, and pollination may be critical to crop species found in home gardens (Islam et al., 2008; Garibaldi et al., 2011; Baudron et al., 2017). Larger farm areas and larger livestock herds in the more forested sites may also be explained by lower population densities, resulting in greater availability of land for local farmers (Dzingirai et al., 2013).
Conversely, forest cover was negatively associated with farming in three landscapes, as reflected in smaller farm areas in Cameroon and Zambia, and reduced livestock ownership in Cameroon and Indonesia (Table 4). This negative association could be the reflection of policies that encourage conventional forms of intensification and not tree-based crop and livestock production systems (agroforestry and silvopastralism) and other production systems based on agroecology (Garibaldi et al., 2019). For instance, both the Cameroon and the Indonesia landscapes are characterized by a rapid expansion of large-scale plantations (Asaha and Deakin, 2016; Leonald and Rowland, 2016). This negative association could also be the result of lost opportunities to convert forests—particularly if they are protected—to cropland and pastures (Balmford and Whitten, 2003). It could as well be the result of crop destruction and livestock depredation by wildlife in the most forested parts of these landscapes (Choudhury, 2004; Michalski et al., 2006; Yirga and Bauer, 2010; Baudron et al., 2011). Forests may also act as reservoirs of crop pests and the wildlife they host may transmit diseases to livestock (Bengis et al., 2002; Blitzer et al., 2012). Much more emphasis is placed on ecosystem services than ecosystem disservices in the scientific literature. However, considering both is crucial in the design of multifunctional landscapes that deliver net benefits to local residents, in terms of diet quality but also other aspects of human well-being.
Limitations of the Study
Although illuminating regarding the pathways linking forest cover to dietary diversity, this research suffered from a number of limitations, which should be considered by future studies.
While our cross-site comparison allowed us to evaluate if patterns occurred across countries and forest types, higher spatial and temporal resolution of both forest cover and dietary diversity datasets may allow us to better distinguish the pathways from forests to diets. With the use of 30-m-resolution satellite images (from Landsat imagery), some small forest patches were likely undetected, particularly in the most sparsely forested landscapes. Forest detection could be improved with the use of images of higher resolution (Sentinel-2 images have a 10-m resolution, RapidEye images have a 5-m resolution, and Quickbird images have a 2.5-m resolution). Diet quality was only assessed once in each household, missing the temporal dynamic of availability and consumption of the different food groups. The sources of the different food groups (forest, farm, and market) were also not recorded, reducing the power of our analysis. The proxies of crop and livestock production (farm area, presence or not of a home garden, livestock ownership) were coarse: a more refined picture could be obtained by measuring actual production and diversity of key food groups by these different farm components. Similarly, the use of actual income data, rather than the use of a binary variable for integration to the cash economy, would be more powerful to test the income pathway.
In addition to these issues of data resolution, our analysis could have been improved with the inclusion of forest tenure and ethnicity data. For instance, we did not account for forest tenure in this analysis, and as such, forest cover does not necessarily equate with accessibility of forests. As noted above, the inability to account for ethnicity complicated interpretation of the results in some sites where this has a strong impact on dietary habits. For example, forest communities in the Indonesia landscape do not normally consume pulses, while those living in less forested areas have adopted tofu consumption, a dietary practice introduced from elsewhere in Indonesia.
Conclusions
While a growing number of studies have found fairly consistent relationships between forest cover and diet quality (Ickowitz et al., 2014; Galway et al., 2018; Rasolofoson et al., 2018), this study highlights the diversity of pathways that may be driving these relationships. The relative importance of each pathway varied between each of the study sites. We found evidence of a direct pathway to at least one of our four diet metrics in four landscapes (Bangladesh, Cameroon, Ethiopia, and Zambia), of an income pathway in none of the landscapes, and of an agroecological pathway in three landscapes (Bangladesh, Ethiopia, and Indonesia).
Although it appears to be the most important link between forests and diets, the sustainability of the direct pathway is threatened both by a return to more stringent conservation policies (Hutton et al., 2005) and by unsustainable harvesting of forest products, often fueled by demand from distant markets. This study also found evidence of forest supporting crop and livestock production in five landscapes, although this only led to improved diet quality (i.e., agroecological pathway) in three landscapes. These forest-production linkages have implications for the question of integration or segregation of food production and nature conservation, as encapsulated by the land sharing vs. land sparing debate. Although several studies have demonstrated that land sparing (i.e., segregation of food production and nature conservation) appears to offer the best outcome for tropical biodiversity (Phalan, 2018), this segregation is likely to represent a threat to local food production, as it would cut off smallholder farms from critical ecosystem services (critical as smallholders in the tropics tend to depend on ecosystem services more than external inputs).
These results highlight the intricacies of when and where different pathways link forests to better diet quality. In the context of rapid dietary and landscape changes, forests may be more important in some places than others, but we do not yet have enough evidence to determine where forests are most needed. Our results also suggest that the positive contributions of forests to rural livelihoods cannot be generalized and should not be idealized.
Statements
Data availability statement
The datasets generated and analyzed for this study can be found in the Harvard Dataverse repository (10.7910/DVN/8SRAZT).
Author contributions
FB conceived the analysis, analyzed data, and wrote the first draft of the manuscript. ST and SG analyzed the remote sensing data used in the analysis. JG helped with the analysis. TS coordinated the project that provided the field data. FB, ST, BP, SG, and TS contributed to data interpretation and writing of the final manuscript.
Acknowledgments
We thank Ronju Ahammad, Samson Foli, Stella Asaha, Jean-Yves Duriaux Chavarría, Dominic Rowland, and Davison Gumbo for field data collection. Ian Eddy classified remote sensing images. We also thank two reviewers for their critical and constructive comments.
Conflict of interest
The authors declare that the research was conducted in the absence of any commercial or financial relationships that could be construed as a potential conflict of interest.
Supplementary material
The Supplementary Material for this article can be found online at: https://www.frontiersin.org/articles/10.3389/fsufs.2019.00097/full#supplementary-material
References
1
Afshin A. Sur P. J. Fay K. A. Cornaby L. Ferrara G. Salama J. S. et al . (2019). Health effects of dietary risks in 195 countries, 1990–2017: a systematic analysis for the Global Burden of Disease Study 2017. Lancet393, 1958–1972. 10.1016/S0140-6736(19)30041-8
2
Angelsen A. Jagger P. Babigumira R. Belcher B. Hogarth N. J. Bauch S. et al . (2014). Environmental income and rural livelihoods: a global-comparative analysis. World Dev.64, S12–S28. 10.1016/j.worlddev.2014.03.006
3
Angelsen A. Wunder S. (2003). Exploring the Forest — Poverty Link : Key Concepts, Issues and Research Implications. Bogor: CIFOR.
4
Asaha S. Deakin E. L. (2016). Land-use change and its influence on rural livelihoods, food security and biodiversity conservation in the Southwest Region of Cameroon, in Agrarian change in tropical landscapes, eds DeakinE. L.KshatriyaM.SunderlandT. C. H. (Bogor: CIFOR, 54–90.
5
Balmford A. Whitten T. (2003). Who should pay for tropical conservation, and how could the costs be met?Oryx37, 238–250. 10.1017/S0030605303000413
6
Baudron F. Corbeels M. Andersson J. A. Sibanda M. Giller K. E. (2011). Delineating the drivers of waning wildlife habitat: the predominance of cotton farming on the fringe of protected areas in the Mid-Zambezi Valley, Zimbabwe. Biol. Conserv.144, 1481–1493. 10.1016/j.biocon.2011.01.017
7
Baudron F. Duriaux J.-Y. Remans R. Yang K. Sunderland T. (2017). Indirect contributions of forests to dietary diversity in Southern Ethiopia. Ecol. Soc.22:28. 10.5751/ES-09267-220228
8
Baudron F. Jaleta M. Okitoi O. Tegegn A. (2014). Conservation agriculture in African mixed crop-livestock systems: expanding the niche. Agric. Ecosyst. Environ.187, 171–182. 10.1016/j.agee.2013.08.020
9
Beck T. Nesmith C. (2001). Building on poor people's capacities: The case of common property resources in India and West Africa. World Dev.29, 119–133. 10.1016/S0305-750X(00)00089-9
10
Bengis R. G. Kock R. A. Fischer J. (2002). Infecious animal diseases: the wildelife/livestock interface. Rev. Sci. Tech. Off. Int. des Epizoot.21, 53–65. 10.20506/rst.21.1.1322
11
Bird K. Hulme D. Shepherd A. Moore K. (2011). Chronic Poverty and Remote Rural Areas. CPRC Working Paper13. Manchester: University of Manchester. 10.2139/ssrn.1754490
12
Blitzer E. J. Dormann C. F. Holzschuh A. Klein A.-M. Rand T. A. Tscharntke T. (2012). Spillover of functionally important organisms between managed and natural habitats. Agric. Ecosyst. Environ.146, 34–43. 10.1016/j.agee.2011.09.005
13
Campbell B. M. (1987). The use of wild fruits in Zimbabwe. Econ. Bot.41, 375–385. 10.1007/BF02859054
14
Choudhury A. (2004). Human–Elephant conflicts in northeast India. Hum. Dimens. Wildl.9, 261–270. 10.1080/10871200490505693
15
Cowlishaw G. Mendelson S. Rowcliffe J. M. (2005). Evidence for post-depletion sustainability in a mature bushmeat market. J. Appl. Ecol.42, 460–468. 10.1111/j.1365-2664.2005.01046.x
16
De Souza R. G. (2006). Body size and growth: the significance of chronic malnutrition among the Casiguran Agta. Ann. Hum. Biol.33, 604–619. 10.1080/03014460601062759
17
Deakin E. L. Kshatriya M. Sunderland T. C. H. (2016). Agrarian Change in Tropical Landscapes. Bogor: CIFOR.
18
Dix M. E. Harrell M. O. Wright R. J. (1995). Influences of trees on abundance of natural enemies of insect pests : a review. Agrofor. Syst.29, 303–311. 10.1007/BF00704876
19
Dounias E. Froment A. (2006). When forest-based hunter-gatherers become sedentary: consequences for diet and health. Unasylva57, 26–33.
20
Dove M. R. (1999). The agronomy of memory and the memory of agronomy: ritual conservation of archaic cultigens in contemporary farming systems, in Ethnoecology: Situated Knowledge/Located Lives, ed NazareaV. (Tucson, AZ: University of Arizona Press, 45–70.
21
Dzingirai V. Andersson J. A. Baudron F. Milgroom J. Murungweni C. Poshiwa X. (2013). On the edge of state and the economy, in Transfrontier Conservation Areas: People Living on the Edge, eds AnderssonJ. A.de Garine-WichatitskyM.CummingD. H. M.DzingiraiV.GillerK. E. (London: Routlege), 106–122.
22
Fa J. E. Currie D. Meeuwig J. (2003). Bushmeat and food security in the Congo Basin: linkages between wildlife and people's future. Environ. Conserv.30, 71–78. 10.1017/S0376892903000067
23
Foote J. Murphy S. P. Wilkens L. R. Basiotis P. P. Carlson A. (2004). Dietary variety increases the probability of nutrient adequacy among adults. J. Nutr.134, 1779–1785. 10.1093/jn/134.7.1779
24
Fu C. (2003). Potential impacts of human-induced land cover change on East Asia monsoon. Glob. Planet. Change37, 219–229. 10.1016/S0921-8181(02)00207-2
25
Gabriele A. Schettino F. (2008). Child malnutrition and mortality in developing countries: evidence from a cross-country analysis. Anal. Soc. Issues Public Policy8, 53–81. 10.1111/j.1530-2415.2008.00157.x
26
Galway L. P. Acharya Y. Jones A. D. (2018). Deforestation and child diet diversity: a geospatial analysis of 15 Sub-Saharan African countries. Heal. Place51, 78–88. 10.1016/j.healthplace.2018.03.002
27
Garibaldi L. A. Pérez-Méndez N. Garratt M. P. D. Gemmill-Herren B. Miguez F. E. Dicks L. V. (2019). Policies for ecological intensification of crop production. Trends Ecol. Evol.34, 282–286. 10.1016/j.tree.2019.01.003
28
Garibaldi L. A. Steffan-Dewenter I. Kremen C. Morales J. M. Bommarco R. Cunningham S. A. et al . (2011). Stability of pollination services decreases with isolation from natural areas despite honey bee visits. Ecol. Lett.14, 1062–1072. 10.1111/j.1461-0248.2011.01669.x
29
Golden C. D. Fernald L. C. H. Brashares J. S. Rasolofoniaina B. J. R. Kremen C. (2011). Benefits of wildlife consumption to child nutrition in a biodiversity hotspot. Proc. Natl. Acad. Sci. U.S.A.108, 19653–19656. 10.1073/pnas.1112586108
30
Grace J. B. (2006). Structural Equation Modeling and Natural Systems -. Cambridge. Cambridge. Available online at: https://books.google.co.za/books?hl=en&lr=&id=1suuMOChHWcC&oi=fnd&pg=PA326&dq=grace+2006+structural+equation&ots=Fl0DxeykVp&sig=O2H2LJvHxia2fmGrgPB5I_GE7dY#v=onepage&q=grace2006structuralequation&f=false
31
Grace J. B. Anderson M. Olff H. Scheiner S. M. (2010). On the specification of structural equation models for ecological systems. Ecol. Monogr.80, 67–87. 10.1890/09-0464.1
32
Hansen M. C. Potapov P. V. Moore R. Hancher M. Turubanova S. A. Tyukavina A. et al . (2013). High-resolution global maps of 21st-century forest cover change. Science342, 850–853. 10.1126/science.1244693
33
Headey D. Masters W. A. (2019). Agriculture for nutrition: direct and indirect effects, in Agriculture for Improved Nutrition: Seizing the Momentum, eds FanS.YosefS.Pandya-LorchR. (Wallingford: CABI), 16–26. 10.1079/9781786399311.0016
34
Healey S. P. Cohen W. B. Zhiqiang Y. Krankina O. N. (2005). Comparison of Tasseled Cap-based Landsat data structures for use in forest disturbance detection. Remote Sens. Environ.97, 301–310. 10.1016/j.rse.2005.05.009
35
Herzog F. Farah Z. Amadò R. (1994). Composition and consumption of gathered wild fruits in the V-Baoulé, Côte d'Ivoire. Ecol. Food Nutr.32, 181–196. 10.1080/03670244.1994.9991399
36
Hladik C. M. Bahuchet S. De Garine I. (1990). Food and Nutrition in the African Rain Forest. Paris: Unesca/MAB.
37
HLPE A. (2017). Nutrition and Food Systems. Rome: HLPE.
38
Hutton J. Adams W. M. Murombedzi J. C. (2005). Back to the barriers? Changing narratives in biodiversity conservation. Forum Dev. Stud.32, 341–370. 10.1080/08039410.2005.9666319
39
Ickowitz A. Powell B. Salim M. A. Sunderland T. C. H. (2014). Dietary quality and tree cover in Africa. Glob. Environ. Chang.24, 287–294. 10.1016/j.gloenvcha.2013.12.001
40
IFPRI A. (2014). Global Nutrition Report 2014: Actions and Accountability to Accelerate the World's Progress on Nutrition. Washington, DC: IFPRI.
41
Islam K. K. Pervin M. J. Rashid M. H. Mondol M. A. Rahim M. A. (2008). Performance of winter vegetables grown under coconut-lemon based multistrata agroforestry system. Trop. Subtrop. Agroecosyst.8, 165–170.
42
Jahnke H. E. (1982). Livestock Production Systems and Livestock Development in Tropical Africa. Kiel: Kieler Wissenschaftsverlag Vauk.
43
Johnson K. B. Jacob A. Brown M. E. (2013). Forest cover associated with improved child health and nutrition: evidence from the Malawi Demographic and Health Survey and satellite data. Glob. Heal. Sci. Pract.1, 237–248. 10.9745/GHSP-D-13-00055
44
Jones A. D. (2017). Critical review of the emerging research evidence on agricultural biodiversity, diet diversity, and nutritional status in low- and middle-income countries. Nutr. Rev.75, 769–782. 10.1093/nutrit/nux040
45
Jones A. D. Shrinivas A. Bezner-kerr R. (2014). Farm production diversity is associated with greater household dietary diversity in Malawi: findings from nationally representative data. Food Policy46, 1–12. 10.1016/j.foodpol.2014.02.001
46
Kalenga Saka J. D. Msonthi J. D. (1994). Nutritional value of edible fruits of indigenous wild trees in Malawi. For. Ecol. Manage.64, 245–248. 10.1016/0378-1127(94)90298-4
47
Kaschula S. A. Twine W. E. Scholes M. C. (2005). Coppice harvesting of fuelwood species on a South African common: Utilizing scientific and indigenous knowledge in Community Based Natural Resource Management. Hum. Ecol.33, 387–418. 10.1007/s10745-005-4144-7
48
Kennedy G. Ballard T. Dop M. (2010). Guidelines for Measuring Household and Individual Dietary Diversity. Rome: FAO. 10.1017/S136898001000145X
49
Kristjanson P. M. Swallow B. M. Rowlands G. J. Kruska R. L. De Leeuw P. N. (1999). Measuring the costs of African animal trypanosomosis, the potential benefits of control and returns to research. Agric. Syst.59, 79–98. 10.1016/S0308-521X(98)00086-9
50
Leonald L. Rowland D. (2016). Drivers and effects of agrarian change in Kapuas Hulu Regency, West Kalimantan, Indonesia, in Agrarian Change in Tropical Landscapes, eds DeakinE. L.KshatriyaM.SunderlandT. C. H. (Bogor: CIFOR, 91–138.
51
Maxwell S. L. Fuller R. A. Brooks T. M. Watson J. E. M. (2016). Biodiversity: the ravages of guns, nets and bulldozers. Nature536, 143–145. 10.1038/536143a
52
McCune B. Grace J. B. (2002). Analysis of Ecological Communities. Gleneden Beach, OR: MjM Software.
53
Michalski F. Boulhosa R. L. P. Faria A. Peres C. A. (2006). Human-wildlife conflicts in a fragmented Amazonian forest landscape: Determinants of large felid depredation on livestock. Anim. Conserv.9, 179–188. 10.1111/j.1469-1795.2006.00025.x
54
Muthayya S. Rah J. H. Sugimoto J. D. Roos F. F. Kraemer K. Black R. E. (2013). The global hidden hunger indices and maps: an advocacy tool for action. PLoS ONE8:e67860. 10.1371/journal.pone.0067860
55
Nasi R. Taber A. Van Vliet N. (2011). Empty forests, empty stomachs? Bushmeat and livelihoods in the Congo and Amazon Basins. Int. For. Rev.13, 355–368. 10.1505/146554811798293872
56
Ong C. K. Black C. R. Wallace J. S. Khan A. A. H. Lott J. E. Jackson N. A. et al . (2000). Productivity, microclimate and water use in Grevillea robusta-based agroforestry systems on hillslopes in semi-arid Kenya. Agric. Ecosyst. Environ.80, 121–141. 10.1016/S0167-8809(00)00144-4
57
Pfund J. L. Watts J. D. Boissière M. Boucard A. Bullock R. M. Ekadinata A. et al . (2011). Understanding and integrating local perceptions of trees and forests into incentives for sustainable landscape management. Environ. Manage.48, 334–349. 10.1007/s00267-011-9689-1
58
Phalan B. T. (2018). What have we learned from the land sparing-sharing model?Sustain.10, 1–24. 10.3390/su10061760
59
Pimbert M. P. Pretty J. N. (2013). Parks, People and Professionals: Putting “Participation” Into Protected Area Management. Geneva: UNRISD.
60
Powell B. Hall J. Johns T. (2011). Forest cover, use and dietary intake in the East Usambara Mountains, Tanzania. Int. For. Rev.13, 305–317. 10.1505/146554811798293944
61
Powell B. Thilsted S. H. Ickowitz A. Termote C. Sunderland T. C. H. Herforth A. (2015). Improving diets with wild and cultivated biodiversity from across the landscape. Food Secur.7, 535–554. 10.1007/s12571-015-0466-5
62
Rasolofoson R. A. Hanauer M. M. Pappinen A. Fisher B. Ricketts T. H. (2018). Impacts of forests on children's diet in rural areas across 27 developing countries. Sci. Adv.4:eaat2853. 10.1126/sciadv.aat2853
63
Reed J. van Vianen J. Foli S. Clendenning J. Yang K. MacDonald M. et al . (2017). Trees for life: the ecosystem service contribution of trees to food production and livelihoods in the tropics. For. Policy Econ.84, 62–71. 10.1016/j.forpol.2017.01.012
64
Remans R. Fanzo J. Palm C. A. DeClerck F. A. J. (2012). Ecological and human nutrition, in Integrating Ecology and Poverty Reduction: Ecological Dimensions, eds CarterJ. C.DeClerckF.Rumbaitis del RioC. (New York, NY: Springer), 53–75.
65
Robinson J. G. Bennett E. L. (2004). Having your wildlife and eating it too: an analysis of hunting sustainability across tropical ecosystems. Anim. Conserv.7, 397–408. 10.1017/S1367943004001532
66
Rowland D. Ickowitz A. Powell B. Nasi R. Sunderland T. (2017). Forest foods and healthy diets: quantifying the contributions. Environ. Conserv.44, 102–114. 10.1017/S0376892916000151
67
Sanchez P. A. Buresh R. J. Leakey R. R. B. (1997). Trees, soils, and food security. Philos. Trans. R. Soc. Lond. B. Biol. Sci.352, 949–961. 10.1098/rstb.1997.0074
68
Scoones I. Melnyk M. Pretty J. N. (1992). The Hidden Harvest: Wild Foods and Agricultural Systems. London: Internatio.
69
Shiferaw Sida T. Baudron F. Kim H. Giller K. E. (2018). Climate-smart agroforestry: Faidherbia albida trees buffer wheat against climatic extremes in the Central Rift Valley of Ethiopia. Agric. For. Meteorol.248, 339–347. 10.1016/j.agrformet.2017.10.013
70
Sibhatu K. T. Krishna V. V. Qaim M. (2015). Production diversity and dietary diversity in smallholder farm households. Proc. Natl. Acad. Sci. U.S.A.2015:201510982. 10.1073/pnas.1510982112
71
Smith D. A. (2005). Garden game: shifting cultivation, indigenous hunting and wildlife ecology in Western Panama. Hum. Ecol.33, 505–537. 10.1007/s10745-005-5157-Y
72
Steyn N. P. Nel J. H. Nantel G. Kennedy G. Labadarios D. (2006). Food variety and dietary diversity scores in children: are they good indicators of dietary adequacy?Public Health Nutr.9, 644–650. 10.1079/PHN2005912
73
Sunderland T. Abdoulaye R. Ahammad R. Asaha S. Baudron F. Deakin E. et al . (2017). A methodological approach for assessing cross-site landscape change: Understanding socio-ecological systems. For. Policy Econ.84, 83–91. 10.1016/j.forpol.2017.04.013
74
Sylvester O. García Segura A. Davidson-Hunt I. J. (2016). The protection of forest biodiversity can conflict with food access for indigenous people. Conserv. Soc.14, 279–290. 10.4103/0972-4923.191157
75
Termote C. Van Damme P. Djailo B. D. (2011). Eating from the wild: Turumbu, Mbole and Bali traditional knowledge on non-cultivated edible plants, District Tshopo, DRCongo. Genet. Resour. Crop Evol.58, 585–618. 10.1007/s10722-010-9602-4
76
Vinceti B. Eyzaguirre P. Johns T. (2008). The nutritional role of forest plant foods for rural communities, in Human Health and Forests: A Global Overview of Issues, Practice and Policy, ed ColferC. J. P. (London: Routledge), 62–96.
77
Wan M. Colfer C. J. P. Powell B. (2011). Forests, women and health: opportunities and challenges for conservation. Int. For. Rev.13, 369–387. 10.1505/146554811798293854
78
Willett W. Rockström J. Loken B. Springmann M. Lang T. Vermeulen S. et al . (2019). Food in the Anthropocene: the EAT–Lancet Commission on healthy diets from sustainable food systems. Lancet393, 447–492. 10.1016/S0140-6736(18)31788-4
79
Williams T. O. (1998). Multiple uses of common pool resources in semi-arid West Africa: a survey of existing practices and options for sustainable resource management. ODI Nat. Resour. Perspect.38, 1–7.
80
Yirga G. Bauer H. (2010). Livestock depredation of the spotted hyena (Crocuta crocuta) in Southern Tigray, Northern Ethiopia. Int. J. Ecol. Environ. Sci.36, 67–73.
81
Young A. (1989). Agroforestry for Soil Conservation. Wallingford: CAB Intern.
82
Zheng X. Eltahir E. A. B. (1998). The role of vegetation in the dynamics of West African monsoons. J. Clim.11, 2078–2096. 10.1175/1520-0442-11.8.2078
Summary
Keywords
nutrition, hidden hunger, multifunctional landscapes, ecosystem services, structural equation modeling
Citation
Baudron F, Tomscha SA, Powell B, Groot JCJ, Gergel SE and Sunderland T (2019) Testing the Various Pathways Linking Forest Cover to Dietary Diversity in Tropical Landscapes. Front. Sustain. Food Syst. 3:97. doi: 10.3389/fsufs.2019.00097
Received
24 May 2019
Accepted
14 October 2019
Published
08 November 2019
Volume
3 - 2019
Edited by
Christina Marie Kennedy, The Nature Conservancy, United States
Reviewed by
Ranaivo Andriarilala Rasolofoson, University of Vermont, United States; Melanie Kolb, National Autonomous University of Mexico, Mexico
Updates
Copyright
© 2019 Baudron, Tomscha, Powell, Groot, Gergel and Sunderland.
This is an open-access article distributed under the terms of the Creative Commons Attribution License (CC BY). The use, distribution or reproduction in other forums is permitted, provided the original author(s) and the copyright owner(s) are credited and that the original publication in this journal is cited, in accordance with accepted academic practice. No use, distribution or reproduction is permitted which does not comply with these terms.
*Correspondence: Frédéric Baudron f.baudron@cgiar.org
This article was submitted to Land, Livelihoods and Food Security, a section of the journal Frontiers in Sustainable Food Systems
Disclaimer
All claims expressed in this article are solely those of the authors and do not necessarily represent those of their affiliated organizations, or those of the publisher, the editors and the reviewers. Any product that may be evaluated in this article or claim that may be made by its manufacturer is not guaranteed or endorsed by the publisher.