 Kiara Winans
 Elias Marvinney
 Anne Gillman2
 Edward Spang
- 1Industrial Ecology Program, Department of Civil and Environmental Engineering, University of California, Davis, Davis, CA, United States
- 2Department of Human Ecology, University of California, Davis, Davis, CA, United States
- 3Food Loss and Waste Collaborative, Department of Food Science and Technology, University of California, Davis, Davis, CA, United States
The majority of the environmental impacts associated with the agri-food supply chain occur at the production phase. Interests in using life-cycle assessment (LCA) for accounting for agri-food supply chains as well as food losses and waste (FLW) has increased in recent years. Here, for the first time, we estimate production-phase embedded resources and greenhouse gas (GHG) emissions in California specialty crops considering on-farm food losses. We use primary, survey-derived qualitative and quantitative data to consider on-farm food loss prevention and avoided GHG emissions through two different scenarios applied in an illustrative example for processing peach at the production stage. Further, we contribute a mathematical approach for accounting for discrete, unique flows within the net flow of loss in a supply chain, in LCA. Through the detailed LCAs, we identify the hotspots for the four crops as on-farm diesel use, fertilizer application, direct water use, and electricity for irrigation pumping. Impacts from cultivation practices and the additional impacts from on-farm food losses vary significantly by crop. Including the losses in the LCAs resulted in increases in overall resource use and GHG emissions by 4–38% (percent varies depending on the crop type). We used the LCA models and a set of straightforward calculations to evaluate the environmental impacts of a prevention action (a 50% reduction in on-farm food losses) and the secondary use of end-of-life (EOL) biomass from processing peach. The results of this evaluation showed an 11% reduction in GHG emissions compared to the baseline (full harvest). In conclusion, by explicitly including the impacts of on-farm food losses in LCA, we highlight challenges and opportunities to target interventions that simultaneously reduce these losses and the associated environmental impacts in agricultural systems.
Introduction
Life-cycle assessment (LCA) has emerged as a dominant approach to assess the environmental impact of agri-food products (e.g., Corrado et al., 2017; Notarnicola et al., 2017). At the same time, addressing food losses and waste (FLW) is emerging as one of the top priorities in food management for increasing food security and reducing environmental impacts from agricultural production (Food and Agriculture Organization of the United Nations [FAO], 2013). The importance of FLW on LCA has also been emphasized by researchers (Nemecek et al., 2016; Corrado et al., 2017; Notarnicola et al., 2017; Porter et al., 2018). The studies that include FLW in LCA mostly focus on waste or waste treatment; only two of 222 studies reviewed focus on loss prevention (Laurent et al., 2014). The broader heuristic perspective and a hierarchy preferred management of FLW prioritize prevention (most preferred) while seeking to limit incineration/disposal (least preferred) (e.g., European Union, 2017). The studies that do consider prevention often focus on interventions and impacts at one stage of the food value chain and assume other phases of the supply chain remain the same (Creus et al., 2018).
Different approaches for evaluating FLW in LCA have been proposed, and many analyses utilize consequential LCA, which accounts for the environmental impacts between a baseline scenario and an alternative course of action(s) (e.g., Bernstad and Cánovas, 2015). These approaches recognize that the life-cycle inventories have embedded in them wastes generated along the supply chain, but there is a need to have more explicit, transparent FLW estimations in LCA so FLW interventions can be adequately evaluated (Notarnicola et al., 2017). In turn, this transition in practice needs to be informed by the adoption of more universal frameworks for assessing FLW in LCA consistently along the supply chain (Bernstad et al., 2016; Creus et al., 2018). Creus et al. (2018) present a method based on the (Food and Agriculture Organization of the United Nations [FAO], 2013) calculation that takes into account upstream as well as down-stream stages. The study proposes a standardized calculation that can be applied to any food supply chain to account for the potential impacts of prevention as well as the comparison between prevention actions. In our study, we propose a further modification to the Creus et al. (2018) equation so the net flow (estimated in mass or percentage loss) from the system (as defined by Creus et al., 2018) can be considered on a more granular level for purposes of evaluating multiple flows or products within the net flow of losses at each stage of the supply chain.
Specifically, in this study, we assess biological materials flows from agricultural fields. These losses could be considered as a single mass loss or percentage loss from the system (i.e., as a net flow). However, these biological material losses are inherently diverse in terms of characteristics (composition and constituents) and potential use(s). These material flows are typically composed of both edible and inedible materials. Also, the losses occur at variable times within the season, as well as the lifetime of the production system. For example, on-farm food (fruit) losses in a perennial system like processing peach occur within the year (starting at the point of reproductive maturity) and biomass losses arise both within the year (e.g., due to pruning) and at the end of the orchard life (e.g., through orchard removal).
We focus our work on the production phase. Approximately 71% of the total global carbon impacts and 79% of the overall water impacts that are associated with the food supply chain occur at the point of production (on the farm) as a result of land-use change, soil carbon emissions, and the direct and indirect consumption of fossil fuels to power on-farm operations (Reutter et al., 2017). These global carbon impact and overall water impact estimates do not account for the embedded resources and emissions in on-farm food losses, so they likely underestimate both the environmental impacts and, importantly, the benefits of interventions (Bernstad and Cánovas, 2015).
The significant knowledge gap of annual food losses at the point of production for pre-harvest and harvest phases (Gustafsson et al., 2013; Spang et al., 2019) compels us to fill this information gap as the first step toward improved resource investments in agri-food systems. For the specialty crops included in this study, on-farm loss data collected through semi-structured interviews provide baseline information for the research. It is worth noting available FLW data are generally limited, and it can be challenging to track because of regulatory and reporting requirements, the terminology used to define and categorize FLW, and a range of other reasons (Xue et al., 2017; Porter et al., 2018).
Although we focus on the production phase, food losses occur at all stages of the food supply chain, including pre-harvest and harvest phases, as well as processing, transport, storage, distribution, and disposal. Losses at each of these phases represent not only the physical organic material, but also the embedded water, energy, and material inputs (e.g., fertilizer) and, in some cases, the packaging required to produce, and deliver this food to consumers (Reich and Foley, 2014). For example, Spang and Stevens (2018) explore the water footprint of potato losses at the cultivation stage of the supply chain for seven of the top 10 potato-producing states, based on national level United States Department of Agriculture (USDA) data sets. More detailed regional estimates of on-farm food losses are limited, except for Neff et al. (2018) in Vermont, Johnson et al. (2018) in North Carolina, and Baker et al. (2019) in California. On-farm food loss in northern and central California was further explored with greater emphasis on evaluating the structural drivers leading to losses by Gillman et al. (2019). While providing some useful baseline data for on-farm food losses, none of these studies align their assessment of on-farm food losses for specific foodstuffs with agricultural system LCA. In the following, we provide the first estimation of production-phase embedded energy and materials and greenhouse gas (GHG) emissions in specialty crops in California lost from the supply chain, using primary qualitative and quantitative data. The crops include three annuals (fresh tomato, processing tomato, romaine heads) and a perennial (processing peach). Also, we propose a mathematical approach to account for food loss waste in LCA (described in section Evaluation of On-Farm Food Losses—Calculations and Scenarios).
The study explores the hypothesis that the LCA-based environmental impacts for specialty crops in California vary considerably due to differences in inputs to the cultivation practices as well as the quantity of on-farm food losses. The annual and the perennial crops compared within the study region provide insights on the differences between these crops in terms of impacts from cultivation practices and the additional impacts of on-farm food losses in the region. Also, we evaluate two scenarios for the specialty crops in California using a mathematical approach based on Creus et al. (2018). Scenario 1 involves on-farm food loss prevention action (a 50% reduction of on-farm losses) applied in an illustrative example for processing peach at the production stage. The second scenario accounts for potentially avoided GHG emissions from end-of-life (EOL) processing peach biomass (a by-product of the system) used for combustion (for energy generation) and incineration (or burning).
Although combustion and incineration (or disposal) are the least preferred options in the FLW hierarchies (e.g., European Union, 2017), it is one of the most likely scenarios for the EOL material for processing peach in California (see section Scenarios 1 and 2 Descriptions), so avoided GHG emissions due to these actions warrant further exploration along with the prevention actions. Also, the on-farm losses from both annuals and perennial systems have a range of potential destinations and secondary uses. We discuss but do not numerically evaluate these options fully due to a lack of data in this area.
Defining Food Loss and Waste
One challenge is the terms “food loss” and “food waste” are inconsistently defined, varying based on multiple factors including cultural practices and food policy and regulations (Evans, 2012). The FAO differentiates food loss from food waste by supply chain segment, with food loss occurring anywhere from the farm through distribution and supply-side retail, and food waste occurring at customer-facing retail and with the consumer (in either home or at foodservice locations) (Gustafsson et al., 2013).
Meanwhile, the USDA applies the term “food loss” to all post-harvest, edible food material that doesn't make it to a consumer, with the subset of “food waste” to signify losses that occur as a result of “human action or inaction” (Buzby and Hyman, 2012). For this paper, we follow the FAO definition and refer to cultivated products left in the field as “losses” rather than as waste. Because these losses occur at the cultivation phase of the supply chain, we see these losses as on-farm food losses. These on-farm food losses are distinguished from post-harvest losses, which may be reported, for example, at a sorting station, in cold storage, or transport. Parfitt et al. (2010), Hebrok and Boks (2017), and Suthar et al. (2019) provide more information on post-harvest losses.
Materials and Methods
This research was conducted in the context of a larger project entitled, “Maximizing Farm Resources and Edible Food Rescue” co-funded by the Walmart Foundation and the Foundation for Food and Agricultural Research (FFAR). The goal of the project was to conduct an assessment of on-farm losses for a range of key crops across the United States. The crops evaluated were selected in consultation with our project partners (including the World Wildlife Fund, the Global Cold Chain Alliance, and North Carolina State University) to estimate losses in large-scale cropping systems with different cultivation types (annual and perennial crops) and diverse geography of production. In California, the selected crops represent some of the primary specialty fruit and vegetable crops produced in the state, including fresh and processing tomato, fresh and processing peach, and leafy greens. Complementary studies were conducted in New Jersey (fresh peaches), Florida (processing and fresh tomatoes), Arizona (leafy greens), and Idaho (potatoes). While all of these studies shared the goal of quantifying and understanding on-farm food losses, the California crop study was expanded to include LCAs for the selected crops to directly explore the effect of on-farm food loss on the LCA results and to accurately estimate the environmental impacts of interventions to reduce on-farm food loss and to manage agricultural residues on the farm (in the case of processing peaches).
Goal and Scope Definition
The goal of this LCA study is to characterize the selected California-based cropping systems and the environmental impacts associated with these crops, accounting for on-farm food losses and their management. Based on the evaluation of peer-reviewed literature conducted for purposes of developing this work, we selected the functional unit of 1 kg of cultivated product for ease of comparison with related studies. All resources used and impacts incurred are calculated based on the production of 1 kg of cultivated product. Each production system is accounted for on an annual basis. The perennial system accounts for an 18-years life span but reports the results on a mean annual basis. The packaging is not included in the functional unit. Within specific regions, there is variability in soil conditions and pests (Heller and Keoleian, 2003), weather patterns, and market pressures that can result in on-farm food losses. We do not directly account for these factors in the LCAs as it is beyond the scope of this work.
The system boundary is from the cradle-to-farm gate, including transportation of materials from the manufacturer to farm for all inputs as well as in-field soil emissions from nitrogen (N)-based fertilizers and direct water use (Figure 1). The geographic boundary is the growing region within California for each specialty crop.
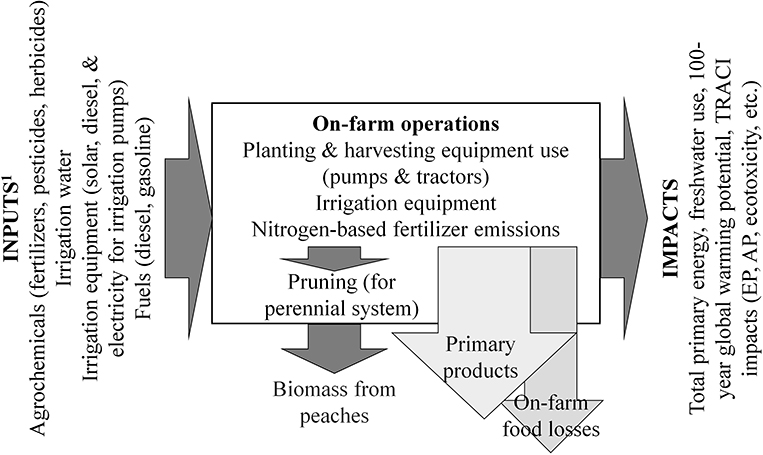
Figure 1. Simplified system boundary. 1Inputs are accounted for on an annual basis for row crops (processing tomato, fresh tomato, and romaine heads). For the perennial system (processing peach), inputs are accounted for per the 18-years productive lifespan of the orchard and estimated on a mean annual basis. Pruning for the perennial system occurs years 2–18. The Tool for the Reduction and Assessment of Chemical and Other Environmental Impacts (TRACI) baseline characterization factors include eutrophication potential (EP), acidification potential (AP), ecotoxicity, etc.
The total on-farm food losses and life-cycle resources (materials, water, and energy) embedded in these losses are accounted for at the farm gate. Some of these on-farm losses (food, biomass, crop residuals) have secondary uses, e.g., as compost, but may not have established market values within the respective growing regions. Within the LCA methodological framework, if these losses have an established market value, they are accounted for as a co-product. In this study, the on-farm losses are assumed not to have a market value and are considered for as a by-product of the system.
Data Collection
The primary data used to characterize the foreground systems is based on consensus group data collected through the University of California's cost and return studies (e.g., Miyao et al., 2017). These studies define inputs for California processing tomatoes, fresh tomato, romaine heads, and processing peaches for different production years (e.g., 2007, 2011, 2014, & 2017) and regions (Sacramento Valley & Northern Delta, San Joaquin Valley). Also, survey-derived data for tomato (processing and fresh) and in-person communications for processing peach for specific data (e.g., percent use surface water vs. groundwater use) were used, and extension professionals were consulted for validation and clarification of the data before using this primary data in the LCA models.
Cultivation System Inputs and Transportation
Agrochemical inputs to the cultivation systems are based on the data from the cost and return studies and the California pesticide use reports (PUR) (California Department of Pesticide Regulation (CDPR), 2018) unless specified otherwise. For all relevant input materials, the transport distances are estimated using georeferenced Google map road kilometer data (see Supplementary Material S1 for more details). The on-farm diesel used in tractors is estimated based on the on-farm equipment use hours (i.e., based on primary data collected for this study) and the manufacturer-based tractor engine testing data (to estimate the fuel consumption in total gallons per hour). This primary data is linked to background data (i.e., secondary LCI data) to account for the emissions for the estimated total on-farm fuel use. The fuel consumption does not account for the load (e.g., heavy load during primary tillage).
Irrigation Water Sources and Pumping Requirements
Surface water and groundwater for irrigation applications must be pumped to lift the water (from groundwater depth) and transport the water for field application, with attendant energy demand subject to significant geographic variability. Irrigation pumping and in-field system pressurization may use diesel-, electric-, or solar-generated pumps. The processing tomato, fresh tomato, and romaine head LCAs use 50:50 breakdown between surface and groundwater use and 40:60 between electric and diesel pumps for irrigation (based on data reported from field staff, n.d.). The processing peach LCA assumes the use of diesel, electric, or solar pumps with a breakdown of 45, 45, and 10%, respectively, and a breakdown of 32% surface water to 68% groundwater use, based on results from the Statewide Water and Agricultural Production Model (Howitt et al., 2010). Accounting for the geospatial relationships of surface water delivery infrastructure and groundwater basins to peach acreage as per Kendall et al. (2015), an area- and source-weighted energy requirement of 299 MJ ha−1 (121 MJ ac−1) applied irrigation water is assigned to peach orchards, and 319 MJ ha−1 (129 MJ ac−1) for romaine head, and 516 MJ ha−1 (209 MJ ac−1) for tomato (fresh and processing).
Cultivation System Outputs
Crop yield data comes from the cost and return studies and the (United States Department of Agricultural/National Agricultural Statistical Service (USDA/NASS), 2017). The IPCC 2006 guidelines are used to estimate direct and indirect emissions associated with N fertilizer application rates using the emission factor for kg nitrous oxide (N2O) per kg N (1.25%), and the value 0.01 kg N2O-N per kg ammonium (NH4-N) based on work by De Klein et al. (2006).
On-Farm Food Losses
The data for the on-farm food losses for processing tomato, fresh tomato, romaine heads, and processing peach were collected through semi-structured interviews with multiple growers conducted by Gillman et al. (2019). Annual and perennial on-farm food losses are reported on an annual percent (%) on-farm food loss basis. The grower-reported values, for annuals and the perennial production systems assessed in this study, indicate a high level of variability in losses from year to year. More accurate numbers can only be obtained through (a) systematic reporting by growers, or; (b) multi-year in-field loss measurements. We did not do a systematic evaluation of the quality or quantity of the grower reported on-farm food losses due to time and other resource constraints.
Secondary Data
Life cycle inventories from the GaBi databases (service pack 32) (Thinkstep, 2017) and Ecoinvent databases (Wernet et al., 2016) are used to characterize the background processes included in the LCA models. The LCI data quantify the total primary energy and material inputs as well as emissions for a variety of materials including fuels and agrochemicals (fertilizers, pesticides, and soil amendments). Inventory data (primary and secondary data) used in the assessments are presented in the Supplementary Material S2.
Life Cycle Assessment Model
Process-based life cycle models are used to evaluate the environmental impacts of processing tomato, fresh tomato, romaine heads, and processing peach production in California from raw material extraction through cultivation. The process-based LCA model was developed in Microsoft Excel with VisualBasic Macros to support some data management and calculation processes. Software and modeling tools, including geographic information systems (ArcGIS software), are used for distribution analysis and other spatial models. Where applicable, the LCA methodology put forth by the International Organization for Standardization (ISO) is used to guide life cycle model development and calculations (Organización Internacional de Normalización (ISO), 2006a,b).
Model assumptions include on-farm food loss considered on an annual basis for both the annuals (processing tomato, fresh tomato, and romaine heads) and the perennial (processing peach). Also, the productive lifespan of a California peach orchard is 15–20 years (Hasey et al., 2018a,b). This study assumes 18 years of productive life, followed by an orchard removal process (in the EOL phase). The prunings from trees are removed. These assumptions are based on consensus group data collected through the University of California's cost and return studies.
The results are presented based on the assumption that 100% of the mature crop is harvested (full harvest or HarvestTotal). Using this assumption does not imply that 100% harvest of the on-farm crop is achievable, or even desirable (from the perspective of economic efficiency), but instead serves to provide illustrative boundaries to establish the quantity of material potentially prevented from loss and available for increased harvest or redirection to secondary uses.
The first scenario evaluated in this study assumes a 50% reduction in on-farm food loss at the farm gate (as described in section Evaluation of On-Farm Food Losses—Calculations and Scenarios). In the second scenario included in this study, the on-farm losses from processing peach are redirected for combustion as an energy feedstock (47%), incineration (33%), and spread in-field (20%). In the LCA, system expansion and the displacement of fossil fuel consumption are used to assess impacts due to the use of the EOL peach orchard by-product recovery. This by-product is assumed to offset fossil fuel consumption in the California electricity grid system. In other words, the peach processing system is “credited” with avoidance of fossil fuel use and production of renewable energy. The biogenic carbon dioxide (CO2) emissions from biomass combustion and decomposition are considered carbon neutral. Pruning and removal and other aspects of biomass management-related material flow, such as tree stakes, ties, and paint, are also assessed in the processing peach LCA.
Life Cycle Impact Assessment
The life cycle impact assessment (LCIA) translates the LCI into indicators of environmental impact. Using the LCIA results, we evaluate the hypothesis that the LCA-based environmental impacts for specialty crops in California will vary considerably due to differences in inputs to the cultivation practices. Based on the evaluation of peer-reviewed literature conducted before developing the LCAs, we selected the following most commonly used impact categories in the studies we reviewed. The impact categories include the 100-years global warming potential (GWP100) without climate-carbon feedbacks reported in kg CO2 equivalents (kg CO2e) (Myhre et al., 2013). Also, the Tool for the Reduction and Assessment of Chemical and Other Environmental Impacts (TRACI) baseline characterization factors are used for the following impact categories: ozone creation potential (kg O3 eq), ozone depletion (kg CFC−11 eq), human toxicity (cancerous and non-cancerous) (CTUcancer), human health particulate air (PM2.5eq), eutrophication (kg N eq), ecotoxicity (CTUeco), and acidification (kg SO2 eq) (Bare, 2012). The resource flows reported in this study include total primary energy use from renewable and non-renewable sources (reported in MJ) and total freshwater use. The total freshwater use includes rainwater use, surface water (lakes and rivers), and groundwater use (reported in kg of water). Total water use is modeled to include both upstream water use flows as well as the direct water use (e.g., for irrigation water).
Evaluation of On-Farm Food Losses—Calculations and Scenarios
We use a set of simple calculation steps based on Creus et al. (2018) in combination with an additional step we added for this study to simulate two proposed scenarios. See Equations 1–3 and Table 1 describes the cases (e.g., Scenario 1) and the crops assessed in each.
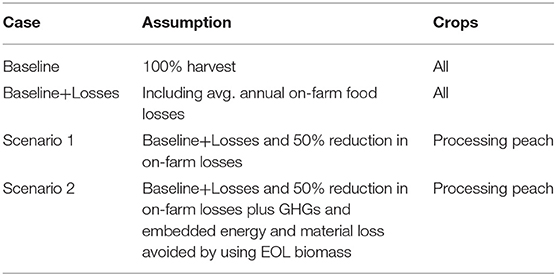
Table 1. Case, assumption, and crops assessed in each case.
Scenarios 1 and 2 Descriptions
For scenarios 1 and 2, we focus on one cropping system, processing peach. Scenario 1 considers the prevention of on-farm food losses through a hypothetical 50% reduction in processing peach food (fruit) losses at the farm gate. We assume that this reduction occurs without the input of additional resources or effort for cultivation or harvesting of the material. Scenario 2 accounts for EOL processing peach biomass treatment focusing on incineration (burning) and combustion (for energy generation).
The target of 50% prevention of on-farm food loss accounted for in Scenario 1 is designed to align with the stated national goal of the United States to reduce food loss and waste by 50% by 2030 (US EPA, 2015). In this scenario, we use the model to evaluate loss prevention, which, in turn, leads to the use of more of the food produced on-farm from the same amount of input and then calculates the changes in the resultant GHG emissions and embedded water and energy resources. This approach addresses on-farm resource efficiency, which is apart from traditional efforts to mainly reduce inputs, e.g., to reduce water use through drip irrigation.
Scenario 2 accounts for avoided GHG emissions and embedded material and energy resource loss from the use of processing peach EOL estimated biomass percentage of total harvested material used for the specific destinations (e.g., energy generation). The LCA for processing peach includes this by-product utilization pathway via system expansion using a displacement credit. We calculate the Scenario 2 results in terms of both the prevention action and the avoided GHG emissions as well as embedded material and energy resource loss for EOL processing peach by-product use. Therefore, the results for Scenario 2 show the cumulative effect of the prevention scenario (Scenario 1) plus the avoided GHG emissions (Scenario 2).
The second scenario is selected because, in the context of California's Central Valley growing region, there is a high proportion of biomass energy plants to the orchard cultivation area. There are 34 plants in operation currently, which is a significant reduction from the 66 that were estimated to be in process at the peak of this industry (California Biomass Energy Alliance (CAEB), 2018). This shift in the total number of bioenergy plants is in part due to the heavy restrictions on biomass burning for air quality control in California's Central Valley growing region. Still, the remaining biomass plants create a significant demand for orchard biomass by-products from California's major orchard cropping regions.
Quantification of Full Harvest Including On-Farm Losses
The environmental impact (EI) is estimated using nomenclature adapted from Creus et al. (2018), Equation 1, and the averaged % on-farm food loss values reported in Table 2.
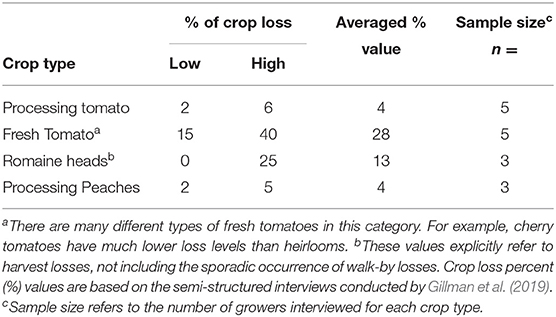
Table 2. Crop losses (low, high, and averaged) in percentages (%) per respective crop.
In this case, the EIi refers to the environmental impact from stage i, the production (or harvest) phase, and includes on-farm food losses. The net flow (NF) of the materials is equal to full harvest (or HarvestTotal) at the production stage. The impact factor (IFi) for stage i for a specific impact category (GWP100) or reported resource flow (e.g., total primary energy) is accounted for at the production stage (i).
Quantification of the Prevention Action (Scenario 1) and Avoided Emissions (Scenario 2)
In Scenario 1, we evaluate the EI associated with a prevention action. In this scenario, we evaluate the hypothetical HarvestTotal and on-farm food loss reduction of 50%. The scenario is applied to the case of processing peach, implying the decrease in on-farm food loss from 4% (annual avg. on-farm food loss) to 2% (50% of the yearly avg. on-farm food loss). So, the calculation is the same as in Equation 1; the only difference is the on-farm loss percentage.
In Equations 2, 3, we add a calculation to the step-wise calculation presented by Creus et al. (2018)—for evaluating discrete, multiple flows within the NF, referred to here as fractions (f). It is worth noting that this calculation step can be added to each stage of the supply chain in the systematic, simplified calculations as well as the EOL calculations presented in Equations 7 and 8 of Creus et al. (2018). In the processing peach example, f refers to percentages of the processing peach EOL biomass with different destinations (e.g., 47% of the biomass is used in bioenergy generation).
In Scenario 2, the avoided emissions include accounting for the NF at stage i of material j to a defined destination for secondary use(s) (1, 2, 3,…) and additional impact from the action(s), IFi, j. Value from 1 to n, 1 being the first destination for material j, and N being the last one. When i = 0, it refers to the flow entering stage 1 (e.g., the pre-harvest stage). In Equation 3, the various materials flows derived from the same NF are accounted for in fractions (f), where each fraction is a defined flow for a designated destination or secondary use (1, 2, 3,…), and j fraction 1 is denoted as j1.
In this example, the j1 is EOL processing peach biomass (by-product) to bioenergy generation (47%), j2 is to incineration (33%), and j3 is spread in-field (20%). In this case, a mass-based allocation is applied to fractionate flows to defined destinations; however, if these products have established market values, then another allocation approach could be used, such as economic allocation.
Results
The overall LCIA results are presented per kg cultivated product followed by the per crop contribution analysis and comparison with other studies. The main impact category evaluated for the comparison with previous peer-reviewed literature includes GWP100. Total primary energy and water use are also included. TRACI impacts are not as well-reported in the peer-reviewed literature for the crops assessed in this study. Some of the environmental impacts associated with the on-farm food losses are presented in sections Environmental Impacts Associated With the On-Farm Food Losses and Scenario Analysis: Environmental Impacts of the On-Farm Loss Prevention and EOL 398 Biomass Utilization for Processing Peaches.
Life Cycle Impact Assessment (LCIA) Results
Across the supply chain, the top contributors to all impacts for the processing tomato, fresh tomato, romaine heads, and processing peach cultivation systems include diesel use for tractors and irrigation pumps, in-field emissions from N-based fertilizers, direct water use, and electricity generated for irrigation pumps.
Fresh tomatoes have higher impacts per unit product compared to processing tomato in part due to the per-unit input of fertilizer, fuel, and water compared to processing tomato (Figures 2, 3, absolute values in Table 3). By comparison, the GWP100 impacts and TRACI impacts associated with romaine head have higher impacts compared to the other two annual crops assessed in this study, mainly due to heavier tractor fuel use (Figures 2, 3, Table 3). The LCIA results show that the processing peach perennial system impacts are higher than the annual crops, in particular for total primary energy, ecotoxicity, eutrophication, human toxicity (cancer), and ozone depletion (Figure 3, Table 3).
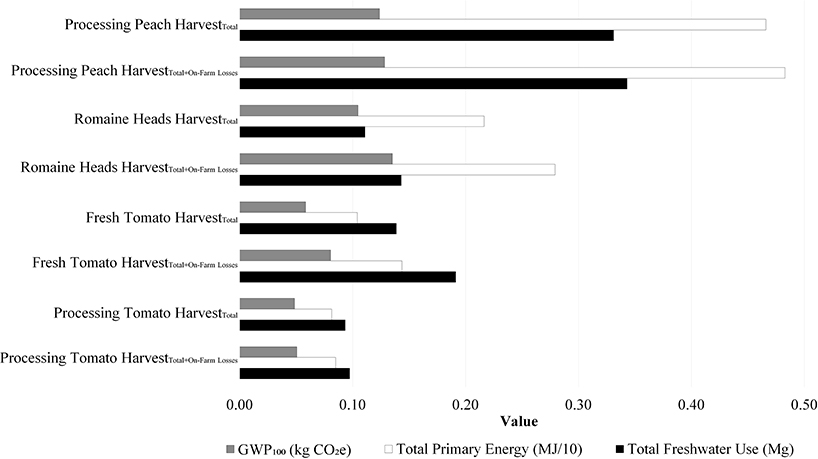
Figure 2. Life cycle impact assessment (LCIA) results for GWP100 (kg CO2e), freshwater use (Mg), and Total Primary Energy (MJ/10) for 1 kg harvested crop for full harvest (Harvesttotal) and including on-farm food losses (Harvesttotal+On−Farm Losses). The absolute values for these impacts are provided in Table 3.
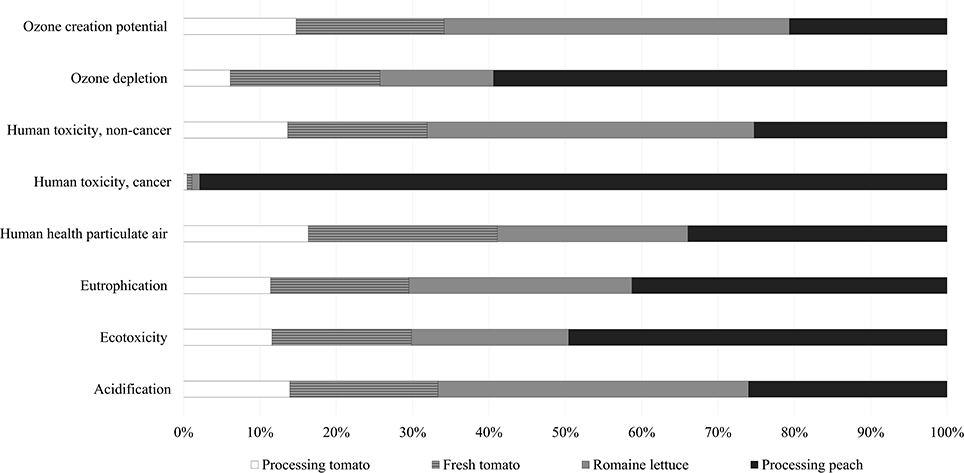
Figure 3. Life cycle impact assessment (LCIA) results for % percent TRACI impacts per 1 kg harvested crop. The absolute values for these impacts are provided in Table 3. In the human toxicity, cancer impact category, the processing peach total impacts (6.27E-10 CTUcancer) are relative to other agri-food products assessed in this study (e.g., 6.51E-12 CTUcancer for romaine heads).
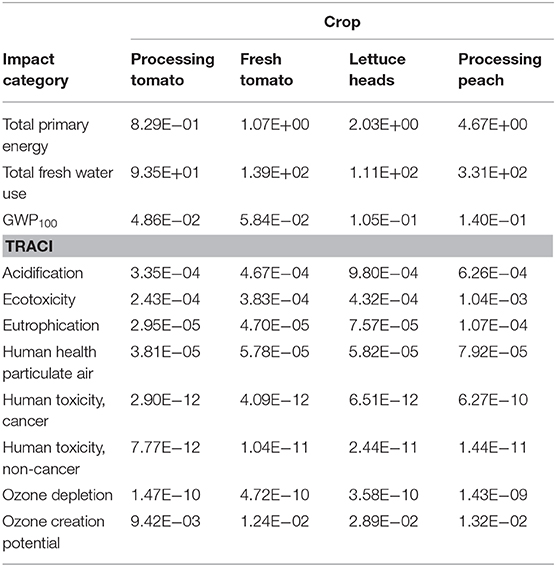
Table 3. LCIA results—absolute values.
Contribution Analysis
Diesel use is the main contributor to total primary energy, and GWP100, and all TRACI impact categories except ozone depletion potential and human health particulates (see contribution analysis, Supplementary Material S3). The extraction of primary energy sources (crude oil and hard coal) for diesel production contributes to the emissions to air (e.g., radon 222). The combustion of diesel (on-farm) emits CO2, NOx, particulates, etc. which contribute to the GWP100 impacts as well as environmental and human health toxicity impacts. Gypsum and fertilizer production and in-field emissions (from N-based fertilizer application) are the top contributors to the TRACI impact ozone depletion potential and human health particulates.
Direct water use is the primary contributor to total water use (Supplementary Material S3). Water use in electricity is the second-highest contribution to overall water use (8–19%), mainly due to the hydro, thermal, and solar thermal processes that make up ~14% of the total California energy mix (California Energy Commission, 2017; Peck and Smith, 2017).
The second highest contributors to impacts include soil N2O emissions from N-based fertilizers. In general, the soil N2O emissions are lower in processing peach compared to the annual crops assessed; soil N2O emission contributes to 17% of the total GWP100 impacts in romaine head production and 2.7% of the total processing peach production. In processing peach, pesticides are also a significant contributor to ecotoxicity (14% of the overall ecotoxicity impacts), acidification (10%), eutrophication (50%), and ozone depletion (44%). Material transport contributes to an estimated 25% of the total non-cancer human toxicity impacts and ozone depletion potential impacts (49%). Finally, irrigation system component production contributes to 3% of the total GWP100 in processing peach production.
Environmental Impacts Associated With the On-Farm Food Losses
We observed the effects of including on-farm food losses on LCA for the GWP100 impact and freshwater use and total primary energy use. The additional results of on-farm food losses vary significantly by crop, depending on the estimated average percent material losses. Including on-farm food losses increased the total GWP100 impacts and freshwater and primary energy use for processing peach and processing tomato by 4% (Figure 2). Whereas, the overall impacts associated with romaine heads production increased by 29% and by 38% for fresh tomato (Figure 2).
Scenario Analysis: Environmental Impacts of the On-Farm Loss Prevention and EOL Biomass Utilization for Processing Peaches
Scenario 1 includes a 50% reduction in the processing peach on-farm food losses, resulting in an overall decrease in total GHG emissions, primary energy use, and water use by 2% (Figure 4). When combining both the prevention action and the secondary use of by-products from processing peach as a bioenergy feedstock (Scenario 2), the GWP100 emissions reduced by up to 11% compared to the full harvest scenario (Figure 4). Total primary energy use reduced by 10% compared to the full harvest scenario, and the aggregate freshwater use in the avoided emissions remained unchanged when compared to the prevention action (Figure 4).
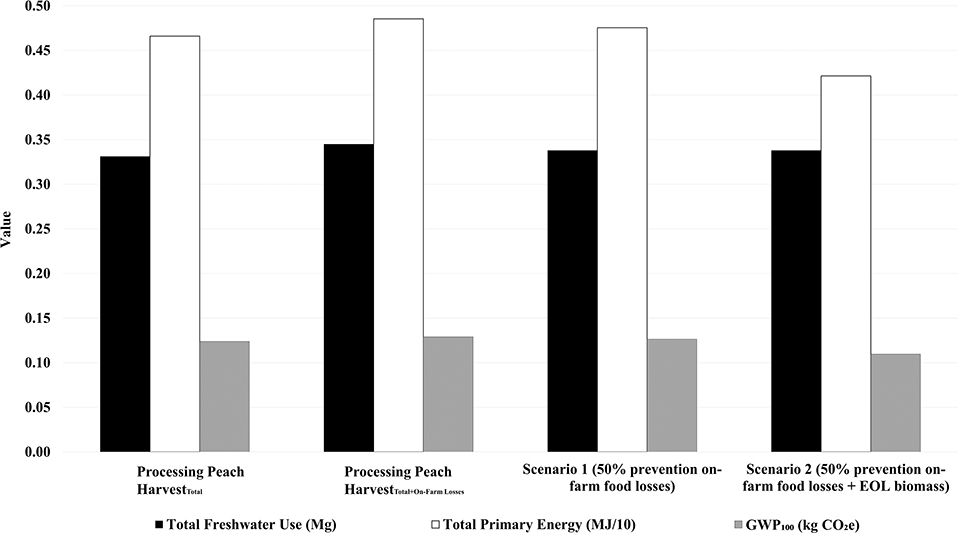
Figure 4. Impacts associated with LCIA results comparing full harvest (or Harvesttotal) and including on-farm food losses (Harvesttotal+On−FarmLosses) with the prevention actions and avoided greenhouse gas emissions due to the use of secondary products for processing peach.
Discussion
The LCA of tomato (fresh and processing), processing peach, and leafy green cultivation in California show a wide variation in water, energy, and material inputs and the associated emissions and environmental impacts by crop type. We also see a high level of variability in on-farm food losses between the selected crops in this study. Integrating these two components, it is clear that the environmental footprint of on-farm food losses varies by crop type. While this paper adds to the understanding of a few crop types in California, additional studies are needed to gain a baseline assessment of environmental impact and relative loss percentages for a greater variety of agricultural products and with broader geographical diversity to capture inherent complexities within the agricultural systems, such as varying crop-soil relationships. These relationships will be even more critical to enabling consideration of prevention actions and opportunities to valorize on-farm losses, e.g., as a soil amendment (e.g., Cherubin et al., 2018). The implications of these secondary uses of losses on the farm also need to account for current agricultural practices and inputs to agricultural production systems like agrochemicals.
The environmental impact associated with agrochemicals (fertilizer and pesticide) application is limited in terms of in-field and downstream impacts. Ultimately, the upstream impacts need to be balanced with the downstream effects that occur after the field application of the product (Winans et al., 2019), which is beyond the scope of this study. The emissions and environmental and human and animal health impacts associated with fertilizers and pesticides are not only an effect of the agrochemical type and related production practices but also, e.g., the soils to which the agrochemicals are applied (Silva et al., 2019; Winans et al., 2019). In some cases, using more fertilizer can lead to harmful effects on the environment and human health. Thus, the advancement of loss reductions and recovery options that contribute to avoided emissions requires LCA practitioners to increase transparency and comparability of agri-food LCA studies. Clearly stating the agrochemical related assumptions and principles, e.g., for substitution, as well as soil conditions, are required when defining the scope and system boundary (Hanserud et al., 2018).
Comparison With Other Studies
While our assessment focused on four crops in California, the results were broadly comparable to existing studies focusing on the same crops grown in regions with a similar climate. The following sections (Processing Tomato and Fresh Tomato—Processing Peach) compare our results to existing studies. These comparisons include the evaluation of the part of our LCIA results that do not include on-farm food losses compared to peer-reviewed literature studies that conducted LCAs for the same crops and do not account for or include on-farm food losses in their LCIA results.
Processing Tomato and Fresh Tomato
Like the current study, previous studies of processing tomato cultivation show the top contributors to the LCA impacts include fossil fuels (diesel use), electricity use for irrigation, and fertilizer production (Del Borghi et al., 2014; De Marco et al., 2017; Ntinas et al., 2017). An LCA of fresh tomato production also indicates the top contributors to the LCA impacts as fossil fuels (diesel use), electricity use for irrigation, and fertilizer production (Martínez-Blanco et al., 2011). In general, the difference in the results shown in the current study compared to peer-reviewed literature for tomato (processing and fresh) are attributed to differences in diesel use in on-farm equipment and electricity for irrigation. For example, Martínez-Blanco et al. (2011) report nearly double the amount of electricity used for irrigation (0.56 MJ per kg tomato) compared to the current study (0.31 MJ per kg fresh tomato, Table 3), contributing to higher GWP100 impacts (0.14 kg CO2e per kg tomato) than in the current study 0.06 kg CO2e per kg fresh tomato (Table 3).
Romaine Heads
An LCA of lettuce (open-field) production in Italy (Bartzas et al., 2015) shows GWP100 values amounted to 0.24 kg CO2e per kg cultivated lettuce, more than twice that found in this study (0.10 kg CO2e per kg cultivated romaine heads, Table 3). The Bartzas et al. (2015) study of lettuce includes emissions associated with compost collection, treatment, transport, and application, and “compost,” which accounted for as much as 74% of the total reported GWP impacts. We assume this is the primary source of difference between these two results. The current study does not include compost given the primary data source reports no use of this material on-farm for California romaine head production.
Fertilizer production contributed to 20% of total GWP100 impacts in this analysis (Supplementary Material S3), similar to the results of Bartzas et al. (2015) (21% of the overall GWP100 impacts). This result is expected due to similar input quantities of N, P, and K in nutrient management for the two systems.
Processing Peach
An LCA of a 15-years peach cultivation system in the Catalonia region of Spain indicates that 0.16 kg CO2e are emitted per kg fresh yield, and 1.62 MJ energy and 201 kg of freshwater are consumed per kg fresh yield (Vinyes et al., 2015, 2017). These results are similar to those observed in the current study: 0.16 kg CO2e, 4.73 MJ energy, and 331 kg freshwater (Table 3). Ingrao et al. (2015), in a case study of a Sicilian farm, found that production of red peach in a 15-years orchard system resulted in 7,380 kg CO2e and 273,000 MJ of energy use per hectare of orchard, somewhat higher than the mean annual impacts of 5,917 kg CO2e and 144,270 MJ of energy per hectare for California peach production (Table 3). In a study of the peach industry from the south of France, which was more methodologically similar to our analysis of California processing peaches, i.e., the authors also relied on expert opinion and literature rather than individual case studies, Basset-Mens et al. (2016) found that peach production over a 15-years orchard lifespan resulted in 0.17 kg CO2e and 2.54 MJ non-renewable energy use per kg yield.
Catalonian peach production used about 30% less water, which may be attributable to the use of trees grown on their roots or field-grafted onto the planted rootstock, which may produce more robust root systems and greater water-use efficiency (Hammerschlag and Scorza, 1991). An LCA of Iranian peach orchards found similar results to the current study, resulting in 0.10 kg CO2e per kg fresh peach (Nikkhah et al., 2017), although the authors did not indicate whether their study accounted for orchard removal or nursery production. In the Nikkhah et al. (2017) study diesel fuel use was found to be the most significant contributor to GWP100 impacts, but in general Iranian orchard systems tend to rely less on mechanization and more on hand labor (Talaie and Panahi, 2002; Nikkhah et al., 2017) than California orchards—a possible explanation for the lower GWP100 impacts found in their study compared to our results.
LCA Including On-Farm Food Losses, Prevention Actions, and Avoided GWP100 Emissions
In this study, the LCIA results show how the cultivation systems differ between crops given the attributes of each system. We observe that the environmental impacts (or footprint) associated with each food is unique. The impacts associated with each food product become more pronounced when we account for the on-farm food losses and their embedded materials, energy, and water. For example, for freshwater use, most of the water use is consumed as direct water use for irrigation. If on-farm food losses are included in the estimated water consumed, the amount of water consumed increases by the same proportion of the observed losses, i.e., ~30% for fresh tomato and ~4% for processing tomato.
The prevention action (Scenario 1) of a 50% reduction in on-farm food loss from processing peach directly halved the GHG emissions and embedded energy and materials associated with the on-farm losses (but only had a 2% reduction in GHG emissions per unit product at the farm gate). Combining the prevention intervention with the EOL biomass capture for bioenergy (Scenario 2) decreased the overall GHG emissions by 11% in the processing peach system. We see little to no change in the water use between Scenarios 1 and 2 since embedded water is mostly reduced by the prevention action shared by both scenarios with minimal contribution from the EOL biomass action.
The results underscore how this approach advances capabilities to capture the systemic impacts of both separate and combined strategies for valorizing organic waste flows on the farm. We can evaluate multiple flows from the agricultural production system to assess the interventions of on-farm loss prevention and management of agricultural residues, both separately and as a combined strategy. Because we add a step in the calculations for evaluating unique, discrete flows within mass net flow losses (Equations 2, 3), we can quantitatively observe the potential tradeoffs of management actions (prevention and secondary material use) for these flows that occur at different timestamps within the production system (Figure 4).
However, there remain opportunities to improve the model. One component to consider is the ultimate destination of on-farm food losses. Based on interviews with growers, Gillman et al. (2019) determined that the majority of food loss material is tilled back into the field, thereby returning organic matter to the soil. In some interviews, growers also described occasions where the product was used as animal feed. For example, during a year when yields exceeded contracted volumes, one processing tomato grower allowed sheep to graze the unharvested fields. While outside the scope of this study, these final destinations for on-farm loss material do influence the overall LCA for these various crop types. The United States Environmental Protection Agency food recovery hierarchy addresses this topic from a broad heuristic perspective (US EPA, 2019), however detailed quantitative data on the relative economic, environmental, and social costs of food loss material management need to be further developed and specified by food type and stage of supply chain to substantially advance decision-making in the field.
In an attempt to address this issue for the crops assessed in our study, we conducted a review of peer-reviewed literature for the specialty crops to evaluate qualitative (and available quantitative) information about the destinations, benefits, and costs associated with the potential secondary uses of the on-farm losses (see qualitative information available in Supplementary Material S4). Through our evaluation of the peer-reviewed literature, we observed a focus on secondary use(s) of on-farm losses for animal feed, composting, and biomass for energy generation. Overall, our findings corroborate previous research findings—the significant data gap in this area implies collecting and consolidating this information on a large scale in the short term is imperative as interest in preventing, recovering, and recycling food loss, and waste continues to increase exponentially (Xue et al., 2017).
Finally, it is also important to consider the on-farm system within the broader food supply chain. For example, as outlined in this study, a successful intervention to reduce losses at the farm would lead to a decrease in inputs per unit of crop products at the farm gate. However, there is potential to ultimately incur higher environmental and economic costs if these recovered losses from the farm are ultimately wasted further down the food supply chain (Gillman et al., 2019). As such, it is maximizing the harvest of all cultivated product is not necessarily an environmentally optimal solution when factoring in the additional downstream environmental impacts and increased risk of wastage, including increased likelihood of disposal in landfill (Scherhaufer et al., 2015; Gillman et al., 2019).
Conclusions
This study assessed annual cropping systems (processing tomato, fresh tomato, romaine heads), and a perennial system (processing peach) using an LCA approach to characterize the environmental burdens associated with each specialty crop. For the annual crops and the perennial crop assessed in this study, on-farm fuel (diesel) use and irrigation (diesel and electric pump use) are the primary contributors to the impacts associated with production. Considering the LCA in the context of crop losses presented some exciting concepts to explore further concerning the uniqueness of each crop.
First, successful efforts to reduce crop losses in the field have the potential to reduce the environmental burden per unit of product sold at the farm gate. This notion is explored using the example of freshwater use, GWP100, and total primary energy use, and two scenarios. At face value, this relationship might suggest that investments in reducing on-farm food losses would be a practical approach to increase resource use at the cultivation node of the supply chain. However, in discussions with growers, the growers emphasized that the culling of crops at the field level is based mainly on identifying which crops will effectively make it to market in the context of existing quality standards and risk of spoilage (Gillman et al., 2019). Thus, reducing on-farm food losses on the farm only to increase the potential for losses later in the supply chain carries a significant risk of reducing resource use efficiency within the broader system boundary of farm to consumer (or to fork). This concept should be explored more deeply in future research, including an assessment of the economic costs and the relative risks of losses at each stage of the supply chain. Further, evaluating the viability of any alternative to reduce on-farm losses and improving recovery would also require talking with growers about the barriers to recovery.
Second, LCA of crop cultivation must include clear delineation between the production of marketable crops relative to food losses and other crop residues, allowing for multiple flows from net flows that occur at each stage (or node) of the supply chain. In our assessment of processing peaches, EOL woody biomass by-product is assessed as a displacement credit for energy consumption and GHG emissions within the cultivation LCA using system expansion. Along these lines, it is necessary to consider the difference between food losses and other material flows (woody biomass, crop residues) as well as the timing of available material within the life cycle of the production system and potential tradeoffs associated with the various material destinations and utilization pathways.
Finally, accounting for on-farm losses in LCA presents unique challenges and opportunities. There is a wide gap between the existing literature on food losses in agricultural production and actual on-farm practices by crop type and region. Further, any discussion of interventions to either reduce on-farm losses or recover edible product from the field requires more detailed information on costs and benefits of current practices (tilling back into field or diversion to animal feed) relative to the proposed alternative (e.g., animal feed, composting, anaerobic digestion, or collection for donation). We offer a mathematical approach for accounting for discrete, unique flows within the net flow of on-farm food loss in LCA. Not considering the uniqueness of each crop and within a crop, net flows have the potential to result in unaccounted for outcomes, i.e., overestimation or underestimation of economic and environmental costs.
Despite the challenge, there is an excellent potential to advance data and research for improved understanding of the value (economic, environmental, and social) of on-farm losses. While much of the interest in the food loss and waste research community will likely focus on assessing interventions to reduce losses (e.g., through more resilient or consistent crop varietals) or to increase the recovery of edible produce in the field (e.g., through gleaning, development of secondary markets, etc.), studies are also needed to accurately estimate the baseline benefits of existing practices for managing these materials (e.g., tilling into field, diversion to animal feed). Future studies also need to consider the timing and availability of the net biological flow (and multiple potential flows within the net flows) within and through the system to be able to assess interventions and management options on farm accurately. Finally, providing a standardized framework for cross-supply chain analysis, including the application of a consistent vocabulary (or ontology) and associated quantification for different, unique cropping systems and associated material types and destinations is critical for managing agri-food systems and agri-food system losses that are inherently diverse.
Data Availability Statement
All datasets generated for this study are included in the article/Supplementary Material.
Author Contributions
KW created the processing tomato, fresh tomato, and romaine heads LCAs, the on-farm food loss calculations and models, and contributed to the writing and editing of the manuscript as lead author. EM provided the LCA of the processing peaches and contributed to the writing and editing of the manuscript. AG led the analysis of on-farm losses for all crop types in the study and contributed to the writing and editing of the manuscript. ES served as Principal Investigator for the project and contributed to the writing and editing of the manuscript.
Funding
This research was made possible by a grant administered by the World Wildlife Foundation and funded by the Foundation for Food and Agriculture Research (Award #510953) and the Walmart Foundation (Award #29991673), both institutions are located in the United States. While funding from these agencies was essential for completing this research, the researchers had complete autonomy in designing and executing the research as well as producing this manuscript. Open access publication fees were paid by the College of Agricultural and Environmental Sciences at the University of California, Davis.
Conflict of Interest
The authors declare that the research was conducted in the absence of any commercial or financial relationships that could be construed as a potential conflict of interest.
Supplementary Material
The Supplementary Material for this article can be found online at: https://www.frontiersin.org/articles/10.3389/fsufs.2020.00010/full#supplementary-material
References
Baker, G., Gray, L., Harwood, M., Osland, T., and Tooley, J. B. (2019). On-farm food loss in northern and central California: results of field survey measurements. Resour. Conservl. Recycl. 149, 541–549. doi: 10.1016/j.resconrec.2019.03.022
Bare, J. (2012). Tool for the Reduction and Assessment of Chemical and Other Environmental Impacts (TRACI), Version 2.1-User's Guide. Report No. EPA/600/R-12/554 2012. Cincinnati, OH: US Environmental Protection Agency.
Bartzas, G., Zaharaki, D., and Komnitsas, K. (2015). Life cycle assessment of open field and greenhouse cultivation of lettuce and barley. Inf. Process. Agri. 2, 191–207. doi: 10.1016/j.inpa.2015.10.001
Basset-Mens, C., Vannière, H., Grasselly, D., Heitz, H., Braun, A., Payen, S., et al. (2016). Environmental impacts of imported and locally grown fruits for the French market: a cradle-to-farm-gate LCA study. Fruits 71, 93–104. doi: 10.1051/fruits/2015050
Bernstad, A., and Cánovas, A. (2015). Current practice, challenges and potential methodological improvements in environmental evaluations of food waste prevention - a discussion paper. Resour. Conserv. Recycl. 101, 132–142. doi: 10.1016/j.resconrec.2015.05.004
Bernstad, A., Cánovas, A., and Valle, R. (2016). Consideration of food wastage along the supply chain in lifecycle assessments: a mini-review based on the case of tomatoes. Waste Manage. Res. 35, 29–39. doi: 10.1177/0734242X16666945
Buzby, J. C., and Hyman, J. (2012). Total and per capita value of food loss in the United States. Food Policy 37, 561–570. doi: 10.1016/j.foodpol.2012.06.002
California Biomass Energy Alliance (CAEB) (2018). Avialable online at: http://www.calbiomass.org/facilities-map/ (accessed August, 2018).
California Energy Commission (2017). California Energy Commission Analysis and Stats. Avialable online at: https://www.energy.ca.gov/assessments/ (accessed August, 2018)
California Department of Pesticide Regulation (CDPR) (2018). Pesticide Use Reporting (for 2005 and 2015). Avialable online at: https://www.cdpr.ca.gov (accessed August, 2018).
Cherubin, M., Oliveira, D., Feigl, B., Pimentel, L., Lisboa, I., Gmach, M., et al. (2018). Crop residue harvest for bioenergy production and its implications on soil functioning and plant growth: a review. Sci. Agric. 75, 255–272. doi: 10.1590/1678-992x-2016-0459
Corrado, S., Ardente, F., Sala, S., and Saouter, E. (2017). Modeling of food loss within life cycle assessment: from current practice towards a ystematization. J. Clean. Prod. 140, 847–859. doi: 10.1016/j.jclepro.2016.06.050
Creus, A. C., Saraiva, B. A., and Arruda, E. F. (2018). Structured evaluation of food loss and waste prevention and avoidable impacts: a simplified method. Waste Manage. Res. 36, 698–707. doi: 10.1177/0734242X18778779
De Klein, C., Novoa, R., Ogle, S., Smith, K., Rochette, P., Wirth, T., et al. (2006). “N2O emissions from managed soils, and CO2 emissions from lime and urea application,” in IPCC Guidelines for National Greenhouse Gas Inventories, Prepared by the National Greenhouse Gas Inventories Programme, Vol. 4 (Geneva), 1–54.
De Marco, I., Riemma, S., and Iannone, R. (2017). Uncertainty of input parameters and sensitivity analysis in life cycle assessment: an Italian processed tomato product. J. Clean. Prod. 177, 315–325. doi: 10.1016/j.jclepro.2017.12.258
Del Borghi, A., Gallo, M., Strazza, C., and Del Borghi, M. (2014). An evaluation of environmental sustainability in the food industry through life cycle assessment: the case study of tomato products supply chain. J. Clean. Prod. 78, 121–130. doi: 10.1016/j.jclepro.2014.04.083
European Union (2017). Towards a Circular Economy - Waste Management in the EU. Available online at: http://www.europarl.europa.eu/RegData/etudes/STUD/2017/581913/EPRS_STU(2017)581913_EN.pdf
Evans, D. (2012). Beyond the throwaway society: ordinary domestic practice and a sociological approach to household food waste. Sociology 46, 41–56. doi: 10.1177/0038038511416150
Food and Agriculture Organization of the United Nations [FAO] (2013). Working Document: Food Wastage Footprint - Impacts on Natural Resources. Technical Report, FAO.
Gillman, A., Spang, E., and Campbell, D. (2019). Does on-farm food loss prevent waste? Insights from California produce growers. Resour. Conserv. Recycl. 150:104408. doi: 10.1016/j.resconrec.2019.104408
Gustafsson, J., Cederberg, C., Sonesson, U., and Emanuelsson, A. (2013). The Methodology of the FAO Study: Global Food Losses and Food Waste-Extent, Causes and Prevention. FAO, 2011. Gothenburg: The Swedish Institute for Food and Biotechnology.
Hammerschlag, F., and Scorza, R. (1991). Field performance of micropropagated, own-rooted peach trees. J. Am. Hort. Sci. 116, 1089–1091. doi: 10.21273/JASHS.116.6.1089
Hanserud, O., Cherubini, F., Øgaard, A., Müller, D., and Brattebø, H. (2018). Choice of mineral fertilizer substitution principle strongly influences LCA environmental benefits of nutrient cycling in the agri-food system. Sci. Tot. Environ. 615, 219–227. doi: 10.1016/j.scitotenv.2017.09.215
Hasey, J., Duncan, R., Sumner, D. A., and Murdock, J. (2018a). “Sample costs to establish and produce processing peaches (cling and freestone extra-early harvested varieties),” in Sacramento and San Joaquin Valley 2017. Davis, CA: UC Davis Department of Agricultural and Resource Economics.
Hasey, J., Duncan, R., Sumner, D. A., and Murdock, J. (2018b). “Sample costs to establish and produce processing peaches (cling and freestone late harvested varieties),” in Sacramento and San Joaquin Valley 2017. Davis, CA: UC Davis Department of Agricultural and Resource Economics.
Hebrok, M., and Boks, C. (2017). Household food waste: drivers and potential intervention points for design-an extensive review. J. Clean. Prod. 151, 380–392. doi: 10.1016/j.jclepro.2017.03.069
Heller, M., and Keoleian, G. (2003). Life cycle-based sustainability indicators for assessment of the US food system. Agri. Syst. 76, 1007–1041. doi: 10.1016/S0308-521X(02)00027-6
Howitt, R. E., MacEwan, D., Medellín-Azuara, J., and Lund, J. R. (2010). Economic Modeling of Agriculture and Water in California Using the Statewide Agricultural Production Model. Davis, CA: University of California.
Ingrao, C., Matarazzo, A., Tricase, C., and Teresa, M. (2015). Life cycle assessment for highlighting environmental hotspots in Sicilian peach production systems. J. Clean. Prod. 92, 109–120. doi: 10.1016/j.jclepro.2014.12.053
Johnson, L., Dunning, R., Bloom, J., Gunter, C., Boyette, M., and Creamer, N. (2018). Estimating on-farm food loss at the field level: a methodology and applied case study on a North Carolina farm. Resour. Conserv. Recycl. 137, 243–250. doi: 10.1016/j.resconrec.2018.05.017
Kendall, A., Marvinney, E., Brodt, S., and Zhu, W. (2015). Life cycle-based assessment of energy use and greenhouse gas emissions in almond production, part i: analytical framework and baseline results. J. Ind. Ecol. 19, 931–1102. doi: 10.1111/jiec.12332
Laurent, A., Bakas, I., Clavreul, J., Bernstad, A., Niero, M., Gentil, E., et al. (2014). Review of LCA studies of solid waste management systems - Part I: Lessons learned and perspectives. Waste Manage. 34, 573–588. doi: 10.1016/j.wasman.2013.10.045
Martínez-Blanco, J., Muñoz, P., Antón, A., and Rieradevall, J. (2011). Assessment of tomato Mediterranean production in open-field and standard multi-tunnel greenhouse, with compost or mineral fertilizers, from an agricultural and environmental standpoint. J. Clean. Prod. 19, 985–997. doi: 10.1016/j.jclepro.2010.11.018
Miyao, G., Aegerter, B., Sumner, D., and Stewart, D. (2017). Sample Costs to Produce Processing Tomatoes. Davis, CA: University of California Vegetable Research and Information Center.
Myhre, G., Shindell, D., Bréon, F.-M., Collins, W., Fuglestvedt, J., Huang, J., et al. (2013). “Anthropogenic and natural radiative forcing,” in Climate Change 2013: The Physical Science Basis. Contribution of Working Group I to the Fifth Assessment Report of the Intergovernmental Panel on Climate Change, eds T. F. Stocker, D. Qin, G.-K. Plattner, M. Tignor, S. K. Allen, J. Doschung, A. Nauels, Y. Xia, V. Bex, and P. M. Midgley (Cambridge: Cambridge University Press), 659–740. doi: 10.1017/CBO9781107415324.018
Neff, R., Dean, E., Spiker, M., and Snow, T. (2018). Salvageable food losses from Vermont farms. J. Agric. Food Syst. Commun. Dev. 8, 1–34. doi: 10.5304/jafscd.2018.082.006
Nemecek, T., Jungbluth, N., Canals, L. M., and Schenck, R. (2016). Environmental impacts of food consumption and nutrition: where are we and what is next? Int J Life Cycle Assess. 21, 607–620. doi: 10.1007/s11367-016-1071-3
Nikkhah, A., Royan, M., Khojastehpour, M., and Bacenetti, J. (2017). Environmental impacts modeling of Iranian peach production. Renew. Sust. Energy Rev. 75, 677–682. doi: 10.1016/j.rser.2016.11.041
Notarnicola, B., Sala, S., Anton, A., McLaren, S. J., Saouter, E., and Sonesson, U. (2017). The role of life cycle assessment in supporting sustainable agri-food systems: a review of the challenges. J. of Clean. Prod. 140, 399–409. doi: 10.1016/j.jclepro.2016.06.071
Ntinas, G., Neumair, M., Tsadilas, C., and Meyer, J. (2017). Carbon footprint and cumulative energy demand of greenhouse and open-field tomato cultivation systems under Southern and Central European climatic conditions. J. Clean. Prod. 142, 3617–3626. doi: 10.1016/j.jclepro.2016.10.106
Organización Internacional de Normalización (ISO) (2006a). ISO 14040: Environmental Management-Life Cycle Assessment-Principles and Framework. London: British Standards Institution.
Organización Internacional de Normalización (ISO) (2006b). ISO 14044: Environmental Management, Life Cycle Assessment, Requirements and Guidelines. London: British Standards Institution.
Parfitt, J., Barthel, M., and Macnaughton, S. (2010). Food waste within food supply chains: quantification and potential for change to 2050. Philosoph. Trans. R. Soc. B Biol. Sci. 365, 3065–3081. doi: 10.1098/rstb.2010.0126
Peck, J., and Smith, A. (2017). Quantification and regional comparison of water use for power generation: a California ISO case study. Energy Rep. 3, 22–28. doi: 10.1016/j.egyr.2016.11.002
Porter, S., Reay, D., Bomberg, E., and Higgins, P. (2018). Avoidable food losses and associated production-phase greenhouse gas emissions arising from application of cosmetic standards to fresh fruit and vegetables in Europe and the UK. J. Clean. Prod. 201, 869–878. doi: 10.1016/j.jclepro.2018.08.079
Reich, A., and Foley, J. (2014). Food Loss and Waste in the US: The Science Behind the Supply Chain. Available online at: https://conservancy.umn.edu/bitstream/handle/11299/170087/FPRC_Issue%20Brief_UDC_Food%20Loss%20and%20Waste%2004%202014.pdf?sequence=1 (accessed August, 2018).
Reutter, B., Lant, P., Reynolds, C., and Lane, J. (2017). Food waste consequences: environmentally extended input-output as a framework for analysis. J. Clean. Prod. 153, 506–514. doi: 10.1016/j.jclepro.2016.09.104
Scherhaufer, S., Lebersorger, S., Pertl, A., Obersteiner, G., Schneider, F., Falasconi, L., et al. (2015). Criteria for and Baseline Assessment of Environmental and Socio-Economic Impacts of Food Waste. Retrieved from BOKU University of Natural Resources and Life Sciences, Institute of Waste Management. Available online at: http://library.wur.nl/WebQuery/wurpubs/505035
Silva, V., Mol, H., Zomer, P., Tienstra, M., Ritsema, C., and Geissen, V. (2019). Pesticide residues in European agricultural soils-a hidden reality unfolded. Sci. Tot. Environ. 653, 1532–1545. doi: 10.1016/j.scitotenv.2018.10.441
Spang, E., Moreno, L., Pace, S., Achmon, Y., Donis-Gonzalez, I., Goliner, W., et al. (2019). Food loss and waste: measurement, drivers, and solutions. Annu. Rev. Environ. Resour. 44, 117–156. doi: 10.1146/annurev-environ-101718-033228
Spang, E., and Stevens, B. (2018). Estimating the blue water footprint of in-field crop losses: a case study of U.S. Potato Cultiv. Sust. 10:2854. doi: 10.3390/su10082854
Suthar, R., Barrera, J., Judge, J., Brecht, J., Pelletier, W., and Muneepeerakul, R. (2019). Modeling postharvest loss and water and energy use in Florida tomato operations. Postharvest Biol. Technol. 153, 61–68. doi: 10.1016/j.postharvbio.2019.03.004
Talaie, A., and Panahi, B. (2002). Pistachio growing in Iran. Acta Hortic. 591, 133–138. doi: 10.17660/ActaHortic.2002.591.17
Thinkstep (2017). Service Pack 34. Available online at: https://www.thinkstep.com/software/gabi-lca (accessed March, 2017).
United States Department of Agricultural/National Agricultural Statistical Service (USDA/NASS). (2017). Available online at: https://www.nass.usda.gov (accessed March, 2017).
US EPA (2015). United States 2030 Food Loss and Waste Reduction Goal. US Environmental Protection Agency (US EPA). Washington, DC. Available online at: https://www.epa.gov/sustainable-management-food/united-states-2030-food-loss-and-waste-reduction-goal (accessed November, 2019).
US EPA (2019). Food Recovery Hierarchy From US EPA. Available online at: https://www.epa.gov/sustainable-management-food/food-recovery-hierarchy (accessed July 5, 2019).
Vinyes, E., Asin, L., Alegre, S., Munoz, P., Boschmonart, J., and Gasol, C. (2017). Life cycle assessment of apple and peach production, distribution and consumption in mediterranean fruit sector. J. Clean. Prod. 149, 313–320. doi: 10.1016/j.jclepro.2017.02.102
Vinyes, E., Gasol, C., Asin, L., Alegre, S., and Munoz, P. (2015). Life cycle assessment of multiyear peach production. J. Clean. Prod. 104, 68–79. doi: 10.1016/j.jclepro.2015.05.041
Wernet, G., Bauer, C., Steubing, B., Reinhard, J., Moreno-Ruiz, E., and Weidema, B. (2016). The ecoinvent database version 3 (part I): overview and methodology. Int. J. Life Cycle Assess. 21, 1218–1230. doi: 10.1007/s11367-016-1087-8
Winans, K., Brodt, S., and Kendall, A. (2019). Life cycle assessment of California's processing tomato industry: a 10-year (2005–2015) evaluation. Int. J. Life Cycle Assess. doi: 10.1007/s11367-019-01716-5. [Epub ahead of print].
Keywords: food loss and waste, prevention, avoided emissions, LCA—life cycle assessment, agricultural production
Citation: Winans K, Marvinney E, Gillman A and Spang E (2020) An Evaluation of On-Farm Food Loss Accounting in Life-Cycle Assessment (LCA) of Four California Specialty Crops. Front. Sustain. Food Syst. 4:10. doi: 10.3389/fsufs.2020.00010
Received: 06 July 2019; Accepted: 23 January 2020;
Published: 14 February 2020.
Edited by:
Rubén Aldaco, University of Cantabria, SpainReviewed by:
Almudena Hospido, University of Santiago de Compostela, SpainJacopo Bacenetti, University of Milan, Italy
Copyright © 2020 Winans, Marvinney, Gillman and Spang. This is an open-access article distributed under the terms of the Creative Commons Attribution License (CC BY). The use, distribution or reproduction in other forums is permitted, provided the original author(s) and the copyright owner(s) are credited and that the original publication in this journal is cited, in accordance with accepted academic practice. No use, distribution or reproduction is permitted which does not comply with these terms.
*Correspondence: Edward Spang, ZXNzcGFuZ0B1Y2RhdmlzLmVkdQ==