 Caitlin C. Rering*
 Arthur B. Rudolph
 John J. Beck
- Chemistry Research Unit, Center for Medical, Agricultural, and Veterinary Entomology, Agricultural Research Service, United States Department of Agriculture, Gainesville, FL, United States
Recently, there has been an increase in the number of reports that highlight the role of microbes and their volatile metabolites in interactions with plants and insects, including interactions which may benefit agricultural production. Accurate and reproducible volatile collection is crucial to investigations of chemical-mediated communication between organisms. Accordingly, accurate detection of volatiles emitted from microbe-inoculated media is a research priority. Though numerous classes of volatile organic compounds are emitted from plants, insects, and microbes, emissions from microbes typically contain polar compounds of high volatility. Therefore, commonly used plant or insect volatile collection techniques may not provide an accurate representation of microbe-specific volatile profiles. Here, we present and compare the volatile data derived via three solventless collection techniques: direct headspace injection, solid-phase microextraction (SPME), and active sampling with a sorptive matrix blend specifically designed to prevent collection filter breakthrough of VOCs (solid-phase extraction, SPE). These methods were applied to a synthetic floral nectar media containing a nectar-inhabiting yeast, Metschnikowia reukaufii, and sunflower (Helianthus annus) pollen. The yeast contributed alcohols, ketones, and esters, and the pollen provided terpenoids. Direct headspace injections were not effective, and the resultant chromatography was poor despite the use of on-column cryofocusing. SPME and SPE detected a similar number of volatiles, but with varying relative abundances. SPE collected a greater abundance of microbial volatiles than SPME, a difference driven by high ethanol capture in SPE. Both SPE and SPME are appropriate for analysis of microbial volatiles, though the sorbent type and amount, and other collection parameters should be further evaluated for each studied system.
Introduction
Microorganisms colonize the interior and exterior of nearly all life on earth and can have significant effects on the fitness of their hosts (Bordenstein and Theis, 2015). Many interactions between microbes and other organisms are mediated through airborne metabolites, often referred to as volatiles or volatile organic compounds (VOCs). For example, some soil microorganisms emit volatiles which improve the growth of plants, even when microbes are grown separate from plants, soil, and roots (Ryu et al., 2003; Blom et al., 2011). Microbial volatiles are sometimes more important than plant volatiles in mediating insect behavior, a discovery that has improved pest monitoring and trap technology (Becher et al., 2012; reviewed in Davis et al., 2013). Microbes also use volatiles as antimicrobial agents against other susceptible species, and these adaptations hold promise as biocontrol technologies (Fialho et al., 2010; Di Francesco et al., 2015). However, despite their importance, few studies have evaluated the relative performance of VOC collection techniques for the analysis of microbial volatiles. Because microbial volatiles are generally small and polar relative to many plant volatiles and insect pheromones, VOC collection methods that are widely accepted and validated for the detection of plant and insect VOCs may not be suitable to sample microbial VOCs. Few studies directly compare volatile collection methods for their capacity to capture microbial VOCs and this lack of empirical data limits our ability to assess the role that plant associated microbial VOCs play in agricultural ecosystems. We have undertaken this microbial VOC methods report to fill this research gap. This report is written for a broad audience spanning low to high familiarity with analytical chemistry. We provide descriptions of fundamentals underlying the techniques for more novice readers, which may prove a useful reference for more experienced researchers.
In this methods paper, we directly compare three collection techniques for their capture of yeast (microbe) and pollen (plant) volatile profiles in a model floral nectar (Rering et al., 2018, 2020). Selected collection methods use equipment common to analytical chemistry laboratories such as gas chromatograph linked mass spectrometry (GC-MS), sorptive media, syringes, in addition to specialized equipment that is either affordable and commercially available, or can be constructed with minimal cost and basic technical expertise (e.g., CO2-chilled on-column cold trap). Additionally, the methods tested used either thermal desorption or direct headspace injection, and thus do not use solvents to desorb volatiles. Many microbial metabolites (e.g., ethanol, acetaldehyde, ethyl acetate, isopropanol) are obscured from detection when solvents are used. Based on these criteria, the methods selected for comparison were direct headspace injection, solid-phase microextraction (SPME), and solid-phase extraction onto sorbent filters (SPE). The methods were evaluated based on their sensitivity, the diversity of compounds detected, and reproducibility between replicates.
Materials and Methods
Sample System
The selected microorganism, Metschnikowia reukaufii (GenBank ID: MF319536), is one of the most frequently encountered nectar inhabiting yeasts (Herrera et al., 2008, 2009; Pozo et al., 2011). Originally isolated from Epilobium canum (Onagraceae) flowers (Rering et al., 2018), yeast were cultured from cryopreserved glycerol stocks onto yeast malt agar (YMA) plates and incubated at room temperature for 2 days prior to the start of the experiment. On the first day of each trial of the experiment, yeast colonies were collected from the surface of the YMA plate and suspended in sterile synthetic nectar. The density and viability of the yeast stock solution was determined via hemocytometer count using 0.1% erythrosine B stain (Kim et al., 2016).
Samples (20 mL final volume) were inoculated with 103 M. reukaufii cells/μL to synthetic nectar media (120 g/L each fructose and glucose, 60 g/L sucrose, 30% w/v sugar, and 0.5 mM each: glycine, alanine, asparagine, aspartic acid, glutamic acid, proline, and serine) to mimic the nectar of bee pollinated flowers (Gardener and Gillman, 2001; Pamminger et al., 2019) and sterilized by filtration (0.2 μm, 47 mm membrane filter, Supor®-200, Pall, Port Washington, New York, USA) with autoclaved filtration glassware. Pollen, which releases volatiles (Bertoli et al., 2011) and is frequently found in nectar (Herrera, 2017), was added to the nectar at a field-realistic concentration of 100 grains/μL to support yeast growth (Pozo and Jacquemyn, 2019). Mean pollen mass was estimated at 20.4 ng/grain by weighing a small pollen sample (from Helianthus annus (Asteraceae), Big Smile cultivar), suspending in a known volume of water and determining the pollen density with a hemocytometer count. Though pollen was not sterilized prior to use, it is unlikely that pollen-dwelling microorganisms interfered with sample integrity. Pollen storage conditions (dry at −18°C) likely inactivated many cells. Additionally, the synthetic nectar's high osmotic pressure limited the growth of most microorganisms not specialized to high sugar environments. Finally, the relatively high starting population of M. reukaufii cells added to samples likely overwhelmed and limited the growth of microbes which may have been introduced on pollen.
SPME and SPE collection methods were replicated five times, including five inoculated (nectar containing yeast and pollen) and five control samples (sterile nectar) for each method. For the direct headspace method, only three replicates of inoculated and control samples were analyzed due to poor results. Samples were cultured in autoclaved 118 mL (4 oz.) Ball® jars fitted with custom polytetrafluoroethylene (PTFE) lids and secured with the commercially supplied O-rings. Lids were fitted with a GC inlet septum to allow for SPME or direct headspace volatile collection (Supplementary Figure 1A). Samples were stored for 48 h prior to volatile collection in an incubator (29°C) to allow for yeast growth.
Volatile Collection
After 48 h, VOCs were collected as described below for each collection technique. Prior to sampling VOCs, accumulated headspace in the jars was vented by removing the lid and leaving samples open to gas exchange for 5 min, thereby reducing humidity which can interfere with collection. All collection methods were standardized so that each sample was collected over the 30-min period following the sample venting. Samples were collected on the benchtop at room temperature (ca. 22°C).
Direct Headspace Volatile Collection
After 30 min of being sealed and venting for 5 min, a syringe was inserted through the GC septa in the lid and 500 μL headspace loaded (500 μL capacity, Pressure-Lok®, Vici Precision Sampling, Baton Rouge, LA, USA) The sample was immediately injected into the GC inlet at a rate of ca. 10 μL/sec, maintaining inlet pressure at or below ca. 10.4 psi. Between uses, the syringe was cleaned by rinsing in acetone and hexane and oven-baked for ca. 30 min at 100°C.
Solid-Phase Microextraction (SPME) Volatile Collection
After venting, jars were re-sealed and volatiles were allowed to re-equilibrate in the sealed headspace for 15 min (“permeation” step) before the SPME fiber was inserted through the septum, and the fiber exposed to the sample headspace for 15 min (“exposure” step). The fiber was then retracted and immediately injected in the GC-MS for thermal desorption (6 min of fiber exposure in the GC inlet).
Volatile samples were collected using a 50/30 μm, 2 cm divinylbenzene/Carboxen®/polydimethylsiloxane (DVB/CAR/PDMS) fiber (Supelco, Bellafonte, PA, USA). When evaluated with other commercially available SPME fibers in previous preliminary experiments, the DVB/CAR/PDMS fiber provided the best retention of microbial volatiles.
Solid-Phase Extraction (SPE) Volatile Collection
After venting samples, the lid used for culturing was replaced with another custom lid designed to accommodate active sampling, pictured in Supplementary Figure 1B. All materials used in the lid and connections were constructed from PTFE, including the two 0.25” by 0.125” Swagelok reducing unions (Swagelok, Solon, OH, USA). These unions were fitted with a nut to secure the reducing union to the lid. The 0.25” unions were fitted with a GC inlet liner O-ring which allowed for the modified inlet liners to be connected to the union with a nut and sealed.
SPE adsorbent filters were made from standard, single-tapered GC splitless liners with a silanized glass wool plugs to contain the Tenax TA® (60–80 mesh) and Carboxen® 1003 (40–60 mesh; inlet and sorbents from Supelco, Bellafonte, PA, USA). The two sorbents were layered, with 40 mg of Tenax added first, separated by glass wool, and followed by 20 mg Carboxen (Figure 1B). Tenax/Carboxen (Ten/Car) samples were collected in a “pull system” where a syringe pump pulled sample headspace from the jars through the Ten/Car filters. An activated carbon-filter cleaned air that was pulled through the other PTFE union, avoiding background contamination. Like the Ten/Car filter, this filter was constructed using a GC inlet and glass wool to contain the adsorbent (Supplementary Figure 1B).
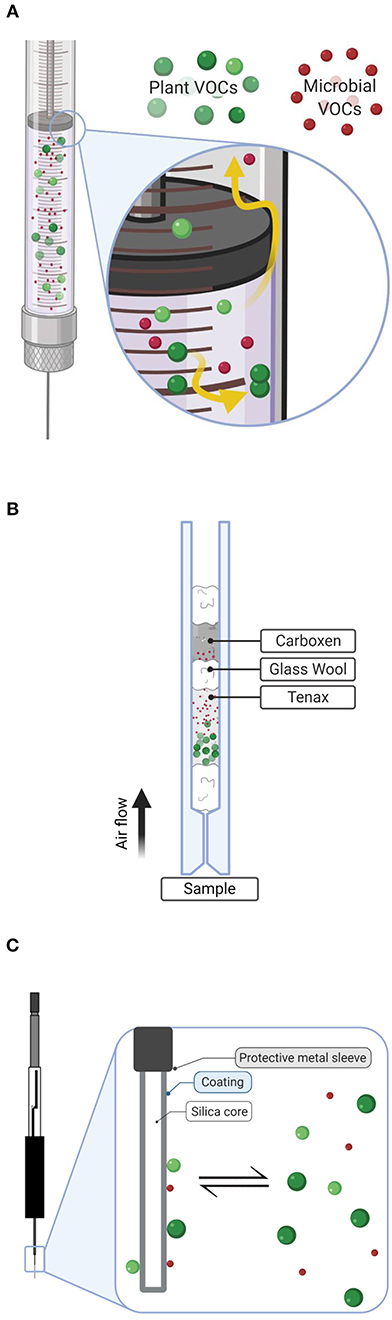
Figure 1. Descriptive diagram illustrating collection techniques of plant (green) and microbial red volatiles (VOCs) used in this experiment including: (A) direct headspace injection using an air-tight syringe, (B) active sampling with Tenax/Carboxen filter constructed in an inlet liner, and (C) passive sampling via solid-phase microextraction (SPME). Detail in (A) shows potential loss of compounds through leaks and desorption to glassware. In (B), plant volatiles are well-retained by the Tenax layer, while smaller microbial volatiles have escaped to be trapped by the stronger sorbent, Carboxen. Detail in (C) shows the passive diffusion collection of plant and microbial volatiles on SPME fibers. Diagrams created with BioRender.com.
Samples were re-sealed with the active sampling lid which had both the activated carbon and Ten/Car filters installed, but the pump switched off to allow volatiles to re-equilibrate for 28 min. The syringe pump connected to the Ten/Car filter was then switched on, pulling air from the jar for 2 min at a rate of 10 mL/min, drawing a total of 20 mL sample headspace through the volatile trap. The filter was then immediately transferred into the GC-MS inlet for thermal desorption and GC-MS analysis.
Volatile Detection by Gas Chromatography-Mass Spectrometry
All samples were analyzed using the same 7890 GC-7000 triple quadrupole MS (Agilent Technologies, Santa Clara, CA, USA) modified with an in-house designed cold trap system (described in Alborn, 2018). All samples, regardless of collection type, were introduced to the GC inlet via splitless injection held at 230°C. For SPME and direct headspace injections, a narrow SPME inlet liner was used (0.75 mm ID straight, Restek, Bellefonte, PA, USA). The filters used in SPE injections are constructed using a standard tapered GC liner, so they can be efficiently thermally desorbed by placing them directly in the GC inlet at the time of analysis (also described in Alborn, 2018). The cold trap, which sequentially chills an initial 5 cm segment of the GC column from ca. −30 to −75°C during the desorption period at the start of the run, was used for direct headspace samples and SPE samples, but not SPME. Detailed methods for the construction and operation of the in-house cold trap can be found in Alborn (2018). Volatiles were carried to the MS using helium as the carrier gas and a constant flow rate (1.4 mL/min). Compounds were separated using the following temperature program: initial temperature 30°C, held for 3 min; 4°C/min ramp to 100°C; 10°C/min ramp to 260°C, held for 5 min. Samples were separated using a 30 m × 0.25 mm HP-5MS UI capillary column with a film thickness of 0.25 μm (Agilent Technologies, Santa Clara, CA, USA). The spectral scan range was set from 45 to 400 m/z (EI, 70 eV, single ion monitoring mode, gain factor = 2).
Volatile Data Analysis and Statistical Analyses
Microbial and pollen volatiles were identified from background peaks by comparing sample and control GC-MS chromatograms. Previously identified M. reukaufii volatiles were additionally screened and included in the dataset when detected. For each analyte, one or more quantitative ions were selected to compare peak areas between samples (Supplementary Table 1). For SPME collections, certain microbial and pollen compounds were detected in sterile controls, albeit at much lower abundances (<1%) than inoculated samples (Supplementary Table 2). For these compounds (ethanol and α-pinene, SPME only), sample peak areas were background subtracted using control peak areas.
All statistical analyses were carried out in R (version 4.0.2; R Core Team, 2013). Volatile composition among samples was visualized with a principle coordinate analysis based on Bray-Curtis dissimilarities and further investigated by comparing SPME and SPE (Ten/Car) data by permutational analysis of variance with the adonis function in the vegan package (Oksanen et al., 2018).
Results
Direct Headspace Injection
Principles, Benefits, and Pitfalls of Direct Headspace Injection
Volatile collection methods typically rely on a sorbent matrix to concentrate compounds in sample headspace prior to analysis. This concentration step helps overcome instrumental limits of detection, since volatiles generally exist at low concentrations (ppb or ppt). However, direct headspace injections are also successfully employed and are quite popular in certain disciplines. Direct headspace injection methods rely on larger sample (and therefore analyte) loadings to the instrument but may suffer from poor chromatography and proportional interference of background “noise” which confounds signal detection. Direct headspace analysis is therefore best accomplished via specialized instrumentation where the air is removed and the sample is concentrated, flash heated, and then transferred to the analytical GC column through heated, air-tight transfer lines, thus preventing sample loss through leaks and condensation. However, such specialized equipment may not be available in many laboratories. Alternatively, a clean, air-tight syringe can be used to directly load large (>25 μL headspace for GC) sample volumes to the instrument, as adopted here (Figure 1A).
Because large-volume injections do not use pre-concentration before instrumental analysis, potential biasing effects of sorbent-based collections are entirely avoided, allowing easy comparison of relative metabolite abundances in sample air. However, large-volume injections are prone to many potential pitfalls, including deposition of volatiles to syringe surfaces and loss through worn syringe plunger or scratched glass, which lead to gas leaks (Figure 1A). Direct headspace analysis can also suffer from poor chromatography, resulting from the sample matrix overwhelming the separation capacity of a column. This is of particular concern for modern GC columns, which use a thin film of sorbent to retain compounds, rather than a packed column. In an effort to prevent this effect, we employed a liquid CO2 cryotrap (or cold trap; as described in Alborn, 2018) which can greatly improve chromatographic separation of volatiles by the use of a temperature gradient (30 to −78°C) to focus VOC on a small section of the GC column, while permitting atmospheric gasses (N2, CO2, O2, etc.) to pass through.
Direct Headspace Injection of Microbial Volatiles
Direct headspace injections showed trace microbial metabolite fragments co-eluting in the “dead volume” of the column (~1 min retention time, Figure 2A), a term which refers to the time compounds not retained by the stationary phase of the GC column will appear on the chromatogram. These results suggest that even with the benefit provided by on-column cryofocusing, the sample volume exceeded the separation capacity of the column. Smaller injection volumes may have yielded improved chromatographic separation and metabolite identification but were not further explored, since volatiles were present at low abundance when 500 μL of headspace were injected, and abundances would likely have been lower still with smaller injection volumes. Because this technique did not provide good results with these sampling parameters after 3 replicates, we excluded it from further testing.
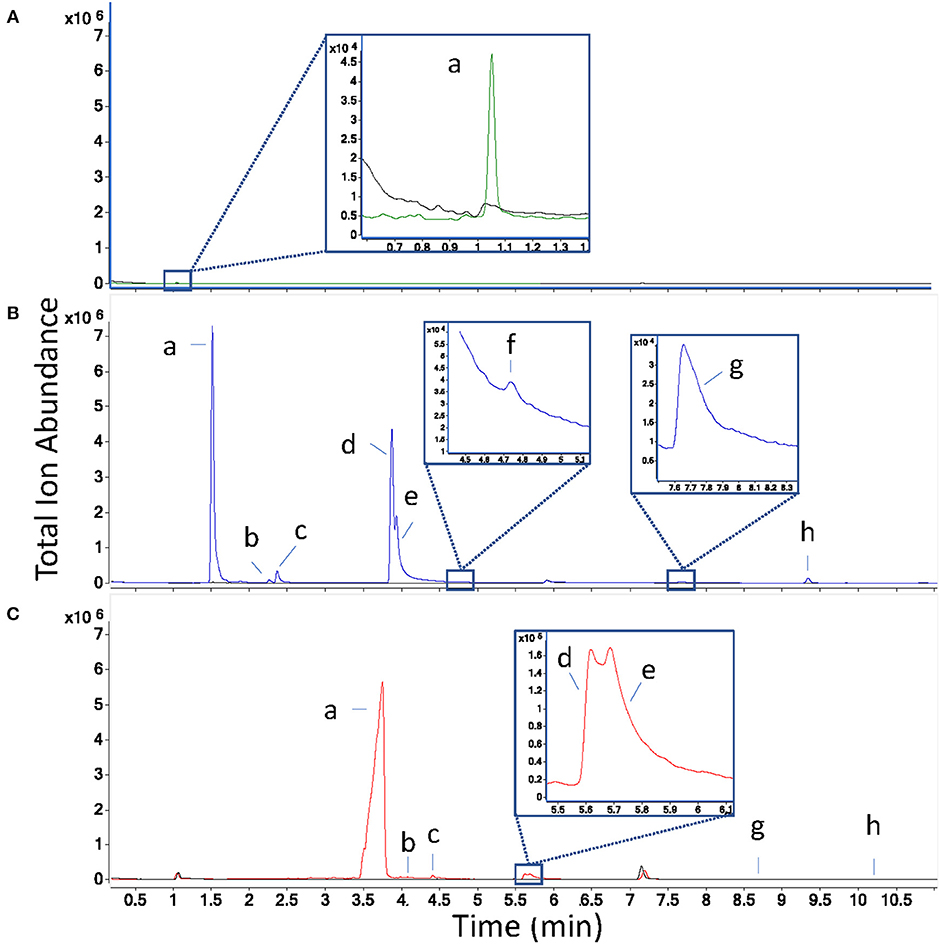
Figure 2. Overlaid total ion chromatograms of inoculated (in color) and sterile control samples (black) for each collection technique, where panel (A) is direct headspace in green, (B) is solid-phase microextraction in blue, and (C) is solid-phase extraction with Tenax/Carboxen filters in red. Peak labels (a–f) correspond to the following compound identities: a: ethanol, b: acetoin, c: isobutanol, d: 2-methyl-1-butanol, e: 3-methyl-1-butanol, f: 3-methyl-3-buten-1-ol, g: isoamyl acetate, h: α-pinene. Retention times in (C) are shifted later than those in (B) due to the use of the cold trap. To ease comparison between techniques, the same Y-axis scale is used for each chromatogram overlay.
Solid-Phase Extraction and Microextraction
Principles, Benefits, and Pitfalls of Solid-Phase Extraction and Microextraction
Sorbent-based collection methods temporarily trap compounds from sample headspace via intermolecular forces occurring between the sorbent matrix and volatiles. These intermolecular forces (primarily van der Waals forces, but also dipole-dipole and H-bonding for polar volatiles) are the same forces which assist in separating chemicals based on their differential affinity with the stationary phase during chromatographic separation. Ideally, sorbent-based collection methods either exhaustively trap all, or a representative proportion of volatiles present in a sample.
Sorbent-based methods can be further divided into two categories, those which employ active or passive sampling. In active sampling, denoted here as sold-phase extraction (SPE), a pump or external gas flow (or both) are used to force sample air through the collection matrix, which consist of sorbent(s) packed within an inert glass or metal container (in this case, a packed GC inlet). Because the potential for sample breakthrough (where compounds elute after passing through the sorbent matrix) is a significant concern in active sampling and microbial volatiles may be particularly susceptible to breakthrough due to their small size, we designed a two-component SPE filter to trap volatiles (Figure 1B, 40 mg Ten, 20 mg Car).
Design of the SPE filter was informed by manufacturer-supplied technical reports which describe breakthrough data of volatiles spanning a wide range of molecular weights. Consultation with this data (Brown and Shirey, 2020) indicated that Tenax exhibits significant breakthrough of low molecular weight/boiling point chemicals like acrylontitrile and 1,3-butadiene, which have similar size to small microbial volatiles like ethanol and isobutanol. Conversely, Carboxen irreversibly binds moderately sized compounds, such as styrene and 1,2-dichlorobenzene, which have analogous properties to midweight plant volatiles like 3-hexen-1-ol and linalool. By layering the two materials in order of increasing sorbent strength, very volatile compounds which may be poorly retained by the Tenax layer with long sampling times or large sample volumes will be trapped by and recovered from the Carboxen layer. Mid-weight, less volatile compounds will be efficiently retained by the Tenax layer and therefore prevented from partitioning to the Carboxen layer, where many may be irreversibly bound.
Similar to active sampling, passive sorbent-based headspace sampling makes use of various sorbent polymers to trap chemicals from air, but in passive sampling, compounds are loaded onto the matrix via diffusion (Figure 1C). Diffusion is an equilibrium-based process and is therefore best accomplished via a thin layer of sorbent, rather than a dense packed material, thus explaining the term used to describe the technique, solid-phase microextraction.
After collection of sample headspace, volatiles must be readily and completely released from the sorbent material for analysis. In this experiment, we adopted only sorbents and methods which are compatible with thermal desorption–release of volatiles to the instrument via rapid heating, in this case, within the GC inlet itself.
Comparison of Solid-Phase Extraction and Microextraction of Microbial Volatiles
In total, eight sample volatiles (seven microbial and one pollen volatile, α-pinene) were detected in the model floral nectar headspace (Table 1). VOC profiles were similar when measured by SPE and SPME sampling, however, one microbial-derived volatile (3-methyl-3-buten-1-ol) detected as a small peak partially co-eluting with 3-methyl-1-butanol when sampled by SPME (Figure 2B), was not sufficiently chromatographically resolved in SPE to allow peak area determination (Table 1). For some SPE replicates, chromatograms suggested the presence of a third metabolite (perhaps 3-methyl-3-buten-1-ol) in the 2- and 3-methyl-1-butanol region of the plot (Figure 2C), but compound fragments were too similar between metabolites and elution too close to measure this compound. Densely packed SPE filters have slower-desorption rates relative to the thin coatings of sorbent used in SPME, which can make resolution between structurally similar metabolites such as these challenging by SPE. On-column cryofocusing can significantly ameliorate this challenge, as adopted here. Additionally, a modified temperature gradient and selection of a different column type could likely improve resolution and detection of these microbial VOCs for both SPME, which also suffered from co-elution of volatiles to a lesser degree, and SPE.
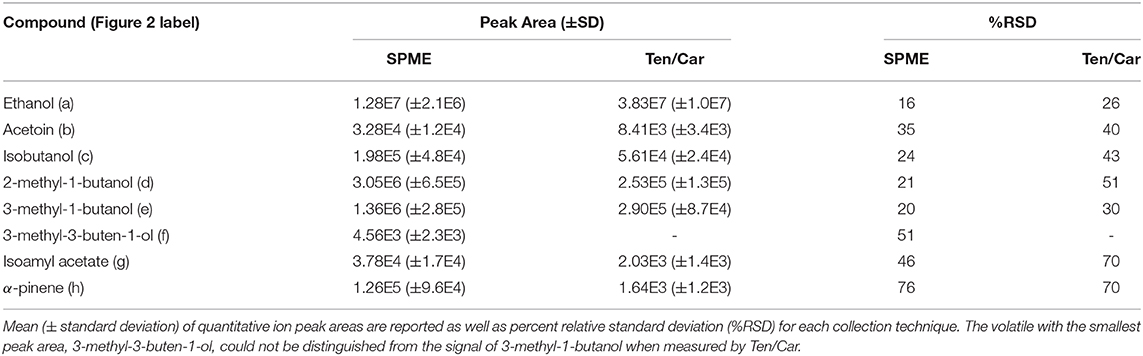
Table 1. Microbial and pollen volatiles detected in model nectar system by solid-phase microextraction (SPME) and solid-phase extraction using Tenax/Carboxen (Ten/Car) filters, with Figure 2 compound labels in parentheses.
In terms of total peak area, active SPE sampling yielded larger total volatile peak area than SPME (Figure 3). This difference was driven by greater capture of ethanol by SPE, a major volatile produced by this nectar yeast. Except for ethanol and one other volatile, isoamyl acetate, which was similarly detected in SPME and SPE, peak areas for all other volatiles were larger when measured by SPME than by SPE (Figure 4). This result is in part due to the high concentration of volatiles present in this sample headspace which limited sample collection times for SPE to only a fraction of the sample jar headspace (20 mL out of ~100 mL above the 20 mL sample).
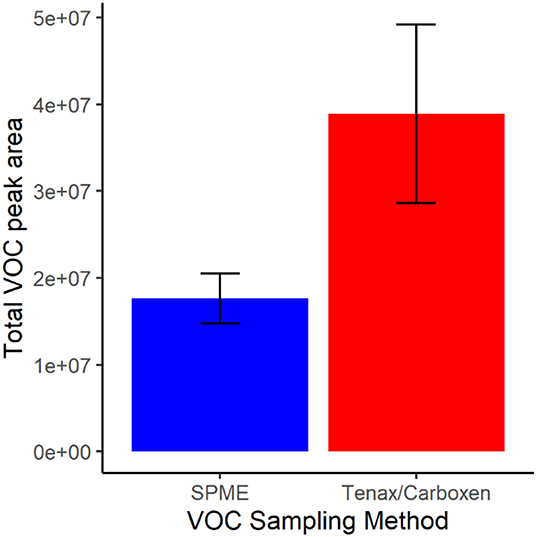
Figure 3. Total volatile (VOC) peak area for each collection method, solid-phase microextraction (SPME) in blue and sampling with Tenax/Carboxen filters in red. Bars represent mean and error bars represent standard deviation.
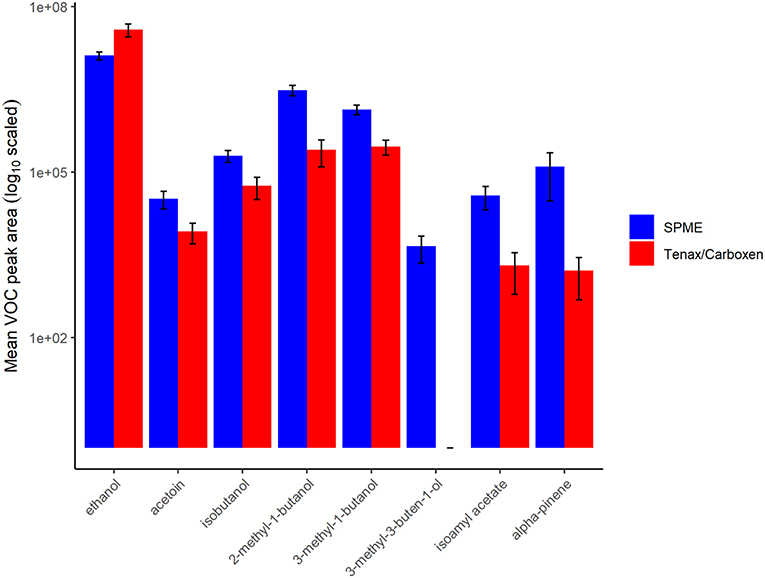
Figure 4. Volatile (VOC) peak area of samples for each collection method, solid-phase microextraction (SPME) in blue, and sampling with Tenax/Carboxen filters in red. Bars represent mean, error bars represent standard deviation, values are in log-scale. The compound 3-methyl-3-buten-1-ol could not be measured via Tenax/Carboxen by our methods.
Though volatile profiles between the techniques were similar in terms of the number and identity of volatiles detected, differences did emerge. Ordination of sample data shows clustering of sample type by collection technique, explaining 92% variance of principle coordinate axis 1 (Figure 5). Permutational analysis of variance further confirmed different volatile profiles as detected by SPME and SPE [collection method, F(1, 16) = 3.52, p = 0.015].
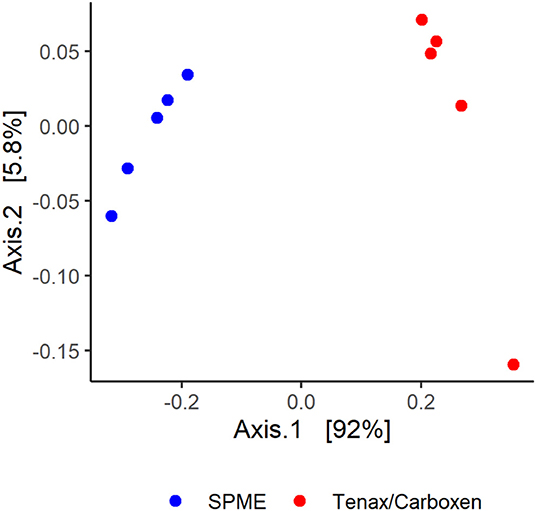
Figure 5. Solid-phase microextraction (SPME, blue circles) and Tenax/Carboxen active extraction (red circles), visualized with a principle coordinate analysis based on Bray-Curtis dissimilarities.
Relative percent standard deviations for the biological replicates were acceptable for some compounds and poor for others (Table 1). For environmental samples acceptable analytical variance, often measured as percent relative standard deviation, is ca. 30% or lower. Analytical reproducibility, where no biological variability is incorporated (e.g., a standard chemical mixture), should average 15% or better. Some compounds were detected at very low abundance and accordingly had particularly poor reproducibility (e.g., α-pinene). Overall, passive sampling with SPME had lower variance between samples than Ten/Car active SPE sampling. This is likely explained by the dynamic and technical nature of SPE sampling. For example, if any fittings are slightly loose during the collection period of active sampling, these leaks may cause the actual volume of sample air collected to differ significantly, thereby impacting the results. Issues of volatile breakthrough or irreversible binding may also play a role, though we detected no sample breakthrough in our tests Supplementary Section; Supplementary Figure 2).
Discussion
Direct headspace analysis as performed here is usually not used in modern studies because, as demonstrated, this approach is generally not successful. Without a pre-concentration step as used in SPE and SPME, microbial volatile analysis failed. Poor performance was anticipated for this method, which was largely included as a juxtaposition to the more typical SPE and SPME techniques, and to highlight the importance of the volatile collection step in analysis.
SPME is a simple method that can easily and reproducibly sample headspace for volatiles of varying physicochemical properties. SPME does not require a cold trap or external source of clean gas and/or calibrated pump to perform, making it user-friendly for laboratory-based experiments. Because SPME uses a thin layer of sorbent (and not a packed column as is used in SPE), desorption is efficient and rapid, supporting good chromatographic separation of volatiles by the GC with minimal method optimization. SPME sample data, if properly collected, is semi-quantitative for headspace samples that are generally similar in their composition.
However, the simple technical and mechanical operation of SPME can be deceptive. Accurate and reproducible SPME results require vigilance to ensure all sampling parameters remain consistent between replicates: permeation time of volatiles into the enclosed headspace; the size of the enclosed headspace; fiber exposure time; fiber storage time after collection; and collection temperatures can all lead to inconsistent equilibrium-based sampling. Additionally, competitive displacement of less abundant compounds or compounds with lower binding affinity for the selected sorbent may occur. This phenomenon however is generally only observed in highly concentrated air samples and/or direct immersion SPME (where the fiber is exposed to a liquid or solid sample, i.e., water or animal tissues). Additionally, sample throughput is relatively slow for SPME due to the often-long equilibration periods needed for passive diffusion to collect sample volatiles. Finally, because sample stability post-collection is poor due to diffusive desorption of volatiles from the SPME fiber, SPME is not well-suited for field sampling, particularly if the field site is more than a few hours away from the GC-MS.
Quantitative analysis of volatiles in air (e.g., ng/L*h data) is relatively facile to determine with active SPE techniques relative to passive SPME, assuming compounds are not escaping capture or being irreversibly bound to sorbents. SPE is also particularly well-suited to field sampling, showing better sample stability post-collection than SPME and often requiring shorter sampling times, thereby increasing sample throughput. In more dilute samples, active SPE sampling can be used to collect a greater number of compounds from a given sample by adopting large sampling volumes or long collection times. In our model system, this benefit was not clearly demonstrated due to the highly concentrated headspace. In fact, for this experiment, SPE collection volumes had to be reduced after preliminary trials revealed larger sample volumes resulted in poor separation of ethanol (Supplementary Figure 3).
Active SPE sampling requires greater equipment and technical expertise in order to collect. The complexity and dynamic nature of an active collection system can also yield greater variability in the quantities of volatiles detected. We also caution that Carboxen absorbs water which can damage GC columns and interfere with volatile collections. Use of this sorbent may therefore not be appropriate for high humidity samples and long collection times without the adoption of a drying step. For short time/volume SPE samplings of highly concentrated samples, the addition of Carboxen to the Tenax might not be necessary to prevent sample breakthrough and thus will reduce the unwanted trapping of humidity. Though trapping a large amount of compounds is helpful for overcoming detector limitations, it can complicate chromatographic separation, making analysis, and interpretation more challenging, as seen in our initial SPE samplings were a massive ethanol peak covered most of the other small polar compounds. Therefore, different sample volumes may need to be evaluated in order to establish an optimal balance between too much and little sample volume.
Because sample air can be exhaustively sampled with SPE, it is often thought to be a better representation than SPME of the “true” volatile profile present in sample headspace. However, this benefit is in some instances more theory than practice, as this interpretation assumes ideal trapping and desorption kinetics of the SPE sorbents (no irreversible binding or breakthrough of volatiles; equal affinity for all compounds present in the blend). As we show here, SPME and SPE did provide different relative ratios of volatiles, but differences between the techniques were not as great as might be expected by some. General patterns of abundance, including the major vs. minor components of the pollen and yeast sample, were the same between techniques.
SPME is best suited to more controlled experiments with a variety of plant and microbial species of interest, and where research goals are centered on rapidly identifying volatiles and their relative abundances between samples, as perhaps a first step in investigations. SPME is also a good selection in cases where limited specialized sampling accessories are available. SPE is better suited for field sampling due to shorter sample processing speeds and improved storage stability. Also, due to its capacity to exhaustively capture naturally low abundance compounds under ideal performance conditions, SPE is likely more sensitive in the detection of minor volatile components in the field. Finally, SPE may be preferred for experiments which prioritize the acquisition of rigorously quantitative data, for example to help design volatile blend proportions used in field trapping.
If possible, several promising methods and sorbent mixtures should be tested to discover methods that most efficiently, reproducibly, and indiscriminately collect sample volatiles. Some suppliers sell sorbent kits for SPME and SPE, so that different types and combinations can be screened in preliminary trials. However, if preliminary experiments are not feasible, technical notes can help guide the selection of sorbents for SPE and SPME (Brown and Shirey, 2020). Researchers should select microbial volatile methods based on the available resources of a given laboratory in terms of both equipment and technical expertise and the goals of their study.
Although not generally reported, method development data describing (where appropriate) metabolite breakthrough, recovery, storage stability, and/or carryover, provides information about the benefits and drawbacks of various costly-to-evaluate approaches. We offer this comparison of collection methods with the hope it will inspire others to evaluate the most promising techniques for their research needs, while encouraging other researchers to candidly share their valuable method development data. Doing so will provide a better foundation for the rapid expansion of knowledge in the field of microbial volatiles and beyond.
Data Availability Statement
All datasets generated for this study are included in the article/Supplementary Material.
Author Contributions
CR conceived of the study, analyzed the chemical data, and drafted the manuscript. AR prepped the samples and ran statistical analyses. AG and AR collected the volatiles and analyzed them on the instrument. All authors revised and edited the final text and contributed to the final experimental design.
Funding
This research was performed under USDA-ARS Research Project 6036-22430-001-00D. ABR was supported by APHIS Interagency Agreement 60-6036.
Conflict of Interest
The authors declare that the research was conducted in the absence of any commercial or financial relationships that could be construed as a potential conflict of interest.
Acknowledgments
We thank R. Bruton, T. Corcoran, and A. Rose for laboratory assistance and B. Forguson for greenhouse assistance.
Supplementary Material
The Supplementary Material for this article can be found online at: https://www.frontiersin.org/articles/10.3389/fsufs.2020.598967/full#supplementary-material
References
Alborn, H. (2018). A technique for thermal desorption analyses suitable for thermally-labile, volatile compounds. J. Chem. Ecol. 44, 103–110. doi: 10.1007/s10886-018-0924-6
Becher, P., Flick, G., Rozpedowska, E., Schmidt, A., Hagman, A., Lebreton, S., et al. (2012). Yeast, not fruit volatiles mediate Drosophila melanogaster attraction, oviposition, and development. Funct. Ecol. 26, 822–828. doi: 10.1111/j.1365-2435.2012.02006.x
Bertoli, A., Fambrini, M., Doveri, S., Leonardi, M., and Pugliesi, C. (2011). Pollen aroma fingerprint of two sunflower (Helianthus annuus L.) genotypes characterized by different pollen colors. Chem. Biodivers. 8, 1766–1775. doi: 10.1002/cbdv.201100045
Blom, D., Fabbri, C., Connor, E., Schiestl, F., Klauser, D., Boller, T., et al. (2011). Production of plant growth modulating volatiles is widespread among rhizosphere bacteria and strongly depends on culture conditions. Environ. Microbiol. 13, 3047–3058. doi: 10.1111/j.1462-2920.2011.02582.x
Bordenstein, S., and Theis, K. (2015). Host biology in light of the microbiome: ten principles of holobionts and hologenomes. PLoS Biol. 13:e1002226. doi: 10.1371/journal.pbio.1002226
Brown, J., and Shirey, B. (2020). A Tool for Selecting an Adsorbent for Thermal Desorption Applications. Available online at: https://www.sigmaaldrich.com/content/dam/sigma-aldrich/docs/Supelco/Bulletin/11342.pdf (accessed August 25, 2020).
Davis, T., Crippen, T., Hofstetter, R., and Tomberlin, J. (2013). Microbial volatile emissions as insect semiochemicals. J. Chem. Ecol. 39, 840–859. doi: 10.1007/s10886-013-0306-z
Di Francesco, A., Ugolini, L., Lazzeri, L., and Mari, M. (2015). Production of volatile organic compounds by Aureobasidium pullulans as a potential mechanism of action against postharvest fruit pathogens. Biol. Control 81, 8–14. doi: 10.1016/j.biocontrol.2014.10.004
Fialho, M., Toffano, L., Pedroso, M., Augusto, F., and Pascholati, S. (2010). Volatile organic compounds produced by Saccharomyces cerevisiae inhibit the in vitro development of Guignardia citricarpa, the causal agent of citrus black spot. World J. Microbiol. Biotechnol. 26, 925–932. doi: 10.1007/s11274-009-0255-4
Gardener, M., and Gillman, M. (2001). Analyzing variability in nectar amino acids: composition is less variable than concentration. J. Chem. Ecol. 27, 2545–2558. doi: 10.1023/A:1013687701120
Herrera, C. (2017). Scavengers that fit beneath a microscope lens. Ecology 98, 2725–2726. doi: 10.1002/ecy.1874
Herrera, C., Canto, A., Pozo, M., and Bazaga, P. (2009). Inhospitable sweetness: nectar filtering of pollinator-borne inocula leads to impoverished, phylogenetically clustered yeast communities. Proc. Biol. Sci. 277, 747–754. doi: 10.1098/rspb.2009.1485
Herrera, C., Garcia, I., and Perez, R. (2008). Invisible floral larcenies: microbial communities degrade floral nectar of bumble bee-pollinated plants. Ecology 89, 2369–2376. doi: 10.1890/08-0241.1
Kim, S., Kim, H., Lee, H.-J., Lee, K., Hong, D., Lim, H., et al. (2016). Application of a non-hazardous vital dye for cell counting with automated cell counters. Anal. Biochem. 492, 8–12. doi: 10.1016/j.ab.2015.09.010
Oksanen, J., Blanchet, F. G., Friendly, M., Kindt, R., Legendre, P., McGlinn, D., et al. (2018). Vegan: Community Ecology Package. R Package Version 2.5-2. Available online at: https://CRAN.R-project.org/package=vegan (accessed November 30, 2020).
Pamminger, T., Becker, R., Himmelreich, S., Schneider, C., and Bergtold, M. (2019). The nectar report: quantitative review of nectar sugar concentrations offered by bee visited flowers in agricultural and non-agricultural landscapes. PeerJ 7:e6329. doi: 10.7717/peerj.6329
Pozo, M., Herrera, C., and Bazaga, P. (2011). Species richness of yeast communities in floral nectar of southern spanish plants. Microb. Ecol. 61, 82–91. doi: 10.1007/s00248-010-9682-x
Pozo, M., and Jacquemyn, H. (2019). Addition of pollen increases growth of nectar-living yeasts. FEMS Microbiol. Lett. 366:fnz191. doi: 10.1093/femsle/fnz191
R Core Team (2013). R: A Language and Environment for Statistical Computing. Vienna: R Foundation for Statistical Computing.
Rering, C., Beck, J., Hall, G., McCartney, M., and Vannette, R. (2018). Nectar-inhabiting microorganisms influence nectar volatile composition and attractiveness to a generalist pollinator. New Phytol. 220, 750–759. doi: 10.1111/nph.14809
Rering, C., Vannette, R., Schaeffer, R., and Beck, J. (2020). Microbial co-occurrence in floral nectar affects metabolites and attractiveness to a generalist pollinator. J. Chem. Ecol. 46, 659–667. doi: 10.1007/s10886-020-01169-3
Keywords: microbial volatile, VOC, plant volatile, SPME, headspace analysis, GC-MS, passive sampling, active sampling
Citation: Rering CC, Gaffke AM, Rudolph AB, Beck JJ and Alborn HT (2020) A Comparison of Collection Methods for Microbial Volatiles. Front. Sustain. Food Syst. 4:598967. doi: 10.3389/fsufs.2020.598967
Received: 26 August 2020; Accepted: 19 November 2020;
Published: 11 December 2020.
Edited by:
Sudhakar Srivastava, Banaras Hindu University, IndiaReviewed by:
Durgesh K. Jaiswal, Banaras Hindu University, IndiaArnab Majumdar, Indian Institute of Science Education and Research Kolkata, India
Saurabh Yadav, Hemwati Nandan Bahuguna Garhwal University, India
Copyright © 2020 Rering, Gaffke, Rudolph, Beck and Alborn. This is an open-access article distributed under the terms of the Creative Commons Attribution License (CC BY). The use, distribution or reproduction in other forums is permitted, provided the original author(s) and the copyright owner(s) are credited and that the original publication in this journal is cited, in accordance with accepted academic practice. No use, distribution or reproduction is permitted which does not comply with these terms.
*Correspondence: Caitlin C. Rering, Y2FpdGxpbi5yZXJpbmdAdXNkYS5nb3Y=