 Ana Gabriela Pérez-Castillo1*
 Jimmy Arrieta-Méndez2Jorge Alberto Elizondo-Salazar2
 Mayela Monge-Muñoz1Mohammad Zaman3
 Alberto Sanz-Cobena4
- 1Environmental Pollution Research Center, University of Costa Rica, Montes de Oca, Costa Rica
- 2Alfredo Volio Mata Experimental Station, University of Costa Rica, Ochomogo, Costa Rica
- 3Joint FAO/IAEA Centre of Nuclear Techniques in Food and Agriculture, Soil and Water Management and Crop Nutrition Section, International Atomic Energy Agency, Vienna, Austria
- 4Department of Chemistry and Food Technology, Research Center for the Management of Environmental and Agricultural Risks, Polytechnic University of Madrid, Madrid, Spain
The application of dairy farm effluents (DFE) without previous treatment in paddocks was intensified due to the approval of this practice in Costa Rican legislation since 2012. Applying DFE instead of synthetic N fertilizer in grasslands is an opportunity to reach a circular economy; however, this practice increases the risk of emissions of nitrous oxide (N2O), methane (CH4), and ammonia (NH3), which contribute to global warming. A field experiment was carried out using a permanent grassland (90% Star grass and 10% Kikuyo grass) to simultaneously assess the effect of nitrapyrin on yield-scaled emissions of NH3, CH4, and N2O. The experiment lasted for 5 months in 2017, based on a randomized complete block design, including three treatments of control (CK) without N application, surface application of DFE with nitrapyrin (SNI), and without nitrapyrin (S). Total N applied was 149 ± 12 kg N ha−1 for both S and SNI treatments split into five applications. CH4 emissions from S, SNI, and CK showed a high temporal variation. Daily fluxes of CH4 from SNI were significantly lower than those of S in August (P < 0.05). Cumulative emissions of CH4, the majority produced in the soil, ranged from 4 to 168 g ha−1 for S, and from −13 to 88 g ha−1 for SNI. The ratio between the N2O cumulative emissions and the N applied as DFE were 1.6 ± 0.5 and 1.7 ± 0.2% for S and SNI, respectively. NH3 volatilization potential was very low (i.e., 0.6 ± 0.2% of the N applied). Under the prevailing experimental conditions, no significant difference between yield-scaled NH3 and N2O emissions were found between S and SNI, suggesting that nitrapyrin may not be a viable mitigation option for gaseous N losses from DFE application in Costa Rican grasslands in rainy season.
Introduction
The profitability of milk production in the tropics is mainly based on animal feeding practices and the management of pastures, which are the most cost-effective source of nutrients (Borges et al., 2012). Strategic fertilization of the pasture is essential to obtain high yields as well as nutritional quality of tropical grasses (Johnson et al., 2001). In the last 20 years, the Costa Rican dairy sector has undergone specialization and intensification processes, leading to an increase in production of slurry, dairy farm effluents (DFE), and farm yard manure (Salas-Camacho and Uribe-Lorío, 2008; Elizondo-Salazar and Jiménez-Castro, 2014; Iñamagua et al., 2016; MAG, 2019). This intensification process has kept grazing as the main management system of dairy farms (dual purpose 94% and specialized dairy 79%) where the slurry collection is limited to the milking periods (INEC, 2020). In general, in these systems, urine and dung are combined with washing water and collected in systems open to the environment. Under these management conditions, the majority of milking areas end up with DFE as waste. DFE application without previous treatment in the Costa Rican paddocks is allowed by national legislation since 2012, and it is an alternative used by producers to get their operation permit (MAG, 2012; INEC, 2020). In a circular economy model, this alternative practice reduces the costs related to waste treatment processes and minimize the use of synthetic fertilizer, which are advantageous from an ecological and economic point of view. This practice could however, lead to other environmental issues such as emissions of GHGs, ammonia, and pollution of water bodies (Rodhe et al., 2006; Fangueiro et al., 2015a; Huertas et al., 2016; Regueiro et al., 2016; Owusu-Twum et al., 2017; Franco et al., 2019).
N2O, with high global warming potential (GWP 265 for 100-year time horizon), plays a central role in the depletion of stratospheric ozone (Ravishankara et al., 2009; Myhre et al., 2013). Emissions of NH3 contribute indirectly to global warming when NH3 is transformed into nitrate () through nitrification (Saggar et al., 2013) and induce soil acidification and eutrophication of natural ecosystems after deposition. Along with its impact on climate and environment, NH3 has an adverse effect on air quality and therefore on human health because it is a precursor for secondary organic aerosols and contributes to particle formation (Zhu et al., 2015).
In Costa Rica, Arndt et al. (2020) measured pasture NH3 emissions from excreta deposited by grazing cattle plus the subsequent application of DFE using a micrometeorological integrated horizontal-flux mass-balance method. They reported the emission factors (EFs) of 3.9 ± 2.1 and 4.2 ± 2.1% (mean ± 95% CI); the first one for excreta deposited on pasture and the second one for excreta both deposited on pasture and DFE application. It has been suggested that fluxes of NH3 decrease when manure dry matter content diminishes because infiltration enhances by decreasing solids on the soil surface after application, and as result, the exposed to air decreases (Sommer et al., 2003). However, N2O emissions could potentially increase due to the added labile carbon (C) and moisture, factors that lower O2 availability and promote denitrification (VanderZaag et al., 2011).
Emissions of N2O are produced from slurries through denitrification and nitrification of mineral nitrogen (N) and organic N substances (Saggar et al., 2004). Denitrification is stimulated when N fertilizers rich in organic matter, such as slurry, are applied (Akiyama et al., 2010; VanderZaag et al., 2011). The supply of slurry also leads to an increase in the proportion of anaerobic microsites within the soil profile where the input of biologically labile C leads to a high initial consumption of inorganic N by the microbial biomass, thus triggering N2O production through denitrification (Faverin et al., 2014; Martínez-Lagos et al., 2014; Mori and Hojito, 2015). For this reason, slurries have shown higher N2O EFs than that of synthetic fertilizers (e.g., Cayuela et al., 2017), especially in the rainy season when the water-filled pore space (WFPS) in soil is high (Salazar, 2015). In any case, N2O fluxes are highly variable since they depend on the slurry composition, soil characteristics, such as pH and organic matter, the type of bacteria involved in the process, and the amount of oxygen in the soil, which varies with handling excreta and precipitation (Faverin et al., 2014).
The CH4 (GPW 28 for 100-year time horizon) is produced by the degradation of the organic matter of the slurry during storage and remains dissolved in the liquid part. For this reason, most of the CH4 emissions normally occur within 24 h after applying the slurry to the pastures (Chadwick et al., 2000; Mori and Hojito, 2015). Soil CH4 fluxes are determined by the balance between the CH4 oxidation by methanotrophic bacteria and its emission by methanogenic Archaea. In aerated soils, methanotrophic aerobic bacteria contribute both to the oxidation of atmospheric CH4 that diffuses into the soil, and the one that propagates from methanogenic zones (Faverin et al., 2014). In anaerobic soils, only a part of CH4 formed is oxidized in the aerobic interface of the saturated zone by methanotrophic bacteria (Faverin et al., 2014).
Strategies to reduce N losses from dairy farms include improving feed N utilization efficiency through dietary measures, fertilizer application rate adjusted to the crop needs, and fractionation according to the absorption curve of the crop, and altering solid or liquid manure characteristics by separation or dilution (VanderZaag et al., 2011; Yapur, 2011; Martínez-Lagos et al., 2014; Sanz-Cobena et al., 2017). In addition, the application of nitrification inhibitors (NIs) mixed with the slurry has been proposed as an alternative to reduce its environmental impact and enhance the N availability for crop nutrition (Owusu-Twum et al., 2017; Recio et al., 2018). NIs suppress the metabolic activity of ammonia-oxidizing bacteria by inhibition of the subunit B of ammonia-monooxygenase (AMO), the first enzyme implicated in the oxidation of ammonium () to in soils, reducing the nitrification rate and potentially its loss as or N2O afterward (Ruser and Schulz, 2015; Beeckman et al., 2018; Zhou et al., 2020). Nevertheless, the increase in the associated with the use of NIs could enhance the risk of NH3 volatilization, in particular when the slurry is not incorporated into the soil (Kim et al., 2012).
The effectiveness of NIs depends on environmental and soil conditions like soil moisture, carbon content, and pH (Zhang et al., 2020; Zhou et al., 2020). From soils receiving liquid manure additions, nitrapyrin and DMPSA reduced N2O emissions 60 and 56% at the 60 and 80% WFPS of the Gray Luvisolic soil, respectively, reductions similar to the 58% found at the 60% WFPS of the Black Chernozemic (BC) soil. Conversely, in this very carbon-rich soil, at the 80% WFPS, the N2O emission reduction vanished. At WFPS as low as 40%, N2O fluxes were minimal and the NIs effect was not significant (Lin and Hernandez-Ramirez, 2020). NI adsorption to soil organic matter is a key factor that influences their effectiveness. Nitrapyrin adsorption capacity decreased as the soil organic matter decreases (from 48.5 to 7.3 g kg−1) at a rate fitted by the Langmuir equation (Zhang et al., 2020).
It has been reported that NIs applied to cattle slurry decrease N2O losses by 60% after its surface application in grassland soils from temperate regions and NI efficiency was lower in spring than that in autumn (Merino et al., 2002, 2005). This effect is comparable with the lower mean annual N2O emissions (up to 46%) reported when cattle slurry was injected with commercial NIs, including 2-chloro-6-(trichloromethyl) pyridine (nitrapyrin), on Haplic Luvisol under silage maize in Germany (Herr et al., 2020). This medium-term comparison between the five commercially available NIs showed no difference in N2O fluxes, crop yield, or N removal when cattle slurry was mixed with NIs before injection (Herr et al., 2020). A meta-analysis on the use of nitrapyrin with slurry in corn production concluded that the manure applied with this inhibitor increased the crop yield by 7%, improved the N retention in the soil by 28%, and decreased N2O emissions by 51% (Wolt, 2004).
In New Zealand, contrasting results have been reported with fresh DFE applied with the NI dicyandiamide (DCD) at 10 kg DCD ha−1. DFE applied at approximately 100 kg N ha−1 to plots on a well-drained soil on volcanic parent material in three seasons showed the largest N2O EF (1.65%) during the spring measurement period. DCD reduced N2O EF from applied DFE by 40–80%, being more effective during the spring and autumn seasons (Li et al., 2015). On the other hand, application of DFE (52–58 kg total N ha−1) resulted in EF ranging from 0.06 to 0.94% and DCD had little or no effect on reducing EFs from four regions with contrasting soils and climatic conditions (van der Weerden et al., 2016).
Among synthetic NIs to improve N use efficiency of applied chemical fertilizers, DCD and 3,4-dimethylpyrazol-phosphate (DMPP) have gained commercial adoption in agricultural systems. However, we chose to test the efficacy of nitrapyrin in our grassland study because the newly developed version/type of nitrapyrin or N-Serve (NP), has some competitive advantages over application of DCD or DMPP. These advantages include high longevity because of its bactericidal effect on the nitrifiers, and a lower application rate compared with other NIs.
The strategies to mitigate gaseous emissions (NH3, N2O, and CH4) from DFE would involve some offset among these gases. Therefore, we aim to investigate the effect of applying cattle DFE with and without nitrapyrin on emissions of GHGs and NH3. We hypothesized that using DFE with nitrapyrin in Costa Rican grasslands will mitigate reactive N losses and increase biomass yield, thus decreasing yield-scaled N2O and NH3 emissions and, therefore, contributing to generalize the use of this by-product as a pillar of the Strategy for Low Carbon Livestock of Costa Rica.
Materials and Methods
Study Site
The study was conducted from July to November 2017, in the Alfredo Volio Mata Experiment Station located in Ochomogo, Costa Rica (9° 54′ 31″ N, 83° 57′ 18″ W; 1,590 m above sea level). For more than 25 years, the pasture paddocks have been managed as a 90% Cynodon nlemfuensis (Star grass) and 10% Kikuyuocloa clandestina (Kikuyo grass) grassland with a stocking rate of 3.5 animal units ha−1. The site has been fertilized mainly with urea at a rate of 250 kg N ha−1 year−1 and typically grazed by cattle on 28-day rotations, both throughout the rainy season. Six months before DFE application, grazing was excluded to eliminate any grazing effect.
The soil, classified as Typic Haplustand (Mata et al., 2016), has a texture sandy clay loam (28% clay, 12% silt, and 60% sand), a mean bulk density of 0.86 ± 0.3 Mg m−3 (Pérez-Castillo et al., 2021), and an infiltration rate of 7.8 mm h−1, which was measured with a double ring infiltrometer (Brouwer et al., 1988).
Climate in this area is characterized by an average temperature of 19.3°C (min. 13°C, max. 23°C) and annual precipitation of 1,500 mm from May to November (Elizondo and Boschini, 2001). Variation in daily temperature between July and November 2017 was small. The highest average daily air temperature was 18.2°C in July, and the lowest 16.6°C in November, with a mean temperature of 17.6 ± 1.0°C. Air temperature, wind speed, and rainfall were recorded on site with an automatic weather station (temperature sensor: HMP60 Vaisala, Helsinki, Finland; anemometer: RM Young 05103; and rain gauge: TE525 Texas Electronics, Dallas, Texas).
Experimental Design and Treatments Applied
The experiment, based on a random complete block design, was set up as two sets of plots. The first block, composed of plots of 1 m × 1.25 m for monitoring the emissions of NH3, N2O, and CH4 included five replications. The second block, made up of plots of 2.5 m × 3 m for measuring yield and forage quality, included four replications (Supplementary Figure 1).
In both plots sets, the following three treatments were applied: control (CK) without N application, fertilization with DFE (S), and fertilization with DFE plus nitrapyrin (SNI). DFE consisted of urine and dung accumulated during milking periods and mixed with washing water from milking parlor and collected by systems open to the environment. Total N applied was 149 ± 12 kg N ha−1 for both S and SNI treatment split into five applications (20, 24, 25, 40, and 40 kg N ha−1). The nitrapyrin was applied at a mean dose of 16 ± 2 g of nitrapyrin (active ingredient (a.i.) kg N−1 (n = 5) equivalent to 0.49 ± 0.18 kg a.i. ha−1. This rate was 4.6 times higher than that of the previous research in the area (Pérez-Castillo et al., 2021) and greater than that of 0.25 kg a.i. ha−1 at 60% WFPS recommended by Lin and Hernandez-Ramirez (2020) to offset possible nitrapyrin losses by volatilization or any other soil condition.
Total N rate lower than the recommended value (180 kg N ha−1) for 5 months, according to the nutrient absorption curves of Cynodon nlemfuensis (Rivera, 2008) and N-rate more often used in Costa Rica's dairy farms (Villalobos and Arce, 2013). Nevertheless, the N rate was lower than the one recommended, it was not supplemented with a synthetic source because of difficulties in separating N sources effects and the intention to probe the effect of nitrapyrin below the usual N rate as suggested by Rose et al. (2018).
The DFE application was adjusted based on the maximum phosphorus requirement for Cynodon nlemfuensis (45 kg P ha−1 year−1; Rivera, 2008), considered the limiting factor for fertilization with slurry (Glaesner et al., 2011), and total -N. After 3 months of fertilization with DFE, 40 kg N ha−1 were applied to S or SNI to bring the N rate closer to the recommended values by application by Mislevy (2002) and Rivera (2008) (225 or 250 kg N ha−1 year−1 split into six or seven applications, depending on the duration of the rainy season).
In October 2017, only yield, forage quality, and nitrogen use efficiency (NUE) were monitored due to technical issues solved up to 8 days after DFE fertilization.
DFE Applied
The DFE were collected during the cleaning of dairy cattle facilities. The fresh material was transported in a cow dung vacuum tank, mixed, and deposited in 200 L containers. At this moment, the nitrapyrin was added to half of the DFE (SNI treatment). Then, all the containers were covered with plastic tightened with tire bands to prevent N losses through volatilization and the dilution by rainwater.
The day after collection, a volume of DFE (7.7 ± 1.5 L m−2) was applied using a manual garden sprinkler with a spoon attached to disperse the liquid (Table 1). A sample of 1 L of DFE per container was taken during each application and transported in a cooler, to the laboratory of the Center for Agronomic Research (CIA) of the Universidad de Costa Rica, for pH analysis and determination of -N, -N, and total N (Ntotal) concentrations. Ntotal was analyzed by wet digestion with sulfuric acid and flow injection analysis (FIA). and concentrations were quantified by FIA. FIA was performed on a Lachat FIA-8000 continuous flow analyzer (Hach, Loveland, Colorado, USA). Dry matter content (DM) was obtained by drying 100 g subsamples of DFE to constant weight at 85°C.
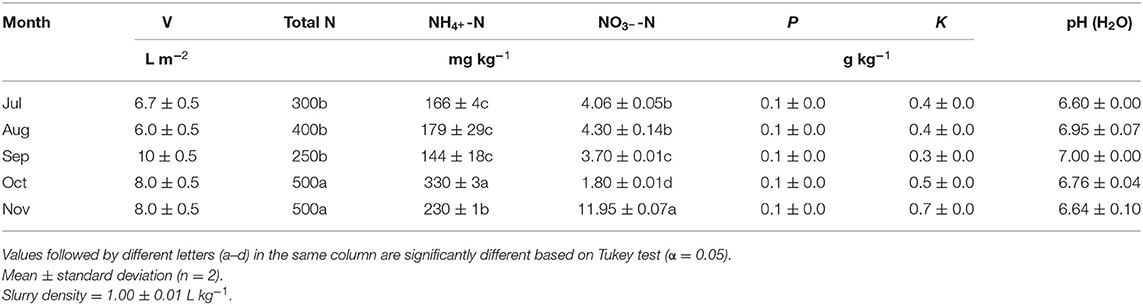
Table 1. Volume (V) and chemical characteristics on a fresh weight basis of the DFE applied in the field trial carried out in the Alfredo Volio Mata Experimental Station, Costa Rica, from July to November 2017.
The average N content of the DFE was 0.39 ± 0.11 g kg−1, with a significant increase in the concentration of total N, -N, and -N in November (P < 0.05) (Table 1). In each fertilization, the N applied was calculated from the data of Ntotal L−1 DFE. The DM of DFE collected was 10 ± 3 g kg−1 (n = 4). The variability of this material is widely documented (Salas-Camacho and Hernández Salas, 2008; Martínez-Lagos et al., 2014; Fangueiro et al., 2015b), and N higher values in October and November corresponds to the less quantity of rainwater mixed with slurry effluent collected from a reception pit open to the elements in response to lower rainfall during the collection period (Figure 1A).
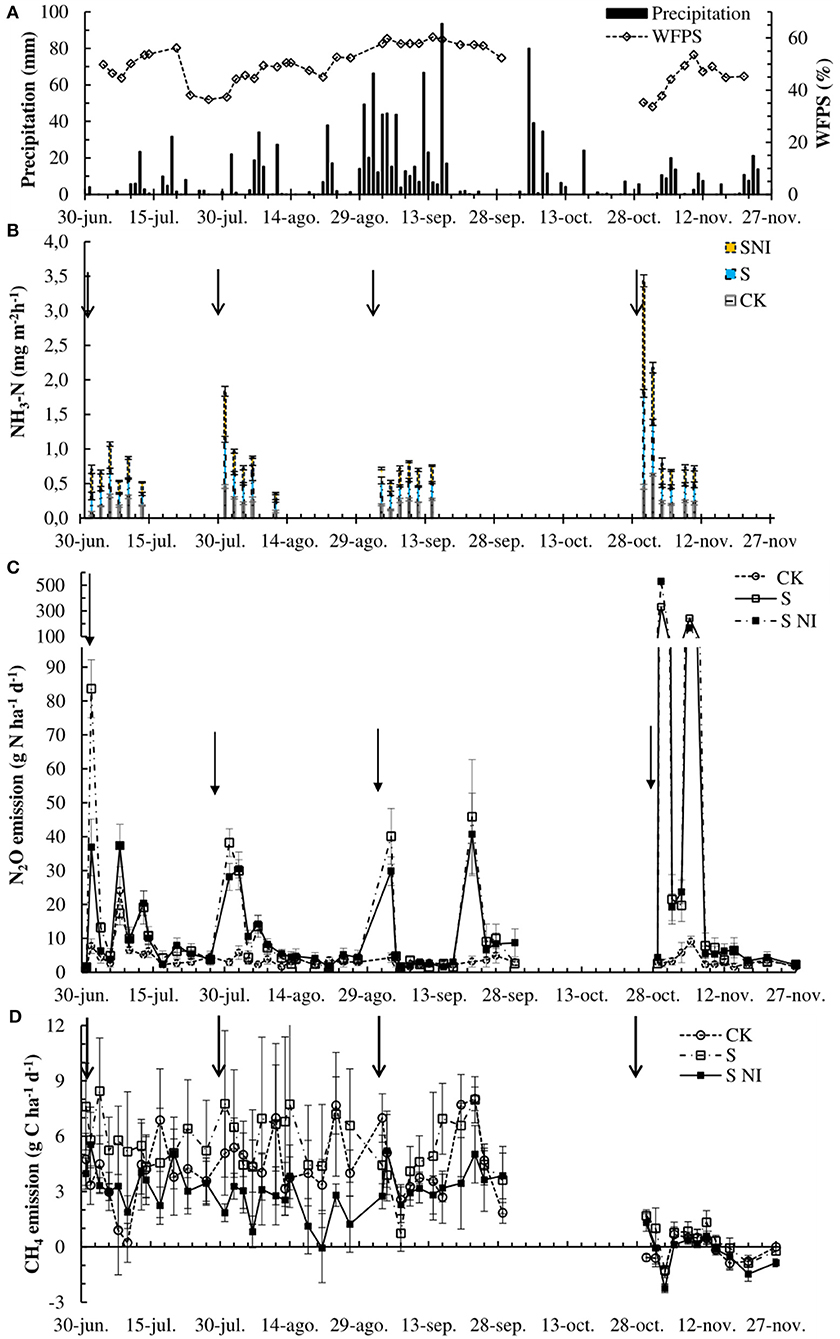
Figure 1. Precipitation and water-filled pore space (WFPS) in top 10-cm of soil (A). Ammonia (NH3) (B), nitrous oxide (N2O) (C), and methane (CH4) (D) flux from control (CK), dairy farm effluents (S), and dairy farm effluents plus nitrapyrin (SNI) of a field trial conducted in 2017 on a permanent pasture in the Alfredo Volio Mata Experimental Station, Costa Rica. Vertical bars indicate the standard error (n = 5). Arrows indicate the moment when dairy farm effluents were applied.
The N- represented the highest proportion of the total N (55 ± 12%) of the slurry, while the N- only constituted 1.7 ± 0.6%. The phosphorus and potassium concentration were within the reported ranges by Huertas et al. (2016) (0.06 ± 0.02 g P kg−1 and 0.4 ± 0.2 g K kg−1).
The composition of the DFE (called purines in Costa Rica) (Table 1) is typical of what in Costa Rican paddocks is used as fertilizer (N total < 0.5 g kg−1, NH4-N < 0.3 g kg−1, P < 0.1 g kg−1, K < 0.7 g kg−1, and DM around 1%) (Salas-Camacho and Uribe-Lorío, 2008; Arndt et al., 2020).
Soil Analysis
At the beginning of the field trial, one composite soil sample from each plot was collected from the top 20 cm of the soil in the experimental site and was extracted by KCl-OLSEN methodology and quantified the content of calcium, magnesium, potassium, total phosphorus, zinc, copper, iron, and manganese by atomic absorption spectroscopy (novAA 400p, Analytik Jena, Germany). Soil organic C and total N were analyzed by dry combustion on an elemental analyzer (Vario Macro-cube, Elementar, UK). Soil pH was measured at a 1:2.5 ratio of soil:water suspension. Effective cation-exchange capacity (ECEC) was determined by extracting cations with ammonium acetate 1 mol L−1 buffered at pH 7. Soil chemical properties are shown in Table 2. Soil was slightly acid (pH 6.07), with high soil organic matter (7.1%) and a C/N ratio of 9.3 ± 0.3. This C/N ratio is lower than the data reported in temperate regions (Abbasi and Adams, 2000; Cui et al., 2013) and reflects the lower content of humic acids in the soil organic matter.
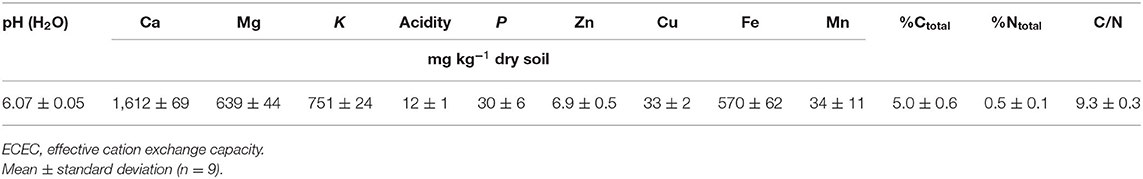
Table 2. Chemical properties of a composite sample from the top soil layer (0–20 cm) from the experimental area at the Alfredo Volio Mata Experimental Station (July 2017).
Soil mineral N (-N and -N) was determined from the top 10 cm of each plot on days 1, 3, 5, 9, and 27, after DFE application. Within 24 h of soil sampling, a subsample of 5 g of each plot was extracted with 50 ml of 2 mol L−1 KCl, for 1 h, in an orbital shaker at 200 rpm. and concentrations were then quantified by flow injection analysis performed on a Lachat FIA-8000 continuous flow analyzer (Hach, Loveland, Colorado, USA).
Soil moisture and temperature were measured by volumetric moisture sensors at 10 cm depth and by temperature sensor at 5 cm depth (both from Onset, Massachusetts, USA) in 7 of the 15 plots where gas emissions were monitored. WFPS was calculated dividing volumetric water content, monitored with soil moisture sensors of 10 HS, by total porosity (Martins et al., 2017).
Measurement of Gaseous Emissions
NH3 Volatilization Potential
Measurements of NH3 volatilization potential were determined by semi-static open chambers made of transparent polyethylene terephthalate bottles (soda bottle 2 L) with the bottom removed and laid on the top to prevent rainfall (Araújo et al., 2009; Jantalia et al., 2012; Martins et al., 2017). One NH3 chamber was installed in each GHG measurement plot on the soil surface and moved to different positions each sampling day using three preinstalled wire supports, as suggested by Jantalia et al. (2012). Inside each chamber, a foam strip (2.5 cm × 25 cm, 3 mm thick) was presoaked in a solution of 1 mol L−1 H2SO4 with 4% (v/v) glycerol and kept moist during sampling periods with 25 ml of the acid solution contained in a plastic jar suspended inside the chamber. The foam strips were installed at the time DFE application and collected and replaced with new acid traps on days 1, 3, 5, 7, 9, and 12 postfertilization (six samples for each N fertilization, during four cycles). Foam strips removed were then transported inside the plastic jar to the laboratory in a cooler. The trap volume was adjusted by weight to 50 ml with deionized water and extracted by shaking for 30 min at 220 rpm on an orbital shaker. A 1.2 ml aliquot of this solution was diluted to 25.00 ml, and was analyzed as indophenol in an alkaline medium by spectrophotometric analysis (Bolleter et al., 1961).
For comparing volatilization between treatments, cumulative NH3 volatilization potential (CENH3, g ha−1) (intervals 0–1, 1–3, 3–5, 5–7, 7–9, and 9–12 days after DFE application) was calculated by Equation 1 following the procedure stated by Jantalia et al. (2012).
where mNi (mg N) is the ith value of N captured from one plot by each period of sampling, CF is the conversion factor for converting N present in trap into volatilized N equal to 1.74 (Jantalia et al., 2012), and A is the area covered by the chamber (m2).
A ratio between the cumulative net emission of NH3 (less CK emissions) and the N applied as DFE throughout 4 months was calculated as a restricted comparison value for the rainy season.
Indirect emission of N2O from NH3 volatilization, expressed as CO2 equivalent (CO2e), was estimated by multiplying the accumulated emission of NH3-N (in kg NH3-N ha−1) by 0.014 (N volatilization and re-deposition EM) and by 265 (N2O GWP) (IPCC, 2019).
N2O and CH4 Emissions
Between 7:00 and 13:00, N2O and CH4 fluxes were monitored on days 1, 3, and 5 after fertilizer application, three times during the 2nd week after fertilization and then twice a week until the following grass harvest (at the end of the 4th week). A random block was chosen to start each sampling day. Fluxes were determined using the static chamber methodology (de Klein et al., 2020) and a cavity ring-down spectrometer, Picarro G2508 greenhouse gases analyzer (CRDS-G2508) (Picarro Inc., Santa Clara, CA, USA). The square static chambers (40 × 40 × 10 cm) were built from polycarbonate and insulated with a cover of Styrofoam. Toward the end of the cycle, an additional polycarbonate extension was used with the chamber to cover the grass higher than the chamber itself. Each chamber was placed on a frame inserted 12 cm into the soil prior the beginning of the sampling period to minimize the lateral diffusion of gases. A water seal was used to avoid gas leaks between the frame and the chamber. The frames were inserted 20 days before the beginning of the experiment and kept in the same place throughout the study period to avoid soil disturbance.
The CRDS-G2508 was operated in close mode at default company settings and enabled the simultaneous determination of N2O, CH4, and CO2 concentrations, in real time. The deployment time per chamber was 15 min. A Nafion dryer (Perma Pure LLC., Halma Holdings Company, NH, USA) was installed in the air inlet line to the CRDS-G2508 to prevent water from rising beyond optimal operating levels during the measurement. Atmospheric pressure and temperature in the headspace were recorded for each measurement with a Kestrel 4000 weather meter (Loftopia LLC., MI, USA) and used in flux calculation. The hourly flux of gases (Fgas) was calculated as:
where δCngas/δt is the change of N2O or CH4 concentration in the headspace (μmolgas ) in time (h). This change was calculated using an exponential fit of concentration data as dry mole fraction vs. enclosure time and evaluating its slope by the time derivative at t = 0 (Christiansen et al., 2015). A is the area covered by the chamber (m2), M is the N or C mass (28 μg N μmol−1 N2O or 12 μg C μmol−1 CH4), and n is moles of gas calculated using the ideal gas law. For each plot, the chamber volume was adjusted by adding the headspace between the soil surface and the connection point between the frame and the chamber.
Before starting the first sampling day of the week, the proper operation of the gas analyzer was verified by measuring directly at the sampling site two certified standard gases (uncertainty ±5%) obtained from Mesa specialty gases and transported in gas sampling bags (Calibrated Instruments, Maryland, USA). The change in the rate of CO2 over time was used to verify if there was any leak in the system, so a regression coefficient (time vs. concentration) < 0.99 or CO2 fluxes < 86 mg CO2 m−2 h−1 were criteria to reject N2O or CH4-monitored emissions (Pérez-Castillo et al., 2021).
In N2O flux data analysis, the values were compared with the detection (13.1 μg m−2 h−1) and quantification limits (39.4 μg m−2 h−1) (Pérez-Castillo et al., 2021). If the quadratic regression coefficient of the concentration change rate of N2O was <0.9 and data was lower than the detection limit, estimated fluxes were replaced by half of the detection limit. If they were lower than the quantification limit, the calculated values were kept. Otherwise, N2O fluxes were rejected (8% of total). For CH4, if the quadratic regression coefficient of the concentration change rate of CH4 was < 0.9, these fluxes were rejected (9.5% of total).
Cumulative emissions of N2O and CH4 (CEgas, kg ha−1 application−1) were calculated by the trapezoidal method. The mean flux between two consecutive measurements (Fi +1 and Fi in μg m−2 h−1) from one plot was multiplied by time (in h) elapsed between the both (ti +1 – ti −1), total of which is added to the individual fluxes measured.
On estimating the CH4 cumulative emissions, the rejected CH4 flows per plot were replaced by the median value of the treatment for the corresponding sampling day. This value was used to calculate the average flow between two consecutive sampling days.
Cumulative emissions of N2O and CH4, expressed as CO2e, were estimated by multiplying the accumulated emission of each gas (in kg N2O-N ha−1 or kg CH4-C ha−1) by its GWP (265 and 28, respectively) (IPCC, 2019).
A ratio between the cumulative net emission of N2O (less CK emissions) and the N applied as DFE throughout 4 months was calculated as a restricted comparison value for the rainy season.
Yield and Nutritional Quality of the Grass
The grass was harvested after 28 days rotation to simulate the current grazing practices in the region (Mislevy, 2002).
An area of 7.5 m2 was harvested with a grass mower machine, cutting the grass to a height of 5 cm from the surface. The biomass of each plot was weighed to estimate the yield. Grass harvested from the entire plot was then mixed, and a representative sample of 25 g was taken and dried at 60°C for 72 h. These samples were milled to 1 mm in a Wiley mill (Model # 2, Arthur H. Thomas Co., PA, USA). DM was determined by drying the samples at 105°C for 24 h. Total N was analyzed by the Kjeldahl method, which was then multiplied by 6.25 to estimate crude protein (CP) (AOAC International, 2000).
Yield-scaled gas emissions were then calculated as the ratio between accumulated NH3, N2O, and CH4 emissions and the total N crop yield for each treatment for the whole period of the study.
NUE was calculated by the equation:
where DMN and DMCK are the grass yield (kg ha−1) produced by S or SNI and CK, respectively. CPN and CPCK are the N fraction of the harvested material from S or SNI and CK, respectively, and N is the N applied (kg ha−1).
Statistical Analysis
Mineral N and gas emissions were analyzed using the R software version 3.6.1. Yield and grass quality analysis were performed by PROC MIXED (SAS/STAT version 9.2). Data distribution normality and variance uniformity were evaluated by the Shapiro-Wilk's and Levene's tests, respectively. The data without normal distribution (NH3 volatilization, CH4 emissions, , and soil content) were analyzed by the Kruskal-Wallis test. For normally distributed data, the comparison between treatments was carried out by analysis of variance (ANOVA), and Tukey's test was performed to find significant differences between means at P < 0.05.
The yield-scaled NH3 and N2O emissions were compared using the 95% confidence interval calculated from the expanded uncertainty of the yield-scaled gas emission (YSi) based on the mean of cumulative gas emissions (ĒCi) and of accumulated yield (ȲCi) of N2O or NH3:
where SDECi and SDYCi are the standard deviations of cumulative emissions and the total yield of NH3 or N2O, respectively.
Results
Environmental Conditions
Gas emissions were affected by precipitation. Total rainfall from July to November 2017 at Alfredo Volio Mata Experiment Station was 1,280 mm, with November being the driest month (103 mm), and September the wettest (496 mm). High precipitation in September kept the WFPS between 50 and 60% throughout the fertilization cycle (Figure 1A).
During NH3 emission samplings, the highest wind speed was on day 5 after fertilization in July (3.6 m s−1). The highest mean wind speed was in July and November (2.6 and 2.3 m s−1, respectively) and the lowest in August (1.5 m s−1). Besides, the soil temperature (10 cm depth) showed little variation, with a mean temperature of 20.5 ± 1.7°C along the sampling periods of gases.
Gaseous Emissions
After subtracting the respective emissions from the control, NH3, N2O, and CH4 cumulative emissions expressed in CO2e (Supplementary Table 1 and Table 3) showed that the greatest effect as a driver of climate change is generated by direct N2O emissions (455 ± 140 to 479 ± 65 kg CO2e ha−1). In contrast, the impact on global warming of CH4 emission (3 ± 14 to −3 ± 7 kg CO2e ha−1), and, indirectly as N2O, of NH3 volatilization (2.6 ± 1 to 2.7 ± 1.5 kg CO2e ha−1) is much lower.
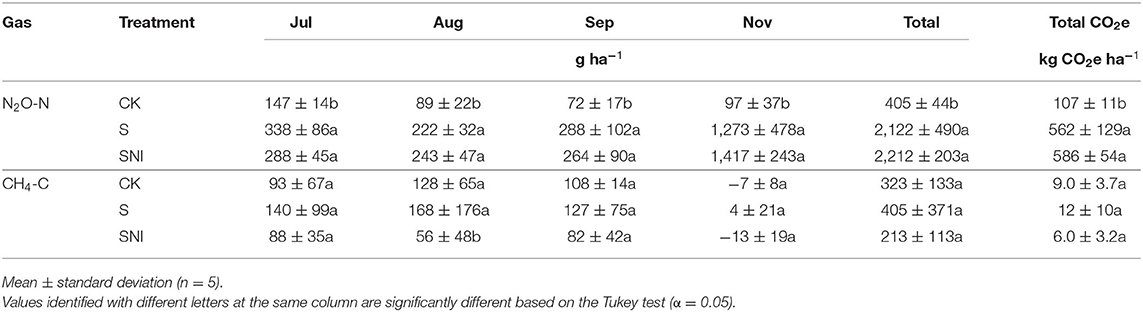
Table 3. Cumulative emissions of nitrous oxide (N2O) and methane (CH4) from control (CK), DFE (S), and DFE plus nitrapyrin (SNI) of a field trial conducted in 2017 on a permanent pasture in the Alfredo Volio Mata Experimental Station, Costa Rica.
NH3 Volatilization
As expected, NH3 volatilization potential from non-fertilized plots was lower than those from S and SNI (Figure 1B), but only significantly different (P < 0.05) during the first 26 h after the slurry application in November, when total NH3 volatilization reached 11.8 ± 2.1, 35.2 ± 3.2, and 42.5 ± 5.2 mg m−2 for CK, S, and SNI, respectively. These NH3 values constitute 13% (CK), 28% (S), and 31% (SNI) of the month's emissions. The rate of NH3 volatilization under the experimental conditions was significantly lower in July and September (P < 0.05) and, contrary to the expected, they did not show significant differences (P > 0.05) between the treatments CK, S, and SNI. Throughout 4 months, total potential cumulative volatilization of NH3 for S and SNI did not differ (3.6 ± 0.1 kg NH3 ha−1 vs. 3.6 ± 0.2 kg NH3 ha−1, respectively) (Supplementary Table 1).
The ratio between net cumulative volatilization of NH3 and N applied as DFE by surface broadcast was very low for both treatment S and SNI (S 0.67 ± 0.10% vs. SNI 0.64 ± 0.21%) during the rainy season.
N2O Emission
Plots fertilized with and without nitrapyrin resulted in N2O fluxes higher than those of the control treatment (P < 0.05) (Figure 1C). The maximum daily N2O fluxes were registered 24 h after the DFE application. This emission peak was higher for S (84 g N ha−1 day−1) in July than in August (38 g N ha−1 day−1) and September (40 g N ha−1 day−1), even when the N-fertilization rate had been lower (Table 3). In August, September, and November, the maximum daily N2O flux mentioned did not coincide with the soil peak reached from 3 to 5 days after applying the DFE (Supplementary Figure 2). On 6 July, the N2O emission from SNI, although not significantly greater than that registered for S (P = 0.57), contrasted with the lowest soil concentration in SNI plots (P = 0.057).
After the third day of slurry application, N2O emission peaks were also detected on 13 July, 6 August, and 5 November when the precipitation exceeded 20 mm and WFPS reached the values 53, 50, and 49% (Figure 1A). At the end of September (from 20 to 29) the N2O fluxes raised (4.9, 46, and 41 g N ha−1 day−1 for CK, S, and SNI, respectively), which are associated with a higher soil content (CK, S, and SNI, Supplementary Figure 2) detected on 29 September. Finally, N2O cumulative emissions were significantly higher (P < 0.05) in November (Table 3), a condition associated with an increment in the total N (58%), the -N (40%), and -N (197%) in this DFE fertilization cycle compared with the mean from July to September.
The N2O flux was significantly lower in the plots treated with the nitrapyrin only at the beginning of July (first cycle of DFE application) (Figure 1C). Cumulative emissions of N2O per application cycle were not significantly different (P > 0.05) between the plots fertilized with DFE with and without nitrapyrin (Table 3). The ratio between the N2O net cumulative emission throughout 4-month and the N applied on the surface was 1.60 ± 0.46 and 1.69 ± 0.19% for S and SNI, respectively.
CH4 Emissions
Emissions of CH4 from S, SNI, and CK showed a high variability (Figure 1D), with the fluxes from block 1 significantly higher. Daily emissions from SNI were significantly lower than those of S in August and November (P < 0.05). Except for November, a CH4 peak was not detected at the first sampling (20–22 h after slurry application), as was reported by Chadwick et al. (2000), Rodhe et al. (2006), and Mori and Hojito (2015).
Increases in CH4 emissions were observed when rainfall of 20 mm or more occurred (Figures 1A,D). On the other hand, emissions tended to zero in periods with several days without rain (e.g., 2 July to 10 July, 20 July to 31 July, and 20 September onwards). Moreover, in November, under drier conditions, CH4 cumulative emissions (Table 3) from the treatments were significantly lower (P < 0.05) and the soil acted as a sink for CH4, which is reflected by the negative flows showed (Le Mer and Roger, 2001).
Cumulative emissions of CH4 from SNI (from 88 to −13 g ha−1) tended to be less than CK and S treatments (Table 3). Cumulative fluxes of CH4 normalized by the volume applied per area showed values between 0 and 2.8 mg L−1 for S and −0.2 and 1.3 mg L−1 for SNI.
Grass Yield, Yield-Scaled Gaseous Emissions, and Grass Quality
The absence of N fertilization (CK) led to values of DM per hectare per harvest 470 ± 166 kg ha−1 significantly lower (P < 0.05) than fertilized plots. Thanks to N introduction into the system, the treatments S and SNI produced twice as much dry matter (1,000 ± 440 kg MS ha−1 and 850 ± 390 kg MS ha−1, respectively). No significant differences were observed in DM per hectare among plots fertilized with and without nitrapyrin (Table 4).
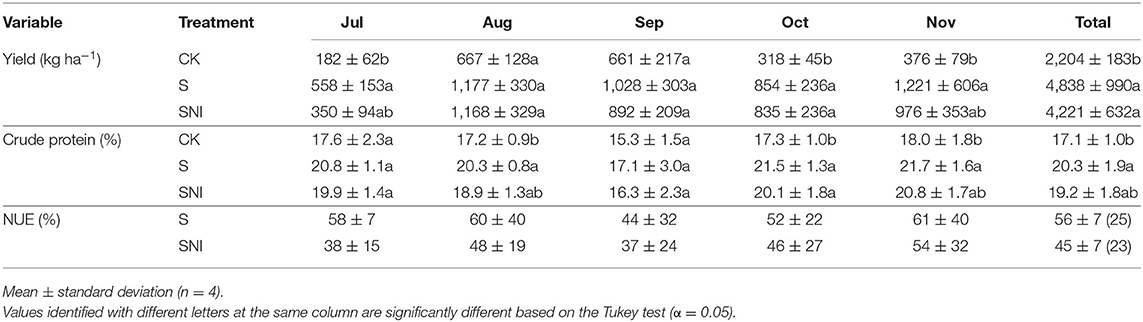
Table 4. Yield (dry matter) and crude protein mean of Cynodon nlemfuensis from control (CK), dairy farm effluent (S), and dairy farm effluent plus nitrapyrin (SNI) as well as the nitrogen use efficiency (NUE) of a field trial conducted in 2017 on a permanent pasture in the Alfredo Volio Mata Experimental Station, Costa Rica.
Under the prevailing experimental conditions, no significant difference between yield-scaled NH3 and N2O emissions from S and SNI (Table 5) were found.
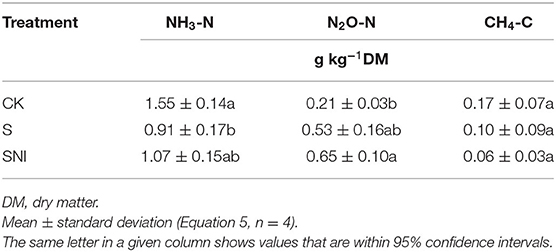
Table 5. Yield-scaled gas emissions per dry matter of grass from control (CK), DFE (S), and DFE plus nitrapyrin (SNI) of a field trial conducted in 2017 on a permanent pasture in the Alfredo Volio Mata Experimental Station, Costa Rica.
No differences were found in crude protein (CP) content between treatments under fertilization with and without nitrapyrin (Table 4). Nevertheless, the control exhibited a significantly lower CP value, in August, October, and November.
Discussion
NH3 Volatilization Potential
No significant differences in NH3 volatilization potential were found between CK and fertilized plots with DFE in July and September. This could have occurred due to the incorporation effect of rainfall following fertilization (4.2 mm in July and 44 mm in September), added to the volume of DFE applied (6–10 mm in few minutes). The effluent's low DM did not seal soil pores nor contributed to increasing water capacity retention, facilitating infiltration, and reducing N losses through NH3 volatilization (Sommer et al., 2003).
The significant drop in the NH3 volatilization rate on days 3 and 5 after the August and November fertilization when 22.2 and 10.9 mm precipitations affected the experimental site, suggests that monitoring of NH3 volatilization could be suspended after a 10-mm precipitation. A similar effect was reported by Arndt et al. (2020) in a loam soil after excreta application, who associated the effect of rainfall with quantity and timing. Recio et al. (2018) also measured no effect of NIs over NH3 after immediate incorporation of pig slurry in a Typic Calcixerept soil, in a Mediterranean agroecosystem of Central Spain. The result found by Recio et al. (2018) was likely caused by the immediate incorporation of the slurry following surface application. Based on these findings, it could be concluded that contrary to the expected increase in NH3 volatilization by nitrapyrin due to increased pool, the physical incorporation of the N fertilizer by mean of water or mechanically could hide this potential disbenefit of NIs in the form of increased NH3 losses (Sommer et al., 2003).
The ratio between NH3-N volatilized and N applied (0.6 ± 0.2%) is as low as the difference between the EFs of paddocks with excreta on the surface and with and without DFE (0.3%) reported by Arndt et al. (2020), who also measured dairy systems with very low DFE N and DM, typical of tropical regions. Apart from the low applied N amount (20–40 kg N ha−1), slurry dilution has been identified as a management practice that contributes to low NH3 cumulative emission (Frost, 1994; VanderZaag et al., 2011). This effect may due to the rapid DFE infiltration facilitated by the low DM content (Saggar et al., 2004), even though the infiltration rate was only 7.8 mm h−1 at the study site.
The non-significant difference in NH3 volatilization between S and SNI, mainly due to the low volatilization of NH3 already discussed, was accentuated by soil conditions such as its slightly acidic pH and especially its high content of organic matter and its high cation exchange capacity which promote adsorption to the soil colloids (Bouwmeester et al., 1985; Zaman et al., 2009; Tian et al., 2015; Pérez-Castillo et al., 2021).
N2O Emission
N2O flux increased after 1 day of DFE application and came to the prefertilization levels after 3 days, a trend also observed by other authors in grasslands (Barton and Schipper, 2001; Luo et al., 2008; van der Weerden et al., 2016). It is probably due to the conducive environment (availability of N as a substrate, soluble C as energy source for denitrifiers, and anaerobic condition due to volumetric loading rate of applied DFE) (Barton and Schipper, 2001; Luo et al., 2008; Zaman et al., 2012; Saggar et al., 2013; Chen et al., 2014). As the N2O emission rate after DFE application highly depends on soil WFPS (Luo et al., 2008), the higher N2O emission in July (WFPS 50%) compared with that in August (WFPS 37%) was not surprising because of the anaerobic condition in July. Similar N2O emission rate observed in September (WFPS 58%) and in August, following DFE application, was probably due to a partial loss of the N applied by runoff, an effect caused by the heavy rainfalls before and after DFE application.
Nitrification and denitrification processes in a soil can occur simultaneously (Müller et al., 2014), therefore the low on 6 July was possibly associated with the inhibitory effect of nitrapyrin which slow down nitrification, while the highest N2O flux may be due to other N2O production processes such as heterotrophic nitrification and the conversion of organic N to mineral N (Müller et al., 2014), which were not measured in this study.
In November, significantly higher N2O emissions were triggered by the mineral N applied with the DFE (Saggar et al., 2015). Probably, the greater amount of -N increased the rate of autotrophic nitrification (Ruser and Schulz, 2015) and the tripled amount of promoted denitrification in the anaerobic soil microsites that coexist in the soil profile, especially when the microbial activity was enhanced by the DFE applied (Barton and Schipper, 2001; Sey et al., 2008; Martins et al., 2017).
After initial N2O emissions stimulated by the N and C applied through the DFE, soil moisture became more important as it was shown by N2O emission peaks observed after the third day of DFE application and associated with rainfalls greater than 20 mm (Zaman et al., 1999a,b; Bhandral et al., 2007). Those peaks are likely due to enhanced heterotrophic denitrification in anaerobic microsites (Smith et al., 1998; Dobbie and Smith, 2003; Ruser and Schulz, 2015). The heavy rainfall in September (489 mm between 1 and 17 September) favored an anoxic environment that maintained N2O emission at the baseline level since the third day after DFE was applied, probably due to its reduction until N2 (Wrage et al., 2001). As the precipitations ceased and soil saturation decreased (WFPS 60 vs. 57% and less), soil content mostly enhanced via heterotrophic nitrification (Monge-Muñoz et al., 2021) since there was not another mineral N source, increased N2O fluxes under suboptimal conditions for both nitrifiers and denitrifiers (Wrage et al., 2001). N2O peak on 20 September was also enhanced by the release of the N2O accumulated in soil solution and trapped in soil microsites, when gas diffusion was restricted by soil moisture (Davidson and Swank, 1990).
Contrary to that reported in other studies (McTaggart et al., 1997; Trenkel, 2010; Ruser and Schulz, 2015), no significant effect on the N2O emissions mitigation was found by nitrapyrin application in this field trial, a result similar to the one found when DFE (52–58 kg total N ha−1) was applied with DCD (52–58 kg total N ha−1) (van der Weerden et al., 2016). This is probably due to (i) the dominance of heterotrophic nitrification coupled with denitrification over the formation of N2O, a mechanism not affected by nitrapyrin (Müller et al., 2014; Monge-Muñoz et al., 2021), and (ii) the N application rate of 149 ± 12 kg N ha−1, lower than the 180 kg N ha−1 usually applied throughout a 5-month period, as well as the split application into five fertilizing events. This may have decreased nitrapyrin potential action as a nitrification inhibitor due to a low level of soil content (van der Weerden et al., 2016; Monge-Muñoz et al., 2021).
The ratio between the N2O total cumulative emission and the N applied as DFE using surface broadcast is in the range reported by Saggar et al. (2004) and greater than the emission of 1.2% of N applied as urea found at the same experimental area 1 year before (Pérez-Castillo et al., 2021). A larger N loss as N2O when using DFE compared with synthetic fertilizers has been reported previously with slurry (Barton and Schipper, 2001; FAO, 2006; Martínez-Lagos et al., 2014; Mori and Hojito, 2015). The higher availability of SOC and the increase in WFPS, triggered by the DFE application, can enhance denitrification rates by providing a source of energy for denitrifying bacteria and more anaerobic microsites in soil (VanderZaag et al., 2011; Cayuela et al., 2017; Akiyama et al. 2010). On the other hand, the decrease in NH3 emissions, caused by DFE infiltration favored by its low DM, likely generated a greater N2O production from residual N available. This pollution swapping in the form of increased N2O emissions has been reported by Bourdin et al. (2014) in Haplic Cambisol Brown Earth soil with high soil moisture.
CH4 Emissions
CH4 peak was not detected at the first sampling (20–22 h after slurry application), in contrast with that observed by Chadwick et al. (2000), Rodhe et al. (2006), and Mori and Hojito (2015). They found that the highest emissions occurred after the application of slurry, which suggests that the initial flow due to the volatilization of CH4 dissolved was likely not sampled.
Daily emissions from SNI were significantly lower than S in August and November (P < 0.05). Previous studies have reported this mitigating effect on the CH4, produced through microbial fermentation of cellulose under anaerobic conditions, by using NIs as 3,4-dimethylpyrazole phosphate (DMPP) (Weiske et al., 2001; Trenkel, 2010).
Changes in CH4 fluxes dependent on rainfall reflected the variation of the soil anaerobic microsites and, therefore, the increase or decrease of anaerobic sites for the methanogenic fermentation of organic matter (Saggar et al., 2004, Faverin et al., 2014).
Although the soil at the experimental site acted as a net emitter (Table 3), this result cannot be extrapolated to the annual cycle because our research only included part of the rainy season and the beginning of the transition period toward the dry season. In medium-term studies, such as that reported by Rodhe et al. (2006), authors observed the soil acting as a sink for CH4 when applying slurry in pastures soils of north of Stockholm with 2.1% of organic matter. Cumulative fluxes of CH4 normalized by the volume applied per area, for both S and SNI were lower than the 6.8 mg L−1 reported by Chadwick et al. (2000) under lower temperatures.
Grass Yields, Yield-Scaled Gaseous Emissions and CP
As shown in Table 4, the DM production in each harvest was low (> 1,000 kg ha−1 per harvest) compared with the DM results obtained by Salazar (2007) and Villalobos and Arce (2013). These authors reported for Costa Rica averages of 4,642 and 4,484 kg DM ha−1 in San Carlos and Monteverde, respectively, with a rate of 250 kg N ha−1 year−1, higher than the equivalent to 180 kg N ha−1 year−1 used in this field trial. Despite yield production obtained in pastures vary widely since they depend on climatic conditions such as temperature, duration and intensity of light, quantity and distribution of rainfall and humidity and soil fertility (Crespo et al., 1981), management of fertilization, harvest periods, and harvesting height could explain the decrease in DM production of this field trial. DM production was affected by a low N rate and the relationship between total N and N available for the grass, which is affected by the mineralization rate in the case of slurry (Burger and Venterea, 2008).
Apart from the reduction in the N input to the system, the decrease in productivity could be due to the use of the mower for harvest. This equipment removes more biomass than grazing, so it left a smaller remaining leaf area that would have delayed grass development within the fixed cutting cycle (Johnson et al., 2001). A yield of 1,423 kg DM ha−1 in cycles of 28 days was reported in Florida, USA (Johnson et al., 2001) when harvesting with a machine at 7 cm height and applying a dose of 39 kg N per application. This yield is low with respect to other grazing studies due to the cutting effect, but it is still higher than what was obtained in this field assay, possibly due to the greater amount of applied fertilizer and a higher cut.
Our results suggest that nitrapyrin did not positively affect biomass production under the pedo-climatic conditions of this study, as could be expected from the percentage of N lost as N2O (around 1.6%). Besides, under the prevailing experimental conditions, the lack of a significant difference between yield-scaled NH3 and N2O emissions from S and SNI suggests that nitrapyrin is not a viable mitigation option for gaseous N losses from our grassland. These results agree with those of our earlier field trial receiving urea at 250 kg N ha−1 at the Alfredo Volio Experimental Station (Pérez-Castillo et al., 2021). Even though this experiment was carried out using a suboptimal N rate, condition that has been suggested could show NI potential to increased yields regarding fertilizers without them (Rose et al., 2018).
The CP content value around 20% for the forage for both S and SNI was similar to that established in the literature (Sánchez and Soto, 1996; Salazar, 2007; Villalobos and Arce, 2014). As the control showed a lower CP value, fertilization can improve forage protein concentration and agrees with other trials conducted with Cynodon (Johnson et al., 2001; Zanine et al., 2003). In contrast with these results, Zanine et al. (2005) reported that CP content was not affected by increasing in equal measure the applied dose of N per hectare through slurries, in Panicum maximum. This suggests that forage type may influence the effect of N fertilization on CP content (Table 4).
Limitations of the Study
There are several limitations in our study that, in our opinion, should be highlighted to better interpret the results shown in this paper. First of all, the area designated for yield and forage quality (7.5 m2) could be seen as small compared with other grassland studies (Timpong-Jones et al., 2015). This resulted in high standard errors in the yield measurements and pointed out that greater harvest area and more replications per treatment are needed for the Star Grass yield measurements.
Sampling for CH4 emissions should have begun in the first 12 h after DFE application to capture the emission peak from dissolved CH4. Besides, measurements of CH4 emissions from anaerobic pits, where they are collected, are needed since most of the CH4 total emissions are produced during storage (Saggar et al., 2004). In Costa Rica, there are no published data for CH4 emissions from pits nor data on the proportion of DFE collected and applied directly. These elements shall be two priority aspects for Livestock NAMA of Costa Rica to estimate CH4 emissions from DFE management.
Conclusion
The composition of DFE, characterized by low DM content associated with rapid infiltration rate, led to low losses of NH3. The residual available N is likely contributed to greater N2O production per kilogram of N applied under the rainy season. Costa Rican dairy farmers should protect the storage facilities of DFE from excess rainwater which dilute the N concentration and increase the volumetric loading rate to mitigate N2O emission via denitrification.
More data are required to understand the relationship between nitrification inhibitors and CH4 flux mitigation, as well as their effect on soil microbial populations in tropical grasslands.
Based on yield-scaled gaseous emissions and total of CO2e of S and SNI, nitrapyrin may not be viable mitigation option for gaseous N release from DFE application in Costa Rican grasslands during the rainy season.
Data Availability Statement
The original contributions presented in the study are included in the article/Supplementary Materials, further inquiries can be directed to the corresponding author/s.
Author Contributions
AP-C, JE-S, MZ, and AS-C designed the study. JA-M conducted the fieldwork with essential contributions from AP-C and MM-M. JA-M performed biomass and grass quality analysis. MM-M supported the NH3, NO3−, and NH4+ analysis. AP-C with essential contributions from JA-M analyzed N2O and CH4 fluxes. AP-C, JE-S, JA-M, MM-M, and AS-C performed the data analysis. AP-C, JE-S, and AS-C wrote the manuscript and all co-authors contributed to the final version of the paper. All authors contributed to the article and approved the submitted version.
Funding
This work was funded by the International Atomic Energy Agency (IAEA), Vienna, Austria, through a Coordinated Research Project (No. CRP D1.50.16) of the Soil and Water Management and Crop Nutrition Section, Joint FAO/IAEA Division of Nuclear Techniques in Food and Agriculture, through the Technical Cooperation Project (No. COS5031), and by the University of Costa Rica (No. VI-802-B7-505).
Conflict of Interest
The authors declare that the research was conducted in the absence of any commercial or financial relationships that could be construed as a potential conflict of interest.
Supplementary Material
The Supplementary Material for this article can be found online at: https://www.frontiersin.org/articles/10.3389/fsufs.2021.620846/full#supplementary-material
Supplementary Figure 1. Plots distribution scheme of the treatments control (CK), surface application of dairy farm effluents with (SNI) and without nitrapyrin (S) for monitoring biomass and protein crude (A) and flux of gases (B), in a field trial conducted in 2017 on a permanent pasture in the Alfredo Volio Mata Experimental Station, Costa Rica.
Supplementary Figure 2. Ammonium () (A) and nitrate () (B) soil content (0–10 cm) from control (CK), dairy farm effluents (S), and dairy farm effluents plus nitrapyrin (SNI) of a field trial conducted in 2017 on a permanent pasture in the Alfredo Volio Mata Experimental Station, Costa Rica. Vertical bars indicate the standard error (n = 5). Arrows indicate the moment when dairy farm effluents were applied.
Supplementary Table 1. Potential cumulative ammonia volatilization (NH3) from control (CK), surface application of DFE with (SNI), and without nitrapyrin (S) of a field trial conducted in 2017 on a permanent pasture in the Alfredo Volio Mata Experimental Station, Costa Rica.
References
Abbasi, M. K., and Adams, W. A. (2000). Estimation of simultaneous nitrification and denitrification in grassland soil associated with urea-N using N-15 and nitrification inhibitor. Biol. Fertil. Soils. 31, 38–44. doi: 10.1007/s003740050621
Akiyama, H., Yan, X., and Yag, K. (2010). Evaluation of effectiveness of enhanced-efficiency fertilizers as mitigation options for N2O and NO emissions from agricultural soils: meta-analysis. Global Change Biol. 16, 1837–1846. doi: 10.1111/j.1365-2486.2009.02031.x
AOAC International (2000). Official Methods of Analysis. 16th Edn. Washington, D.C: AOAC International.
Araújo, E., Marsola, T., Miyazawa, M., Soares, L., Urquiaga, S., Boddey, R., et al. (2009). Calibração de câmara semiaberta estática para quantificação de amônia volatilizada do solo. Pesqui. Agropecu. Bras. 44, 769–776. doi: 10.1590/S0100-204X2009000700018
Arndt, C., Misselbrook, T. H., Vega, A., Gonzalez-Quintero, R., Chavarro-Lobo, J. A., Mazzetto, A. M., et al. (2020). Measured ammonia emissions from tropical and subtropical pastures: A comparison with 2006 IPCC, 2019 Refinement to the 2006 IPCC, and EMEP/EEA (European Monitoring and Evaluation Programme and European Environmental Agency) inventory estimates. J Dairy Sci. 103, 6706–6715. doi: 10.3168/jds.2019-17825
Barton, L., and Schipper, L. (2001). Regulation of nitrous oxide emissions from soils irrigated with dairy farm effluent. J. Environ. Qual. 30, 1881−1887. doi: 10.2134/jeq2001.1881
Beeckman, F., Motte, H., and Beeckman, T. (2018). Nitrification in agricultural soils: impact, actors and mitigation. Curr Opin Biotechnol. 50, 166–173. doi: 10.1016/j.copbio.2018.01.014
Bhandral, R., Bolan, N. S., Saggar, S., and Hedley, M. J. (2007). Nitrogen transformation and nitrous oxide emissions from various types of farm effluents. Nutr. Cycling Agroecosyst. 79, 193–208. doi: 10.1007/s10705-007-9107-5
Bolleter, W. T., Bushman, C. J., and Tidwell, P. W. (1961). Spectrophotometric determination of ammonia as indophenol. Anal. Chem. 33, 592–594. doi: 10.1021/ac60172a034
Borges, J., Barrios, M., and Escalona, O. (2012). Effect of organic and inorganic fertilization on star grass (Cynodon nlemfuensis) agro-production and chemical composition. Zootecnia Tropical. 30, 17–25.
Bourdin, F., Sakrabani, R., Kibblewhite, M. G., and Lanigan, G. J. (2014). Effect of slurry dry matter content, application technique and timing on emissions of ammonia and greenhouse gas from cattle slurry applied to grassland soils in Ireland. Agricult. Ecosyst. Environ. 188, 122–133. doi: 10.1016/j.agee.2014.02.025
Bouwmeester, R. J. B., Vlek, P. L. G., and Stumpe, J. M. (1985). Effect of environmental factors on ammonia volatilization from a urea-fertilized soil. Soil Sci. Soc. Am. J. 49, 376–381. doi: 10.2136/sssaj1985.03615995004900020021x
Brouwer, C., Prins, K., Kay, M., and Heibloem, M. (1988). Irrigation water management: irrigation methods. Train. Manual 9:2.
Burger, M., and Venterea, R. T. (2008). Nitrogen immobilization and mineralization kinetics of cattle, hog, and turkey manure applied to soil. Soil Sci. Soc. Am. J. 72, 1570–1579. doi: 10.2136/sssaj2007.0118
Cayuela, M. L., Aguilera, E., Sanz-Cobena, A., Adams, D. C., Abalos, D., Barton, L., et al. (2017). Direct nitrous oxide emissions in Mediterranean climate cropping systems: emission factors based on a meta-analysis of available measurement data. Agric. Ecosyst. Environ. 238:25–35. doi: 10.1016/j.agee.2016.10.006
Chadwick, D., Pain, B., and Brookman, S. (2000). Nitrous oxide and methane emissions following application of animal manures to grassland. J. Environ. Qual. 29, 277–287. doi: 10.2134/jeq2000.00472425002900010035x
Chen, Z. M., Ding, W. X., Luo, Y. Q., Yu, H. Y., Xu, Y. H., Müller, C., et al. (2014). Nitrous oxide emissions from cultivated black soil: A case study in Northeast China and global estimates using empirical model. Global Biogeochem. Cycles. 28, 1311–1326. doi: 10.1002/2014GB004871
Christiansen, J. R., Outhwaite, J., and Smukler, S. M. (2015). Comparison of CO2, CH4 and N2O soil-atmosphere exchange measured in static chambers with cavity ring-down spectroscopy and gas chromatography. Agric. For. Meteorol. 211–212, 48–57. doi: 10.1016/j.agrformet.2015.06.004
Crespo, G., Ramos, N., Suarez, J., Herrera, S., and González, S. (1981). Pasture production and quality (In Spanish). Rev. Cub. Cienc Agri. 15, 211–225.
Cui, P., Fan, F., Yin, C., Li, Z., Song, A., Wan, Y., et al. (2013). Urea- and nitrapyrin-affected N2O emission is coupled mainly with ammonia oxidizing bacteria growth in microcosms of three typical Chinese arable soils. Soil Biol. Biochem. 66, 214–221. doi: 10.1016/j.soilbio.2013.08.001
Davidson, E. A., and Swank, W. T. (1990). Nitrous oxide dissolved in soil solution: An insignificant pathway of nitrogen loss from a southeastern hardwood forest. Water Res. Res. 26, 1687–1690. doi: 10.1029/WR026i007p01687
de Klein, C., Harvey, M., Clough, T. J., Petersen, S. O., Chadwick, D. R., and Venterea, R. T. (2020). Global Research Alliance N2O chamber methodology guidelines: Introduction, with health and safety considerations. J. Environ. Qual. 49, 1073–1080. doi: 10.1002/jeq2.20131
Dobbie, K., and Smith, K. (2003). Nitrous oxide emission factors for agricultural soils in Great Britain: the impact of soil water-filled pore space and other controlling variables. Global Change Biol. 9, 204–218. doi: 10.1046/j.1365-2486.2003.00563.x
Elizondo, J., and Boschini, C. (2001). Effect of plant density on yield and quality of corn fodder. Agron. Mesoam. 12, 181–187. doi: 10.15517/am.v12i2.17231
Elizondo-Salazar, J., and Jiménez-Castro. (2014). Phosphorous balance on Costa Rican dairy farms. Agron. Costarricense. 38, 189–197.
Fangueiro, D., Hjorth, M., and Gioelli, F. (2015b). Acidification of animal slurry. A review. J. Environ. Manage. 149, 46–56. doi: 10.1016/j.jenvman.2015.07.032
Fangueiro, D., Pereira, J., Bichana, A., Surgy, S., Cabral, F., and Coutinho, J. (2015a). Effects of cattle-slurry treatment by acidification and separation on nitrogen dynamics and global warming potential after surface application to an acidic soil. J. Environ. Manage. 162, 1–8.
FAO. (2006). Livestock's Long Shadow. Environmental Issues and Options. Rome: Food and Agriculture Organization.
Faverin, C., Gratton, R., and Machado, C. (2014). Greenhouse gas emissions in pasture-based beef cattle production systems. a review. Rev. Argent. Produc. Animal 34, 33–54.
Franco, K., Leyda, L., and Kallen, S. (2019). Life smart fertirrigation: integrated pig manure processing for direct injection of organic liquid fertilizer into irrigation systems. Proceedings 2019, 30–92. doi: 10.3390/proceedings2019030092
Frost, J. P. (1994). Effect of spreading method, application rate and dilution on ammonia volatilization from cattle slurry. Grass Forage Sci. 49, 391–400. doi: 10.1111/j.1365-2494.1994.tb02015.x
Glaesner, N., Kjaergaard, C., Rubaek, G., and Magid, J. (2011). Interactions between soil texture and placement of dairy slurry application: I. Flow characteristics and leaching of nonreactive components. J. Environ. Qual. 40, 337–343. doi: 10.2134/jeq2010.0317
Herr, C., Mannheim, T., Müller, T., and Ruser, R. (2020). Effect of nitrification inhibitors on N2O emissions after cattle slurry application. Agronomy. 10:1174. doi: 10.3390/agronomy10081174
Huertas, J., Cuevas, L., Paulino, F., Salazar, J., Arum,í, J., and Dörner, F. (2016). Dairy slurry application to grasslands and groundwater quality in a volcanic soil. J. Soil Sci. Plant Nutr. 16, 745–762.
Iñamagua, J., Jenet, A., Alarcón, L., Vilchez, S., Casasola, F., and Wattiaux, M. (2016). Environmental and economic impacts of feeding strategies in Costa Rican dairy farms. Agron. Mesoam. 27, 1–17. doi: 10.15517/am.v27i1.21874
INEC (2020) National Agricultural Survey 2019 (In Spanish). San José: Instituto Nacional de Estadísitca y Censo.
IPCC (2019). “N2O Emissions from managed soils, and CO2 emissions from lime and urea application,” in 2019 Refinement to the 2006 IPCC Guidelines for National Greenhouse Gas Inventories, eds E. Buendia, K. Tanabe, A. Kranjc, J. Baasansuren, M. Fukuda, S. Ngarize, A. Osako, Y. Pyrozhenko, P. Shermanau, and S. Federici, S. (Calvo: IPCC).
Jantalia, C. P., Halvorson, A. D., Follett, R. F., Alves, B. J. R., Polidoro, J. C., and Urquiaga, S. (2012). Nitrogen source effects on ammonia volatilization as measured with semi-static chambers. Agro. J. 104, 1595–1603. doi: 10.2134/agronj2012.0210
Johnson, C., Reiling, B., Mislevy, P., and Hall, M. (2001). Effects of nitrogen fertilization and harvest date on yield, digestibility, fiber, and protein fractions of tropical grasses. J. Animal Sci. 79, 2439–2448. doi: 10.2527/2001.7992439x
Kim, D. G., Saggar, S., and Roudier, P. (2012). The effect of nitrification inhibitors on soil ammonia emissions in nitrogen managed soils: a meta-analysis. Nutr. Cycling Agroecosyst. 93, 51–64. doi: 10.1007/s10705-012-9498-9
Le Mer, J., and Roger, P. (2001). Production, oxidation, emission and consumption of methane by soils: a review. Euro. J. Soil Biol. 37, 25–50. doi: 10.1016/S1164-5563(01)01067-6
Li, J., Luo, J., Shi, Y., Lindsey, S., Houlbrooke, D., and Ledgard, S. (2015). Nitrous oxide emissions from dairy farm effluent applied to a new zealand pasture soil. Soil Use Manage. 31, 279–289. doi: 10.1111/sum.12187
Lin, S., and Hernandez-Ramirez, G. (2020). Nitrous oxide emissions from manured soils as a function of various nitrification inhibitor rates and soil moisture contents. Sci. Total Environ. 738, 1–13. doi: 10.1016/j.scitotenv.2020.139669
Luo, J., Saggar, S., Bhandral, R., Bolan, N., Ledgard, S., Stuart, L., et al. (2008). Effects of irrigating dairy-grazed grassland with farm dairy effluent on nitrous oxide emissions. Plant Soil 309, 119–130. doi: 10.1007/s11104-008-9550-3
MAG (2012). Executive Decree 37017. Authorizes the Use of Slurry From Cattle as an Improver of the Physical, Chemical and Microbiological Characteristics of the Soil (In Spanish). San José, CA: Ministerio de Agricultura y Ganadería.
MAG (2019). Costa Rica, on the Road to Decarbonizing Livestock 2013-2018 (In Spanish). San José, CA: Ministerio de Agricultura y Ganadería.
Martínez-Lagos, J., Salazar, F., Alfaro, M., Rosas, M., Rampoldi, E., and Macías, F. (2014). Edaphoclimatic factors that affect ammonia emissions from the application of urea and dairy slurry in Andosols. Chilean J. Agricult. Animal Sci. 30, 15–28.
Martins, M., Santanna, S., Zaman, M., Santos, R., Monteiro, R., Alves, B., et al. (2017). Strategies for the use of urease and nitrification inhibitors with urea: Impact on N2O and NH3 emissions, fertilizer-15N recovery, and maize yield in a tropical soil. Agric. Ecosyst. Environ. 247, 54–62. doi: 10.1016/j.agee.2017.06.021
Mata, R., Vázquez, A., Rosales, A., and Salazar, D. (2016). Digital Soil Map of Costa Rica. San José, CA: Costa Rican Association of Soil Science.
McTaggart, L., Clayton, H., Parker, J., Swan, L., and Smith, K. (1997). Nitrous oxide emissions from grassland and spring barley, following N fertilizer application with and without nitrification inhibitors. Biol. Fertil. Soils. 25, 261–298.
Merino, P., Estavillo, J. M., Graciolli, L. A., Pinto, M., Lacuesta, M., Muñoz-Rueda, A., et al. (2002). Mitigation of N2O emissions from grassland by nitrification inhibitor and Actilith F2 applied with fertilizer and cattle slurry. Soil Use Manage. 18, 135–141. doi: 10.1079/SUM2002120
Merino, P., Menéndez, S., Pinto, M., González-Murua, C., and Estavillo, J. M. (2005). 3, 4-Dimethylpyrazole phosphate reduces nitrous oxide emissions from grassland after slurry application. Soil Use Manage. 21, 53–57. doi: 10.1079/sum2005292
Mislevy, P. (2002). Star Grass. Florida Cooperative Extension Service, Institute of Food and Agricultural Sciences. Gainesville: University of Florida.
Monge-Muñoz, M., Urquiaga, S., Müller, C., Cambronero-Heinrichs, J., Zaman, M., Chinchilla-Soto, C., et al. (2021). Nitrapyrin effectiveness in reducing nitrous oxide emissions decreases at low doses of urea in an Andosol. Pedosphere 31, 303–313. doi: 10.1016/S1002-0160(20)60072-8
Mori, A., and Hojito, M. (2015). Effect of dairy manure type and supplemental synthetic fertilizer on methane and nitrous oxide emissions from grassland in Nasu, Japan. Soil Sci. Plant Nutr. 61, 347–358. doi: 10.1080/00380768.2014.981676
Müller, C., Laughlin, R. J., Spott, O, and Rütting, T. (2014). Quantification of N2O emission pathways via a 15N tracing. Soil Biol. Biochem. 72, 44–54. doi: 10.1016/j.soilbio.2014.01.013
Myhre, G. D., Shindell, F.-M., Bréon, W., Collins, J., Fuglestvedt, J., Huang, D., et al. (2013). “Anthropogenic and natural radiative forcing,” in Climate Change 2013: The Physical Science Basis. Contribution of Working Group I to the Fifth Assessment Report of the Intergovernmental Panel on Climate Change. eds T. F. Stocker, D. Qin, G.-K. Plattner, M. Tignor, S.K. Allen, J. Boschung, (Cambridge; New york, NY: Cambridge University Press).
Owusu-Twum, M. Y., Loick, N., Cardenas, L. M., Coutinho, J., Trindade, H., and Fangueiro, D. (2017). Nitrogen dynamics in soils amended with slurry treated by acid or DMPP addition. Biol. Fertil Soils 53, 339–347. doi: 10.1007/s00374-017-1178-0
Pérez-Castillo, A. G., Chinchilla-Soto, C., Elizondo-Salazar, J. A., Barboza, R., Kim, D. G., Müller, C., et al. (2021). Nitrapyrin did not affect yield-scaled nitrous oxide emissions in a tropical grassland. Pedosphere 31, 265–278. doi: 10.1016/S1002-0160(20)60070-4
Ravishankara, A. R., Daniel, J. S., and Portmann, R. W. (2009). Nitrous oxide (N2O): the dominant ozone-depleting substance emitted in the 21st century. Science 326, 123–125. doi: 10.1126/science.1176985
Recio, J., Vallejo, A., Le-Noë, J., Garnier, J., García-Marco, S., Álvarez, J. M., et al. (2018). The effect of nitrification inhibitors on NH3 and N2O emissions in highly N fertilized irrigated Mediterranean cropping systems. Sci. Total Environ. 636, 427–436. doi: 10.1016/j.scitotenv.2018.04.294
Regueiro, I., Coutinho, J., and Fangueiro, D. (2016). Alternatives to sulfuric acid for slurry acidification: impact on slurry composition and ammonia emissions during storage. J. Cleaner Product. 131, 296–307. doi: 10.1016/j.jclepro.2016.05.032
Rivera, A. (2008). Nutrient Absorption Curves During the Establishment of Paddocks: Total Absorption of Nutrients and Effects of Excreta, During Rotational Grazing With Dairy Cattle, in Kikuyo (Kikuyochloa calndestinum), African Star (Cynodon nlemfuensis) and Toledo (Brachiaria brizantha cv). Thesis Magister Scientiae (San José, CA: University of Costa Rica).
Rodhe, L., Pell, M., and Yamulki, S. (2006). Nitrous oxide, methane and ammonia emissions following slurry spreading on grassland. Soil Use Manage. 22, 229–237. doi: 10.1111/j.1475-2743.2006.00043.x
Rose, T. J., Wood, R. H., Rose, M. T., and Van Zwieten, L. (2018). A re-evaluation of the agronomic effectiveness of the nitrification inhibitors DCD and DMPP and the urease inhibitor NBPT. Agricult. Ecosyst. Environ. 252, 69–73. doi: 10.1016/j.agee.2017.10.008
Ruser, R., and Schulz, R. (2015). The effect of nitrification inhibitors on the nitrous oxide (N2O) release from agricultural soils-a review. J Plant Nutr Soil Sci. 178, 171–188. doi: 10.1002/jpln.201400251
Saggar, S., Bolan, N. S., Bhandral, R., Hedley, C. B., and Luo, J. (2004). A review of emissions of methane, ammonia, and nitrous oxide from animal excreta deposition and farm effluent application in grazed pastures. New Zealand J. Agricult. Res. 47, 513–544. doi: 10.1080/00288233.2004.9513618
Saggar, S., Giltrap, D., Davison, R., Gibson, R., De Klein, C., Rollo, M., et al. (2015). Estimating direct N2O emissions from sheep, beef, and deer grazed pastures in New Zealand hill country: accounting for the effect of land slope on the N2O emission factors from urine and dung. Agricult. Ecosyst. Environ. 205, 70–78. doi: 10.1016/j.agee.2015.03.005
Saggar, S., Jha, N., Deslippe, J., Bolan, N. S., Luo, J., Giltrap, D. L., et al. (2013). Denitrification and N2O:N2 production in temperate grasslands: processes, measurements, modelling and mitigating negative impacts. Sci. Total Environ. 465, 173–195. doi: 10.1016/j.scitotenv.2012.11.050
Salas-Camacho, R., and Hernández Salas, J. (2008). Dairy excreta. A Waste or a By-product? (In Spanish) National Dairy Congress 2008. Proleche: Centro de Investigaciones Agronómicas, Universidad de Costa Rica and Programa de Transferencia Tecnolóógica Compañía Dos Pinos.
Salas-Camacho, R., and Uribe-Lorío, L. (2008). Effect of Addition of Dairy Farm Effluents (purines) on Some Chemical, Physical and Microbiological Characteristics of the Soil in the Hacienda Terranova Dairy Farm. Poasito, Alajuela, Costa Rica. Centro de Investigaciones Agronómicas, Universidad de Costa Rica; Programa de Transferencia Tecnológica Compañía Dos Pinos.
Salazar, F. (2015). Slurry and Dairy Effluents. The Environmental Impact. Livestock and grasslands. Chile: INIA.
Salazar, S. (2007). Biomass Availability and Nutritional Value of the African Star Grass (Cynodon nlemfuensis) in the District of Quesada, Canton of San Carlos. Bachelor's Thesis (University of Costa Rica).
Sánchez, J., and Soto, H. (1996). Estimated nutritive quality of forages in the San Carlos County. Costa Rica I. Dry matter and cellular components. Nutr. Animal Tropical. 3, 3–18.
Sanz-Cobena, A., Lassaletta, L., Aguilera, E., Prado, A., del Garnier, J., Billen, G., et al. (2017). Strategies for greenhouse gas emissions mitigation in Mediterranean agriculture: a review. Agricult. Ecosyst. Environ. 238, 5–24. doi: 10.1016/j.agee.2016.09.038
Sey, B. K., Manceur, A. M., Whalen, J. K., Gregorich, E. G., and Rochette, P. (2008). Small-scale heterogeneity in carbon dioxide, nitrous oxide and methane production from aggregates of a cultivated sandy-loam soil. Soil Biol. Biochem. 40, 2468–2473. doi: 10.1016/j.soilbio.2008.05.012
Smith, K., Thomson, P., Clayton, H., Mctaggart, I., and Conen, F. (1998). Effects of temperature, water content, and nitrogen fertilization on emissions of nitrous oxide by soils. Atmosph. Environ. 32, 3301–3309.
Sommer, S. G., Génermont, S., Cellier, P., Hutchings, N. J., Olesen, J. E., Morvan, T., et al. (2003). Processes controlling ammonia emission from livestock slurry in the field. Euro. J. Agronomy 19, 465–486. doi: 10.1016/S1161-0301(03)00037-6
Tian, Z., Wang, J. J., Liu, S., Zhang, Z., Dodla, S. K., and Myers, G. (2015). Application effects of coated urea and urease and nitrification inhibitors on ammonia and greenhouse gas emissions from a subtropical cotton field of the Mississippi delta region. Sci. Total Environ. 533, 329–338. doi: 10.1016/j.scitotenv.2015.06.147
Timpong-Jones, E. C., Adjorlolo, L. K., and Ayizanga, R. A. (2015). The impact of harvest frequency on herbage yield and quality of cynodon nlemfuensis. West African J. Appl. Ecol. 23, 7–15.
Trenkel, M. E. (2010). Slow and Controlled Release and Stabilized Fertilizer: An Option for Enhancing Nutrient Efficiency in Agriculture (Second). Paris: International Fertilizer Industry Association.
van der Weerden, T. J., Luo, J., Di, H. J., Podolyan, A., Phillips, R. L., Saggar, S., et al. (2016). Nitrous oxide emissions from urea fertiliser and effluent with and without inhibitors applied to pasture. Agricult. Ecosyst. Environ. 219, 58–70. doi: 10.1016/j.agee.2015.12.006
VanderZaag, A. C., Jayasundara, S., and Wagner-Riddle, C. (2011). Strategies to mitigate nitrous oxide emissions from land applied manure. Animal Feed Sci. Technol. 166–167, 464–479. doi: 10.1016/j.anifeedsci.2011.04.034
Villalobos, L., and Arce, J. (2013). Agronomic and nutritional evaluation of African star grass-based pastures (Cynodon nlemfuensis) in the region of Monteverde, Puntarenas, Costa Rica. I. Dry matter yield and phenology. Agron. Costarricense. 37, 91–101.
Villalobos, L., and Arce, J. (2014). Agronomic and nutritional evaluation of African star grass-based pastures (Cynodon nlemfuensis) in the region of Monteverde, Puntarenas, Costa Rica. II. nutritional value. Agron. Costarricense. 38, 133–145.
Weiske, A., Benckiser, G., Herbert, T., and Ottow, J. C. G. (2001). Influence of the nitrification inhibitor 3, 4-dimethylpyrazole phosphate (DMPP) in comparison to dicyandiamide (DCD) on nitrous oxide emissions, carbon dioxide fluxes and methane oxidation during 3 years of repeated application in field experiments. Biol. Fertil. Soils 34, 109–117. doi: 10.1007/s003740100386
Wolt, J. (2004). A meta-evaluation of nitrapyrin agronomic and environmental effectiveness with emphasis on corn production in the Midwestern USA. Nutr. Cycling Agroecosyst. 69, 23–41. doi: 10.1023/B:FRES.0000025287.52565.99
Wrage, N., Velthof, G. L., van Beusichem, M. L., and Oenema, O. (2001). Role of nitrifier denitrification in the production of nitrous oxide. Soil Biol. Biochem. 33, 1723–1732. doi: 10.1016/j.soilbio.2018.03.020
Yapur, M. (2011). Evaluation of a Dairy Farm Effluent Sprinkler Irrigation System. Master's Thesis. Catholic University, Argentina.
Zaman, M., Di, H. J., and Cameron, K. C. (1999b). Gross N-mineralization and nitrification rates and their relationships to enzyme activities and soil microbial biomass in soils treated with dairy shed effluent and ammonium fertilizer in the field. Soil Use Manage. 15:188–194. doi: 10.1111/j.1475-2743.1999.tb00087
Zaman, M., Di, H. J., Cameron, K. C., and Frampton, C. M. (1999a). Gross N mineralization and nitrification rates and their relationships to enzyme activities and soil microbial biomass in soils treated with dairy shed effluent and ammonium fertilizer at different water potentials. Biol. Fertil. Soils 29, 178–186. doi: 10.1007/s003740050542
Zaman, M., Nguyen, M. L., Šimek, M., Nawaz, S., Khan, M. J., Babar, M. N., et al. (2012). “Emissions of nitrous oxide (N2O) and di-nitrogen (N2) from agricultural landscape, sources, sinks, and factors affecting N2O and N2 ratios,” in Greenhouse Gases - Emission, Measurement and Management. ed G. Liu (Intech), 1–32. doi: 10.5772/32781
Zaman, M., Saggar, S., Blennerhassett, J. D., and Singh, J. (2009). Effect of urease and nitrification inhibitors on N transformation, gaseous emissions of ammonia and nitrous oxide, pasture yield and N uptake in grazed pasture system. Soil Biol. Biochem. 41, 1270–1280. doi: 10.1016/j.soilbio.2009.03.011
Zanine, A., Dias, P., Carvalho, J., and Souto, S. (2003). Accumulation of dry matter, nitrogen and phosphorus in the root and shoot in cultivars of Digitaria and Cynodon under the effect of nitrogen in the form of bovine manure. Tropical Grasslands 25, 42–46.
Zanine, A., Tavares, L., Dias, P., and Souto, S. (2005). Effect of nitrogen application, in the form of bovine manure, on the quality and yield of Tanzania pasture (Panicum maximum). Embrapa Agrobiol. 192, 7–19.
Zhang, Z., Gao, Q., Yang, J., Li, Y., Liu, J., Wang, Y., et al. (2020). The adsorption and mechanism of the nitrification inhibitor nitrapyrin in different types of soils: The adsorption of the nitrapyrin. R. Soc. Open Sci. 7:200259. doi: 10.1098/rsos.200259
Zhou, X., Wang, S., Ma, S., Zheng, X., Wang, Z., Lu, C., et al. (2020). Effects of commonly used nitrification inhibitors—dicyandiamide (DCD), 3,4-dimethylpyrazole phosphate (DMPP), and nitrapyrin—on soil nitrogen dynamics and nitrifiers in three typical paddy soils. Geoderma. 380:114637. doi: 10.1016/j.geoderma.2020.114637
Keywords: circular economy, dairy sector, mitigation, nitrification inhibitor, organic fertilizer, tropical grassland
Citation: Pérez-Castillo AG, Arrieta-Méndez J, Elizondo-Salazar JA, Monge-Muñoz M, Zaman M and Sanz-Cobena A (2021) Using the Nitrification Inhibitor Nitrapyrin in Dairy Farm Effluents Does Not Improve Yield-Scaled Nitrous Oxide and Ammonia Emissions but Reduces Methane Flux. Front. Sustain. Food Syst. 5:620846. doi: 10.3389/fsufs.2021.620846
Received: 23 October 2020; Accepted: 03 February 2021;
Published: 11 March 2021.
Edited by:
Giuseppina Rea, National Research Council (CNR), ItalyReviewed by:
Roland Bol, Helmholtz-Verband Deutscher Forschungszentren (HZ), GermanyDavid Robert Chadwick, Bangor University, United Kingdom
Carmen Gonzalez-Murua, University of the Basque Country, Spain
Copyright © 2021 Pérez-Castillo, Arrieta-Méndez, Elizondo-Salazar, Monge-Muñoz, Zaman and Sanz-Cobena. This is an open-access article distributed under the terms of the Creative Commons Attribution License (CC BY). The use, distribution or reproduction in other forums is permitted, provided the original author(s) and the copyright owner(s) are credited and that the original publication in this journal is cited, in accordance with accepted academic practice. No use, distribution or reproduction is permitted which does not comply with these terms.
*Correspondence: Ana Gabriela Pérez-Castillo, YW5hLnBlcmV6Y2FzdGlsbG9AdWNyLmFjLmNy