 Ariani C. Wartenberg
 Diana Moanga
 Matthew D. Potts
- Department of Environmental Science, Policy and Management, University of California, Berkeley, Berkeley, CA, United States
Increasing global food production and livelihoods while maintaining ecosystem health will require significant changes in the way existing farming landscapes are managed. To this end, developing a systemic understanding of the economic and ecological impacts of different cropping systems, and identifying trade-offs and synergies between them, is crucial to inform decision-making for policy makers and landowners. Here, we investigate the impacts of agricultural land-use change for 15 distinct crops in Kern County, California, by looking at spatial and temporal changes in ecosystem indicators. We focus our analysis on three agricultural ecosystem pressures (water use, soil erosion, and pesticide use) and three agricultural ecosystem services (profits, calorie production, and C sequestration). Between 2002 and 2018, agriculture in Kern County underwent a shift from annual row crop to nut tree crop production. At the landscape-scale, we found high increases in ecosystem service provision (total profits, calorie production, and annual C sequestration increased by 105, 29, and 37%, respectively), coupled with smaller changes in ecosystem pressures (total soil erosion and evapotranspiration increased by 10 and 5%, respectively, and total pesticide use declined by 4%). We identified no salient trade-offs or synergies among crops. Our results illustrate that in the highly productive agricultural hotspot of Kern County, a combination of changes in land-cover allocation or land-use efficiency may have mitigated stronger negative environmental impacts following a broad shift from annual to perennial crops.
Introduction
Global agricultural systems, situated at the nexus of human-nature interactions, are indispensable for human survival while also being a leading environmental stressor (Ramankutty et al., 2018). Beyond food production, agriculture systems are critical to global energy production (biofuels) as well as other commodities (Swinton et al., 2007). In addition, they currently provide 26% of direct global employment (World Bank, 2020). Today, agricultural systems worldwide are estimated to occupy 1.9 billion ha, equivalent to a third of all ice-free terrestrial land (Ramankutty et al., 2008; Teluguntla et al., 2015). They represent a major driver of global environmental degradation: agricultural irrigation is the biggest contributor to global water use (Wisser et al., 2008); poorly managed agricultural systems directly contribute to soil degradation (Lal, 2015) and declining pollinator populations (Potts et al., 2010); and rapid expansion of agricultural frontiers are driving forest loss and fragmentation, greenhouse gas emissions and biodiversity loss (Foley et al., 2011; Ramankutty et al., 2018). Minimizing the negative impacts of agriculture, while supporting farmer livelihoods and maintaining food and commodity crop production, remains one of the greatest challenges of the twenty-first century. Doing so will require prioritizing the preservation and restoration of remaining natural ecosystems, and improving the ecological health and resilience of existing agricultural landscapes (Rockström et al., 2017).
Today, much of the world's crops are produced in already-established farming regions (Rudel et al., 2009; Ramankutty et al., 2018). In these landscapes, land-use change and resulting impacts are driven by complex feedback interactions between technological, socioeconomic and ecological factors, which center around farmers' decision-making and landscape responses to these decisions (Benoît et al., 2012; van Vliet et al., 2015; Thomson et al., 2019). To “optimize” agricultural landscapes, for instance by maximizing nutritional and economic benefits while minimizing environmental degradation, requires an understanding of how such land-use decisions may influence essential ecosystem functions over time. Here, we aim to gain a systemic understanding of trade-offs and synergies in an agricultural context—characterized by a shift from annual to perennial crops over a 16-year period. We do this by assessing biophysical and socioeconomic indicators, selected to represent a range of agricultural ecosystem pressures and services, across a broad range of crop classes, and across temporal and spatial scales.
Field-based comparisons between crop systems and management practices show variable impacts on specific ecosystem functions, yield, and profitability levels. For example, agrobiodiverse farming systems, managed with a focus on promoting genetic, varietal or species diversity of field crops and surrounding plants, can support higher carbon sequestration, improved soil fertility and water-holding capacity, and better natural pest control and pollination services compared to non-diversified systems (Kremen and Miles, 2012; Rosa-Schleich et al., 2019). No-tillage farming similarly improves ecosystem resilience, carbon sequestration, nutrient and water cycling processes and biodiversity compared to conventionally tilled systems (Lal, 2013). There is a wealth of localized agronomic research which has assessed ecological functions and socioeconomic dimensions associated with farm-management decisions in many agricultural regions of the world (e.g., Eldon and Gershenson, 2015; Himmelstein et al., 2016; Daryanto et al., 2017). Often, however, quantitative studies focus on only one or two well-studied ecosystem services across different cropping systems or management regimes (Power, 2010; Leh et al., 2013), or focus on the provision of several services across a small number of cropping systems (Kearney et al., 2019). Scaling up these types of analyses across an entire agricultural landscape can provide new insights regarding ecological and socioeconomic values associated with different crops.
Despite an increase in research investigating multiple ecosystem functions in agricultural landscapes, spatially-explicit assessments of multiple ecosystem indicators remain limited (Barral et al., 2020; Chan and Satterfield, 2020). This may be exacerbated by the time- and labor-intensive nature of field-data collection, and frequent incompatibility of different datasets across a range of indicators, time points, scales, and geographic locations (Rindfuss et al., 2004; Feld et al., 2009). The development of spatially explicit ecosystem service models, like the Integrated Valuation of Ecosystem Services and Tradeoffs (InVEST) models (Natural Capital Project, 2019), allows researchers to circumvent this issue by integrating land-cover data with ecosystem service projection maps (Nelson et al., 2009; Tallis and Polasky, 2009; Leh et al., 2013). Often, large-scale ecosystem service assessments focus on comparisons between “cropland” and other land-use classes (Lawler et al., 2014). While this provides important insights regarding the potential consequences of unmitigated conversion of natural ecosystems, such approaches are not designed to address wide-ranging cropland heterogeneity. There is thus a knowledge gap in our understanding of how factors like crop- or management-choices may act as important, but potentially overlooked, drivers of landscape-scale changes in agroecosystems.
The increasing accuracy and range of spatially explicit and publicly available datasets constitutes an opportunity to develop an interdisciplinary assessment of agricultural land-use impacts within already developed agricultural areas. Here, we conceptualize land-use change as a combination of two types of farm-level decisions: land-cover allocation and land-use efficiency. We define land-cover allocation as the spatial distribution of crop species and commodities across a landscape, reflecting crop selection choices by farmers (Caiserman et al., 2019). Our concept of land-use efficiency extends the idea of crop yields (e.g., Quaye et al., 2010). Here we define land-use efficiency as a measure of resource use per given area of land: for instance, the amount of water used, or of carbon sequestrated, on one hectare of tomato cultivation. This reflects variability in factors like farm management practices, yield efficiency, or environmental parameters. Where satellite imagery and/or public records are available, changes in land-cover allocation are relatively straightforward to assess. However, changes in land-use efficiency are more difficult to capture, as they are driven by complex interactions between many factors. Rather than approximating these complex interactions, we use a mathematical approach to disentangle impacts related to changes in land-cover allocation or other factors.
The consequences of changes in land-cover allocation and land-use efficiency in developed agricultural landscapes are not well-understood. On the one hand, innovative technology or policy tools promoting improved land-use efficiency may lead to higher outputs without diminished ecosystem services. In parallel, environmental degradation through agricultural activity continues to be well-documented (Clark and Tilman, 2017; Thomson et al., 2019). We evaluate concrete outcomes of these dynamics by focusing on agricultural indicators which assess the positive effects (e.g., services) or negative effects (e.g., pressures) of agricultural activities on socioeconomic and ecological dimensions of agricultural systems. We specifically focus on a suite of indicators measurable at the landscape scale: pesticide use, water use, erosion risk, profit, calorie productivity, and carbon sequestration. Thus, in our study we attempt to better understand landscape-level outcomes by (i) assessing how agricultural land-cover change drives ecological and socioeconomic impacts over time; (ii) evaluating interactions between changes in land-cover allocation and land-use efficiency across agricultural indicators; and (iii) identifying synergies and trade-offs at landscape and individual crop scales. We examine these dynamics across a range of cultivation systems in California's southern Central Valley, a hotspot of agricultural production in the United States.
Methods
Study Region
We selected a study area in Kern County (Figure 1), located in the Southern Central Valley of California, and established on predominantly Yokuts and Chumash territory (Native Land Digital, 2020). Kern County is characterized by a semi-arid climate; during the period of our study (2002–2018) it experienced major drought events in 2007–2009 and 2012–2016 (Schauer and Senay, 2019). Climate change and reliance on agricultural irrigation, shown to contribute to local groundwater and surface water depletion (Faunt et al., 2016), have contributed to increasing local water-use concerns. In parallel, Kern's agricultural production has seen significant perennial crop expansion and decreases in annual crop production in recent years (Mall and Herman, 2019). Kern County is a hotspot for agricultural production and has consistently been ranked among the top agricultural counties in California (California Department of Food and Agriculture, 2021). Today, the county's agricultural production spans over 120 unique crop species (see Supplementary Table 1), cultivated on over 350,000 hectares of agricultural land (~16.5% of the county's land area), and contributing a gross value of $7.5 billion annually (Kern County Department of Agriculture and Measurement Standards, 2020).
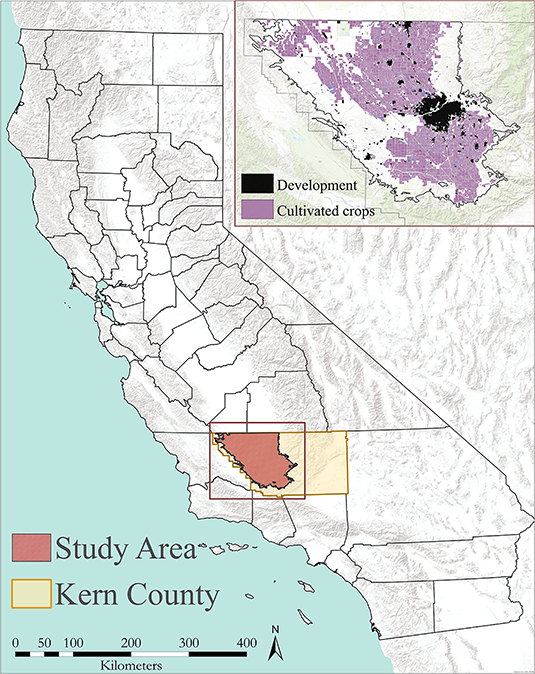
Figure 1. Study area in Kern County, California.
Data Collection and Integration
For this study we developed detailed crop-boundary maps of Kern County at the parcel-level for 2002 and 2018 (Moanga, 2020). We identified six locally relevant agricultural ecosystem indicators representing three agricultural ecosystem pressures (water use, erosion, and pesticide contamination) and three agricultural ecosystem services (profits, calorie production, and annual carbon sequestration). We define agricultural ecosystem pressures to refer to pathways through which human activity in agricultural systems may negatively impact ecosystem functioning (similar to “ecosystem disservices” as defined in Power, 2010), and agricultural ecosystem services to refer to services or benefits from agricultural systems that support human livelihoods or well-being (e.g., Costanza et al., 1997). We compiled datasets from multiple sources, including satellite-based data layers, spatially explicit farm survey results, county crop reports, pesticide safety datasheets, crop-specific literature, and agricultural extension estimates (see Supplementary Tables 2–4 for details). For the 2 study years (2002 and 2018) we converted all data to metric units and used ArcGIS Pro to combine them with our crop boundary maps. The resulting dataset contained spatially explicit data for each parcel and each crop in 2002 and 2018.
Land-Cover
Our land-cover maps were developed by integrating two publicly available datasets: annual crop data from Kern County, depicting parcel boundary polygons and crop commodities cultivated in each parcel for a given year; and bi-annual land-cover data detailing 11 broad land-use categories, developed by the California Farmland Mapping and Monitoring Program (FMMP). We created continuous land-cover shapefiles by merging both of these datasets using ArcGIS Pro (Moanga, 2020; Supplementary Table 2). The land-cover data presented in this study are therefore based on Kern County parcel boundaries and identify 18 distinct agricultural land cover classes. Most of these represent individual crops selected based on their identification as top-20 agricultural commodities in 2002 and/or 2018 in official Kern County crop reports (Kern County Department of Agriculture and Measurement Standards, 2020). Our data includes annual row crops (Alfalfa, Cotton, Wheat), horticultural crops (Carrot, Garlic, Onion, Potato, Tomato), fruit and nut tree crops (Apple, Citrus, and Peach; and Almond and Pistachio), and grapes (Grape). Other field and tree crops were aggregated into two separate categories (Other field crops and Other tree crops); we further identify unplanted agricultural land (Fallow) and land used for livestock feed (Pasture/Forage) (Table 1). To estimate total cultivation areas for all land cover classes, we converted continuous land-cover shapefiles to 30 m resolution rasters and applied pixel-counting methodologies in ArcGIS Pro. Land-cover change dynamics over time were established by calculating differences from 2002 to 2018.
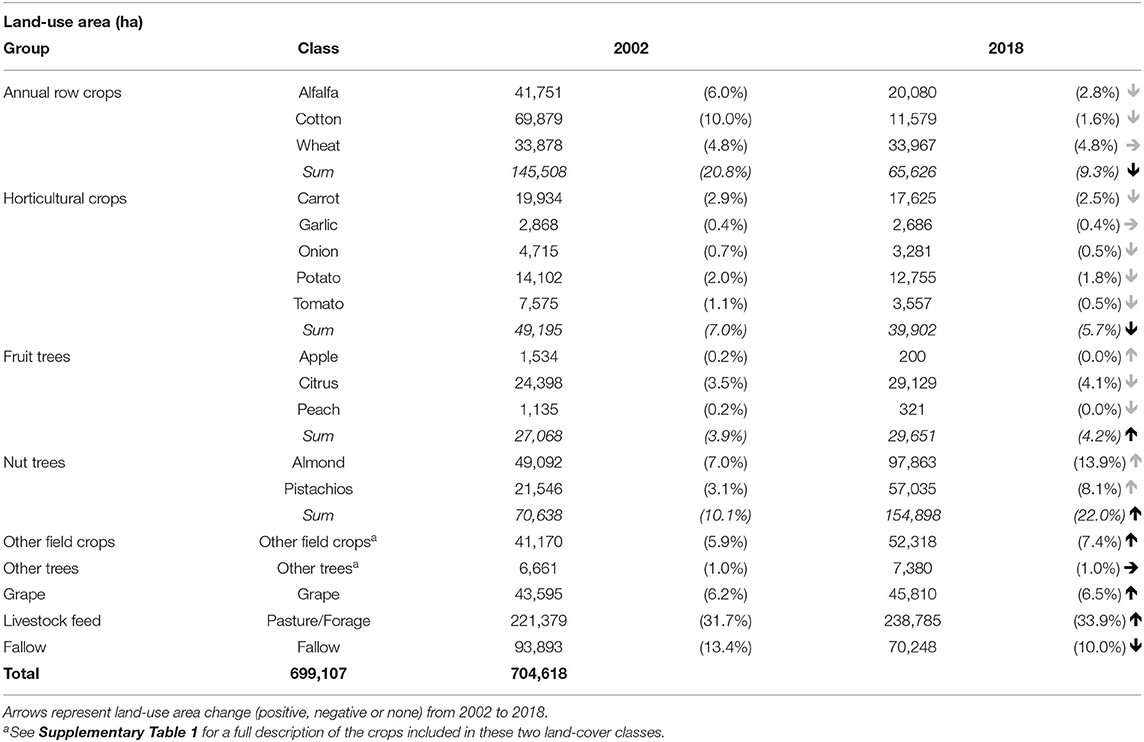
Table 1. Total area (in hectares), and proportion of total agricultural land-cover in the study area (in percentages) for 18 distinct land-cover classes for 2002 and 2018 in Kern County, which represent the dominant agricultural land-cover classes in the county.
Agricultural Ecosystem Pressure Indicators: Water Use, Erosion Risk, Pesticide Contamination
Our assessment focuses on three agricultural ecosystem pressures in Kern County: water-use, soil erosion risk, and pesticide contamination. We use actual evapotranspiration (ETa) rates as an indicator for water use. ETa rates account for evaporation from land surface plus transpiration from plants, and have been successfully used to estimate crop-water use at the parcel-level in Kern County by Schauer and Senay (2019). For this study, we used the spatially explicit dataset developed by Schauer and Senay (2019), available in 30 m resolution raster format (see Supplementary Table 2 for details). We used ArcGIS Pro geoprocessing tools to convert this data to a 30 m resolution raster depicting mean hectare meters of ETa per parcel polygon for 2002 and 2018.
We quantified total soil loss as an indicator for soil erosion risk across the study area by applying the Natural Capital Project's InVEST (Integrated Valuation of Ecosystem Services and Tradeoffs) Sediment Delivery Ratio (SDR) model (Natural Capital Project, 2019). The SDR model is a process-based, spatially explicit model which computes annual soil loss per pixel based on Renard et al. (1997)'s revised universal soil loss equation (RUSLE):
where Ri is rainfall erosivity, Ki is soil erodibility, LSi is a slope length-gradient factor, Ci is a crop-management factor and Pi is a support practice factor. To run the SDR model, the following input layers are required: a digital elevation model (DEM), rainfall erosivity Ri, soil erodibility Ki, land cover maps, watershed boundaries, and Ci and Pi values per land cover class (see Supplementary Table 2 for a detailed methodology description). We applied the model to our land-cover maps for 2002 and 2018, and converted output raster datasets to 30 m rasters depicting predicted soil loss per parcel polygon, in tons per hectare.
Pesticide use intensity constitutes a significant indicator in an agricultural context, as pesticides are commonly used to improve yields but also pose many ecological and human health risks (Van Der Werf, 1996). To reflect this, we estimate toxicity-adjusted pesticide application rates across our study area, based on publicly available pesticide application rates and oral toxicity levels for commercially available pesticide compounds (Supplementary Table 2). We calculated toxicity-adjusted pesticide application per parcel (in kgeq ha−1) according to the following equation:
with toxicity-adjusted pesticide application Pe, application rates R, and toxicity levels T, based on US EPA guidelines, determined for each parcel a and pesticide p. We used ArcGIS pro to integrate the resulting output table with our land-cover maps, and to generate 30 m resolution rasters containing pesticide application values per parcel polygon for 2002 and 2018.
We then used ArcGIS Pro spatial analysis tools to integrate spatially explicit, parcel-specific datasets for all three agricultural ecosystem pressure indicators with our 2002 and 2018 land-cover maps, and to determine (i) total ETa, soil loss and pesticide application attributed to each land-cover class; and (ii) mean ETa, soil loss and pesticide application rates per hectare for each land-cover class. Changes in indicator levels per unit of land over time were determined by calculating differences (%Δ) from 2002 to 2018.
Agricultural ecosystem service indicators: profit, calorie production, annual carbon sequestration
We identified three agricultural ecosystem services in our study region: profit, calorie production, and annual carbon sequestration. Similarly to Goldstein et al. (2012), we selected profits as an indicator to represent current direct economic benefits arising from agricultural ecosystems (e.g., contribution to farmer livelihoods and to regional revenues). Total profit per land cover class was determined according to the following equation:
with profit P, revenue R and cost C distinct for each land cover class i and year y. Profits were calculated based on county-level crop-specific total revenue values for 2002 and 2018, and crop-specific total cost values (which included production operating costs as well as cash and non-cash overhead expenses). We note that cost values for the land-cover classes Other field crops and Other tree crops were based on the five individual crops with greatest cultivation area contained within each class in each study year (see Supplementary Table 2 for details). To ensure comparability of values across study years we converted data from 2002 to reflect 2018 prices (U.S. Bureau of Labor Statistics, 2020).
Another significant benefit arising from agricultural ecosystems is related to food provision; here we focus on calorie (kcal) production, which has previously been used as an indicator for food provision (Mitchell et al., 2020). For all agricultural crops except alfalfa and pasture/forage, we determined the average kcal content per 100 g of non-processed crops based on USDA estimates and converted this value to kcal per ha based on reported crop yields. For alfalfa and pasture/forage we used a conversion factor of 7.5% (Shepon et al., 2016) to translate kcal contents from fodder to meat and dairy products destined for human consumption.
Soil carbon sequestration constitutes an important indicator for soil fertility, which underpins the healthy functioning of agricultural ecosystems (Lal, 2018); here, we focus on annual C sequestration, based on soil and litter components (in Mg C ha−1 yr−1). We consider that annual change, rather than absolute C storage, is particularly relevant in an agricultural context as this metric reflects changes in agricultural soil management practices over time (Mitchell et al., 2020). Our assessment of annual C sequestration is based on crop-specific reference values from existing literature, which we applied to our 17 land-cover classes (Supplementary Table 2).
We used ArcGIS spatial analysis tools to integrate tabular, crop-specific datasets for all three agricultural ecosystem service indicators with our 2002 and 2018 land-cover maps, and to determine (i) total profits, calorie production, and annual C sequestration attributed to each land-cover class; and (ii) mean annual profit (in USD$2018), calorie production, and annual C sequestration rates per hectare for each land-cover class. Changes in indicator levels per unit of land over time were determined by calculating differences (%Δ) from 2002 to 2018.
Contributions of Land-Cover Allocation and Land-Use Efficiency to Overall Changes in Indicators
At the scale of our study area, changes in agricultural indicators (water use, soil erosion, pesticide use, calorie production, profits, and annual carbon sequestration) are driven by changes in land-cover allocation (i.e., how much land is planted in each crop and where it is planted) and changes in land-use efficiency (i.e., the mean observed indicator values per hectare). For example, during our study period, almonds expanded their extent, increasing their land cover allocation. At the same time, per hectare indicator values for almonds also changed due to a wide range of factors including management, climate, market-prices, water-prices, etc. The total change in indicators at the study scale, therefore, is composed of both changes in allocation and changes in efficiency. To decompose how land-cover allocation vs. land-use efficiency contributed to changes in total ecosystem pressures or service provision, we developed a technique to calculate the contribution of allocation and efficiency to overall changes.
We calculated the effect of land-cover allocation changes, An,j as the change from observed 2018 values, due to changes in land allocation only. To do this, we first calculated the observed indicator change for each indicator between 2002 and 2018 for each crop at the county scale.
Where T is the landscape scale change in indicator j and crop n. I represents the efficiency (i.e., per hectare) measure of indicator j and crop n; ha, represents the land allocation of crop n; and the year subscript indicates the time period (2002 or 2018).
Second, we calculated two measures of changes, where land use efficiency is held steady, but land use allocations changes. The first measure varies land allocation (ha) but keeps efficiency at the 2018 levels. The second varies land allocation (ha) but keeps efficiency at the 2002 levels. Taking the mean of these values isolates the change in T that is attributed to land use allocation. We here call this value A.
The output indicator, An,j, is the contribution of change in land-use allocation toward the change in indicator value. For example, taking the crop and indicator pair of nut trees and water use, A indicates the contribution of nut tree expansion from 2002 to 2018 toward the total change in water-use on almond cultivation areas. By dividing An,j by Tn,j, we can calculate the percent of change attributed to land allocation, %ΔA (Table 2).
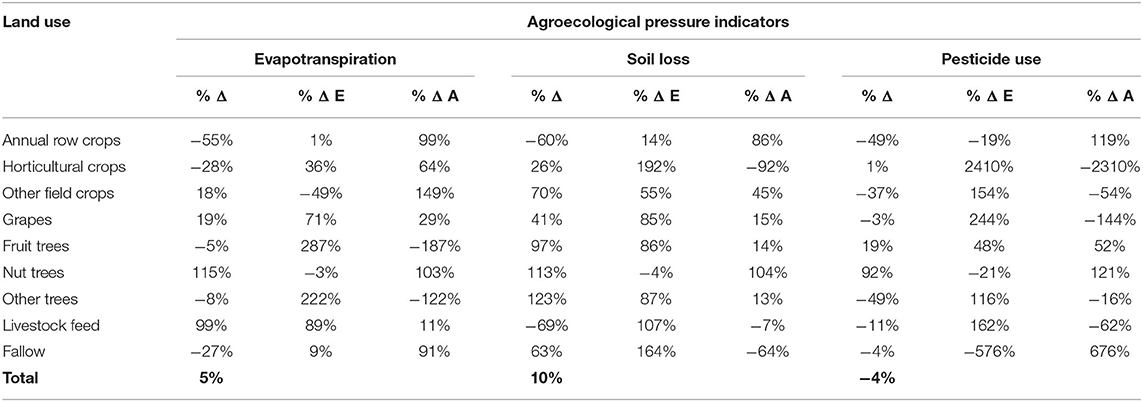
Table 2. Change (2002–2018) in total indicator value (%Δ), as well as contribution of change in indicator values driven by changes in land-use efficiency (%Δ E) and land-use allocation (%Δ A), for three agricultural ecosystem pressure indicators: actual evapotranspiration (ha-m), predicted soil loss (tons), and pesticide use (kg).
We use the same technique to calculate the change in total indicator values attributed to changes in efficiency, holding land use values constant while changing land use efficiency.
Where En,j is equal to the amount of Tn,j attributed to changes in land use efficiency. For example, taking the crop and indicator pair of nut trees and water use again, E indicates the contribution of changes in nut tree efficiency from 2002 to 2018 toward the total change in water-use on almond cultivation areas. By dividing En,j by Tn,j, we can calculate the percent of change attributed to changes in efficiency, %ΔE (Table 2). We note that the total change in the indicator value is the sum of the two components A and E.
Index Transformation for Trade-Off and Synergy Assessment Across Land-Cover Classes
To facilitate comparison between indicators and to assess potential trade-offs and synergies across land-cover classes, we transformed all agricultural indicator values into composite index values at both the land-cover class level and the parcel level, using a methodology developed by Kearney et al. (2019). For indicators with desirable outcomes (e.g., ecosystem services), we used the following transformation:
Where Y is the transformed index value for each indicator i, X is the original value, and a and b are the maximum and minimum values, respectively, observed across both study years for each indicator. For indicators with non-desirable outcomes (e.g., ecosystem pressures), a similar approach was used to obtain a reverse transformation:
As a result, for all indicators, values closer to 0 represent non-desirable outcomes, whereas values closer to 1 represent desirable outcomes. For example, a value of 1 for pesticide-use indicates low pesticide use, and a value of 1 for profit indicates high profits.
Statistical Analysis
We conducted two statistical analyses to investigate trade-offs. At the landscape scale, we conducted a principal component analysis (PCA) to composite index values for all measured indicators. This analysis was carried out at the land-cover class level, with the goal of assessing trade-offs and synergies of ecosystem indicators between land-cover classes. We carried out separate PCA analyses for 2002 and 2018 datasets, using the “FactoMineR” package in R Studio version 1.3.1073 (Lê et al., 2008). The results of this analysis suggest whether there are specific trade-offs between land-cover classes.
To assess relationships between ecosystem pressure and service indicators, we additionally applied a spatially explicit pair-wise correlation to our parcel-level datasets. All parcels with one or more missing indicator values were excluded; our final dataset included 6,070 individual parcels. For each indicator (n = 6 per parcel), we computed differences between 2002 and 2018 composite index values. We then computed a spatial-weight matrix using the “spdep” package in R Studio (Bivand and Wong, 2018). This matrix was applied to our parcel-level indicator dataset to transform original value to distance-lagged values, with the aim of correcting for potential spatial autocorrelation. Pearson correlations for all possible pairs of indicators were then calculated using the “corrplot” package in R Studio (Wei and Simko, 2017). The results of this analysis show parcel-level correlations between ecosystem service indicators, adjusted to account for spatial autocorrelation.
Results
Crop Composition Shifts: Increased Perennial Cultivation, Decreased Cotton and Alfalfa
The total land-use footprint of active and fallow agricultural parcels and rangeland in Kern County remained relatively stable at ~700,000 hectares from 2002 to 2018. Annual row crops saw the greatest decline in cultivation area from 2002 to 2018 (Table 1, Figure 2). While the area of wheat cultivation did not vary significantly, the spatial footprint of alfalfa decreased by 52% (from 41,751 to 20,079 ha), and cotton decreased by 83% (from 69,879 to 11,579 ha). Nut trees saw the greatest increase in cultivation area from 2002 to 2018 (Table 1, Figure 2). Almond cultivation area increased by 99% (from 49,092 to 97,863 ha) and pistachio cultivation area increased by 165% (from 21,545 to 57,035 ha). The areas used for grape cultivation and livestock feed remained relatively constant.
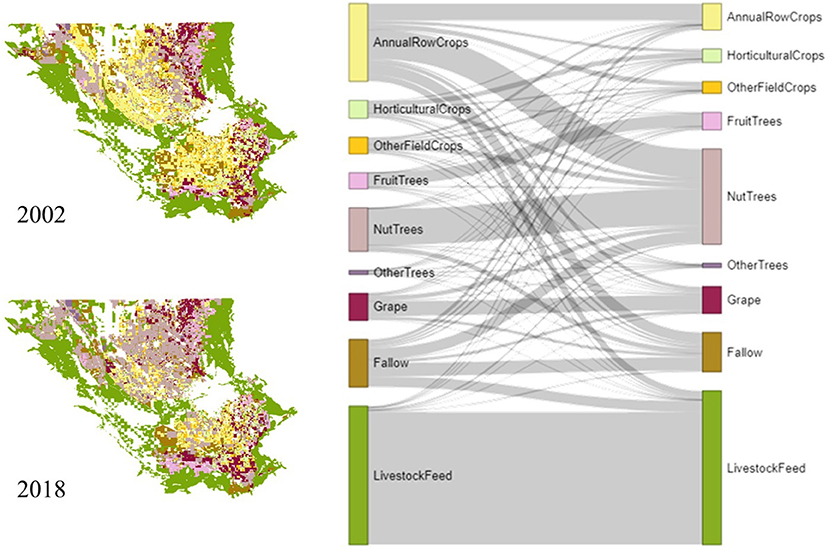
Figure 2. Land-use maps and Sankey diagram illustrating changes in land-cover allocation from 2002 to 2018 for predominant agricultural land-cover types in Kern County. Areas depicted in white in our maps correspond to non-agricultural or no-data areas excluded from our analysis.
Agricultural Ecosystem Pressures: Marginal Increases in Total Impact, Fluctuating Land-Use Efficiency Rates
Total actual evapotranspiration (ETa) on agricultural land increased by 5% (from 256,438 to 269,422 ha-m) between 2002 and 2018. Total ETa attributed to annual row crop cultivation decreased by 55% (Table 2), accounting for a combined 14% of total crop water use in 2018 (Supplementary Table 5). In contrast, total ETa attributed to nut tree cultivation increased by 115%, accounting for 39% of total crop water use in 2018. For annual row crops and nut trees, the observed change in total ETa (%Δ) was driven predominantly by changes in land-use allocation ((%ΔA) (Table 2). In contrast, increased water-use from livestock feed and grape production appeared to be mostly driven by increases in per-hectare ETa rates, represented by %ΔE. For fruit trees (particularly citrus) orchards, despite opposing contributions of land-use allocation and water-use efficiency, higher magnitudes in %ΔE may indicate that decreased per-hectare ETa rates may have contributed to low total water-use increases (Table 2, Supplementary Table 5). Annual water productivity, calculated as the ratio of metric tons of crop produced per m3 of water use (Van Halsema and Vincent, 2012), decreased by 10% for almonds, 23% for alfalfa, and by 75% for tomato production, but increased by 32% for apple cultivation and by 109% in livestock feed areas.
Total annual soil loss across the study area increased by 10% (from 277,359 metric tons in 2002 to 304,351 metric tons in 2018). Total annual soil losses from tree orchards saw large increases. Increases in land-cover allocation (%ΔA) appeared to contribute to higher total soil loss from nut tree orchards; in vineyards and fruit tree orchards, per-hectare soil loss rates, represented by %ΔE, may have had a higher contribution to increases in soil loss (Table 2). Total soil loss from livestock feed areas decreased by 69%; total soil loss from grape cultivation and fallow land increased by 41 and 63%, respectively (Table 2).
Total pesticide application in the Kern County watershed decreased by 4% (from 4.2 metric tons applied in 2002 to 4.0 in 2018). Pesticide application was high in grape and livestock feed production areas, contributing a cumulative 40 and 39% of total pesticide use in 2002 and 2018. In nut-tree orchards, an increase in land-cover allocation (%ΔA) may have contributed to a high (92%) increase in pesticide application (Table 2). For horticultural crops and fallow land, we note that the magnitude of %ΔA and %ΔE were similar, but occurred in different directions, potentially leading to low changes in total pesticide application. Rates of pesticide applied per metric ton of harvested crop decreased for almond (7%), grapes (33%), and pistachios (41%), which are all crops with an important 2018 land-use footprint (Table 1).
Agricultural Ecosystem Services: Large Increase in Total Impact, Fluctuating Land-Use Efficiency Rates
Total calorie production increased by 29% (from 154 to 200 million kcal in 2018). Nut tree calorie production increased by 147%; this increase appeared to be driven primarily by increased land-cover. Calories from grape cultivation increased by 44% and may have been driven primarily by increased per-hectare production, represented by %ΔE (Table 3). We note that the 740% increase in calorie production for “Other Trees” is predominantly driven by an increase in high-calorie species like olives and pecans in this category, along with increases in yield production per area. For horticultural and annual row crops, significant decreases in land-cover area, represented by a high magnitude for %ΔA, may have been mitigated by increases in per-hectare calorie production, represented by a high, but oppositional, magnitude for %ΔE (Table 3).
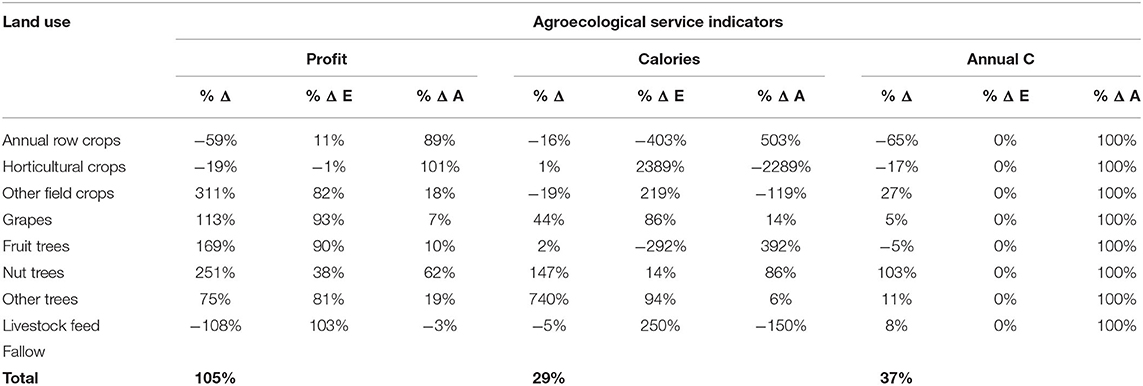
Table 3. Change (2002–2018) in land-use allocation (%Δ A), actual total indicator value (%Δ), and contribution of change in indicator values driven by land-use efficiency (%Δ E), for three agricultural ecosystem service indicators: profit, calorie production, and annual carbon sequestration.
Total profits across the study area increased by 105% (from 3.5 billion USD in 2002 to 7.1 billion USD in 2018). We found large profit increases for nut trees, which contributed a cumulative 32% to total 2018 profits; this increase may have been driven primarily by increased land-cover, represented by % ΔA (Table 3). For annual row crops, a decrease both in cultivation area and per-hectare profitability contributed to a 59% decrease in total profits. From 2002 to 2018, increases in per-hectare profitability contributed to notable increases in total profits from citrus (55%), garlic (135%), and grape (113%) (Supplementary Table 6). Decreased per-hectare profitability for pasture/forage areas may have contributed to their decline in terms of total profitability (108%).
Total annual C sequestration in the study area increased by 37% (from 236,178 Mg C in 2002 to 322,598 Mg C in 2018), despite significant losses in annual C sequestration from annual row crops (65%) and horticultural crops (17%). Annual carbon sequestration potential was highest for nut-trees, and landscape-wide increases in annual C sequestration were driven by the expansion of tree-crop cultivation (Table 3). Almond, citrus and pistachio cultivation contributed to 69% of annual C sequestration in 2018. We note that the 5% reduction in annual C sequestration for fruit tree cultivation (Table 3) was driven by an increase in the proportion of citrus trees in relation to apple and peach trees, which were associated with higher annual C sequestration rates in the literature (Supplementary Table 4). Based on county-level yield reports, the carbon sequestration potential per unit of crop produced increased by 368% for apples and by 13% for pasture/forage and decreased by 13% for almonds and 32% for peaches from 2002 to 2018.
Trade-Offs and Synergies
For 2002, the first two principal components of our analysis explained 55.7% of the variance in composite indices, with remaining principal components explaining 16% and less of additional variance. Along the X-axis, corresponding to principal component 1 (PC1), pesticide and water use were negatively related to other indicators. We note an apparent synergy between minimized soil erosion and maximized ecosystem services. Our results also indicate synergies among water use, calorie production and profits on the one hand, and pesticide use, soil erosion and carbon sequestration on the other; as well as trade-offs (indicated by negative relationships along PC2, represented by the Y-axis) between these two groups (Figure 3).
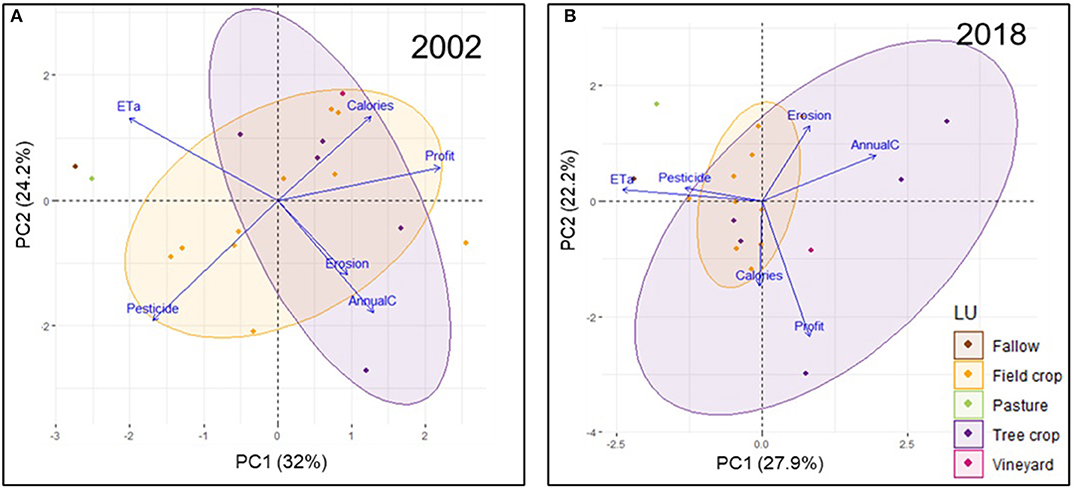
Figure 3. Principal component loadings and distribution of agricultural land-cover classes in Kern County, based on mean per-hectare variation in six agricultural ecosystem indicators (evapotranspiration, soil loss, pesticide use, profits, caloric content, and annual C sequestration) for 2002 (A) and 2018 (B). Land-cover classes were grouped into five land-use (LU) groups: field crops, tree crops, vineyards, pasture, and fallow.
For 2018, the first two principal components explained 49.9% of the variance, with remaining principal components explaining 19% and less of additional variance. Along the X-axis, pesticide and water use were again negatively related to other indicators, whereas along the Y-axis profitability and calorie production were negatively related to all other indicators (Figure 3). A comparison of composite index values across individual land-cover classes further indicated a lack of clear trade-offs and synergies among land-cover classes: no crop groups had high scores (index values > 0.75) for more than two indicators simultaneously, and crops with one or more high index values for ecosystem pressure indicators showed low index values for at least one ecosystem service indicator (Supplementary Table 7).
Pearson correlation values between pairs of indicators across both study years further confirm the existence of significant trade-off dynamics between ecosystem services. We found significant (p < 0.05) negative correlations between improved water use and increased annual C sequestration (R2 = 0.33), increased profits and annual C sequestration (R2 = 0.28) and increased profit and improved pesticide use (R2 =0.24). We also found a positive correlation between increased profit and improved soil erosion (R2 = 0.23) (Figures 4, 5). Our analyses also suggest weak, albeit statistically significant, synergies between indicator pairs: pesticide and water use, calorie production and profits, and carbon sequestration and soil erosion (Figures 3, 4).
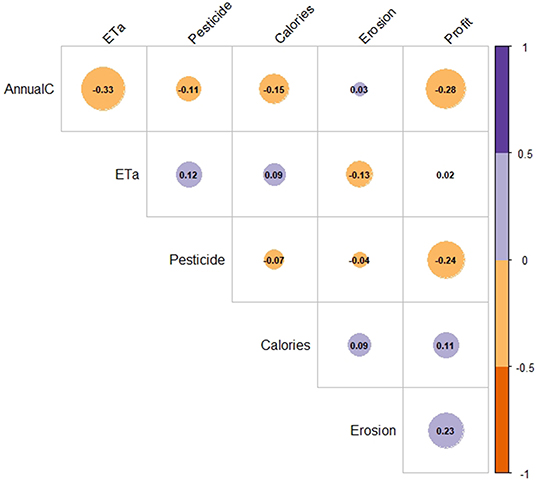
Figure 4. Matrix depicting pair-wise Pearson correlation outcomes for temporal change (between 2002 and 2018) across six agricultural ecosystem indicators (evapotranspiration, soil loss, pesticide use, profits, caloric content, and annual C sequestration), at the parcel-level. Positive correlations are depicted in purple, negative correlations are depicted in orange. Circle sizes are proportional to the correlation coefficients; circles for non-significant relationships (p > 0.05) are not displayed.
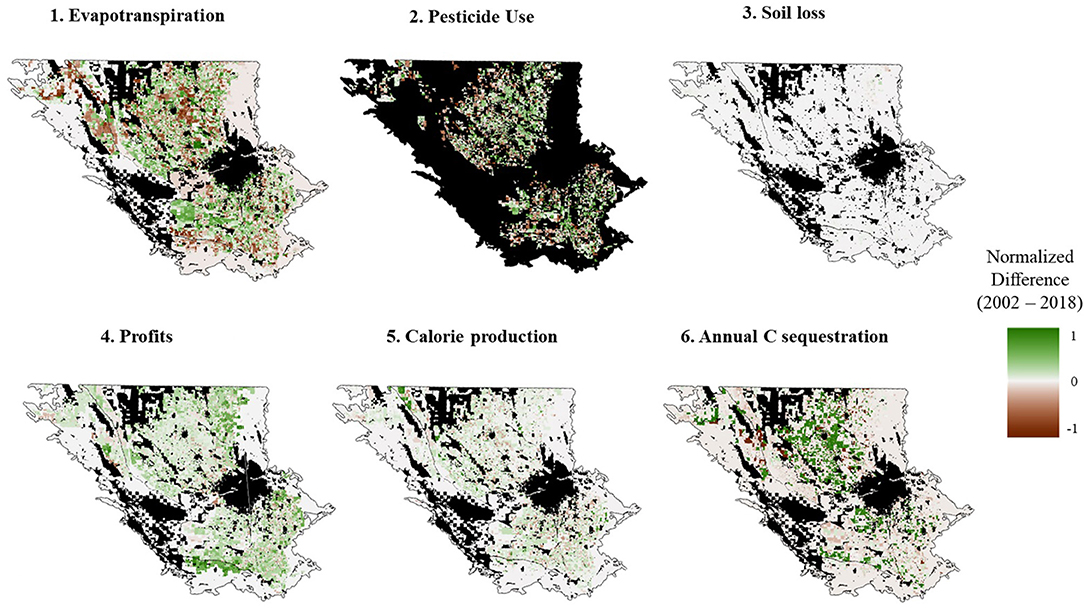
Figure 5. Maps depicting mean per-hectare change from 2002 to 2018 for six agricultural ecosystem indicators: (1) evapotranspiration, (2) soil loss, (3) pesticide use, (4) profits, (5) calories, and (6) annual C sequestration. For all indicators, positive (green) values represent desirable outcomes, whereas negative (brown) values represent non-desirable outcomes. For example, a positive (green) value for evapotranspiration indicates low water-use, and a positive value for profit indicates high profit. Areas depicted in white correspond to areas of no change, and areas in black correspond to non-agricultural or no-data areas excluded from our analysis.
Discussion
The aim of our study was to leverage recent availability of spatially explicit, high resolution data in an agricultural context to document land-use change and assess impacts on agroecosystems. In doing so, we examine potential trade-offs and synergies between indicators for agricultural productivity and agroecosystem function. We focused our analysis on Kern County, a well-established agricultural production hotspot in which market and environmental factors strongly coincide. We find that in Kern, crop composition shifted from a landscape mostly dominated by annual crops to a landscape dominated by perennial orchards from 2002 to 2018. For this time-period, we found that, at landscape-scales, the total magnitude of ecosystem services provided increased, while the total magnitude for measured ecosystem pressures decreased or increased marginally in comparison. This finding suggests that, in our study region and for the indicators that we examined, landscape-scale economic-ecological trade-offs remain a significant issue. However, measured ecosystem pressures did not increase linearly with ecosystem service benefits; negative impacts of land-cover allocation shifts may have been mitigated by changes in land-use efficiency—and vice versa. Our results do not point toward clear economic-ecologic trade-offs or synergies at the crop level. However, we find evidence of trade-offs between ecosystem service indicators: for instance, we observed increased evapotranspiration rates in crops with higher carbon sequestration potential. These findings illuminate the role of land-use change within already established agricultural landscapes, where shifts in crop allocation and management drive significant ecological and socioeconomic change. Our results provide evidence that minimizing trade-offs in an agricultural context is a possibility, as our observations in Kern County indicate the landscape as a whole has gotten much better at producing profit and food, with relatively low increases in agricultural water-use and soil erosion. This positive effect might be enhanced in the future by improved incorporation of natural habitats into the agricultural landscape (e.g., Bryant et al., 2020).
Shifts in Crop Composition Over Time
While the total agricultural land area in Kern County remained relatively stable from 2002 to 2018, the cultivation area of perennial crops (particularly almonds and pistachios) expanded, displacing annual row crops such as alfalfa and cotton (Table 1; Schauer and Senay, 2019; Arellano-Gonzalez and Moore, 2020). Significant increases in the area footprint of fruit and nut trees during California's 2012–2016 drought (Schauer and Senay, 2019) may have been related to perceptions of new orchards as a more stable, long-term investment than annual crops during drought conditions (Howitt et al., 2015; Sanchez, 2017; Moanga, 2020). In conjunction, global increases in demand for nut products, subsequent price increases (Arellano-Gonzalez and Moore, 2020), and a concentration of global almond production in California's Central Valley (Huang and Lapsley, 2019), likely contributed to the observed increase in almond and pistachio cultivation areas in our study region. At the landscape scale, we found that this shift contributed to higher profitability, calorie production and annual carbon sequestration.
In Kern County, landscape-wide shifts from more flexible, annual-crop dominated agriculture toward more permanent tree orchards may illustrate how interactions between climate factors (e.g., drought) and market-drivers (e.g., almond demand) influence the configuration of entire landscapes at relatively short timescales. More research is needed to understand how these drivers interact with other factors (technological advances, labor policy, etc.) to ultimately determine farmers' crop selection choices. Nevertheless, anticipating and managing crop composition shifts based on known risk factors could allow farmers and policymakers to get a head-start on “optimizing” agricultural landscapes for the future.
Potential for Minimizing Landscape Level Economic-Ecological Trade-Offs
As noted above, observed crop composition shifts from 2002 to 2018 were associated with significant increases in calorie production, annual carbon sequestration and profits at the landscape scale (Table 3). In parallel, total pesticide use decreased, and actual evapotranspiration and projected soil loss increased marginally (Table 2). There is ample evidence of significant economic-ecological trade-offs associated with conversion of natural ecosystems for agricultural use, and with shifts from traditional to more intensively managed agricultural systems in land-use transition frontiers (Clough et al., 2016; Barral et al., 2020; Grass et al., 2020). Our findings confirm the continued existence of such trade-offs in already intensively managed agricultural regions. They also suggest that mitigating negative impacts and managing for healthy ecosystem functioning and economic and calorie production, may be possible through a focus on improved land-use efficiency for relevant agroecological indicators.
Our results are in line with other findings that illustrate the possibility of limited economic-ecological trade-offs in agricultural landscapes (Nelson et al., 2009; Clough et al., 2011). In Oregon, a scenario-based projection of land-use change impacts in an established agricultural landscape predicted limited trade-offs between biodiversity conservation and a range of ecosystem services (Nelson et al., 2009). The study found a notable exception in trade-offs linked to commodity production values. However, this outcome assumed that farmer decisions are driven primarily by market-returns, and did not account for market valuation of ecosystem services. In Kern County, water scarcity risks already have direct economic impacts, including significant crop losses and the need for increased investments in groundwater-pumping infrastructure (Medellín-Azuara et al., 2015). Farmers may have sought to address such increased costs by converting to perennial tree crops, which can consume less water than annual crops if managed appropriately, and can generate higher returns despite high initial establishment costs, for instance for irrigation and water storage (Arellano-Gonzalez and Moore, 2020). Our results may signal that in landscapes where environmental stressors already constitute limiting factors for agricultural production, landowner decisions inherently reflect attempts to address acute environmental constraints.
Optimization Across Crops May Require Balancing Priorities and Solutions
Our comparison indicated limited synergies and trade-offs across specific crop groups (Figure 3), with no land-cover class emerging as a clear win-win or lose-lose solution for the suite of indicators that we assessed. This points toward the value of landscape heterogeneity in more ways than one, as different cropping choices may enhance difference landscape functions. More research is urgently needed to accurately evaluate benefits and impacts of different cropping and management approaches in agricultural landscapes, including for a broader range of agroecological indicators. For instance, we found evidence of trade-offs between two “desirable” outcomes for agroecological function: limited evapotranspiration and high carbon sequestration. We note that, while we only considered annual C sequestration potential in our study, consideration of above-ground biomass carbon storage would likely increase the magnitude of total C sequestration benefits, potentially exacerbating this trade-off. In Kern County, high increases in both metrics were principally driven by the expansion of nut-tree orchards. Tree plantations in temperate regions have previously been linked with increased water demands (Jackson et al., 2005), and trade-offs between water resources and carbon sequestration appear to be highly dependent on soil characteristics and vegetation composition (Liu and Li, 2019). Carbon-water trade-offs are recognized as an inherent part of plant growth processes (Medlyn et al., 2017). However, carbon-water dynamics at landscape scales are still poorly understood, and currently constitute a “hot topic” in ecosystem science research (Maxwell and Silva, 2020). While we found no direct evidence that nut-trees' carbon sequestration potential is a significant driver of farmers' crop selection processes in Kern County, this outcome of our study illustrates that climate solutions such as tree-planting can have drawbacks, which need to be managed for appropriately. More generally, this underlines that not all agricultural ecosystem services are positively correlated (Tallis and Polasky, 2009), and that in this light, win-win solutions are elusive. We thus reiterate the need to carefully consider the local relevance of potential agroecological benefits that reflect the priorities of different stakeholders (Fischer et al., 2014).
We also found that observed changes in agricultural indicators for different crops were driven by a combination of changes in land-use allocation and land-use efficiency. This suggests that farmers' decisions regarding land-cover allocation and farm management practices may have interacting influences on landscape-scale outcomes. For instance, increases in water demand from almond and pistachio orchards may have been linked to increases in their cultivation areas (e.g., Supplementary Table 5; Schauer and Senay, 2019). For citrus, a 12% decrease in per-hectare evapotranspiration rates in citrus orchards, potentially driven by improvements in water-use efficiency, may have contributed to a relatively low increase in total water-use, despite an 19% increase in citrus orchard area footprint from 2002 to 2018. At the landscape scale, nut orchards' high per-hectare impact in terms of agricultural ecosystem pressures may have been mitigated by lower per-hectare impacts and distribution of citrus and other crops.
We further note that yield productivity (in US tons per hectare) increased for some of the county's more lucrative crops, notably for grapes (36%), contributing to high increases in profits at the landscape level. This type of “balancing” between positive and negative outcomes across the landscape may further explain why, despite evidence of a correlation between higher profit and increased pesticide-use across all crops, we find evidence of minimized trade-offs between these two indicators at the landscape scale. To continue mitigating potential trade-offs, agronomic research seeking to understand the underlying drivers of observed changes in productivity, evapotranspiration, pesticide-use or soil erosion rates for different crops, remains invaluable.
We further acknowledge that the outcomes of our study may be limited, as assessments of other important agricultural indicators (e.g., biodiversity, pollination, soil fertility, etc.), and of the impacts of changes in farm management (e.g., planting density, fertilization regime, tillage regime, etc.), could provide valuable additional context. In addition, given continued risks of water-scarcity in the region, more detailed assessments of irrigation water sources and groundwater depletion patterns related to different crops would be valuable. Finally, we acknowledge that the indicators assessed here are not equivalent or linearly comparable: a 1% increase in profit may not produce the same level of benefit as a 1% decrease in evapotranspiration. Nevertheless, our findings illustrate that interacting changes in land-use efficiency and land-cover change may impact the magnitude of ecosystem services or pressures across a landscape. Within an agricultural landscape, targeted improvement of per-hectare efficiency for sensitive agricultural indicators might thus mitigate negative impacts associated with crops that are otherwise desirable due to high market or nutritional values.
Conclusions
Continued agricultural expansion around the world is without doubt driving considerable environmental degradation, and policy solutions are urgently needed to address this issue. In our study, centered in Kern County, we find evidence that from 2002 to 2018, farm-level changes in land-cover allocation and land-use efficiency contributed to landscape-level increases in profitability and calorie production, with limited increases in evapotranspiration and soil loss. Land-use change within industrialized farming landscapes, even over relatively short time-periods, may thus lead to significant socioeconomic and ecological impacts. Focusing on solutions that promote landscape optimization and minimize ecologic-economic trade-offs, for instance through improved crop-cover allocation and configuration, mainstreaming of agroecological farm-management strategies, or the development of more efficient irrigation, pest-control and fertilization technology, could therefore have significant impacts on the environmental footprint of future farming landscapes.
Data Availability Statement
The raw data supporting the conclusions of this article will be made available by the authors, without undue reservation.
Author Contributions
AW collected datasets, carried-out data analysis, and led the writing of this manuscript. AW, MP, and VB contributed to the conceptualization of the study and data analyses. DM contributed key datasets. All authors contributed edits and revisions to the final text.
Funding
This research was supported by the Alexander von Humboldt Institute's Feodor Lynen Postdoctoral Fellowship. We also acknowledge that publication of our work was made possible in part by support from the Berkeley Research Impact Initiative (BRII), sponsored by the UC Berkeley Library.
Conflict of Interest
The authors declare that the research was conducted in the absence of any commercial or financial relationships that could be construed as a potential conflict of interest.
Acknowledgments
We would like to thank the LUCLAB team at UC Berkeley for discussions and suggestions on earlier versions of the manuscript. We further thank our three reviewers for their constructive and insightful feedback.
Supplementary Material
The Supplementary Material for this article can be found online at: https://www.frontiersin.org/articles/10.3389/fsufs.2021.650727/full#supplementary-material
References
Arellano-Gonzalez, J., and Moore, F. C. (2020). Intertemporal arbitrage of water and long-term agricultural investments: drought, groundwater banking, and perennial cropping decisions in California. Am. J. Agric. Econ. 102, 1368–1382. doi: 10.1111/ajae.12123
Barral, M. P., Villarino, S., Levers, C., Baumann, M., Kuemmerle, T., and Mastrangelo, M. (2020). Widespread and major losses in multiple ecosystem services as a result of agricultural expansion in the Argentine Chaco. J. Appl. Ecol., 1365–2664.13740. doi: 10.1111/1365-2664.13740
Benoît, M., Rizzo, D., Marraccini, E., Moonen, A. C., Galli, M., Lardon, S., et al. (2012). Landscape agronomy: a new field for addressing agricultural landscape dynamics. Landsc. Ecol. 27, 1385–1394. doi: 10.1007/s10980-012-9802-8
Bivand, R. S., and Wong, D. W. S. (2018). Comparing implementations of global and local indicators of spatial association. Test 27, 716–748. doi: 10.1007/s11749-018-0599-x
Bryant, B. P., Kelsey, T. R., Vogl, A. L., Wolny, S. A., MacEwan, D., Selmants, P. C., et al. (2020). Shaping land use change and ecosystem restoration in a water-stressed agricultural landscape to achieve multiple benefits. Front. Sustain. Food Syst. 4:138. doi: 10.3389/fsufs.2020.00138
Caiserman, A., Dumas, D., Bennafla, K., Faour, G., and Amiraslani, F. (2019). Application of Remotely Sensed Imagery and Socioeconomic Surveys to Map Crop Choices in the Bekaa Valley (Lebanon). Agriculture. 9:57. doi: 10.3390/agriculture9030057
California Department of Food and Agriculture (2021). California Agricultural Production Statistics. Available online at: http://www.cdfa.ca.gov/STATISTICS/ (accessed February 23, 2021).
Chan, K. M. A., and Satterfield, T. (2020). The maturation of ecosystem services: social and policy research expands, but whither biophysically informed valuation? People Nat. 2, 1021–1060. doi: 10.1002/pan3.10137
Clark, M., and Tilman, D. (2017). Comparative analysis of environmental impacts of agricultural production systems, agricultural input efficiency, and food choice. Environ. Res. Lett. 12:064016. doi: 10.1088/1748-9326/aa6cd5
Clough, Y., Barkmann, J., Juhrbandt, J., Kessler, M., Wanger, T. C., Anshary, A., et al. (2011). Combining high biodiversity with high yields in tropical agroforests. Proc. Natl. Acad. Sci. U. S. A. 108, 8311–8316. doi: 10.1073/pnas.1016799108
Clough, Y., Krishna, V. V., Corre, M. D., Darras, K., Denmead, L. H., Meijide, A., et al. (2016). Land-use choices follow profitability at the expense of ecological functions in Indonesian smallholder landscapes. Nat. Commun. 7:13137. doi: 10.1038/ncomms13137
Costanza, R., D'Arge, R., de Groot, R., Farber, S., Grasso, M., Hannon, B., et al. (1997). The value of the world's ecosystem services and natural capital. Nature 387, 253–260. doi: 10.1038/387253a0
Daryanto, S., Wang, L., and Jacinthe, P. A. (2017). Impacts of no-tillage management on nitrate loss from corn, soybean and wheat cultivation: a meta-analysis. Sci. Rep. 7, 1–9. doi: 10.1038/s41598-017-12383-7
Eldon, J., and Gershenson, A. (2015). Effects of cultivation and alternative vineyard management practices on soil carbon storage in diverse mediterranean landscapes: a review of the literature. Agroecol. Sustain. Food Syst. 39, 516–550. doi: 10.1080/21683565.2015.1007407
Faunt, C. C., Sneed, M., Traum, J., and Brandt, J. T. (2016). Water availability and land subsidence in the Central Valley, California, USA. Hydrogeol. J. 24, 675–684. doi: 10.1007/s10040-015-1339-x
Feld, C. K., Martins da Silva, P., Paulo Sousa, J., de Bello, F., Bugter, R., Grandin, U., et al. (2009). Indicators of biodiversity and ecosystem services: a synthesis across ecosystems and spatial scales. Oikos 118, 1862–1871. doi: 10.1111/j.1600-0706.2009.17860.x
Fischer, J., Abson, D. J., Butsic, V., Chappell, M. J., Ekroos, J., Hanspach, J., et al. (2014). Land sparing versus land sharing: moving forward. Conserv. Lett. 7, 149–157. doi: 10.1111/conl.12084
Foley, J. A., Ramankutty, N., Brauman, K. A., Cassidy, E. S., Gerber, J. S., Johnston, M., et al. (2011). Solutions for a cultivated planet. Nature 478, 337–342. doi: 10.1038/nature10452
Goldstein, J. H., Caldarone, G., Duarte, T. K., Ennaanay, D., Hannahs, N., Mendoza, G., et al. (2012). Integrating ecosystem-service tradeoffs into land-use decisions. Proc. Natl. Acad. Sci. U. S. A. 109, 7565–7570. doi: 10.1073/pnas.1201040109
Grass, I., Kubitza, C., Krishna, V. V., Corre, M. D., Mußhoff, O., Pütz, P., et al. (2020). Trade-offs between multifunctionality and profit in tropical smallholder landscapes. Nat. Commun. 11, 1–13. doi: 10.1038/s41467-020-15013-5
Himmelstein, J., Ares, A., Gallagher, D., and Myers, J. (2016). A meta-analysis of intercropping in Africa: impacts on crop yield, farmer income, and integrated pest management effects. Int. J. Agric. Sustain. 15, 1–10. doi: 10.1080/14735903.2016.1242332
Howitt, R., Macewan, D., Medellín-Azuara, J., Lund, J., and Sumner, D. (2015). Economic Analysis of the 2015 Drought For California Agriculture. Davis: University of California, Davis, Center for Watershed Sciences; ERA Economics; University of California Agricultural Issues Center.
Huang, G., and Lapsley, K. (2019). “Almonds,” in Integrated Processing Technologies for Food and Agricultural By-Products, eds Z. Pan, R. Zhang, and S. Zicari (Academic Press), 373−390. doi: 10.1016/B978-0-12-814138-0.00015-0
Jackson, R. B., Jobbágy, E. G., Avissar, R., Roy, S. B., Barrett, D. J., Cook, C. W., et al. (2005). Atmospheric science: trading water for carbon with biological carbon sequestration. Science 310, 1944–1947. doi: 10.1126/science.1119282
Kearney, S. P., Fonte, S. J., García, E., Siles, P., Chan, K. M. A., and Smukler, S. M. (2019). Evaluating ecosystem service trade-offs and synergies from slash-and-mulch agroforestry systems in El Salvador. Ecol. Indic. 105, 264–278. doi: 10.1016/j.ecolind.2017.08.032
Kern County Department of Agriculture Measurement Standards (2020). Annual Crop Reports. Available online at: http://www.kernag.com/caap/crop-reports/crop-reports.asp (accessed November 12, 2020).
Kremen, C., and Miles, A. (2012). Ecosystem services in biologically diversified versus conventional farming systems: benefits, externalities, and trade-offs. Ecol. Soc. 17:40. doi: 10.5751/ES-05035-170440
Lal, R. (2013). Enhancing ecosystem services with no-till. Renew. Agric. Food Syst. 28, 102–114. doi: 10.1017/S1742170512000452
Lal, R. (2015). Restoring soil quality to mitigate soil degradation. Sustainability 7, 5875–5895. doi: 10.3390/su7055875
Lal, R. (2018). Digging deeper: a holistic perspective of factors affecting soil organic carbon sequestration in agroecosystems. Glob. Chang. Biol. 24, 3285–3301. doi: 10.1111/gcb.14054
Lawler, J. J., Lewis, D. J., Nelson, E., Plantinga, A. J., Polasky, S., Withey, J. C., et al. (2014). Projected land-use change impacts on ecosystem services in the United States. Proc. Natl. Acad. Sci. U. S. A. 111, 7492–7497. doi: 10.1073/pnas.1405557111
Lê, S., Josse, J., and Husson, F. (2008). FactoMineR: an R package for multivariate analysis. J. Stat. Softw. 25, 1–18. doi: 10.18637/jss.v025.i01
Leh, M. D. K., Matlock, M. D., Cummings, E. C., and Nalley, L. L. (2013). Quantifying and mapping multiple ecosystem services change in West Africa. Agri. Ecosyst. Environ. 165, 6–18. doi: 10.1016/j.agee.2012.12.001
Liu, Y., and Li, Y. (2019). Synergy and trade-off between carbon sequestration and soil water balance: impact of revegetation choices. Environ. Earth Sci. 78:651. doi: 10.1007/s12665-019-8646-9
Mall, N. K., and Herman, J. D. (2019). Water shortage risks from perennial crop expansion in California's Central Valley. Environ. Res. Lett. 14:104014. doi: 10.1088/1748-9326/ab4035
Maxwell, T. M., and Silva, L. C. R. (2020). A state factor model for ecosystem carbon–water relations. Trends Plant Sci. 25, 652–660. doi: 10.1016/j.tplants.2020.02.007
Medellín-Azuara, J., MacEwan, D., Howitt, R. E., Koruakos, G., Dogrul, E. C., Brush, C. F., et al. (2015). Analyse hydro-économique des pompages d'eaux souterraines pour l'agriculture irriguée dans la vallée Centrale en Californie, Etats Unis d'Amérique. Hydrogeol. J. 23, 1205–1216. doi: 10.1007/s10040-015-1283-9
Medlyn, B. E., De Kauwe, M. G., Lin, Y.-S., Knauer, J., Duursma, R. A., Williams, C. A., et al. (2017). How do leaf and ecosystem measures of water-use efficiency compare? New Phytol. 216, 758–770. doi: 10.1111/nph.14626
Mitchell, M. G. E., Chan, K. M. A., Newlands, N. K., and Ramankutty, N. (2020). Spatial correlations don't predict changes in agricultural ecosystem services: a canada-wide case study. Front. Sustain. Food Syst. 4:539892. doi: 10.3389/fsufs.2020.539892
Moanga, D. (2020). Modelling Land Use and Land Cover Changes in California's Landscapes. Electronic thesis and dissertation repository, University of California, Berkeley.
Native Land Digital (2020). Our Home on Native Land. Native-Land.ca. Available online at: https://native-land.ca/# (accessed November 10, 2020).
Natural Capital Project (2019). Integrated Valuation of Ecosystem Services and Tradeoffs (InVEST) - Sediment Delivery Ratio. Available online at: http://releases.naturalcapitalproject.org/invest-userguide/latest/sdr.html (accessed December 4, 2020).
Nelson, E., Mendoza, G., Regetz, J., Polasky, S., Tallis, H., Cameron, D.r., et al. (2009). Modeling multiple ecosystem services, biodiversity conservation, commodity production, and tradeoffs at landscape scales. Front. Ecol. Environ. 7, 4–11. doi: 10.1890/080023
Potts, S. G., Biesmeijer, J. C., Kremen, C., Neumann, P., Schweiger, O., and Kunin, W. E. (2010). Global pollinator declines: trends, impacts and drivers. Trends Ecol. Evol. 25, 345–353. doi: 10.1016/j.tree.2010.01.007
Power, A. G. (2010). Ecosystem services and agriculture: tradeoffs and synergies. Philos. Trans. R. Soc. B Biol. Sci. 365, 2959–2971. doi: 10.1098/rstb.2010.0143
Quaye, A. K., Hall, C. A. S., and Luzadis, V. A. (2010). Agricultural land use efficiency and food crop production in Ghana. Environ. Dev. Sustain. 12, 967–983. doi: 10.1007/s10668-010-9234-z
Ramankutty, N., Evan, A. T., Monfreda, C., and Foley, J. A. (2008). Farming the planet: 1. Geographic distribution of global agricultural lands in the year 2000. Global Biogeochem. Cycles 22:2952. doi: 10.1029/2007GB002952
Ramankutty, N., Mehrabi, Z., Waha, K., Jarvis, L., Kremen, C., Herrero, M., et al. (2018). Trends in global agricultural land use: implications for environmental health and food security. Annu. Rev. Plant Biol. 69, 789–815. doi: 10.1146/annurev-arplant-042817-040256
Renard, K. G., Foster, G. R., Weesies, G. A., McCool, D. K., and Yoder, D. C. (1997). Predicting Soil Erosion by Water: A Guide to Conservation Planning With the Revised Universal Soil Loss Equation (RUSLE). Available online at: https://www.ars.usda.gov/ARSUserFiles/64080530/RUSLE/AH_703.pdf (accessed November 10, 2020).
Rindfuss, R. R., Walsh, S. J., Turner, B. L., Fox, J., and Mishra, V. (2004). Developing a science of land change: challenges and methodological issues. Proc. Natl. Acad. Sci. U. S. A. 101, 13976–13981. doi: 10.1073/pnas.0401545101
Rockström, J., Williams, J., Daily, G., Noble, A., Matthews, N., Gordon, L., et al. (2017). Sustainable intensification of agriculture for human prosperity and global sustainability. Ambio 46, 4–17. doi: 10.1007/s13280-016-0793-6
Rosa-Schleich, J., Loos, J., Mußhoff, O., and Tscharntke, T. (2019). Ecological-economic trade-offs of diversified farming systems – a review. Ecol. Econ. 160, 251–263. doi: 10.1016/j.ecolecon.2019.03.002
Rudel, T. K., Schneider, L., Uriarte, M., Turner, B. L., DeFries, R., Lawrence, D., et al. (2009). Agricultural intensification and changes in cultivated areas, 1970–2005. Proc. Natl. Acad. Sci. U. S. A. 106, 20675–20680. doi: 10.1073/pnas.0812540106
Sanchez, N. (2017). Changes in Evapotranspiration of Agricultural Crops in Kern County During the 2014–2015 Drought Years. Electronic thesis and dissertation repository, University of California, Davis.
Schauer, M., and Senay, G. B. (2019). Characterizing crop water use dynamics in the Central Valley of California using landsat-derived evapotranspiration. Remote Sens. 11:1782. doi: 10.3390/rs11151782
Shepon, A., Eshel, G., Noor, E., and Milo, R. (2016). Energy and protein feed-to-food conversion efficiencies in the US and potential food security gains from dietary changes. Environ. Res. Lett. 11:105002. doi: 10.1088/1748-9326/11/10/105002
Swinton, S. M., Lupi, F., Robertson, G. P., and Hamilton, S. K. (2007). Ecosystem services and agriculture: cultivating agricultural ecosystems for diverse benefits. Ecol. Econ. 64, 245–252. doi: 10.1016/j.ecolecon.2007.09.020
Tallis, H., and Polasky, S. (2009). Mapping and valuing ecosystem services as an approach for conservation and natural-resource management. Ann. N. Y. Acad. Sci. 1162, 265–283. doi: 10.1111/j.1749-6632.2009.04152.x
Teluguntla, P., Thenkabail, P. S., Xiong, J., and Oliphant, A. (2015). Global Food Security-Support Analysis Data at 30 m (GFSAD). Available online at: https://www.usgs.gov/centers/wgsc/science/global-food-security-support-analysis-data-30-m-gfsad?qt-science_center_objects=1#qt-science_center_objects (accessed November 10, 2020).
Thomson, A. M., Ellis, E. C., Ctor, H. É., Grau, R., Kuemmerle, T., Meyfroidt, P., et al. (2019). Sustainable intensification in land systems: trade-offs, scales, and contexts. Curr. Opin. Environ. Sustain. 38, 37–43. doi: 10.1016/j.cosust.2019.04.011
U.S. Bureau of Labor Statistics (2020). CPI Inflation Calculator. Available online at: https://www.bls.gov/data/inflation_calculator.htm (accessed November 10, 2020).
Van Der Werf, H. M. G. (1996). Assessing the impact of pesticides on the environment. Agric. Ecosyst. Environ. 60, 81–96. doi: 10.1016/S0167-8809(96)01096-1
Van Halsema, G. E., and Vincent, L. (2012). Efficiency and productivity terms for water management: a matter of contextual relativism versus general absolutism. Agric. Water Manag. 108, 9–15. doi: 10.1016/j.agwat.2011.05.016
van Vliet, J., de Groot, H. L. F., Rietveld, P., and Verburg, P. H. (2015). Manifestations and underlying drivers of agricultural land use change in Europe. Landsc. Urban Plan. 133, 24–36. doi: 10.1016/j.landurbplan.2014.09.001
Wei, T., and Simko, V. (2017). R package “corrplot”: Visualization of a Correlation Matrix (Version 0.84). Available online at: https://github.com/taiyun/corrplot (accessed February 28, 2021).
Wisser, D., Frolking, S., Douglas, E. M., Fekete, B. M., Vörösmarty, C. J., and Schumann, A. H. (2008). Global irrigation water demand: variability and uncertainties arising from agricultural and climate data sets. Geophys. Res. Lett. 35:296. doi: 10.1029/2008GL035296
World Bank (2020). Employment in agriculture (% of total employment) (modeled ILO estimate) | Data. Available online at: https://data.worldbank.org/indicator/SL.AGR.EMPL.ZS?end=2020&start=1991&view=chart (accessed November 10, 2020).
Keywords: agriculture, ecosystem pressure, ecosystem service, land-use change, synergies, trade-offs
Citation: Wartenberg AC, Moanga D, Potts MD and Butsic V (2021) Limited Economic-Ecological Trade-Offs in a Shifting Agricultural Landscape: A Case Study From Kern County, California. Front. Sustain. Food Syst. 5:650727. doi: 10.3389/fsufs.2021.650727
Received: 07 January 2021; Accepted: 08 March 2021;
Published: 06 April 2021.
Edited by:
Johann G. Zaller, University of Natural Resources and Life Sciences Vienna, AustriaReviewed by:
Charlie Nicholson, University of California, Davis, United StatesMarta Dondini, University of Aberdeen, United Kingdom
Emily Zimmerman, Iowa State University, United States
Copyright © 2021 Wartenberg, Moanga, Potts and Butsic. This is an open-access article distributed under the terms of the Creative Commons Attribution License (CC BY). The use, distribution or reproduction in other forums is permitted, provided the original author(s) and the copyright owner(s) are credited and that the original publication in this journal is cited, in accordance with accepted academic practice. No use, distribution or reproduction is permitted which does not comply with these terms.
*Correspondence: Ariani C. Wartenberg, YXJpYW5pLndhcnRlbmJlcmdAZ21haWwuY29t