 Robin Harder
 Kent Mullinix3
 Sean Smukler
- 1Environmental Engineering Group, Department of Energy and Technology, Swedish University of Agricultural Sciences (SLU), Uppsala, Sweden
- 2Sustainable Agricultural Landscapes Lab, Faculty of Land and Food Systems, The University of British Columbia (UBC), Vancouver, BC, Canada
- 3Institute for Sustainable Food Systems (ISFS), Kwantlen Polytechnic University (KPU), Richmond, BC, Canada
In light of continued nutrient pollution in water bodies and anticipated insecurities related to future nutrient supplies, there is an increasing awareness of the need to use nutrients in a more circular way. As part of a food system design study in the Okanagan bioregion, BC Canada we set out to evaluate different food system scenarios for the year 2050 in terms of nutrient circularity. In doing so, the objective was to evaluate the circularity of nutrient flows not only in the Okanagan, but also in relation to exogenous regions, insofar as nutrient flows relate to feed and food consumption and production in the Okanagan. This is important because feed and food trade means that nutrient inputs to crop production in the Okanagan may make their way into organic residuals outside the Okanagan, and vice versa. If not accounted for, this may lead to a distorted picture when analyzing nutrient circularity. To this effect, we applied an analytical framework and calculation model that explicitly tracks nutrients from crop production to organic residual generation. The results of the study suggest that assessing nutrient circularity across nested scales was critical for two reasons. First, changes in overall nutrient flows in response to population increase and dietary change were found to be more pronounced outside the Okanagan. Second, our analysis clearly revealed the extent to which feed and food trade boost nutrient self-reliance in the Okanagan at the expense of nutrient self-reliance outside the Okanagan. This kind of analysis should therefore be useful to explore, ideally together with food system and organic residual management actors, how different food system and organic residual management scenarios perform in terms of nutrient circularity, in the geographical area being considered, but also how it impacts nutrient flows and circularity in the places with which feed and food are traded.
Introduction
The future of food is vividly debated (Garnett, 2014; Fraser et al., 2016; Willett et al., 2019). Irrespective of our food future, feeding the human population requires a continuous supply of plant nutrients for crop production. Until about a century ago, this supply relied largely on natural processes like weathering and biological nitrogen fixation, the integration of crop and livestock production, as well as the internal recycling of organic residuals,1 such as animal manure and residues, food waste, and human excreta. But modern food systems have become highly reliant on continuous inputs of nutrients mined from finite reserves, produced using fossil fuels, and transported over large distances. The profligate input of synthetic fertilizers has compromised internal recycling of nutrients in food systems for sustained high yields (Conforti and Giampietro, 1997; Arizpe et al., 2011). Together with the globalization and specialization of agriculture, as well as urbanization, this led to nutrient flows becoming less circular (Vitousek et al., 1997; Smil, 2000; Gruber and Galloway, 2008; Nesme et al., 2018; Harder et al., 2020). In fact, the combination of contemporary diets, agricultural, and residual management practices means that a significant share of nutrient inputs is lost from agriculture and other parts of society to the atmosphere, water bodies, landfills, and so forth. Taking phosphorus as an example, globally, losses to the built and natural environment amount to around 65% of nutrient inputs to agricultural production (Elser, 2012; Cordell and White, 2014). Widespread nutrient losses severely compromise water quality (Steffen et al., 2015) and soil health (Jones et al., 2013). At the same time, the need to continuously produce new synthetic fertilizers to maintain agricultural productivity, and the fact that the production of fertilizers largely relies on mining of geological resources and is energy intensive, raises issues in terms of nutrient security (Cordell et al., 2009; Manning, 2015; Razon, 2018), particularly in some regions of the world (Jones et al., 2013). Nutrient insecurity has direct implications for our ability to meet the second Sustainable Development Goal (SDG 2), Zero Hunger. Nutrients are key productive inputs and comprehensive nutrient recycling from organic residuals can promote equal access to nutrients and enhance soil health.
Mitigating nutrient pollution in water bodies and securing future nutrient supplies requires a radical rethinking of various aspects of nutrient management and in all parts of society, from agriculture and food processing to food consumers and residual management, to reduce nutrient demand and losses, and achieve a more circular use of these essential plant nutrients (Sutton et al., 2013; McConville et al., 2015; Withers et al., 2020). It is in this light that recent years have seen significant interest in concepts like “circular nutrient solutions”, “closing the nutrient loop”, “nutrient circularity”, and “circular nutrient economy” (Nesme and Withers, 2016; Cobo et al., 2019; Robles et al., 2020; Rosemarin et al., 2020; van der Wiel et al., 2020; Zhao et al., 2020). Given the popularity of the concept of “circular bioeconomy” in research and policy discussions, an increased demand for biomass can be expected in the years to come. The bioeconomy refers to economic activity that involves the use of biotechnology and biomass to produce energy, goods, and services. A more ecological management of nutrients and carbon through their recovery and reuse will play a central role in making the bioeconomy circular, as it enables the continued production of new crop plant biomass for food, fiber, oils, and other purposes.
As compelling as the concept of nutrient circularity is in theory, moving toward a more circular use of nutrients in practice is not trivial and is hampered by a number of factors (Barquet et al., 2020). Theoretically, achieving more circular nutrient flows would require that nutrients in organic residuals are sent back to where they came from. Obviously, it is not reasonable to expect that post-consumption of feed and food, residual nutrients go back to exactly where the feed and food were produced. But it seems reasonable to assume that, at the very least, a more circular use of nutrients would require that, in places where more feed and food are consumed than produced (e.g., urban areas or areas with intensive livestock production), nutrients available in organic residuals are redistributed to places where feed and food production exceeds consumption (e.g., rural agricultural areas or areas with predominantly crop production).
Nutrient supply and demand imbalances at larger scales, between regions with net imports or exports of feed and food, are rather difficult to balance. This is due to longer transport distances and because the coexistence of nutrient deficits and surpluses may be concealed if they occur distant from one another. The cost of utilizing nutrients in organic residuals increases with the distance the residuals have to be hauled, or with the technical processes needed to extract and concentrate nutrients so that they can be transported more easily. Therefore, it is often less costly and easier to forego utilizing nutrients in organic residuals and instead apply synthetic fertilizers to crops. Nutrient supply and demand imbalances at smaller scales, for instance between crop and livestock farms that are located in close proximity to one another, should in principle be relatively easier to balance. This is due to the shorter transport distances and because the coexistence of nutrient deficits and surpluses is more apparent if they occur in close proximity within the same geographical area. However, both at larger and smaller scales, stoichiometry of plants, and soil chemistry may complicate matters. For instance, the application of animal manures or composts to adjust soil fertility for one plant nutrient may lead to an excess or deficiency for other nutrient elements (Maltais-Landry et al., 2019).
When studying possible trajectories toward a more circular use of nutrients in modern food and bioeconomy systems, it is important to start with an analysis of nutrient flows carried out at appropriately useful scales. It has been proffered that the “local”, “territorial”, or “bioregional” scale, chosen to include similar political, social, and ecological characteristics, is meaningful to restore nutrient circularity (van der Wiel et al., 2020) and to study transitions toward more sustainable food and bioeconomy systems (Harris et al., 2016; Lamine et al., 2019; Wohlfahrt et al., 2019). The idea is that such scales are large enough to include a diversity of ecological and technical processes, yet small enough for various stakeholders—who may have divergent views of the challenge and how to solve it—to engage in constructive dialogue that leads to action. Regarding nutrient circularity, however, we think it would be meaningful to analyze patterns inside a given bioregion in relation to the interactions it has with its context in terms of imports and exports of nutrients.
In two previous companion papers, we introduced a novel analytical framework (Harder et al., 2021b) and calculation method (Harder et al., 2021a) to assess the circularity of nutrient flows in food systems across nested scales. The key novelty of the proposed approach was that it analyzes the entanglement of nutrients flows, not only inside a bioregional food system, but also in relation to the nutrient flows that feed and food imports and exports cause outside of the spatial boundaries of the considered food system. In this paper, we expand upon our previous work by applying the methodology to evaluate a suite of food system scenarios in the Okanagan bioregion in BC Canada, for the year 2050, in terms of the flows of nitrogen (N), phosphorus (P), potassium (K), and magnesium (Mg). The over-arching objective was to explore whether this line of research is a meaningful way of evaluating food system and organic residual management scenarios from the perspective of nutrient management and the potential for a more circular use of nutrients. Specifically, we set out to compare nutrient flows and nutrient circularity in the food system and organic residual management infrastructure of the Okanagan bioregion, for a suite of food system scenarios representing the year 2050.
Methods
The Okanagan Bioregion
The Okanagan, also known as the Okanagan Valley, is a region located in the Southern Interior of British Columbia (BC), Canada. With a population of 362,000, the Okanagan is the most populous region in the BC Interior. With a total area of just above 2 million hectares, the Okanagan is one of the two most important agricultural regions in BC, and one of the largest producers of temperate zone tree fruits, wine grapes, and wines in Canada (Robert et al., 2018). A map of the Okanagan is provided in Figure 1, indicating agricultural production areas, as well as major water bodies and population centers.
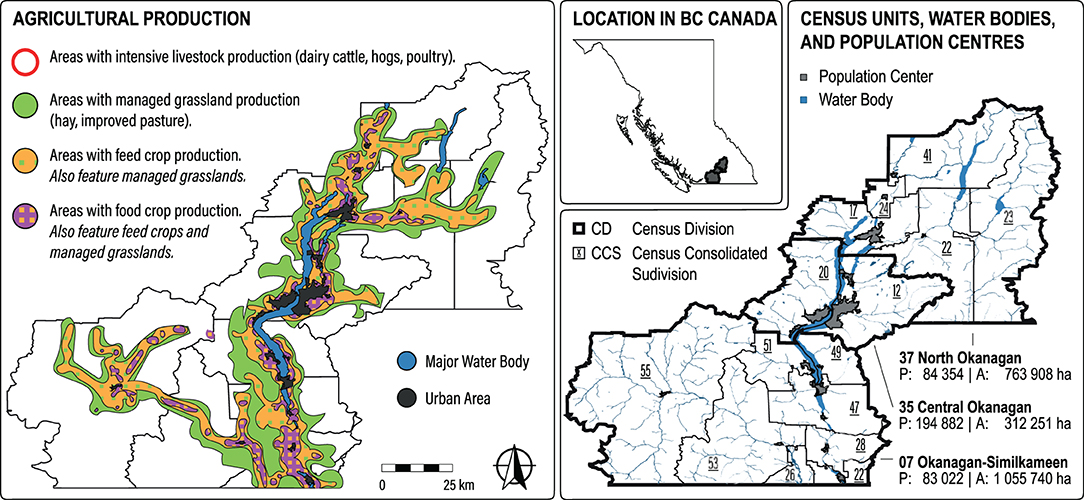
Figure 1. Overview of the Okanagan bioregion. The Okanagan population is largely centered in the bioregion along the Okanagan Lake. Crop production takes place mainly on and near valley bottoms, with feed crops and managed grassland extending progressively further away. Intensive livestock production is concentrated in two areas in the north of the bioregion and coincides with areas of intensive feed production. Grazing on rangeland and natural pastures is commonplace in the foothill areas toward the periphery in the northeast and southwest of the bioregion. P = population and A = area. Figure adapted from Harder et al. (2021a).
Scenarios
Food System
In addition to the year 2016 baseline (BAS), we considered four food system scenarios that represent the year 2050. Scenarios were chosen such that they allow examination of effects of population levels, dietary change, the composition of agricultural production, and the quantity of agricultural land in production (Table 1). In the business-as-usual scenario (BAU), the agricultural production system and diet regime remain unchanged, while population increases by a projected 40% relative to 2016 levels. In the basic food self-reliance scenario (FSR), agricultural production is optimized for food self-reliance, with all else as in the BAU scenario. Optimization for food self-reliance was modeled such that agricultural land in the Okanagan that currently produces crop commodities for export is re-allocated to the production of crop commodities to satisfy local food need in the Okanagan. The FSR scenario was chosen because various actors in the bioregion are actively pursuing a food system future in terms of regionalizing the food system and increasing food self-reliance. The planetary health diet scenario (EAT) represents a situation where the diet changes from a conventional to one in line with the recommendations by the EAT-Lancet commission, with all else as in the FSR scenario. The healthy reference diet recommended by the EAT-Lancet Commission largely consists of whole grains, legumes, nuts, vegetables, fruits, and unsaturated oils; it includes a moderate amount of seafood and poultry but only little red meat, processed meat, added sugar, refined grains, and starchy vegetables (Willett et al., 2019). This diet was chosen because a diet that is low in meat but still contains some meat likely finds broader acceptance than a strictly vegetarian or vegan diet. This choice also aligns with the idea that there may be a place for livestock in future food systems, as long as it is raised on “ecological leftovers” not suitable for human consumption (Röös et al., 2016; Van Zanten et al., 2018; Karlsson and Röös, 2019). The expanded land base scenario (EXP) explores a hypothetical situation where agricultural production is expanded to all suitable land for agriculture, with all else as in the EAT scenario. This scenario could be the result of conscious efforts within the Okanagan to maximize local food supply and concomitant economic opportunities by increasing local production and realigning local demand through dietary change.
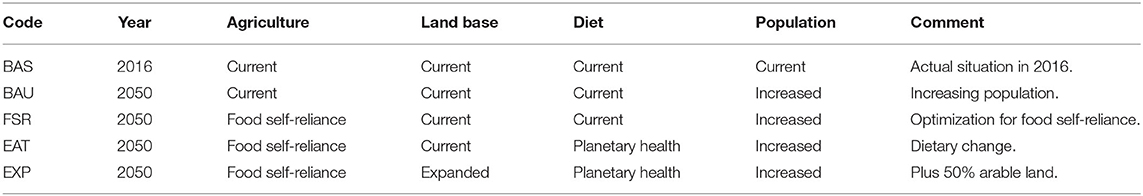
Table 1. Overview of the year 2016 baseline and the four food system scenarios for 2050 considered in this study.
For the BAS and BAU scenarios, production of agricultural commodities in the Okanagan was estimated based on agricultural statistics representative of the baseline year. For the scenarios that are optimized for food self-reliance (i.e., FSR, EAT, EXP), the total area of agricultural land in production served as starting point. While we acknowledge that the production mix could be changed in many ways to increase food self-reliance, for the purpose of this analysis, we assumed that the structure of agricultural production is subject to some inertia and thus would include elements from the baseline. To this effect, we first capped local production of individual food commodities so that they would not exceed local consumption demand. Then, we proportionally increased the production areas of individual crop commodities until the total production area reached the total area of agricultural land in production as per the scenario specification. In doing so, the production of individual crop commodities was not increased beyond what is needed to fully supply local demand. Of note, expansion of agriculture in the EXP scenario was applied only to arable land but not to rangeland and not to livestock numbers in the bioregion.
Organic Residual Management
In the year 2016, municipal wastewater treatment was available for the larger and some smaller communities, amounting to overall coverage of about 60%. The remaining 40% of the population utilized onsite sanitation systems. Municipal solid waste management did not provide for separate collection of food waste—unless composted at home or taken care of by collection schemes other than the municipal ones, food waste thus mostly ended up on landfills as part of mixed household waste. In a similar vein, it appeared that nutrients in animal residues such as slaughterhouse waste were not recovered. Regarding animal manure, it was difficult to know what portion was effectively returned to crop production—there was neither centralized infrastructure for manure management, nor reliable statistics. We assumed that manure was generally adequately managed but transport over larger distances was limited. Estimated nutrient recovery efficiencies for the baseline year 2016 are summarized in Table 2. In addition to the year 2016 baseline recovery efficiencies, we considered a situation that reflects a long-term potential for nutrient recovery from organic residuals. For instance, separate collection of food waste is being planned. To represent the long-term potential for nutrient circularity, we did not delineate a specific future organic residual management infrastructure. Rather, we assumed that nutrient recovery rates could be increased to 70% for all nutrients and across all types of organic residuals. This reflects an ambitious estimate of the recovery rates that full-scale recovery technologies can be realistically expected to achieve.
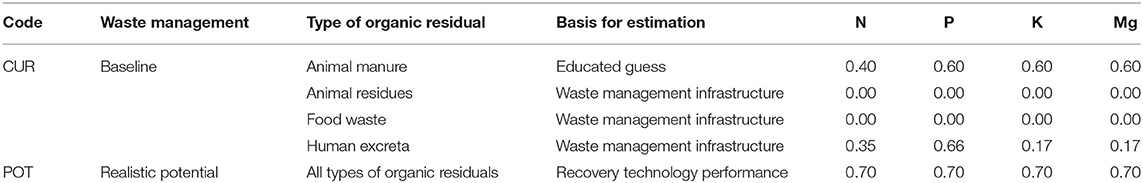
Table 2. Recovery and reuse ratios for various organic residuals, for the year 2016 baseline and one scenario for 2050 that represents a realistic recovery potential.
Assessing Nutrient Circularity
The conceptual framework that underpinned our analysis is presented in detail in a companion paper (Harder et al., 2021b). The implementation of the calculation model is described in detail in a second companion paper (Harder et al., 2021a). Here, we provide a brief summary of the core features of the analytical framework and calculation model.
Structure of the Analysis
The analysis encompassed five subsystems: (i) agricultural land; (ii) livestock production; (iii) food processing; (iv) food consumption, and (v) residual management. Because of feed and food imports and exports, the spatial extent of these subsystems transcends the boundaries of the Okanagan bioregion. For example, Okanagan livestock may eat imported feed. Likewise, feed and food exported from the Okanagan gives raise to the generation of organic residuals outside of the bioregion. To this effect, as conveyed in Figure 2, our analysis distinguished between subsystem components considered internal to the Okanagan (i.e., that lie inside the spatial boundaries of the bioregion) and subsystem components considered external to the Okanagan (i.e., that lie outside the spatial boundaries of the bioregion). In other words, functionally, our analysis included all nutrient flows that relate to food production and consumption in the Okanagan. Spatially, we distinguished an internal component that represents the bioregional food system in the Okanagan, and an external component that represents that part of the global food system with which the bioregional food system interacts through imports and exports of feed and food. Of note, the external component was not further specified in terms of its spatial location other than that it is outside the spatial boundaries of the Okanagan.
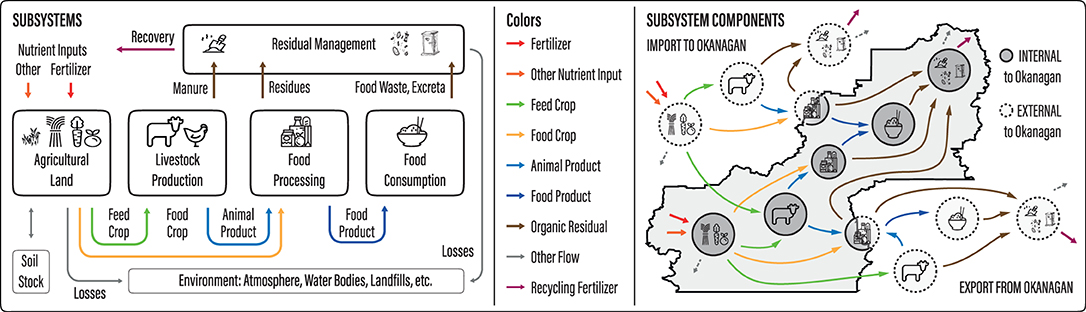
Figure 2. Structure of the analysis. Functionally, the analysis encompasses five subsystems that are connected to one another as shown in the left part of the figure. For each subsystem, spatially, the analysis distinguishes one component internal and one external to the Okanagan, which is shown in the right part of the figure. Note that, for clarity, the external component is split into two parts: one relates to imports into and one to exports from the Okanagan. Figure adapted from Harder et al. (2021a).
Nutrient Circularity Indicators
Our objective was to assess nutrient circularity not only inside the Okanagan, but also how trade impacts nutrient circularity in the areas from and to which the Okanagan imports and exports feed and food. This required a more detailed understanding of nutrient circularity and its relationship with system openness, as explained in Figure 3.
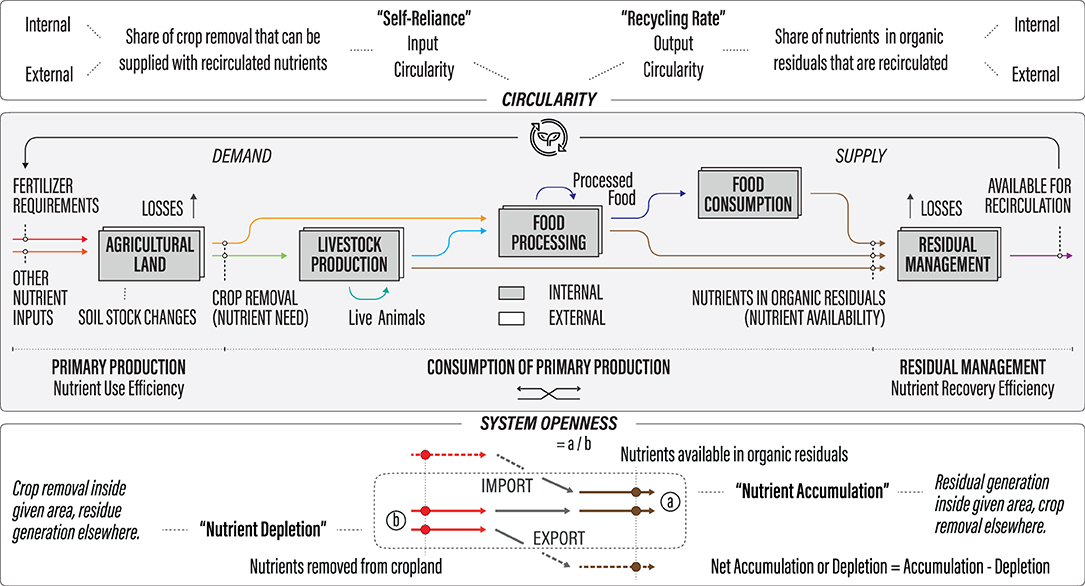
Figure 3. Detailed analysis of the relationship between nutrient circularity and system openness. The middle part of the figure shows nutrient flows between the five subsystems. The top part of the figure distinguishes two notions of nutrient circularity, one focusing on outputs from residual management (recycling rate) and one on inputs to agricultural production (self-reliance). Both self-reliance and recycling rate can be estimated separately internal and external to the Okanagan. System openness is explained in the bottom part of the figure. The idea is that import of agricultural commodities leads to “nutrient accumulation” in the bioregion whereas the opposite holds true for export. System openness for a given nutrient element was defined as the proportion of this nutrient element in the harvest in the bioregion (b) that is available in organic residual in the bioregion (a). If a/b > 1, the bioregion benefits from nutrient inputs elsewhere. If a/b < 1, the opposite holds true. Figure adapted from Harder et al. (2021a,b).
Nutrient circularity is generally conceived of as some sort of comparison between nutrient inputs to biomass production (in terms of fertilizer inputs only, or considering nutrient inputs more broadly) and nutrients in organic residuals (in terms of what is actually recirculated, or considering what is potentially available) (e.g., Senthilkumar et al., 2014; Metson et al., 2016; Parchomenko and Borsky, 2018; Trimmer and Guest, 2018; Akram et al., 2019; Leinonen et al., 2019). This comparison can focus on inputs (i.e., “self-reliance” in terms of the share crop removal that can be supplied with recirculated nutrients) or on outputs (i.e., “recycling rate” in terms of the share of nutrients in organic residuals that are recirculated) (top part of Figure 3). Moreover, as our analysis expanded beyond the spatial boundaries of the Okanagan, it was possible to distinguish internal and external self-reliance and internal and external recycling rate.
The internal and external recycling rate depends entirely on the respective residual management infrastructure within and outside the Okanagan. The internal and external self-reliance is determined not only by the structure and location of residual management but also by the structure and location of agricultural production and the extent of agricultural trade. Therefore, internal and external self-reliance are unlikely to be at the same level. Feed and food imports to the Okanagan, for instance, will contribute to a higher nutrient self-reliance internal to the Okanagan but a lower nutrient self-reliance external to the Okanagan. This is because nutrient inputs to agricultural production outside the Okanagan boost the source of nutrients in residuals within the Okanagan. Vice versa, feed and food exports from the Okanagan will contribute to a lower nutrient self-reliance internal to the Okanagan but a higher nutrient self-reliance external to the Okanagan. This is because nutrient inputs to agricultural production within the Okanagan boost the source of nutrients in residuals outside the Okanagan. To assess the degree to which consumption and trade of feed and food move nutrients from agricultural land in one place to organic residuals in another place, we also evaluated what we refer to as system openness (bottom part of Figure 3).
System openness can lead to what we refer to as nutrient depletion or accumulation—imbalances in nutrient need and availability that are the result of imbalances in feed and food imports and exports. The idea behind the concept of nutrient accumulation and depletion, as proffered herein, is that nutrients available in organic residuals are tracked back to the places nutrient inputs to crop production were applied (i.e., inside or outside the bioregion). In this way, it is possible to elucidate how much the Okanagan benefits from nutrient inputs elsewhere, and vice versa. Net nutrient accumulation or depletion (accumulation less depletion) represents the difference between nutrients in organic residuals and crop removal, internal or external to the Okanagan. Estimating system openness internal and external to the Okanagan separately helps quantify the extent to which potential imbalances in feed and food trade contribute to nutrient accumulation or depletion both internal and external to the Okanagan.
It is worthwhile to note that, in our conceptual model, there are no losses in the subsystems livestock production, food processing, and food consumption. Any losses not inherent in grass and crop production take place in residual management. For example, for cows in a livestock operation this means that residual management starts upon manure excretion. Likewise, losses during housing are considered as losses during residual management. Therefore, in the absence of feed and food trade, or in case of balanced trade, nutrients removed with the harvest in the Okanagan would equal nutrients available in organic residuals in the Okanagan. The larger the discrepancy between “crop removal” and “nutrients in organic residuals” in the middle part of Figure 3, the more open the system is. Note that system openness does not say anything about the leakiness of the system in terms of nutrient losses to for instance landfills and water bodies. System openness simply indicates the extent to which nutrient inputs in one place become available in residuals in another place. Losses can occur both in agricultural production and in residual management and are taken into account in the recycling rate and the self-reliance indicators.
Calculation Model
In summary, the calculation model that underpinned our analysis maps the relationships between nutrient inputs and outputs for each of the five subsystems considered. As conveyed in Figure 4, the first calculation step consisted of estimating commodity flows, both in terms of the production of agricultural commodities and the consumption of food commodities in the Okanagan and in terms of imports and exports. Imports and exports were estimated based on a suite of allocation principles and assumptions given that there were no import and export statistics for the Okanagan. Note that, even though it is known that seasonality constraints imply that domestic production may not actually supply domestic demand (see Dorward et al., 2017), the calculations did not account for this. Unlike in the case of food self-reliance, from the point of view of nutrient circularity, it does not matter if, for example, apples are imported in spring and the same amount is exported in fall (assuming that their nutrient content is similar). The second calculation step consisted of estimating nutrient flows, making sure that the origin of nutrients is properly accounted. To this end, the conceptual model and calculation approach were implemented such that the key model outputs are separate nutrient flows between subsystem components for the nine pathways shown in Figure 4.
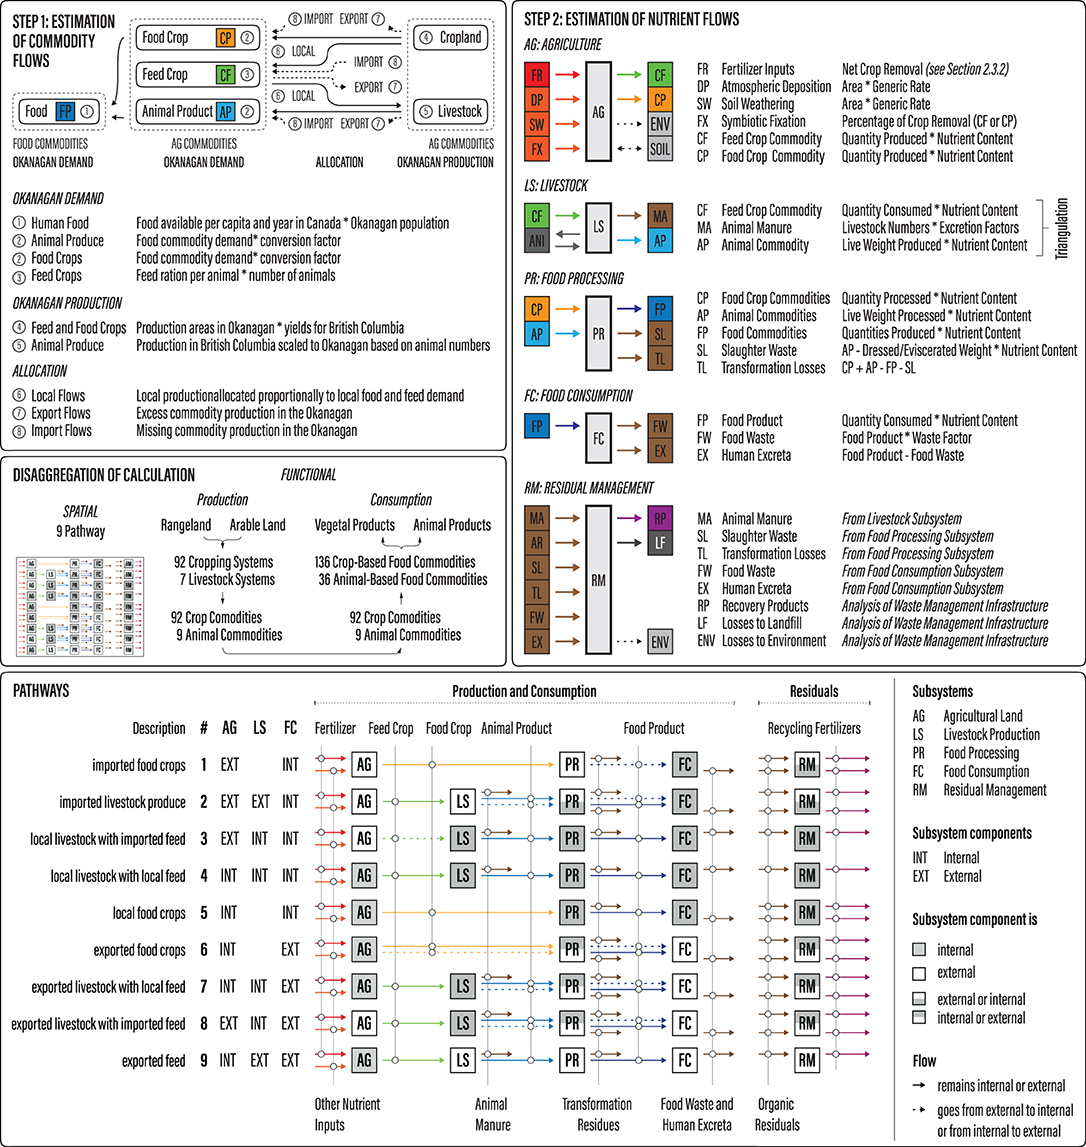
Figure 4. Procedure for estimating nutrient flows. The first step was to estimate commodity flows. The second step was to translate commodity flows into nutrient flows. Calculations were carried out separately per commodity and for nine pathways from crop production to food consumption (see “disaggregation of calculation”). Each pathway describes a unique combination of where the crop and livestock commodities are produced, and the food commodities are consumed (see “pathways”). The idea with these separate pathways was to be able to track nutrients nutrients from crop production to organic residual generation as a function of whether certain subsystem components are internal or external to the Okanagan. Figure adapted from Harder et al. (2021a).
Results
Results for the year 2016 baseline are reported in detail in a companion paper (Harder et al., 2021a). Here, we focus on the four scenarios for the year 2050.
Commodity and Nutrient Flows Across Scenarios
Population Increase
Population increase (BAS to BAU) has a minimal effect on agricultural production in the Okanagan (Figure 5). Slightly fewer food crops are exported and instead go to local consumption, which can be seen in the slight shift from pathway 6 (exported food crops) to pathway 5 (local food crops). The majority of the additional demand is supplied by imports. This can be seen in a significant increase in pathway 1 (imported food crops) and pathway 2 (imported livestock produce). Consequently, as shown in Figure 6, crop nutrient removal increases external to the Okanagan, as this is where the additional commodities needed to meet the additional demand are mostly produced. The total quantity of nutrients in organic residuals that would be available for recovery increases both internal and external to the Okanagan—internally mostly because of an increased generation of food waste and human excreta and externally mostly because of an increased generation of animal manure that results from higher imports of livestock products. As shown in Figure 7, nutrient accumulation for manure residuals does not increase, because the number of animals in the Okanagan and the source of their feed do not change as per our scenario definition. Nutrient accumulation for non-manure residuals increases due to the increase in food consumption in the Okanagan. Taken together, this means an increased net nutrient accumulation in the Okanagan.
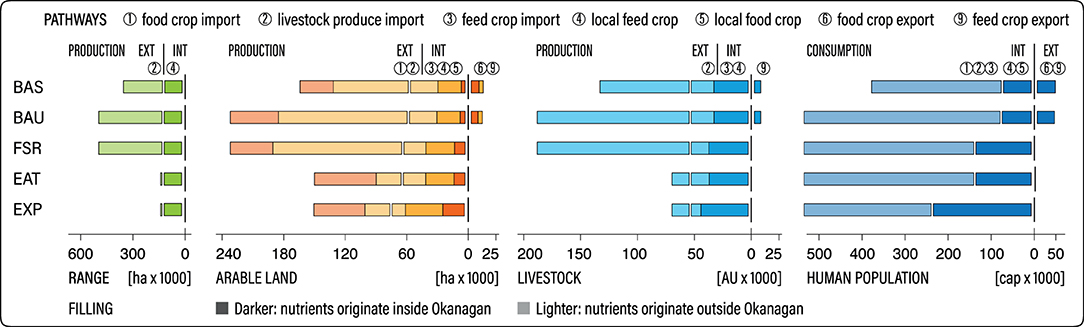
Figure 5. Production of agricultural commodities and consumption of food commodities across food system scenarios. Circled numbers at the top of the figure refer to pathways as per Figure 4.
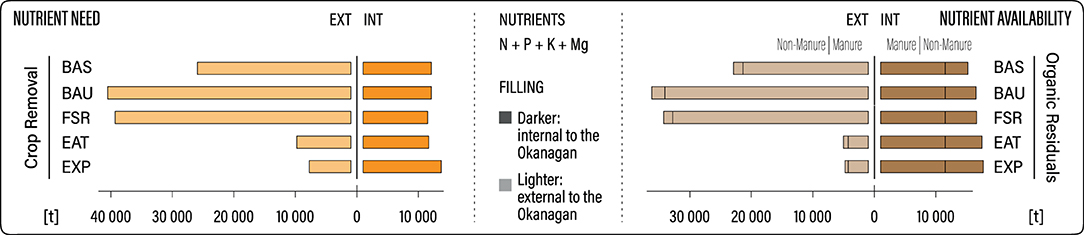
Figure 6. Nutrient need (crop nutrient removal) and nutrient availability (nutrients in organic residuals) across food system scenarios. Note that the numbers for all four considered nutrient elements were added together.
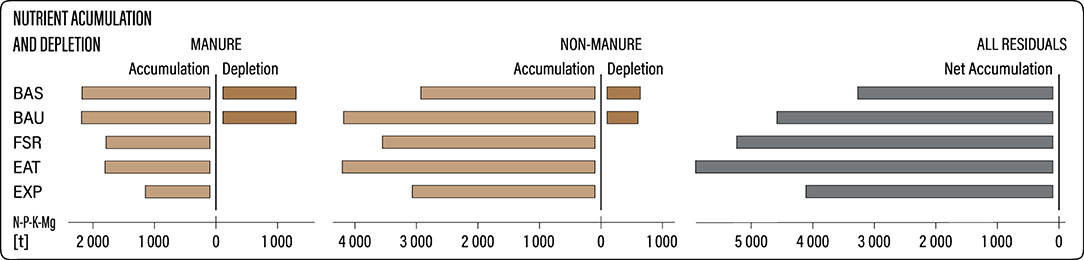
Figure 7. Nutrient accumulation and depletion across food system scenarios. Note that the numbers for all four considered nutrient elements were added together.
Food Self-Reliance
Optimization for food self-reliance (BAU to FSR) means that the Okanagan no longer exports agricultural commodities and that all of the food produced in the Okanagan is consumed locally (Figure 5). Given that export from the Okanagan is smaller than production for local supply and import, crop nutrient removal both internal, and external to the Okanagan remain virtually unchanged (Figure 6). Manure generation internal to the Okanagan does not change as animal numbers remain the same. Manure generation external to the Okanagan decreases slightly as there is no more feed export from the Okanagan. For both manure and non-manure residuals, nutrient accumulation in the Okanagan decreases and there no longer is nutrient depletion (Figure 7). This mirrors the ceasing of exports and consequently a larger share of food consumption in the Okanagan now comes from local consumption. Taken together, net nutrient accumulation is somewhat increased.
Dietary Change
Dietary change toward a planetary health diet (FSR to EAT) reduces the consumption of animal products and increases consumption of plant-based products. The reduced demand for animal products means that more land is required for food crop production and less for feed crop production. Internal to the Okanagan, there are no changes to agricultural production (Figure 5). This is because even the reduced demand of livestock still exceeds local production. But external to the Okanagan, there is a significant reduction in livestock numbers, as much fewer animal products need to be imported. As a consequence, there is also much less land needed outside the Okanagan to grow feed, see pathway 2. At the same time, the increased demand for food crop products means that imports increase, see pathway 1. Crop nutrient removal internal to the Okanagan is not affected appreciably, but there is a pronounced effect in regard to reducing crop nutrient removal external to the Okanagan (Figure 6). Nutrients available in animal manure are drastically reduced, most notably external to the Okanagan. This is because fewer animal products are consumed, which significantly reduces imports of animal products. For nutrients available in non-manure residuals, the effect of dietary change is minimal. Nutrient accumulation related to animal manure does not change as changes to livestock numbers take place external to the Okanagan. There is a slight increase in nutrient accumulation related to non-manure residuals, as well as to net nutrient accumulation.
Expansion of Agricultural Land in Production
Land base expansion (EAT to EXP) was modeled such that it affects only crop production while livestock production does not increase. Given that population and diet do not change, total land use—internal plus external to the Okanagan—remains constant (Figure 5). Expansion of agricultural production simply means that a higher share of the food commodities consumed in the Okanagan comes from local production, so that a lower share needs to be imported. Consequently, overall total nutrient need does not change either—it simply increases internal to the Okanagan and commensurately decreases external to the Okanagan. Similarly, the overall availability of nutrients in organic residuals slightly increases in the Okanagan and commensurately decreases external to the Okanagan. This is because increased local supply also means increased local food processing, which shifts some of the associated nutrient losses from external to internal to the Okanagan. All in all, nutrient accumulation both related to animal manure and non-manure residuals, as well as net nutrient accumulation decrease. This is because local production responds directly to expansion of agriculture land while consumption in the Okanagan remains constant.
Nutrient Circularity Across Scenarios
System Openness
System openness across food system scenarios is shown in Table 3, which clearly reveals that net feed and food imports to the Okanagan lead to an increased quantities of nutrients in organic residuals across all scenarios considered. At the same time, it becomes very apparent that this comes at the expense of reducing quantities external to the Okanagan. Note that the significantly smaller numbers for system openness external to the Okanagan for the EAT and EXP scenarios are the result of overall smaller nutrient flows external to the Okanagan upon dietary change from a conventional to the planetary health diet. In absolute terms, the Okanagan benefits from nutrient inputs elsewhere under these dietary change and land expansion scenarios in a way similar to the BAU and FSR scenarios. But in relative terms, this impact becomes more pronounced when overall nutrient flows external to the Okanagan are smaller, as under EAT and EXP. Another pattern that is noteworthy is that system openness is larger for nitrogen and phosphorus than for potassium and magnesium. This reflects that in livestock production, relatively more nitrogen and phosphorus partition into the livestock product rather than manure as compared to potassium and magnesium.
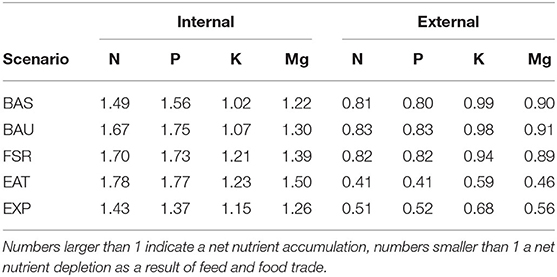
Table 3. System openness across scenarios, internal and external to the Okanagan.
Nutrient Self-Reliance
To assess nutrient self-reliance for current residual management practices and the long-term potential, crop nutrient removal was contrasted with nutrients recovered per current recovery efficiencies. For the purpose of this analysis, it was simply assumed that fertilizer requirements equal crop nutrient removal. In reality, depending on the extent of nutrient losses and inputs through other sources, fertilizer requirements may be larger or smaller than crop nutrient removal. Nutrient self-reliance can thus be improved by increased agronomic efficiency and greater reliance on biological nitrogen fixation.
For all nutrients considered, there are greater quantities in animal manure than in other organic residuals, both internal and external to the Okanagan. This pattern does not change across scenarios. With current residual management practices, across all scenarios, nutrients recovered from organic residuals are insufficient to meet crop nutrient needs, both internal and external to the Okanagan (Table 4).
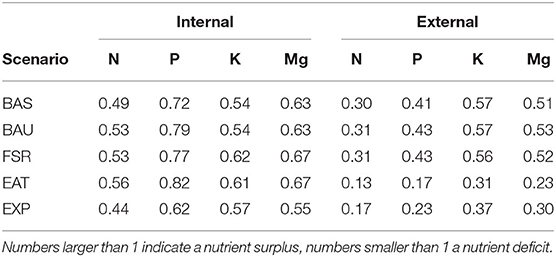
Table 4. Nutrient self-reliance—current residual management practices.
With improved nutrient recovery, across all scenarios, it should be possible to meet nitrogen and phosphorus needs (i.e., compensate for crop removal) internal to the Okanagan, but this does mostly not apply to potassium and magnesium (Table 5). External to the Okanagan, across all scenarios and nutrients, recovered nutrients are still insufficient to meet nutrient need.
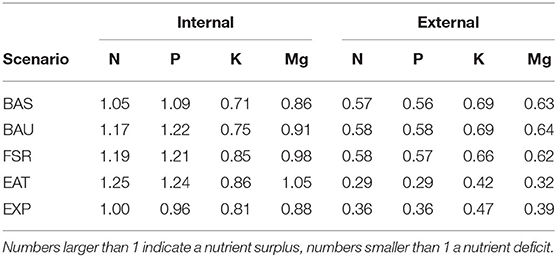
Table 5. Nutrient self-reliance—long-term potential.
Discussion and Outlook
A number of recent studies have assessed the potential of nutrients in organic residuals to supply the nutrient inputs required for crop production (e.g., Metson et al., 2016; Parchomenko and Borsky, 2018; Trimmer and Guest, 2018; Akram et al., 2019; Leinonen et al., 2019). These studies concerned larger areas than the Okanagan, and for the most part featured a higher spatial resolution. Our analysis differed from previous studies in that it assessed not only nutrient circularity internal to a given geographical area, but also how feed and food trade influence nutrient circularity external to it. To this effect, we applied an innovative accounting scheme for nutrient flow analysis in food systems utilizing a suite of food system scenarios in the Okanagan bioregion in British Columbia, Canada. In this way, it was possible to explore, in quantitative terms, the impact of feed and food trade on nutrient circularity. This kind of analysis should be useful to explore, ideally together with food system and organic residual management actors, how different food system and organic residual management scenarios impact nutrient circularity, locally in the geographical area being considered, but also in the places with which feed and food are traded.
Key Findings
While it was possible to discern differences across scenarios internal to the Okanagan, differences often were more pronounced external to the Okanagan, notably in response to population increase and diet change. Our analysis also clearly revealed the extent to which improvements in nutrient self-reliance in the Okanagan affect nutrient self-reliance external to the Okanagan, in the areas with which feed and food are traded. These findings further emphasize the importance of considering circularity across nested scales (see also Koppelmäki et al., 2021). To be clear, a lowered nutrient self-reliance external to the Okanagan does not imply that nutrient self-reliance in the places with which the Okanagan trades feed and food in absolute terms needs to be lower than in the Okanagan. This depends on the extent to which these external regions import and export feed and food with other regions outside the Okanagan. Rather, what our analysis shows is that, overall, the Okanagan lowers nutrient self-reliance outside its spatial boundaries in comparison to a hypothetical situation where feed and food trade with the Okanagan were in balance.
As for the Okanagan, if nutrient circularity was strived for, the best strategy would be to utilize all suitable arable land in the bioregion and shift toward a more plant-based diet (scenario EXP). But even with these measures in place, more than half of the food consumed would originate in feed or food crops produced outside the bioregion. Even if population growth in the bioregion was restricted, this number would not go lower than about one third at best. In light of the net nutrient accumulation in the Okanagan, which takes place irrespective of the food system scenario, there is a clear need for comprehensive nutrient recovery from organic residuals, including food waste and human excreta. Moreover, part of the recovered nutrients ought to be made available to places outside the Okanagan to compensate for nutrient imports with feed and food. In other words, in the face of system openness due to feed and food trade, nutrient recovery in the bioregion should exceed that needed for supplying local nutrient needs.
Potential Limitations and Desirable Model Refinements
Our approach, which involved the modeling of both the food and organic residual management system, was quite data intensive. For some aspects of the model, however, there were no reliable data. This applied in particular to the fate of nutrients in animal manures and residues, where quite coarse assumptions were applied. Likewise, calculations for the various subsystems followed a rather rudimentary approach. For example, we modeled livestock systems as a black box based on data available in agricultural statistics rather than taking a process-based approach. Also, the technical coefficients (crop yields, characteristics of livestock systems, structure and performance of organic residual management, etc.) external to the Okanagan were assumed to be the same as internal to the Okanagan. We considered these simplifications a good enough approximation for the purpose of this assessment.
Still, in light of other recent method development in the field of nutrient flow analysis, there undoubtedly is ample room for refining our approach by integrating some of the work done by other researchers in the field. One addition that would be particularly valuable is to compare not only the quantities of nutrients that are required for crop production and available in residuals, but also what form they are in and whether that implies certain constraints given a certain agronomic context (see Trimmer et al., 2019). To this effect, it would be important to also consider the stoichiometry of soil and crop nutrient demand, including carbon. If the stoichiometry of a recycled fertilizer product does not match soil or crop needs, this either leads to over fertilization with some nutrients, or that some nutrients need to be replenished from other sources (Nelson and Janke, 2007; Maltais-Landry et al., 2016). In this regard, it would be particularly illustrative to investigate the potential contributions of increased agronomic nutrient use efficiency and better integration of biological nitrogen fixation into agricultural production systems. It would also be sensible to further disaggregate the analysis so that it separately considers for instance rangeland and arable land, or even different farming practices on arable land insofar as they differ in terms of nutrient use efficiency and biological nitrogen fixation. This is because it can be expected that, without improved microbially mediated nutrient use efficiency and the increased integration of biological nitrogen fixation, nutrient recovery from organic residuals will not be sufficient to fully overcome the reliance on industrial fixation or mining of nutrients.
Future Work
At this juncture, our analysis can be regarded as a proof-of-concept illustrated with a case study. In the future, we would welcome more case studies like the one presented here. If this type of approach wants to gain traction to inform policy, it would be important to conduct a thorough sensitivity and uncertainty analysis. This would benefit from implementing the calculation model in a programming language like Julia or R. Moreover, to explore scenarios beyond the status quo in production, supply, and residual management, it would be helpful to expand the model so that it allows to consider how changes at the level of individual production systems (e.g., from conventional production to organic production, or from annual to perennial systems) would affect nutrient circularity. This would allow actors in different sectors better understand their role and impact. Finally, it would be desirable to embed future case studies in a co-production approach. That is, the model would be run by a research team to help a broader group of societal actors explore the implications and plausibility of different food system and organic residual management scenarios across nested spatial scales. Such an approach would follow current best practice in sustainability assessment in that it would fully embrace the increasing understanding that co-production by academics and non-academics promises to better address the complex nature of contemporary sustainability challenges than more traditional scientific approaches (Zijp et al., 2016; Matthews et al., 2019; Norström et al., 2020). Either way, our work demonstrates the importance of explicitly considering the entanglement of nutrient circularity across scales, locally in the food system being considered, as well as in the places with which feed and food are traded.
Data Availability Statement
A description of data sources along with model input data and calculation outputs can be found in the Supplementary Material. Requests to access raw data should be directed to Robin Harder,cm9iaW4uaGFyZGVyQHdldHJ5aGFyZGVyLmNo.
Author Contributions
RH: conceptualization, methodology, software, formal analysis, investigation, data curation, writing—original draft, visualization, project administration, and funding acquisition (analysis of nutrient circularity). KM: conceptualization, writing—review and editing, project administration, and funding acquisition (Okanagan Bioregion Food System Project). SS: conceptualization, writing—review and editing, and supervision. All authors contributed to the article and approved the submitted version.
Funding
This work was supported by Formas, the Swedish Research Council for Environment, Agricultural Sciences and Spatial Planning (grant agreement 2016-00859).
Conflict of Interest
The authors declare that the research was conducted in the absence of any commercial or financial relationships that could be construed as a potential conflict of interest.
Publisher's Note
All claims expressed in this article are solely those of the authors and do not necessarily represent those of their affiliated organizations, or those of the publisher, the editors and the reviewers. Any product that may be evaluated in this article, or claim that may be made by its manufacturer, is not guaranteed or endorsed by the publisher.
Acknowledgments
We gratefully acknowledge Kamal Kakish for assisting with mapping the solid waste and wastewater management infrastructure in the Okanagan as part of a work learn internship at the University of British Columbia in 2019.
Supplementary Material
The Supplementary Material for this article can be found online at: https://www.frontiersin.org/articles/10.3389/fsufs.2021.661870/full#supplementary-material
Supplementary Material 1. Calculation methodology in detail.
Supplementary Material 2. Spreadsheet model used for calculations.
Footnotes
1. ^While we acknowledge that the term “residue” is more commonly used in conjunction with e.g., crop or food residues, we here use the term 'residual' to be more inclusive of organic materials in e.g., municipal solid wastes and wastewater.
References
Akram, U., Quttineh, N. H., Wennergren, U., Tonderski, K., and Metson, G. S. (2019). Enhancing nutrient recycling from excreta to meet crop nutrient needs in Sweden—a spatial analysis. Sci. Rep. 9, 1–15. doi: 10.1038/s41598-019-46706-7
Arizpe, N., Giampietro, M., and Ramos-Martin, J. (2011). Food security and fossil energy dependence: an international comparison of the use of fossil energy in agriculture (1991–2003). CRC. Crit. Rev. Plant Sci. 30, 45–63. doi: 10.1080/07352689.2011.554352
Barquet, K., Järnberg, L., Rosemarin, A., and Macura, B. (2020). Identifying barriers and opportunities for a circular phosphorus economy in the Baltic Sea region. Water Res. 171:115433. doi: 10.1016/j.watres.2019.115433
Cobo, S., Levis, J. W., Dominguez-Ramos, A., and Irabien, A. (2019). Economics of enhancing nutrient circularity in an organic waste valorization system. Environ. Sci. Technol. 53, 6123–6132. doi: 10.1021/acs.est.8b06035
Conforti, P., and Giampietro, M. (1997). Fossil energy use in agriculture: an international comparison. Agric. Ecosyst. Environ. 65, 231–243. doi: 10.1016/S0167-8809(97)00048-0
Cordell, D., Drangert, J. O., and White, S. (2009). The story of phosphorus: global food security and food for thought. Glob. Environ. Chang. 19, 292–305. doi: 10.1016/j.gloenvcha.2008.10.009
Cordell, D., and White, S. (2014). Life's bottleneck: sustaining the world's phosphorus for a food secure future. Annu. Rev. Environ. Resour. 39, 161–188. doi: 10.1146/annurev-environ-010213-113300
Dorward, C., Smukler, S. M., and Mullinix, K. (2017). A novel methodology to assess land-based food self-reliance in the Southwest British Columbia bioregion. Renew. Agric. Food Syst. 32, 112–130. doi: 10.1017/S1742170516000053
Elser, J. J. (2012). Phosphorus: a limiting nutrient for humanity? Curr. Opin. Biotechnol. 23, 833–838. doi: 10.1016/j.copbio.2012.03.001
Fraser, E., Legwegoh, A., KC, K., CoDyre, M., Dias, G., Hazen, S., et al. (2016). Biotechnology or organic? Extensive or intensive? Global or local? a critical review of potential pathways to resolve the global food crisis. Trends Food Sci. Technol. 48, 78–87. doi: 10.1016/j.tifs.2015.11.006
Garnett, T. (2014). Three perspectives on sustainable food security: efficiency, demand restraint, food system transformation. What role for life cycle assessment? J. Clean. Prod. 73, 10–18. doi: 10.1016/j.jclepro.2013.07.045
Gruber, N., and Galloway, J. N. (2008). An Earth-system perspective of the global nitrogen cycle. Nature 451, 293–296. doi: 10.1038/nature06592
Harder, R., Giampietro, M., Mullinix, K., and Smukler, S. M. (2021a). Assessing the circularity of nutrient flows related to the food system in the Okanagan bioregion, BC Canada. Resour. Conserv. Recycl. doi: 10.1016/j.resconrec.2021.105842
Harder, R., Giampietro, M., and Smukler, S. M. (2021b). Towards a circular nutrient economy. a novel way to analyze the circularity of nutrient flows in food systems. Resour. Conserv. Recycl. 172:105693. doi: 10.1016/j.resconrec.2021.105693
Harder, R., Wielemaker, R., Molander, S., and Öberg, G. (2020). Reframing human excreta management as part of food and farming systems. Water Res. 175, 1–8. doi: 10.1016/j.watres.2020.115601
Harris, G., Nixon, D., Newman, L., and Mullinix, K. (2016). Delineating the Southwest British Columbia bioregion for food system design and planning: a practical approach. J. Agric. Food Syst. Community Dev. 6, 71–86. doi: 10.5304/jafscd.2016.064.010
Jones, D. L., Cross, P., Withers, P. J. A., Deluca, T. H., Robinson, D. A., Quilliam, R. S., et al. (2013). REVIEW: nutrient stripping: the global disparity between food security and soil nutrient stocks. J. Appl. Ecol. 50, 851–862. doi: 10.1111/1365-2664.12089
Karlsson, J. O., and Röös, E. (2019). Resource-efficient use of land and animals—Environmental impacts of food systems based on organic cropping and avoided food-feed competition. Land Use Policy 85, 63–72. doi: 10.1016/j.landusepol.2019.03.035
Koppelmäki, K., Helenius, J., and Schulte, R. P. O. (2021). Nested circularity in food systems: a Nordic case study on connecting biomass, nutrient and energy flows from field scale to continent. Resour. Conserv. Recycl. 164:105218. doi: 10.1016/j.resconrec.2020.105218
Lamine, C., Magda, D., and Amiot, M. J. (2019). Crossing sociological, ecological, and nutritional perspectives on agrifood systems transitions: towards a transdisciplinary territorial approach. Sustain 11:1284. doi: 10.3390/su11051284
Leinonen, I., Eory, V., and MacLeod, M. (2019). Applying a process-based livestock model to predict spatial variation in agricultural nutrient flows in Scotland. J. Clean. Prod. 209, 180–189. doi: 10.1016/j.jclepro.2018.10.236
Maltais-Landry, G., Nesic, Z., Grant, N., Godinez, M., Thompson, B., Hsu, L. Y., et al. (2019). Quantifying trade-offs among on-farm and off-farm fertility sources to make vegetable organic farming systems more sustainable. Agric. Ecosyst. Environ. 286:106657. doi: 10.1016/j.agee.2019.106657
Maltais-Landry, G., Scow, K., Brennan, E., Torbert, E., and Vitousek, P. (2016). Higher flexibility in input N: pratios results in more balanced phosphorus budgets in two long-term experimental agroecosystems. Agric. Ecosyst. Environ. 223, 197–210. doi: 10.1016/j.agee.2016.03.007
Manning, D. A. C. (2015). How will minerals feed the world in 2050? Proc. Geol. Assoc. 126, 14–17. doi: 10.1016/j.pgeola.2014.12.005
Matthews, N. E., Stamford, L., and Shapira, P. (2019). Aligning sustainability assessment with responsible research and innovation: towards a framework for constructive sustainability assessment. Sustain. Prod. Consum. 20, 58–73. doi: 10.1016/j.spc.2019.05.002
McConville, J., Drangert, J. O., Tidåker, P., Neset, T. S., Rauch, S., Strid, I., et al. (2015). Closing the food loops: guidelines and criteria for improving nutrient management. Sustain. Sci. Pract. Policy 11, 33–43. doi: 10.1080/15487733.2015.11908144
Metson, G. S., MacDonald, G. K., Haberman, D., Nesme, T., and Bennett, E. M. (2016). Feeding the corn belt: opportunities for phosphorus recycling in U.S. agriculture. Sci. Total Environ. 542, 1117–1126. doi: 10.1016/j.scitotenv.2015.08.047
Nelson, N. O., and Janke, R. R. (2007). Phosphorus sources and management in organic production systems. Horttechnology 17, 442–454. doi: 10.21273/HORTTECH.17.4.442
Nesme, T., Metson, G. S., and Bennett, E. M. (2018). Global phosphorus flows through agricultural trade. Glob. Environ. Chang. 50, 133–141. doi: 10.1016/j.gloenvcha.2018.04.004
Nesme, T., and Withers, P. J. A. (2016). Sustainable strategies towards a phosphorus circular economy. Nutr. Cycl. Agroecosyst. 104, 259–264. doi: 10.1007/s10705-016-9774-1
Norström, A. V., Cvitanovic, C., Löf, M. F., West, S., Wyborn, C., Balvanera, P., et al. (2020). Principles for knowledge co-production in sustainability research. Nat. Sustain. 3, 182–190. doi: 10.1038/s41893-019-0448-2
Parchomenko, A., and Borsky, S. (2018). Identifying phosphorus hot spots: a spatial analysis of the phosphorus balance as a result of manure application. J. Environ. Manage. 214, 137–148. doi: 10.1016/j.jenvman.2018.01.082
Razon, L. F. (2018). Reactive nitrogen: a perspective on its global impact and prospects for its sustainable production. Sustain. Prod. Consum. 15, 35–48. doi: 10.1016/j.spc.2018.04.003
Robert, N., Garcia, G., Tatebe, K., and Mullinix, K. (2018). Delineating the Okanagan Bioregion for Food System Study, Research Brief from the Okanagan Bioregion Food System Design Project. Richmond, BC: Institute for Sustainable Food Systems. Available online at: https://www.kpu.ca/sites/default/files/ResearchBrief_Delineatingbioregion_final.pdf
Robles, Á., Aguado, D., Barat, R., Borrás, L., Bouzas, A., Giménez, J. B., et al. (2020). New frontiers from removal to recycling of nitrogen and phosphorus from wastewater in the Circular Economy. Bioresour. Technol. 300:122673. doi: 10.1016/j.biortech.2019.122673
Röös, E., Patel, M., Spångberg, J., Carlsson, G., and Rydhmer, L. (2016). Limiting livestock production to pasture and by-products in a search for sustainable diets. Food Policy 58, 1–13. doi: 10.1016/j.foodpol.2015.10.008
Rosemarin, A., Macura, B., Carolus, J., Barquet, K., Ek, F., Järnberg, L., et al. (2020). Circular nutrient solutions for agriculture and wastewater—a review of technologies and practices. Curr. Opin. Environ. Sustain. 45, 78–91. doi: 10.1016/j.cosust.2020.09.007
Senthilkumar, K., Mollier, A., Delmas, M., Pellerin, S., and Nesme, T. (2014). Phosphorus recovery and recycling from waste: an appraisal based on a French case study. Resour. Conserv. Recycl. 87, 97–108. doi: 10.1016/j.resconrec.2014.03.005
Smil, V. (2000). Enriching the Earth: Fritz Haber, Carl Bosch, and the Transformation of World Food Production. Cambridge, MA: MIT Press.
Steffen, W., Richardson, K., Rockström, J., Cornell, S. E., Fetzer, I., Bennett, E. M., et al. (2015). Planetary boundaries: guiding human development on a changing planet. Science 80:347. doi: 10.1126/science.1259855
Sutton, M. A., Howard, C. M., Bleeker, A., and Datta, A. (2013). The global nutrient challenge: from science to public engagement. Environ. Dev. 6, 80–85. doi: 10.1016/j.envdev.2013.03.003
Trimmer, J. T., and Guest, J. S. (2018). Recirculation of human-derived nutrients from cities to agriculture across six continents. Nat. Sustain. 1, 427–435. doi: 10.1038/s41893-018-0118-9
Trimmer, J. T., Margenot, A. J., Cusick, R. D., and Guest, J. S. (2019). Aligning product chemistry and soil context for agronomic reuse of human-derived resources. Environ. Sci. Technol. 53, 6501–6510. doi: 10.1021/acs.est.9b00504
van der Wiel, B. Z., Weijma, J., van Middelaar, C. E., Kleinke, M., Buisman, C. J. N., and Wichern, F. (2020). Restoring nutrient circularity: a review of nutrient stock and flow analyses of local agro-food-waste systems. Resour. Conserv. Recycl. 160:104901. doi: 10.1016/j.resconrec.2020.104901
Van Zanten, H. H. E., Herrero, M., Van Hal, O., Röös, E., Muller, A., Garnett, T., et al. (2018). Defining a land boundary for sustainable livestock consumption. Glob. Chang. Biol. 24, 4185–4194. doi: 10.1111/gcb.14321
Vitousek, P. M., Aber, J. D., Howarth, R. W., Likens, G. E., Matson, P. A., Schindler, D. W., et al. (1997). Human alteration of the global nitrogen cycle: sources and consequences. Ecol. Appl. 7, 737–750. doi: 10.1890/1051-0761(1997)007[0737:HAOTGN]2.0.CO;2
Willett, W., Rockström, J., Loken, B., Springmann, M., Lang, T., Vermeulen, S., et al. (2019). Food in the anthropocene: the EAT–Lancet Commission on healthy diets from sustainable food systems. Lancet 393, 447–492. doi: 10.1016/S0140-6736(18)31788-4
Withers, P. J. A., Forber, K. G., Lyon, C., Rothwell, S., Doody, D. G., Jarvie, H. P., et al. (2020). Towards resolving the phosphorus chaos created by food systems. Ambio 49, 1076–1089. doi: 10.1007/s13280-019-01255-1
Wohlfahrt, J., Ferchaud, F., Gabrielle, B., Godard, C., Kurek, B., Loyce, C., et al. (2019). Characteristics of bioeconomy systems and sustainability issues at the territorial scale. A review. J. Clean. Prod. 232, 898–909. doi: 10.1016/j.jclepro.2019.05.385
Zhao, S., Schmidt, S., Qin, W., Li, J., Li, G., and Zhang, W. (2020). Towards the circular nitrogen economy—amazon.com global meta-analysis of composting technologies reveals much potential for mitigating nitrogen losses. Sci. Total Environ. 704:135401. doi: 10.1016/j.scitotenv.2019.135401
Zijp, M. C., Posthuma, L., Wintersen, A., Devilee, J., and Swartjes, F. A. (2016). Definition and use of solution-focused sustainability assessment: a novel approach to generate, explore and decide on sustainable solutions for wicked problems. Environ. Int. 91, 319–331. doi: 10.1016/j.envint.2016.03.006
Keywords: nutrient metabolism, agriculture, recycling fertilizer, nutrient recirculation, nutrient recovery, nutrient self-reliance, feed and food trade
Citation: Harder R, Mullinix K and Smukler S (2021) Assessing the Circularity of Nutrient Flows Across Nested Scales for Four Food System Scenarios in the Okanagan Bioregion, BC Canada. Front. Sustain. Food Syst. 5:661870. doi: 10.3389/fsufs.2021.661870
Received: 31 January 2021; Accepted: 07 July 2021;
Published: 07 September 2021.
Edited by:
Steven J. Vanek, Colorado State University, United StatesReviewed by:
Florian Wichern, Rhine-Waal University of Applied Sciences, GermanyHanna J. Poffenbarger, University of Kentucky, United States
Copyright © 2021 Harder, Mullinix and Smukler. This is an open-access article distributed under the terms of the Creative Commons Attribution License (CC BY). The use, distribution or reproduction in other forums is permitted, provided the original author(s) and the copyright owner(s) are credited and that the original publication in this journal is cited, in accordance with accepted academic practice. No use, distribution or reproduction is permitted which does not comply with these terms.
*Correspondence: Robin Harder, cm9iaW4uaGFyZGVyQHdldHJ5aGFyZGVyLmNo