 Scott D. Peterson
 Ricardo Amón1,2
 Edward S. Spang
 Christopher W. Simmons
- 1Department of Food Science and Technology, University of California, Davis, Davis, CA, United States
- 2California Institute of Food and Agricultural Research, University of California, Davis, Davis, CA, United States
- 3KWW Energy Services LLP, Sacramento, CA, United States
- 4Center for Water-Energy Efficiency, University of California, Davis, Davis, CA, United States
Small breweries have been growing in number and volume share in the US marketplace. Brewing is water- and energy-intensive, especially for small brewers who do not benefit from the same economies of scale as large brewers. A systematic approach to characterizing the water and energy flows in small breweries will help researchers and process owners identify opportunities for efficiency improvement by reducing waste. The information from such analysis yields granular information about where water and energy (electrical and thermal) are embedded into beer. It also contextualizes a small brewery's specific water and energy consumption relative to peer breweries, providing a quantitative basis for decision-making that ultimately impacts economic competitiveness. In the present work, a case study is performed on a microbrewery in northern California. Visualization tools are provided that delineate how water and energy flow through the brewery. Specific electrical energy consumption was 183.7 MJ per US beer barrel (bbl) (1.6 MJ/L) packaged in the first half of 2018, thermal energy 489.4 MJ/bbl (4.2 MJ/L), water 12.8 bbl consumed/bbl (12.8 L/L), and wastewater 10.8 bbl discharged/bbl (10.8 L/L). These specific resource consumptions are placed into context relative to other small breweries. The metrics are high due to general inefficiency relative to peer facilities, reverse economies of scale in small breweries, and associated utility costs impacted by geographic location. Overall utility costs were $26.95 per bbl packaged vs. $16.01 for similar-sized breweries. This analysis sheds light on the virtuous cycle of how reducing one input in the beer-water-energy nexus will often lead to other resources being conserved as well, due to the overlapping nature of their embedment in the final product.
Introduction
Water and energy are increasingly scrutinized resources as populations grow and industries develop. Water and fossil fuel energy are hot-button issues due to resource finitude, climate change, and economic concerns–especially in the western United States. Water and energy often overlap in their use, a concept known as the water-energy nexus (WEN). The overlap can often be seen in both directions: heat is necessary to generate steam from water and water is involved upstream in the processing of electricity or natural gas (Spang et al., 2014). Appreciation of the interlinked nature of the WEN informs resource management decisions (Scott et al., 2011; Amón et al., 2017; Portney et al., 2017).
WEN analysis is a descriptive quantitative approach for characterizing a brewery's water and energy use, and it may be valuable to the industry in its efforts to reduce resource consumption. Optimizing water and energy use is critical for maintaining competitiveness in the brewing industry, as with other food processing industries (Amón et al., 2017). Brewing requires tremendous heat input to boil the wort, and it is already commonplace to measure water in a ratio of volumes of water consumed to volumes of beer packaged (beer volumes in the United States are reported in US beer barrels; 1 bbl = 31.0 US gallons = 117.3 liters). Annually, close to 200 million bbl of beer (23.5 billion L) are produced in the United States, requiring an estimated 33.8 billion MJ of energy and 758 million bbl of water (89 billion L) (Worldwide Brewing Alliance, 2011; Brewers Association, 2016, 2018; BIER, 2017; TTB National Revenue Center, 2018). Furthermore, the number of small craft brewers–which can be less efficient users of water and energy relative to large breweries (Kubule et al., 2016)–has exploded in recent years from 2,420 in 2012 to 6,266 in 2017 (Brewers Association, 2016, 2018). Reducing specific water and energy consumption in smaller brewers is therefore a growing imperative. Prior work has highlighted the critical importance of quantifying material and energy flows in brewing as a basis to inform efficiency and sustainability improvements (Schaltegger et al., 2012; Olajire, 2020). Notably, for material and/or energy assessments of both small and large breweries, the WEN is not well-quantified (Schaltegger et al., 2012; Kubule et al., 2016) even though the use of water and energy are inherently linked and thus important for overall process efficiency.
To understand how water and energy become embedded in beer at small breweries, a case study was performed at a northern California microbrewery. A material and energy flow (MEF) analysis was performed to characterize overall specific water and energy consumption for the brewery and to identify the internal pathways and destinations of those resources. The energy was defined in terms of thermal (from natural gas) and electrical components. A subsystem boundary was created around the WEN to sort and identify areas where energy and water use overlap during the craft brewing process. The WEN was divided into various interlinked “WEN points” representing distinct process areas. Steam and pumping systems were systematically cataloged and analyzed, and the brewing facility was diagrammed. Utility and production data were aggregated over a period of two and a half years to show a longitudinal change in specific resource consumption: areas of high consumption are considered targets for future efficiency projects. The brewery was placed into a context with peer facilities of all sizes regarding its specific water consumption (vw), specific wastewater discharge (vww), and specific energy consumption (electrical, eel; thermal, eth; total, etot). The opportunities were identified to eliminate waste and improve water and energy consumption. Benchmarking specific resource consumption relative to peer facilities gives a small brewery, an edge in a competitive marketplace. Operating decisions that promote more sustainable consumption of resources provide small breweries with opportunities for cost savings and may help retain customers as well (Carley and Yahng, 2018). By providing a framework for characterizing and optimizing specific resource consumption, this article promotes additional research and case studies that collectively reduce water and energy consumption among small breweries.
Materials and methods
The brewing process
Malt is received as raw material, whereupon it is milled and routed to the mashing and lautering processes to convert grain starch to fermentable sugars and coarsely separate solids from the sugar-rich liquid. The resulting “wort” is then boiled, with the addition of hops and process aids as necessary: to sanitize the mixture, precipitate proteins, and isomerize bitter hop compounds. The hot wort is chilled and oxygenated, then sent to a fermentation vessel, and held at a controlled temperature while fermentation progresses. Fermentation temperatures typically range from 4 to 13°C for lagers and 16 to 24°C for ales. In addition to lower temperatures, lagers also require additional time for fermentation and maturation, and can therefore account for greater eel than that of ales (Sturm et al., 2013). The resulting “green beer” requires some time and intervention to mature, clarify, and stabilize before it is filtered, pasteurized, packaged (into bottles, cans, or kegs), and removed from the brewery for distribution. All of these steps are not only followed by every brewer but also the process is substantially consistent between facilities.
The case study brewery
Although most US craft brewers specialize in ales, this brewer predominantly produces lagers. The facility, located in northern California, operates in a batch process up to 5 days a week, year-round. Batches of beer are brewed, fermented, cold-conditioned, filtered, and packaged into kegs, bottles, or cans. The facility produces nearly 10,000 bbl per year (~1.2 million L), classifying it as a microbrewery (Brewers Association, 2018). The larger of the two brewhouses is a 60-bbl (7,041 L) system manufactured by Steinecker; it is the only system described below except where noted. The smaller is a 15-bbl (1,760 L) direct-fired brewhouse made by Caspary.
Water enters the facility from the municipal supply at 35 psi and 65°F. It is river water supplemented with groundwater as necessary. The water for the steam generator (SG) passes through a softener as the only form of pretreatment. The process water (for production, cleaning, and heat exchange) is softened and then filtered by reverse osmosis (RO). The process water passes to the cold liquor tank (CLT) where it is maintained at 1.1°C by a glycol-chilled loop. From there, it may reduce mash temperature by direct addition, help seal pumps, or pass through a heat exchanger to chill boiled wort, whereupon the heated cold liquor is sent to the hot liquor tank (HLT). Hot liquor tank (HLT) water is used for clean-in-place (CIP) processes, as well as for direct addition to the mash tun and lauter tun. Its temperature is maintained at 82.2°C by heat exchange with steam. Cold liquor tank (CLT), hot liquor tank (HLT), lauter tun, and CIP reservoir are all wrapped with insulating foam. Automated process valves are actuated by compressed air.
The mash tun and kettle are both steam-jacketed. Lager beers ferment for ~2 weeks, chilled by glycol to maintain fermentation temperature, and at which time they are cold-conditioned in lagering tanks for 2 more weeks. Motor-mounted rakes are used to automate the spent grain removal from the lauter tun. After the fermentable sugars have been extracted and the sweet wort separated from the malt, the spent grains are collected and hauled away by a local farmer to use as cattle feed. Clean-in-place (CIP) water is maintained in a steam-jacketed reservoir. Brewhouse equipment is cleaned by CIP weekly; fermentors and lagering tanks are cleaned between each use. Carbon dioxide (CO2) is let into tanks after cleaning to purge oxygen from the space.
The bottling line, manufactured by Krones, can fill bottles of varying sizes. Kegs are filled by gravity with assistance from CO2 head pressure. A third-party vendor supplies portable equipment to fill cans. Beer is filtered on its way to the packaging hall for most brands. Both the kegging and bottling lines require steam for sanitizing and compressed air for actuation of the machinery. The compressed air is supplied by a 15-horsepower Kaeser SK 15 rotary air compressor. Because oxygen will lead to premature staling of packaged beer (Vanderhaegen et al., 2006), CO2 is used to purge oxygen from bottles and kegs before and after they are filled and to blanket the filler bowl that is used for counter-pressure filling.
Material and energy flow analysis
For the overall brewery analysis, a gate-to-gate model was applied. While the upstream malting process requires significant quantities of water and energy, it is generally considered a brewing process prerequisite rather than one that falls within the boundaries of the brewery. Likewise, considerable water and energy are embedded in downstream distribution, retail, and consumption of beer, but these stages are also outside the scope of this investigation.
Our gate-to-gate system boundary includes the raw materials (malt, hops, and CO2) received at the brewery, as well as all utilities (water, electricity, and natural gas). The final product is beer packaged into bottles, cans, or kegs. This focused system boundary enables the contextualization of the case study brewery relative to others in the industry, based on available benchmarking data (Brewers Association, 2016). Specific water and energy consumption were visualized using Sankey diagrams and built using the online SankeyMATIC tool (Bogart, 2015).
Water and energy nexus assessment framework
To characterize the WEN, boundaries were drawn within the overall facility, segregating those operations where energy becomes embedded in the water. Energy assets (e.g., SG, centrifugal pumps, compressors, and packaging equipment) of the facility were sorted into one of seven “WEN points” or else placed outside the WEN. The WEN points are represented in Figure 1 and indicate how water flows between them and where energy becomes embedded in the water. The energy assets are accounted for with a high degree of resolution either in one of the WEN points or in the “non-WEN assets” category, as presented in Table 1. Water may flow from one WEN point to another, within the facility boundaries, and have energy embedded in both areas. Water also enters the product stream directly and the product is assumed to consist of only water. Including the non-WEN assets in a whole-facility MEF analysis accounts for the non-WEN water and energy that are embedded in the final product. In other food processing industries, a similar approach has been used to identify water and energy efficiency opportunities (Amón et al., 2014, 2017).
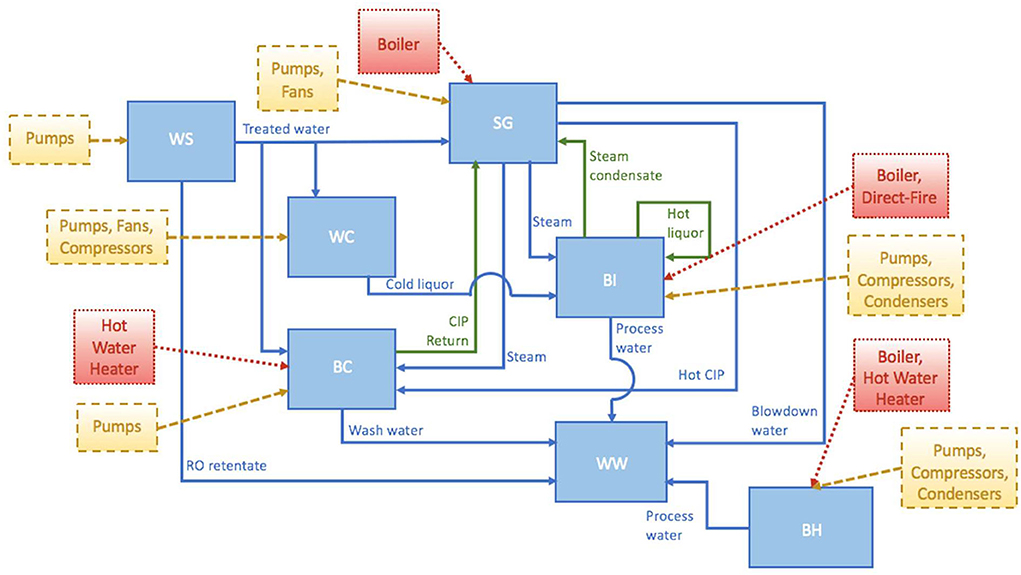
Figure 1. Schematic representation of the water energy nexus (WEN) at the brewery [Figure shows how water flows between WEN points (blue) and where it is reused (green). Blue boxes represent WEN points at which major process tasks are accomplished and at which energy may be embedded in water. WEN points are labeled using abbreviations (see Table 1). The streams between WEN points are labeled. The energy that is embedded in the water at the WEN points is shown in yellow (electrical) and red (thermal), labeled with the types of equipment imparting the energy. Not shown are areas where water leaves the network of WEN points, for example, as product, lost steam, filtration losses, fermentation losses, and absorbed by spent grains].
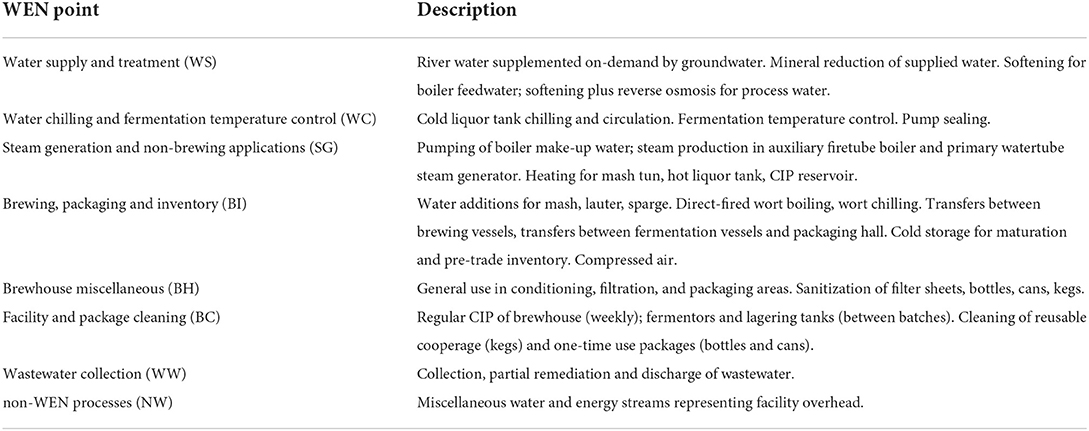
Table 1. Water energy nexus (WEN) points within the brewery.
Water consumption–the amount of water passing from a WEN point to either a drain product or a co-product–was assigned to the relevant WEN points. Specific water passage from a WEN point (to another WEN point or otherwise recirculated internally to the system) was also calculated. Results were aggregated over the first 6 months of 2018. Water-energy intensity (WEi) is calculated for water passed through each WEN point, with units of MJ/bbl. Water-energy intensity (WEi) cannot be calculated for non-WEN processes because although these processes consume either water or energy, energy is not being embedded into the water. Due to the internal circulation of certain water flows, results are calculated for Table 2 first in terms of specific energy consumption (MJ per barrel of beer packaged), and then in terms of WEi (MJ per barrel of water “passed” or the amount of water that flows through a given WEN point). Comparison of these two related metrics allows one to better understand what operations or WEN points tend to amplify the effect of energy being embedded in water.
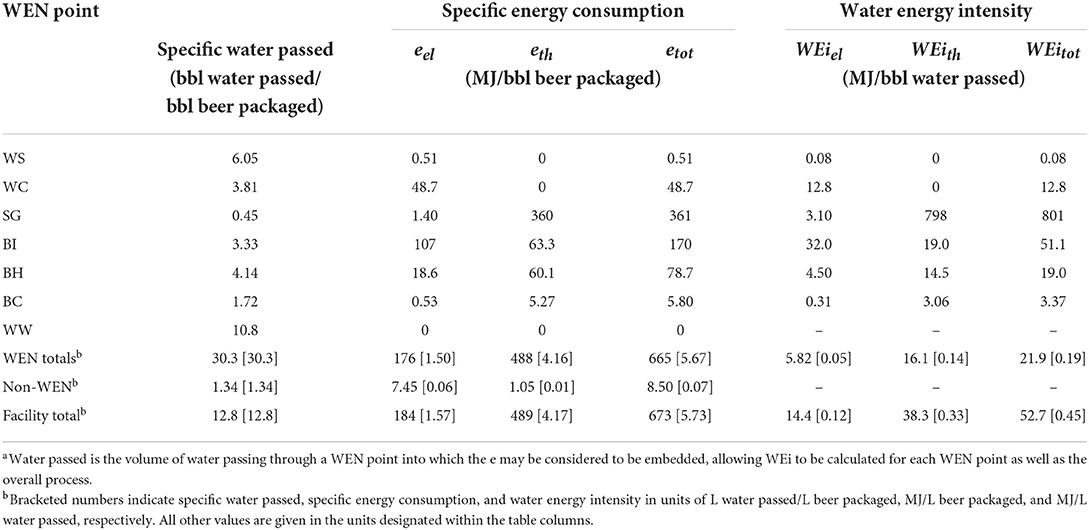
Table 2. Specific energy consumption (e) and water energy intensity (WEi) of brewery WEN pointsa.
Wastewater at the facility is composed of several effluent streams with varying water quality. The fraction of water retained by the RO system is sent straight to the drain. The process water not entering the product stream is mostly sent to the drain and some are lost to steam or spent grains. All the water consumed in the process is considered to be embedded in the product. Product losses from vessel transfers and filtration–and CIP water with accumulated soil loads–are collected and drained after the pH has been remediated to a level acceptable by the municipal authority. Other wastewater discharged includes SG blowdowns and water from rinsing, washing, and cleaning the facility.
Power consumption survey
Power consumption data were collected for the electrical motors driving the critical pumps using logging power meters (Fluke Corporation, Everett, WA, USA). Where this was not possible, operating parameters were estimated from nameplate specifications and manufacturer pump curves. Pump duty cycles were determined by interviewing facility personnel responsible for pump operation. Annual energy (MJ) was estimated from power measurements or calculations. Power consumption multiplied by the coefficient of usage (the proportion of time a given asset is operating) gives energy consumption over a period of time for steady power consumers, such as pumps running at a constant speed. Other brewhouse processes had their power monitored and logged over a typical batch process, which was integrated with respect to time to find energy consumption. Electrical and thermal energy consumption was calculated for all major energy-consuming assets (see Figure 2) and assigned to the relevant WEN point.
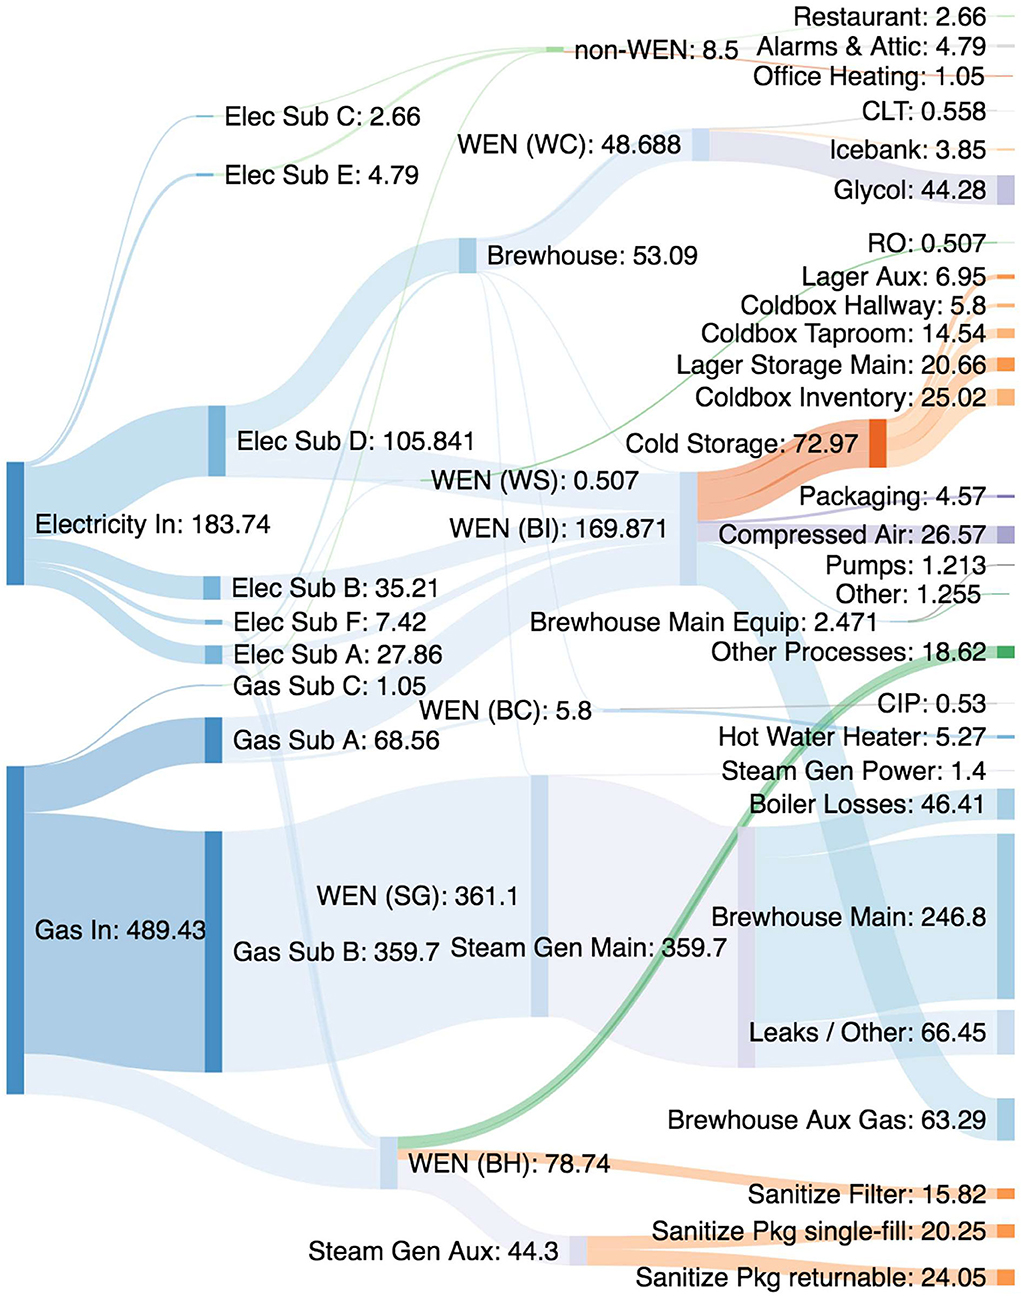
Figure 2. Sankey diagram showing the distribution of electrical and thermal energy in the brewery processes during the first 6 months of 2018 [WEN points are included by their abbreviation (see Table 1) to help visualize their interconnectedness. The width of each stream is proportional to its contribution to specific energy consumption in MJ/bbl packaged. Streams are identified and quantified using a combination of submetering, equipment operational parameters, measurements, and estimates. Some energy could not be fully accounted for and was placed into unknown categories “Other,” “Other Processes,” and “Leaks/Other.” The energy enters the facility at the left and finds its end use at the right].
Steam system audit
Brewing and packaging are the two main demand-side WEN uses for steam. Each has its own dedicated SG. The main natural gas-fueled SG (model Clayton E-100) produces steam on-demand to heat the HLT (via a heat exchanger), as well as the mash tun, kettle, and CIP reservoir (by the steam jacket). Feedwater deaeration occurs in the hotwell of the SG due to heat and residence time, rather than requiring a dedicated deaerator. The steam network has four steam traps to separate liquid condensate from dry steam and a pressure-reducing valve at the CIP reservoir. Because the facility runs on a batch process and the SG contains only a low volume of steam and accompanying short startup time–and lacks an automated monitoring system–it is shut down at the end of each shift and blowdown is performed to drain the steam coil. The coil must be kept either completely dry or saturated with deaerated water, to avoid corrosion pitting. The SG has an economizer on the exhaust stack, meaning some thermal energy is recouped from flue gases.
The auxiliary boiler is a 6-horsepower General Boiler Scotch marine firetube unit used exclusively in the packaging processes. Its steam sanitizes bottles and kegs before they are packaged. Feedwater first passes through a softener. All demand-side steam from this boiler is lost to evaporation or to the drain. A small hot water generator is used to sterilize filter plates and fittings.
Walkthroughs of the facility and subsequent steam system assessment were followed according to the published guidance (The American Society of Mechanical Engineers, 2010a) for the main SG. Boiler efficiency was determined using the US Department of Energy's (DOE). Steam System Assessment Tool (US Department of Energy, 2008a). Owing to the lack of installed flow meters on the steam system, flow rates were estimated based on SG fuel consumption from the dedicated natural gas submeter in conjunction with boiler nameplate efficiency and steam system operating parameters. The DOE Steam System Modeler Tool (version 3) was used to model the steam system from measured and calculated values, and the DOE Steam System Modeler was used to build mass and energy balances for the steam system (US Department of Energy, 2014).
Pumping system audit
Centrifugal pumps are used at the facility to transport water for product streams (e.g., wort and beer), as well as water for heating, glycol for chilling, and miscellaneous smaller tasks. Demand-side WEN uses include pumped transfers of water and grains from the mash tun to lauter tun, sweet wort from the lauter tun to kettle (lauter pump), unfermented wort from the kettle to fermentor, passing through a heat exchanger to heat CLT water (knockout pump), green beer from the fermentor to lagering tank, and finished beer from the lagering tank to packaging hall; as well as facility and package cleaning. Supply-side WEN usage includes pumping for water supply and treatment, water chilling, and steam generation. The lauter pump and the knockout pump are outfitted with variable frequency drives (VFDs).
Water is supplied by the municipal authority and is softened before use as boiler feedwater. It is softened and filtered by RO for brewing process water. The boiler feedwater is dosed with Clayton Coil Guard 400 by chemical metering pumps. The packaging hall auxiliary boiler also receives softening and chemical metering (Chem Aqua CA-900 and Chem Aqua CA-100). The water is chilled by a heat exchange loop with a glycol loop run by two 15-horsepower Carlyle compressors in parallel and stored in the CLT. The positive-displacement SG feedwater pump is driven in series with the fan by the same 7.5-horsepower Baldor motor. The auxiliary boiler is fed by a small booster pump. The HLT pump used to circulate the hot liquor through the heat exchanger also sends hot water to the mash tun and lauter tun for the brewing process.
Cleaning of the facility and packages is the final WEN point in the facility's process. Kegs are cleaned and sanitized with caustic solution and steam from the auxiliary boiler. Brewhouse vessels are cleaned and rinsed of debris between batches and cleaned with a hot caustic CIP step on a weekly basis. Fermentor and lagering vessels are cleaned with a hot caustic solution between each batch.
Critical WEN pumping assets were cataloged and their nameplate operating parameters were recorded according to the published guidance (The American Society of Mechanical Engineers, 2010b). These comprised the pumps in the brewhouse itself as well as those circulating water from the CLT, HLT, and CIP reservoirs. All other pumps were driven by motors deemed too small to be audited. Neither pressure gauges nor flowmeters were able to be installed, so the flow was measured for each critical pump using a Doppler/ultrasonic hybrid flowmeter (Badger Meter Inc., Milwaukee, WI). All pipe runs, bends, fittings, and valves were cataloged to calculate minor frictional losses. Critical pumps were evaluated using the Pumping System Assessment Tool (PSAT) from the DOE (US Department of Energy, 2008b).
Resource efficiency metrics
Brewery efficiency can be measured in the context of water and energy by taking the specific consumption of those utilities, calculated by dividing the utility in question by the volume of beer packaged over a given time period. Water-energy intensity (WEi) is found by dividing the energy consumption e, by specific water passed by a given WEN point. Case study data from the years 2016 and 2017, as well as the first 6 months of 2018, have been used in these calculations so efficiency improvements over time can be quantified:
Result and discussion
Water-energy intensity (WEi) and vw are calculated for each WEN point and presented in Table 2. Energy and water consumption and their relation to the various WEN points, are represented in Figures 2, 3, respectively. These data were used to calculate WEi values. Specifically, to emphasize the connection between energy and water in different process areas, e is divided by vw to calculate WEi (Table 2). First, e is presented in MJ/bbl beer packaged. This is a measure of the energy consumed in a process area or WEN point relative to the production of sellable packaged beer. Next comes WEi, with units of MJ/bbl water passed. This indicates the the ratio of energy consumed by a process to the water that passes through that same process. Units of “bbl water passed” are used rather than “bbl water consumed” because in some cases water is recirculated and re-used within the WEN boundaries. Water may pass from one WEN point to another and have energy imparted in both. This can be seen in Figure 3. The more water that passes through a given WEN point, the more modest its energy-intensity seems, as the energy consumed in this WEN point is distributed across a large volume.
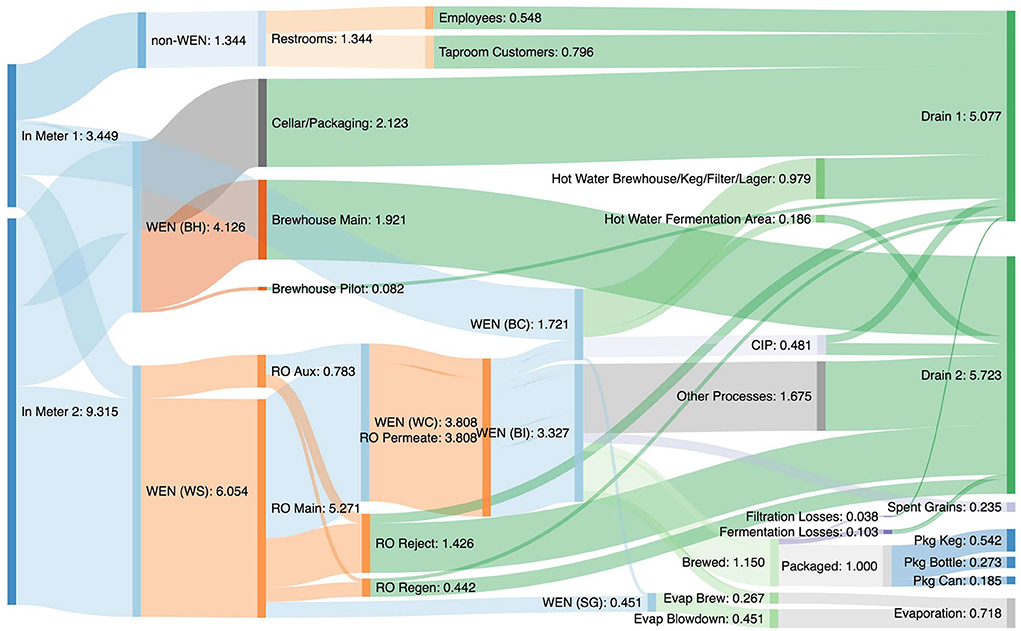
Figure 3. Sankey diagram showing source and destination of water flows in the brewery [WEN points are included by their abbreviation (see Table 1) to help visualize their interconnectedness. The width of each stream is proportional to its contribution to specific water consumption in bbl/bbl packaged for the first 6 months of 2018. Flows are identified and quantified using a combination of submetering, equipment operational parameters, measurements, and estimates. Some water use could not be fully accounted for and was placed into the unknown category “Other Processes.” Water enters the facility at the left and exits at the right].
Within the WEN boundaries, the WEi metric was estimated at 5.82 MJ/bbl water passed (0.05 MJ/L water passed) for electrical energy and 16.1 MJ/bbl of water passed (0.14 MJ/L water passed) for thermal energy, making 21.9 MJ/bbl of water passed (0.19 MJ/L water passed) for total energy. These values are lower than specific energy consumption because of the relatively high value of vw, the denominator of WEi. The RO system rejected 33.6% of incoming water, meaning 1.43 bbl of water is sent straight to the drain for every barrel of beer that ultimately gets packaged. This specific water passed is captured in the WEi metric.
Given that certain water flows are either reused or pass through multiple WEN points, acquiring WEi at each, Table 2 and Figure 3 show that 30.3 bbl of water per bbl packaged beer passes through the various WEN points. If e is considered only against 12.8 bbl of water consumed per bbl packaged beer, WEi values appear much higher [WEiel = 14.4 MJ/bbl (0.12 MJ/L), WEith = 38.3 MJ/bbl (0.33 MJ/L)] than if internal water flows are accounted for. Using a denominator of the volume of water passed helps contextualize each WEN point within the overall process because it gives a picture of how energy is being embedded into the water flowing through a given WEN point. Reducing the energy required for a process will drive down WEi and reducing passed water will increase WEi. A facility could use WEi values along with e and vw as a baseline for the performance of the process at each WEN point and for evaluating the cost and benefit of water- or energy-saving initiatives vs. this baseline. The use of WEi as a metric can be helpful in addressing both water and energy efficiency but requires baselines to be established and measured for the processes in question.
The main SG was found or estimated to have a 90% condensate return rate, 4.5% blowdown rate, and 85.6% boiler combustion efficiency, meaning 12.9% of thermal energy is lost to boiler inefficiencies and further 18.5% to steam that does not return to the SG. Total boiler energy costs were estimated at $21,980 per year. Steam generation consumes 73.5% of thermal energy at the case study facility. The steam generation had a specific water passthrough rate of only 0.45 bbl water passed per bbl of beer packaged, meaning WEi is greater than e for the energy assets that make up the SG WEN point. This is due to the recirculation of steam within a mostly closed system. etot of 361 MJ/bbl packaged (3.08 MJ/L packaged) becomes WEitot of 801 MJ/bbl passed (6.83 MJ/L passed). In cases such as the SG WEN point, specific energy is concentrated in the water. The water wasted here represents a large loss of embedded energy since recirculating water has energy embedded into it multiple times.
On the contrary, where WEi is less than e, more water passes through a WEN point than winds up in the final packaged product. Because much of this water will leave the WEN boundary as wastewater rather than product, embedded energy is concentrated in the packaged beer. Reducing water passing through such WEN points would tend to embed more energy into a given volume of water. WEi would therefore tend to increase, but performing a given process with less wasted water should also reduce the required energy, leading to reductions in both water and embedded energy.
Space cooling and product cooling are the largest demanders of electrical energy, representing 65.9% of electrical energy consumption (Figure 2). Air compressors represent the next greatest demand for electricity at 14.5% of total electrical energy consumption. A variety of more minor applications, including packaging equipment and pumps, make up the balance of electricity use. Overall, eel was 184 MJ/bbl packaged (1.57 MJ/L packaged) and eth was 489 MJ/bbl packaged (4.17 MJ/L packaged), totaling 673 MJ/bbl beer packaged (5.73 MJ/L packaged). In terms of specific water consumption, vw was 12.8 bbl consumed/bbl packaged and vww 10.8 bbl discharged/bbl packaged. The difference between vw and vww means that for every barrel of beer packaged, 2.0 barrels of water were not sent to the drain. This water either finds its way into the product (~1.0 bbl/bbl packaged) or is lost to evaporation (0.718 bbl/bbl packaged) or spent grains (0.235 bbl/bbl packaged).
It is common practice in breweries of any size to pass cold liquor through a heat exchanger to chill the wort after a batch has been brewed and then collect the resulting hot liquor for use in the subsequent batch (Mallett, 1997). This is a good intuitive application of WEN principles and indeed, this method supplies hot water to the case study brewery's HLT. The batches are not always brewed on adjacent days, however, which allows the recaptured thermal energy to dissipate. Of the 99 batches brewed on the main brewhouse in the first half of 2018, 56 were on nonconsecutive days. Because a batch of beer brewed more than a day after the previous one will require 45–60 min of additional startup time for the SG to re-embed heat lost to the atmosphere, the facility could realize energy savings of $0.291 per packaged barrel of beer by eliminating non-consecutive batches, using 2018 values:
There is a greater potential for savings if the same mindset is applied to the smaller brewhouse. Obviously, it may be more practical to distribute production volume across 12 calendar months, but an emphasis on consecutive scheduling will help reduce eth by minimizing losses of paid-for energy.
Benchmarking results, presented in Figure 4, show that the facility is consistently high with vw (and consequently, vww) relative to peers but shows improvement over time. The brewery is in line with similar-sized facilities for eel and slightly high for eth. Figure 5 shows that the brewery pays significantly more per unit of electricity than comparable facilities. As seen in Figure 6 where specific utility costs are stacked and compared with other breweries (grouped by size), electricity and natural gas are the facility's main utility expenses. Figure 4 also indicates that the facility purchases several times as much CO2 per volume of packaged beer as its peers, although this excess has declined as the facility internally has reviewed its processes.
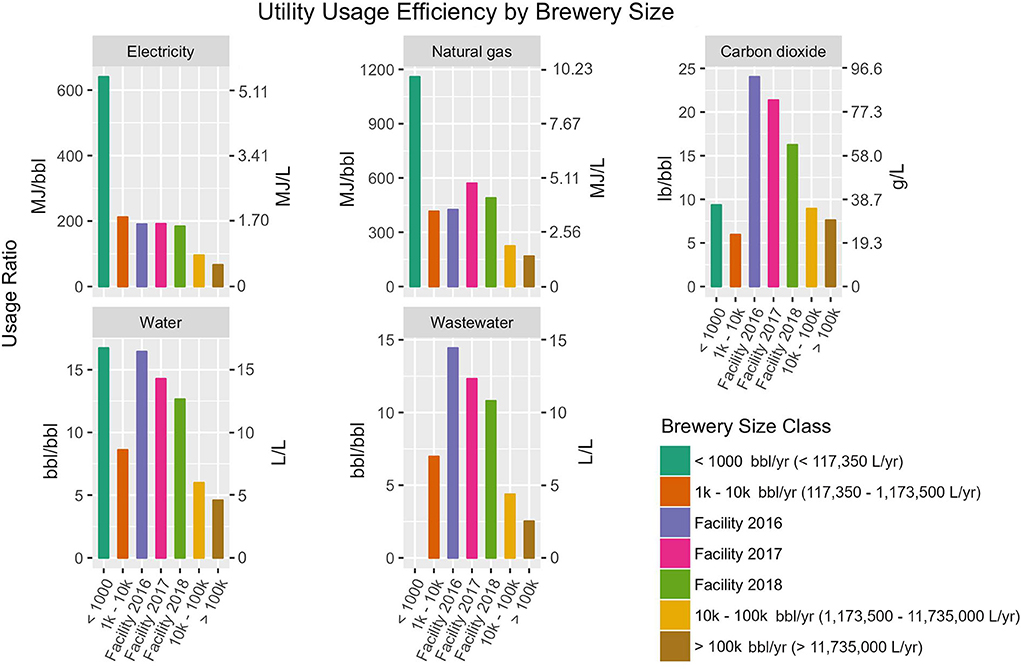
Figure 4. Specific resource consumption for electricity (eel, MJ/bbl, and MJ/L), natural gas (eth, MJ/bbl, and MJ/L), water (vw, bbl/bbl, and L/L), wastewater discharged (vww, bbl/bbl, and L/L), and CO2 (lb/bbl and g/L) [Data are not available for the mass of solid waste disposed at the case study facility. All usage ratios are per bbl packaged or per L packaged. Brewery historical usage ratios are placed between benchmark groups according to brewery size. The case study brewery packaged between 5,000 and 10,000 barrels in each of the years indicated. Benchmark data are from 2014 (Brewers Association, 2016)].
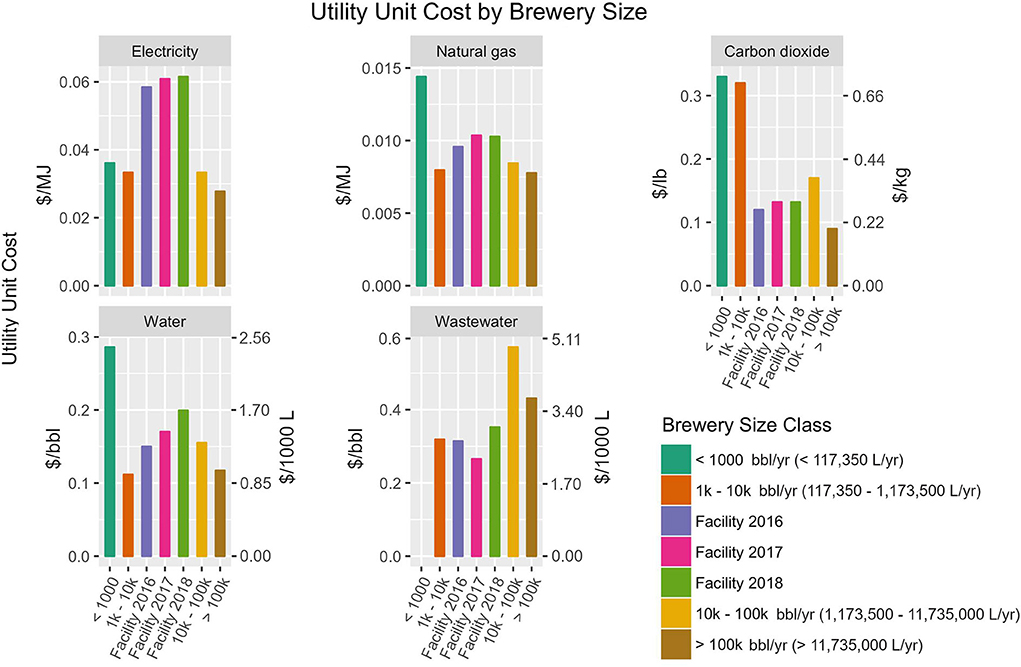
Figure 5. Specific utility cost, in dollars per unit, for electricity (MJ), natural gas (MJ), water (bbl), CO2 (lb), and wastewater discharged (bbl) [Data are not available for the mass of solid waste disposed at the case study facility. All usage ratios are per bbl packaged or per L packaged. Benchmark data are from 2014 (Brewers Association, 2016)].
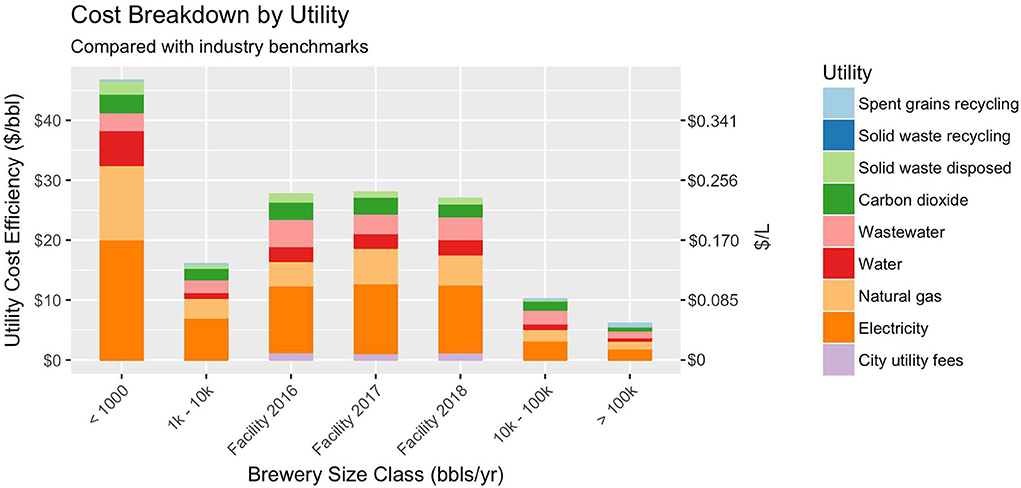
Figure 6. Specific utility cost ($/bbl packaged and $/L packaged) for case study brewery in 2016–2018 with all utilities stacked, compared with peer facilities of varying sizes [Benchmark data are from 2014 (Brewers Association, 2016)].
Any reduction in specific resource consumption will result in cost savings for the facility, given stable utility pricing. Improvement in vw–if it comes at a WEN point with embedded energy—will also reduce specific energy consumption, allowing the cost savings to stack (Andrews et al., 2012; Amón et al., 2014). Steam condensate is collected as much as possible and returned to the SG, but the steam system must be kept in good maintenance to avoid costly leaks. Water lost as a steam leak would be replaced by new water which would acquire eel from the RO system as well as high eth from the SG. In a typical system, 15–20% of steam traps may be malfunctioning without a regular preventive maintenance program (Galitsky et al., 2003). As presented in Figure 2, nearly 67 MJ/bbl of thermal energy was wasted by steam condensate that did not return to the SG. The facility has since taken steps to reduce steam leakage, the results of which can be seen in Figure 4 by the reduction in eth from 2017 to 2018. Reducing water loss from areas of high WEi is also a quick way to reduce energy waste. Areas of high vw or high e can be prioritized when pursuing both resource and cost savings, and the stacked resource savings–reductions in energy embedded in water–can be evaluated through WEi.
A typical brewery may expect utilities to cost 3–8% of operating expenses (Galitsky et al., 2003). The high electricity costs paid by the case study facility, as presented in Figure 5, are an artifact of the facility's location, commercial California electricity prices were 48% higher on average in 2017 than the rest of the nation (US Energy Information Administration, 2018). Small brewers are less efficient than large brewers by virtue of their scale, and those located in areas with expensive resources are compelled by utility prices to be conscious of their specific resource consumption. Improvements in vw for the case study facility over the course of the study are financially negated by increasing water costs, as presented in Figure 5. Overall utility costs, as presented in Figure 6, ranged from $27.98 per barrel packaged ($0.238/L packaged), in 2017, to $26.95 per barrel packaged ($0.230/L packaged), in 2018. Far more cost reduction work remains to bring the facility into line with its peer facilities, which pay an estimated $16.01 per barrel ($0.136/L) for combined utilities.
There are process areas with high water consumption that only have minimal WEi, as presented in Table 2. These could still be targeted for water efficiency without saving much in the way of energy, as with the 1.4 bbl water/bbl packaged which currently passes straight from the RO system to drain. This low soil-load water may be ideal for initial rinse water in cleaning operations (Galitsky et al., 2003; Schaltegger et al., 2012). Similarly, final rinse water could also be collected for reuse as initial rinse water. RO reject water could also be used to plumb the restrooms, which currently use untreated municipal water. Careful design of a cascading water reuse strategy will allow breweries to optimize their vw and vww, and in turn, WEi.
The water flow labeled “Cellar/Packaging” in Figure 3 represents 2.123 bbl consumed/bbl packaged of overhead water use at the facility which could not be traced directly to one of the WEN points. This represents a blind-spot in the present MEF analysis. General water use in the brewhouse, cellar, filtration, and packaging, should be reviewed and standard procedures developed. Identifying how much water is being consumed and where will be necessary to quantify future efficiency gains.
There is a small opportunity for the facility to increase efficiency by replacing the knockout pump, which moves the wort from the kettle through a heat exchanger and into fermenting vessels, PSAT-calculated operating efficiency was 22–29% depending on conditions. All other brewhouse pumps seemed to be operating well, with operating efficiencies calculated to be at least 90%. The efficiencies may be overestimated due to assumed values for loss coefficients in fittings. Nevertheless, the WEN analysis revealed brewhouse pumps to only be a very minor contributor to WEi in the brewing, packaging, and inventory WEN point.
Beyond the WEN, the steam, compressed air, and CO2 networks could be audited for leaks. This would identify areas where these resources are being unnecessarily lost from the system (Kubule et al., 2016). The facility could review the parameters of the compressors and condensers responsible for space cooling and glycol chilling. These systems account for nearly two-thirds of eel and re-tuning set temperatures and pressures will reduce eel if they are out of adjustment (Galitsky et al., 2003; Olajire, 2020). The facility could also contact their utility providers or energy education groups to ask about incentive programs for energy efficiency (The Brewers Association of Canada, 1998; Compressed Air Challenge, 2018).
Although design can help breweries close the loop on specific resource consumption, company strategy is a critical factor for keeping it low. Monitoring specific consumption and incentivizing its improvement can be very effective (McDonald, 1996). Instilling a culture of proactive maintenance–rather than reactive–can pay dividends with equipment costs and downtime. Leaving a 2.2 lb/hr (1.0 kg/hr) steam leak unrepaired for 1 year would carry away enough energy to brew 170 bbl (19,950 L) of beer (Olajire, 2020). Empowering process owners, as well as ongoing training and prioritization from management, will help instill a culture that works to reduce specific resource consumption (The Brewers Association of Canada, 1998; Legg and Castle, 2016; Olajire, 2020). Furthermore, a sustainability-focused mindset may attract and retain customers that are willing to pay a premium for a brewery's beer (Kawasaki and Kondo, 2005; Carley and Yahng, 2018).
The only wastewater treatment onsite at the facility is pH remediation before being discharged to the municipal wastewater treatment system. The leftover wort, beer, and process sediment carry considerable chemical and biochemical oxygen demand. These wastewater streams and spent grains hold potential for onsite energy generation utilizing existing anaerobic digestion technology, although the economics may be difficult to justify for smaller breweries (Mussatto et al., 2006; Schwencke, 2006; Muster-Slawitsch et al., 2011; Sturm et al., 2012; Becher et al., 2014; Gavinelli et al., 2015). Separating solids from the wastewater would reduce the high effluent strength and may provide leverage for negotiation with the municipal wastewater treatment plant (Mercer, 2014). Governmental incentives (local, state, and federal) should be investigated regarding generating onsite electricity. Solar collectors offer another alternative for onsite electricity generation, may be useful for providing low-grade process heat (Stumpe and Wasmuht, 2008; Muster-Slawitsch et al., 2011; Mauthner et al., 2014), and may be highly effective in California, especially during summer months when electrical demand for cooling capacity is at its highest.
Conclusion
WEN characterization gives high-resolution details which can provide decision-makers valuable information when pursuing energy- or water-efficiency projects. The case study brewery was analyzed through a novel WEN framework to identify the areas of wasted resources. Several key opportunities for cost and efficiency improvements were identified. First, the steam generator is a heavy energy user. Further efforts should be made to reduce and mitigate steam leaks and other sources of loss of the significant thermal energy embedded in the facility steam. While not all breweries use steam as their process heat source, they all require significant thermal energy. Other facilities scrutinizing their resource consumption should first consider heat transfer into product streams, opportunities to scavenge latent thermal energy and reuse of already-heated process water for other purposes. Similarly, the largest demand for electrical energy came from space- and product-cooling requirements. In the case of the case study facility, these were largely captured by the water chilling and fermentation temperature control (WC) WEN point. Jacketed tanks are more efficient than cooling a space filled with non-jacketed tanks; proper design, maintenance, and operation will help a chilled water system function in a way that does not embed excessive energy in water, helping save spending on both resources.
The techno-economic system modeling demonstrated through this case study, can serve as a framework for other breweries to identify and quantify opportunities for water and energy efficiency. Alternative practices and technologies, if implemented, must be compared with initial baselines to quantify improvement. As with the water flow from the present study which could not be placed into one of the well-defined WEN points, a material and energy flow analysis is only as good as its data. If resource use cannot be measured, then its reduction cannot be quantified. The WEi framework presented here can be utilized by other breweries or beverage manufacturing facilities wishing to measure, understand, and optimize their resource usage. Ongoing monitoring and data collection for process water and energy usage could help the facility to improve specific resource consumption, especially if they can invest in automated data collection and develop key process metrics. Options for cascading reuse of water and onsite electricity generation should be considered going forward.
Data availability statement
The original contributions presented in the study are included in the article/Supplementary material. Further inquiries can be directed to the corresponding author.
Author contributions
SP performed the literature review, collected onsite data at the brewery, led the data analysis, and served as the lead author of the manuscript. RA and TW assisted in the collection of onsite data at the brewery and contributed to data analysis. CS adapted his previous work on WEN analysis for the study. ES and CS helped to conceive the study, supervised the work, and contributed to manuscript writing and revision. All authors contributed to the article and approved the submitted version.
Funding
The authors would like to thank Emeritus Prof Charles Bamforth for funding the study.
Acknowledgments
The authors wish to thank the operations director, head brewer, plant engineer, and plant manager of the brewery used for this study. They are the managers of their process and without their invaluable insight the project could neither have been as insightful nor as productive. Furthermore, the authors wish to thank Prof Charles Bamforth for connecting and fostering dialogue between the researchers and the brewery.
Conflict of interest
Author TW was employed by KWW Energy Services LLP.
The remaining authors declare that the research was conducted in the absence of any commercial or financial relationships that could be construed as a potential conflict of interest.
Publisher's note
All claims expressed in this article are solely those of the authors and do not necessarily represent those of their affiliated organizations, or those of the publisher, the editors and the reviewers. Any product that may be evaluated in this article, or claim that may be made by its manufacturer, is not guaranteed or endorsed by the publisher.
Supplementary material
The Supplementary Material for this article can be found online at: https://www.frontiersin.org/articles/10.3389/fsufs.2022.1028520/full#supplementary-material
Supplementary Table 1. Complete dataset for Figures 2, 3 in the manuscript.
Supplementary Table 2. Complete dataset for Figure 4 in the manuscript.
Supplementary Table 3. Complete dataset for Figure 5 in the manuscript.
Supplementary Table 4. Complete dataset for Figure 5 in the manuscript.
Abbreviations
CIP, clean-in-place; CLT, cold liquor tank; DOE, US Department of Energy; E, energy consumed [MJ]; e, specific energy consumption [MJ/bbl packaged]; el, electrical; HLT, hot liquor tank; MEF, material and energy flow; RO, reverse osmosis; SG, steam generator; th, thermal; tot, total; Vpkg, volume of packaged beer [United States beer barrels, bbl, packaged]; Vw, volume of water consumed [bbl]; vw, specific water consumption [bbl/bbl packaged]; Vww, total volume of wastewater discharged [bbl]; vww, specific wastewater discharge [bbl/bbl packaged]; WEi, water energy intensity [MJ/bbl]; WEN, water-energy nexus.
References
Amón, R., Maulhardt, M., Wong, T., Kazama, D., and Simmons, C. (2014). Waste heat and water recovery opportunities in California tomato paste processing. Appl. Therm. Eng. 78, 525–532. doi: 10.1016/j.applthermaleng.2014.11.081
Amón, R., Wong, T., Kazama, D., Maulhardt, M., Maulhardt, T., and Simmons, C. W. (2017). Assessment of the industrial tomato processing water energy nexus: A case study at a processing facility. J. Ind. Ecol. 22, 904–915. doi: 10.1111/jiec.12600
Andrews, J. M. H., Hancock, J. C., Ludford-Brooks, J., Murfin, I. J., Houldsworth, L., and Phillips, M. (2012). 125th anniversary review: some recent engineering advances in brewing and distilling. J. Inst. Brew. 117, 23–32. doi: 10.1002/j.2050-0416.2011.tb00439.x
Becher, T., Blomenhofer, V., Monzel, A., and Wasmuht, K. (2014). Interface for renewable energy resources: holistic heat storage system enables self-sufficient brewery operation. MBAA Tech. Q. 51, 23–26. doi: 10.1094/TQ-51-2-0507-01
BIER (2017). 2016 BIER Water and Energy Use Benchmarking Study. St Paul: Beverage Industry Environmental Roundtable. Available online at: www.bieroundtable.com/blank-c1gkm (accessed October 4, 2018).
Bogart, S. (2015). SankeyMATIC. Available online at: http://sankeymatic.com/build/ (accessed August 30, 2018).
Brewers Association (2016). 2015 Sustainability Benchmarking Report. Boulder: Brewers Association. Available online at: https://s3-us-west-2.amazonaws.com/brewersassoc/wp-content/uploads/2017/04/2015-Brewers-Association-Benchmarking-Report.pdf (accessed December 15, 2016).
Brewers Association (2018). Statistics. Boulder: Brewers Association. Available online at: www.brewersassociation.org/category/insights/ (accessed October 13, 2016).
Carley, S., and Yahng, L. (2018). Willingness-to-pay for sustainable beer. PLoS ONE 13, e0204917. doi: 10.1371/journal.pone.0204917
Compressed Air Challenge (2018). Compressed Air Challenge. Available online at: www.compressedairchallenge.org/ (accessed November 7, 2018).
Galitsky, C., Martin, N., Worrell, E., and Lehman, B. (2003). Energy Efficiency Improvement and Cost Saving Opportunities for Breweries. Berkeley: University of California. Available online at: https://escholarship.org/uc/item/17r6j759 (October 1, 2018).
Gavinelli, C., Recanati, F., and Dotelli, G. (2015). Environmental impact of the brewing sector: Life cycle assessment of Italian craft and industrial beer (Master's thesis). Milan: Politecnico di Milano.
Kawasaki, Y., and Kondo, H. (2005). Challenges in the brewing business in Japan toward an environmentally friendly company. MBAA Techn. Q. 42, 107–112. doi: 10.1094/TQ-42-0107
Kubule, A., Zogla, L., Ikaunieks, J., and Rosa, M. (2016). Highlights on energy efficiency improvements: a case of a small brewery. Sustain. Consum. Prod. Res. Exp. Dev. 138, 275–286. doi: 10.1016/j.jclepro.2016.02.131
Legg, K., and Castle, J. (2016). Energy and water efficiency in breweries. MBAA Tech. Q. 53, 163–165. doi: 10.1094/TQ-53-3-0707-01
Mallett, J. (1997). Brewery configuration for craft brewing optimization. MBAA Tech. Q. 34, 252–256.
Mauthner, F., Hubmann, M., Brunner, C., and Fink, C. (2014). “Manufacture of malt and beer with low temperature solar process heat,” in Energy Procedia 48 [Proceedings of the 2nd International Conference on Solar Heating and Cooling for Buildings and Industry (SHC 2013)]. Energy Procedia, 1188–1193.
McDonald, W. (1996). Energy monitoring and targeting in the UK brewing industry. MBAA Tech. Q. 33, 138–148.
Mercer, J. (2014). Wastewater Basics for a Growing Craft Brewery. Craft Brewing Business. Available online at: http://www.craftbrewingbusiness.com/equipment-systems/wastewater-basics-growing-craft-brewery/ (accessed November 19, 2018).
Mussatto, S. I., Dragone, G., and Roberto, I. C. (2006). Brewers' spent grain: generation, characteristics and potential applications. J. Cereal Sci. 43, 1–14. doi: 10.1016/j.jcs.2005.06.001
Muster-Slawitsch, B., Weiss, W., Schnitzer, H., and Brunner, C. (2011). The green brewery concept – energy efficiency and the use of renewable energy sources in breweries. Appl. Therm. Eng. 31, 2123–2134. doi: 10.1016/j.applthermaleng.2011.03.033
Olajire, A. A. (2020). The brewing industry and environmental challenges. J. Clean. Prod. 256, 102817. doi: 10.1016/j.jclepro.2012.03.003
Portney, K. E., Hannibal, B., Goldsmith, C., McGee, P., Liu, X., and Vedlitz, A. (2017). Awareness of the food–energy–water nexus and public policy support in the United States: public attitudes among the American people. Environ. Behav. 50, 375–400. doi: 10.1177/0013916517706531
Schaltegger, S., Viere, T., and Zvezdov, D. (2012). Tapping environmental accounting potentials of beer brewing: information needs for successful cleaner production. J. Clean. Prod. 29–30, 1–10. doi: 10.1016/j.jclepro.2012.02.011
Schwencke, K. (2006). Sustainable, cost-effective, and feasible solutions for the treatment of brewers' spent grains. MBAA Tech. Q. 43, 199–202. doi: 10.1094/TQ-43-0199
Scott, C. A., Pierce, S. A., Pasqualetti, M. J., Jones, A. L., Montz, B. E., and Hoover, J. H. (2011). Policy and institutional dimensions of the water–energy nexus. Energy Policy 39, 6622–6630. doi: 10.1016/j.enpol.2011.08.013
Spang, E. S., Moomaw, W. R., Gallagher, K. S., Kirshen, P. H., and Marks, D. H. (2014). The water consumption of energy production: an international comparison. Environ. Res. Lett. 9, 105002. doi: 10.1088/1748-9326/9/10/105002
Stumpe, C., and Wasmuht, K. (2008). Solar process heat generation in breweries considered technologically and financially practical and sustainable. MBAA Tech. Q. 45, 121–123. doi: 10.1094/TQ-45-2-0121
Sturm, B., Butcher, M., Wang, Y., Huang, Y., and Roskilly, T. (2012). The feasibility of the sustainable energy supply from bio wastes for a small scale brewery – a case study. Appl. Therm. Eng. 39, 45–52. doi: 10.1016/j.applthermaleng.2012.01.036
Sturm, B., Hugenschmidt, S., Joyce, S., Hofacker, W., and Roskilly, A. P. (2013). Opportunities and barriers for efficient energy use in a medium-sized brewery. Appl. Therm. Eng. 53, 397–404. doi: 10.1016/j.applthermaleng.2012.05.006
The American Society of Mechanical Engineers (2010a). Energy Assessment for Steam Systems. The American Society of Mechanical Engineers. Available online at: http://www.asme.org/products/codes-standards/ea3-2009-energy-assessment-steam-systems (accessed December 1, 2017).
The American Society of Mechanical Engineers (2010b). Energy Assessment for Pumping Systems. The American Society of Mechanical Engineers. Available online at: http://www.asme.org/products/codes-standards/ea2-2009-energy-assessment-pumping-systems (accessed December 1, 2017).
The Brewers Association of Canada (1998). Energy Efficiency Opportunities in the Canadian Brewing Industry. Ottawa: The Brewers Association of Canada. Available online at: http://www.nrcan.gc.ca/sites/www.nrcan.gc.ca/files/oee/pdf/infosource/PDFs/M27-01-945E.PDF (accessed September, 1, 2018).
TTB National Revenue Center (2018). Beer statistics. Washington, DC: Alcohol and Tobacco Tax and Trade Bureau. Available online at: www.ttb.gov/beer/beer-stats.shtml (accessed October 13, 2016).
US Department of Energy (2008a). Steam System Assessment Tool. US Department of Energy. Available online at: http://www1.eere.energy.gov/manufacturing/tech_deployment/software_ssat.html (accessed August 30, 2018).
US Department of Energy (2008b). Pumping System Assessment Tool. US Department of Energy. Available online at: http://www1.eere.energy.gov/manufacturing/tech_assistance/software_psat.html (accessed March 4, 2018).
US Energy Information Administration (2018). Electricity: Detailed State Data. Washington, DC: US Energy Information Administration. Available online at: http://www.eia.gov/electricity/data/state/ (accessed October 26, 2018).
Vanderhaegen, B., Neven, H., Verachtert, H., and Derdelinckx, G. (2006). The chemistry of beer aging – a critical review. Food Chemi. 95, 357–381. doi: 10.1016/j.foodchem.2005.01.006
Worldwide Brewing Alliance (2011). Report on Environment and Utilities Sustainability. Worldwide Brewing Alliance. Available online at: https://worldwidebrewingalliance.org/docs/publications/WBA_Report_on_Environment_and_Utilities_Sustainability.pdf (accessed September 1, 2018).
Keywords: water energy nexus, brewing, resource use, embedded energy, food water energy
Citation: Peterson SD, Amón R, Wong T, Spang ES and Simmons CW (2022) Material and energy flow analysis of craft brewing: A case study at a California microbrewery. Front. Sustain. Food Syst. 6:1028520. doi: 10.3389/fsufs.2022.1028520
Received: 26 August 2022; Accepted: 17 October 2022;
Published: 10 November 2022.
Edited by:
Pankaj B. Pathare, Sultan Qaboos University, OmanReviewed by:
Tobi Fadiji, Stellenbosch University, South AfricaRasaq Lamidi, University of Birmingham, United Kingdom
Copyright © 2022 Peterson, Amón, Wong, Spang and Simmons. This is an open-access article distributed under the terms of the Creative Commons Attribution License (CC BY). The use, distribution or reproduction in other forums is permitted, provided the original author(s) and the copyright owner(s) are credited and that the original publication in this journal is cited, in accordance with accepted academic practice. No use, distribution or reproduction is permitted which does not comply with these terms.
*Correspondence: Christopher W. Simmons, Y3dzaW1tb25zQHVjZGF2aXMuZWR1