 Omarsherif M. Jemal
 Daniel Callo-Concha2,3
 Meine van Noordwijk
- 1College of Agriculture and Environmental Science, Arsi University, Asela, Ethiopia
- 2Center for Development Research (ZEF), University of Bonn, Bonn, Germany
- 3Institute for Environmental Sciences (iES), University of Koblenz-Landau, Landau, Germany
- 4World Agroforestry Centre (ICRAF), Southeast Asia Regional Programme, Bogor, Indonesia
- 5Plant Production Systems Group, Wageningen University, Wageningen, Netherlands
The impacts on food security of a transition from agriculture focused on local consumption to the participation in global markets are uncertain, with both positive and negative effects reported in the literature. In Ethiopia, coffee production for global markets has attracted growers from across the country to the coffee-forest zones. From a national perspective, the area is not a priority for food security enhancement, as financial indicators suggest food sufficiency. In this setting, we collected food security and dietary intake data from a total of 420 (3X140) units of households, non-breast-feeding children under 5 years, and women of reproductive age. Sampling was done in two-stages, a random selection of 300 households (out of a total of 4,300) Yayu, followed by sub-sampling of households with a child and woman meeting the above-mentioned criteria. Samples were used to determine a number of food and nutrition security indicators. More than 83% of the households were found to be hunger-free in the shortage season, but dietary diversity was suboptimal. More than 50% of children under 5 years of age and women lacked foods containing heme iron in the surplus season and 88% in the shortage season. Household food security during the surplus season did not depend on income, but wealth was significantly correlated (p < 0.01) with all of the food insecurity indicators except the “Body Mass Index” of target women in the shortage season. The strongest and weakest correlation was with the “House Food Insecurity Access Scale” (−0.85), and “Weight-to-Age Z-Score” (0.25), respectively. Overall, Yayu is not fully food secure, though the situation is better than average for the country. While household income helps in achieving calorific sufficiency, greater awareness of the relevance of dietary diversity and the local means to achieve it is needed to further improve nutritional status, regardless of the participation in global markets.
Introduction
Household financial capital and income can support Food and Nutrition Security (FNS), but its interaction with on-farm production of diverse and nutritious food can be complex. Since the “entitlement” concept of Sen (1981) and its endorsement as the “access” pillar became widely used in food security definitions (World Bank, 1986; FAO, 2009), two major viewpoints have been offered.
The first one affirms that integrating cash crops would effectively reduce rural poverty and positively contribute to FNS via enhancing income security of households and thus their acquisition of food in markets (Timmer, 1997; Pingali and Heisey, 1999; Jemal et al., 2018). Household income security is key particularly in areas dominated by cash crops while suffering periodic food shortages. In areas where cash crops dominate and terms of trade are favorable, farmers can outsource the production of cereal staples and pulses to other areas, and focus on the production of cash crops and some non-storable food crops (Govereh and Jayne, 1999, 2003; Brüntrup and Herrmann, 2010; Achterbosch et al., 2014; van Noordwijk et al., 2014; Kuhn and Endeshaw, 2015; Virchow et al., 2016). Furthermore, the integration of cash crops in the food production system contributes to the household FNS indirectly, through the combat of rural poverty and attainment of “healthy living” standards, while reducing vulnerability to the food shortage caused by environmental, market and other hazards, which are common to single crop-based farming systems. In addition, the economic improvement may stimulate the use of improved farming inputs and technologies, which ultimately augment the productivity and increase the sustainability of the food production system (Govereh and Jayne, 2003; Masanjala, 2006; Hashmiu et al., 2022). In other words, cash crops start a positive spiral out of poverty.
In contrast, a second viewpoint suggests that the introduction of cash crops will cause a negative impact on the smallholder farm households' food security, as it will compete for the means of production such as land, water and labor (Brüntrup and Herrmann, 2010; Kuhn and Endeshaw, 2015; Virchow et al., 2016; Jemal et al., 2021). Furthermore, the international demand for agricultural non-food products may influence strongly and displace the crops produced by small-scale farmers (Keyzer et al., 2005; Dose, 2007; Kuhn and Endeshaw, 2015; Virchow et al., 2016; Jemal et al., 2018; Andreotti et al., 2022). This competition may not only cause a decline in the quantity of food produced, but also deepen the fragmentation and degradation of land due to over-exploitation, which would contribute to food insecurity and poverty. Gender differentiation in control over the cash-crop income determines priorities for its use. Also, it is pointed out, that the reliability on purchased food can be hazardous, by the risks and high costs that the food marketing systems entail (Govereh and Jayne, 1999, 2003; Achterbosch et al., 2014). Moreover, the dominance of agricultural products cultivation for non-food is highly volatile, as their market is influenced by many external factors at different scales, which are fluctuating and unpredictable (Govereh and Jayne, 1999, 2003; Achterbosch et al., 2014; Jemal and Callo-Concha, 2017; Andreotti et al., 2022).
These contradicting viewpoints call for a detailed and contextualized analysis to propose adequate policy measures. For instance, in Ethiopia, which hosts more than 30 million of undernourished people (Birara et al., 2015; World Bank, 2021), a major policy effort to address FNS is the Productive Safety Net Program (PSNP), which targets episodic and chronic food-deficits at woreda1 level, by reducing the vulnerability of households to food insecurity through encouraging their asset increase and promotion of environmental rehabilitation (Devereux et al., 2006; Berhane et al., 2014; Hailu and Amare, 2022).
But, data on people's nutritional status at woreda-level hardly exists (Rajkumar et al., 2012; Girma et al., 2021). For instance, in the west Gojam zone, identified by the PSNP as a food-secure area, a cross-sectional study estimated that 43.2% of the children under 5 years were affected by chronic malnutrition, and 49.2% were underweight (Teshome et al., 2009). Mekonnen and Gerber (2017) cross-checked data from 2004 to 2010 of six woreda from central Ethiopia, namely Bakko, Sibu-Sire, Lume, Adaa, Hettosa, and Tiyyo, to found out that none of them were considered food-insecure and included under PSNP, but about 27% of the household members had shown a borderline caloric intake (< 2,100 kcal/day). These findings confirm that woreda identified as food secure might not necessarily be such, and current targeting may limit the effectiveness of the PSNP (Gilligan et al., 2008; Coll-Black et al., 2011; Berhane et al., 2014).
Furthermore, the PSNP identification of food insecure woreda essentially based on the households' economic status, implying that high-income was equivalent to the acquisition of the minimum caloric requirement, and the opposite, low income meant persistent food insecurity (MoARD, 2009). As result, many cash crop-sustained woreda were taken as food secure, implying that the income generated by selling these cash crops was essentially used for food acquisition. The Illubabor, Jimma, Keffa, and Sheka zones, which are the major coffee producing areas of the country (Gole, 2015; Jemal et al., 2018) were never labeled as food insecure (FEWS NET, 2002, 2004, 2005, 2009, 2011, 2013, 2015, 2017). Smallholder coffee growers of these areas contribute the largest share of the main export commodity of Ethiopia, coffee, whose annual export quantity and value reach 230,246 tons and 742, 823,000 USD (FAOSTAT, 2020).
These facts underline the guiding hypothesis of this study, that woreda-specific data on people's food and nutrition status could provide a more realistic backdrop for food security interventions, instead of taking the households economic status only. For that, this study aimed to disclose whether smallholder farm households in cash-crop dominated areas of Ethiopia are really food and nutrition secure, and did that by (1) determining the food security status, dietary habits and nutritional status of smallholder farm households of Yayu; (2) analyzing the variation in their food security status, dietary habits and nutritional status across seasons and household features in relation to social and economic assets.
Materials and methods
Location and study design
The Yayu Forest Coffee Biosphere Reserve is located between 8°10' – 8°39' N and 35°30'–36°4' E, in the Illubabor zone of the Oromiya state, Southwestern Ethiopia (Figure 1). The area was recognized by the United Nations Educational, Scientific and Cultural Organization (UNESCO) in 2010 for the in-situ conservation of wild Coffea arabica. It covers about 168,000 ha in six woreda, namely Algae Sachi, Bilo-Nopa, Chora, Doreni, Hurumu, and Yayu (Gole et al., 2009). The climate of the area is regarded as hot and humid, with mean annual temperature and precipitation values of 22.5°C and 2,100 mm, respectively (Gole, 2003). The Oromo ethnic group is predominant and is considered indigenous; but Amhara, Tigreway and Kembata people share the area in significant numbers, as they migrated from other parts of the country due to the government's resettlement program initiated in 1984 (Kassa, 2004).
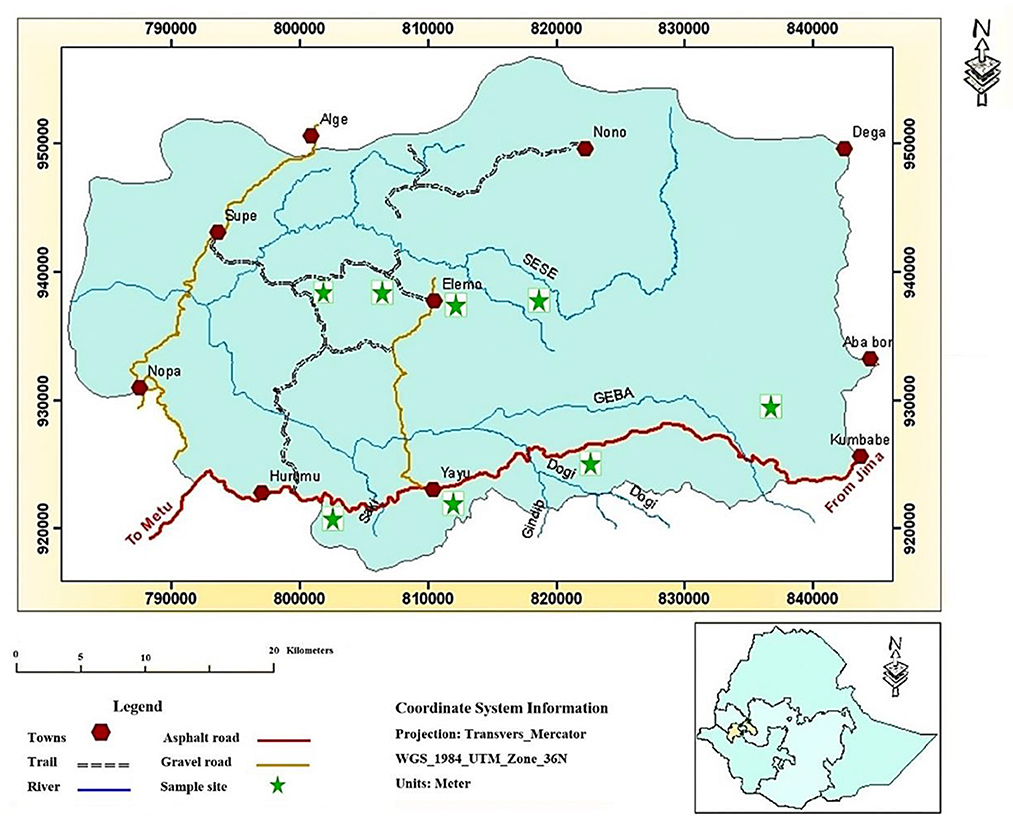
Figure 1. Map of Yayu in Ethiopia [adapted from Ilfata (2008)].
The core livelihood of smallholder farmers in Yayu is coffee production (Gole et al., 2009), which is mostly carried out in three agroforestry practices: homegarden, multistorey-coffee-system and multipurpose-trees-on-farmlands. These involve up to 80 edible species of which 55 are primarily cultivated for the household food supply. Households' income emanate from farming (overall coffee production) in about 90% and the rest from off-farm activities (Jemal et al., 2018). In the last 15 years no incidents of food emergency have been reported in Yayu, thus labeled as food secure and never included in the PSNP (FEWS NET, 2002, 2004, 2005, 2009, 2011, 2013, 2015, 2017). Rather, the zone is regarded as a well-off and became a net destination for communities from other parts of the country, forced to relocate by their recurrent exposure to famines and droughts (Gizaw, 2013).
Sampling strategy
Eight kebele located in six woreda of the Yayu area were targeted based on their proximity to market/biosphere reserve as diversification criterion. Each kebele with a “core forest zone”2 in its jurisdiction was marked as “near to forest,” if not as “far from forest.” Similarly, those kebele that were situated closer to the highway were supposed to have better access to markets, and considered as “near market,” or else as “far from market.” On this basis, every kebele in the reserve were grouped into four sets with two proximity factors each with two levels (near and far), and then two kebele from each group were selected subjectively based on their accessibility. Out of the 4,300 inhabitant households of the reserve area, a representative sample of 300 households were randomly selected, based on the information obtained from each of the six woreda administrative offices. Finally, 140 households having non-breast feeding (NBF) children under 5 years, and women of reproductive age (WRA) between 15 and 45 years of age, were subsampled for nutritional status evaluations. In case there was more than one child per household, the youngest was selected; and in the case of twins, the choice was randomly made (Mulu and Mengistie, 2017). Hence, a total of 420 sampling units of three different types, i.e., households, non-breast feeding children (NBF) under 5 years, and women of reproductive age (WRA), each with 140 units, were used for data collection.
Data collection
A household questionnaire, detailed dietary survey, and anthropometric measurements were applied as main data collection procedures. Surveys were pre-tested in 10 local households and adjusted before wider application. Originally prepared in English, the surveys were translated into Amharic and Oromiffa languages best known by the respondents. Responses were later translated back into English to crosscheck response accuracy. Household heads were asked for basic household information, except for the wealth ranking. Wealth ranking was collected from the data base of local Kebele administration, so that, a minimum within kebele subjective-error can be achieved through a locally developed ranking criteria. The person mainly responsible for food preparation in the household was asked for the food security and dietary history questions; as for the children, the main caregiver was asked. Dietary history survey and food security questions were asked at different times of the day to prevent confusion in the interviewees, and fatigue of the interviewees and interviewers. Female enumerators were recruited and trained among the local health extension agents; these were chosen based on their familiarity with dietary and anthropometric assessments, and ease of access to the target groups. Finally, all household heads, and parents or guardians in the case of children, were informed about the objectives and confidentiality of the study, and a verbal and written consent obtained. For the anthropometric measurements, electronic scales (with 100 g precision), and wooden collapsible length/height measuring devices (precision 1 mm) were used. The age of the children was captured considering month and year, whereas for women it was registered in years.
Five data sets were built: (1) Basic household data, which included age, educational status, gender, ethnicity, religion, settlement history, family size, and wealth rank. (2) Household food security status data, which included type, amount, and pattern of food consumed by householders during the past 4 weeks (Coates et al., 2007; Ballard et al., 2011). (3) Dietary intake/pattern data, including the household's consumption frequency of 12 food groups recalled for three-time references, i.e., 24 h, 7 days, and 4 weeks. (4) Dietary adequacy data, which refers to the type and frequency of food items consumed during the past 7 days by sensitive groups (NBF and WRA). Finally, (5) Nutritional status data, which compiled anthropometric records of NBF and WRA, such as body weight and height.
In Yayu, there are two main seasons in terms of food/cash surplus and shortage. Surplus occurs in the period after coffee and cereal crop harvest (between January and March), whereas shortage refers to the preceding time window from June to September, when the stock of the previous harvest is getting depleted and the next crop is not yet ready for harvest. So, data collection covered the two seasons and was gathered between December 2014 and August 2016.
Data analyses
By using the above mentioned five data sets, different scores, indices and statistics were calculated to estimate the four main food and nutrition attributes of the households (Figure 2).
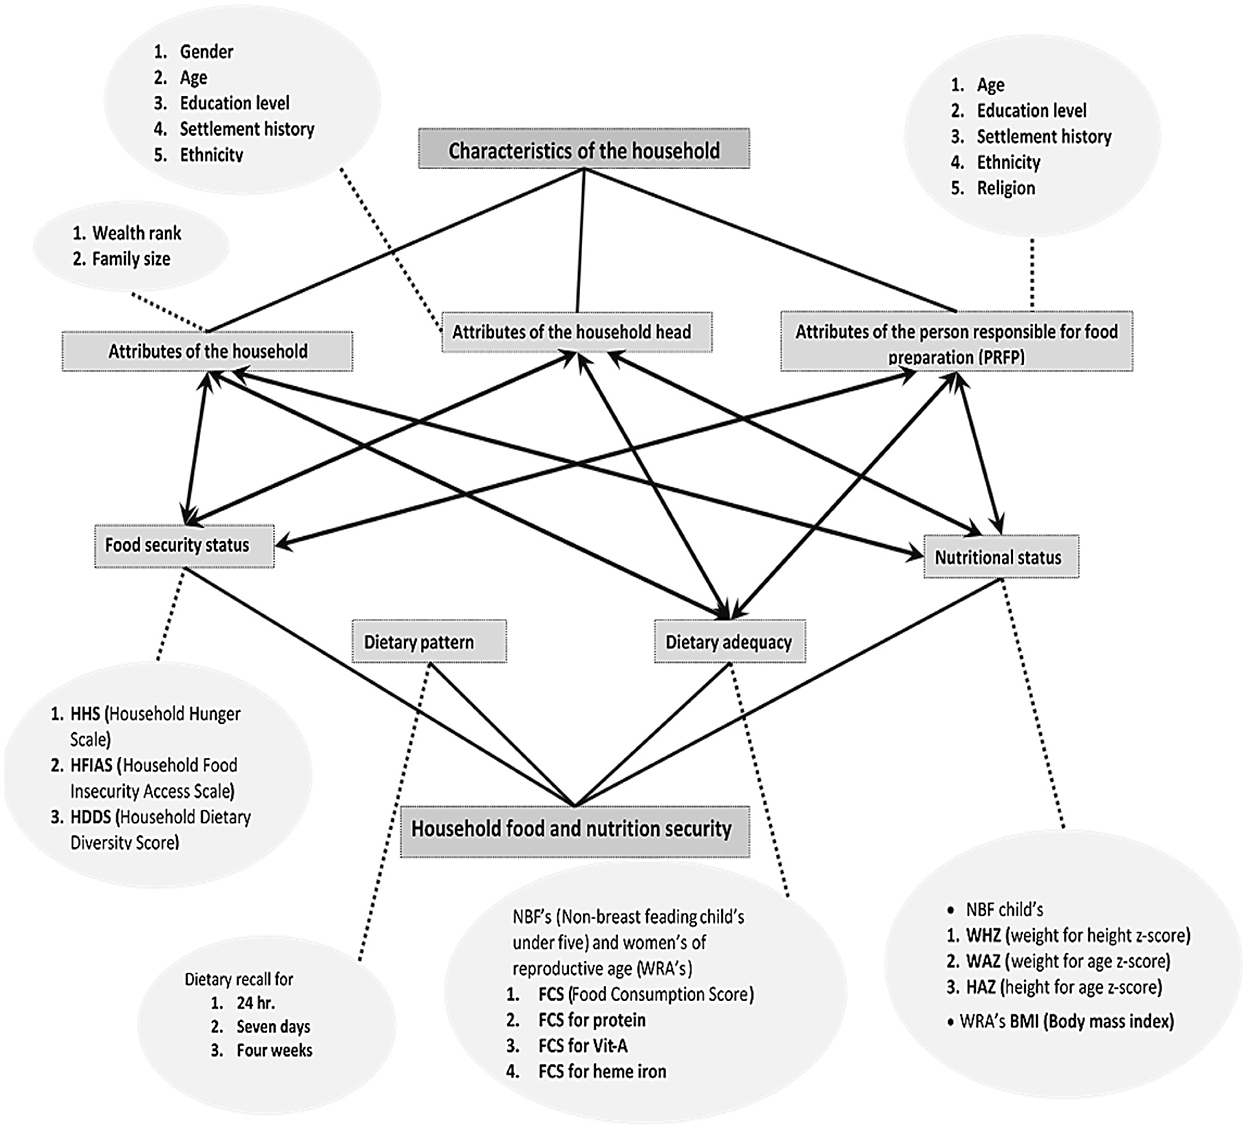
Figure 2. Data collection and analytical framework of the study. Broken lines connect each attributes and scores of the household to their respective indicator variables; solid lines connect two major aspects of household (characteristic and FNS) to their respective components; solid double arrow line show possible association among household characteristics and FNS scores.
Household food security status
It was assessed using three standard proxies, i.e., Household Hunger Scale (HHS) (Ballard et al., 2011), Household Food Insecurity Access Scale (HFIAS) (Coates et al., 2007), and Household Dietary Diversity Score (HDDS) (Kennedy et al., 2011), generated from the household food security status and dietary intake data sets. The HHS was used to determine the level of hunger in a household. The HFIAS added additional insights of food (in) security, such as food quality, sufficiency, and psychological aspects (Coates et al., 2007; Maxwell et al., 2013) to measure the level of food insecurity in a household. In addition, HDDS was used to scout the adequacy of provided energy. Finally, the scores generated by each proxy were compared against standardized cut-off points of FAO and Food and Nutrition Technical Assistance Project (FANTA) (Coates et al., 2007; Ballard et al., 2011; Kennedy et al., 2011) to determine food security status of the sample household.
Household dietary pattern
After determining the household food (in) security status, we aimed to disclose if the foods consumed are diverse enough to satisfy the household nutrition security. That was done by recording the food consumption history of each household in three-time reference periods, i.e., 24 h, 7 days, and 4 weeks; and classify the food items into 12 food groups, i.e., cereals, white roots and tubers, vegetables, fruits, meat and poultry, eggs, fish and seafood, pulses/legumes/nuts, dairy products, oil and fat, sweets, and spices, condiments, and beverages (Swindale and Bilinsky, 2006).
Dietary adequacy
The nutrient/dietary adequacy to meet the minimum physiological requirements of the household, were determined applying indicators for food and nutrition adequacy to two sensitive groups: NBF children under 5 years and WRA, assumedly the most vulnerable groups (WHO, 2008; FAO and FHI 360, 2016). It was achieved using the Food Consumption Score (FCS) in reference period 7 days. For that, the food consumed was reclassified into nine food groups to build a score for each target group (WFP-VAM, 2009). The consumption frequency of each food group was weighted by the values given by the World Food Program (WFP) and summed up to provide individual FCS, which finally were used to determine the dietary adequacy using standardized cut-off points as poor, borderline and acceptable (WFP-VAM, 2009). Finally, the level of adequacy of three key nutrients, namely protein, vitamin A, and heme iron was analyzed (WFP-VAM, 2009, 2015). This process was carried out for two seasons to investigate the impact of the seasonal diet change on the dietary adequacy of the target groups.
Nutritional status
Nutritional status was assessed via z-score anthropometric measurements, that contrast individual performances against averages, were applied to the two sensitive groups. For the NBF under 5 years, the Multicentre Growth Reference Study (MGRS) (WHO, 2006) was followed to calculate the three z-score indicators, i.e., weight for height z-score (WHZ), weight for age z-score (WAZ), and height for age z-score (HAZ), which were later compared against the standard nutritional status cut-off points of WHO (WHO, 2006). Regarding WRA, the body mass index (BMI) was estimated and later contrasted against the combined four categories set by the WHO (1999) and Food and Nutrition Technical Assistance III Project (FANTA) (2016).
Statistical analyses
Statistical analyses included the estimation of descriptive statistics such as mean, median, and frequency of samples concerning relevant parameters of food and nutrition security. Variabilities and distributions among categories were tested using the parametric F-test. For the seasonal variation of scores, the paired t-test was applied. For children-women comparison, two-sample t-tests were employed.
Besides, a Spearman R non-parametric tool was used to detect the potential correlation between household characteristics and FNS scores. Before correlation analysis, all continuous variables of household characteristics were grouped into classes and became categorical variables to reduce error from the analysis of incompatible variables. All of statistical estimation and analysis were performed using Microsoft Excel Pus 2016, Minitab 17.1.0, STATISTICA 7.1., and ENA for SMART software.
Results
Socioeconomic profiling
The Yayu households' food and nutrition situations have a relationship with their socioeconomic and demographic characteristics. Out of the 140 sampled households, 88.5% had three to eight members with an average of 5.7 ± 2.2 members. 95.0% of the sampled households were male-headed, aging around 37.1 ± 11.3 years; 38.6% of these house heads achieved at least elementary school level (grade 1–6), but about 27.9% of the household heads illiterate. Eighty-four percent of the householders were native, while 15% were resettled from other regions. “Oromo” was the major ethnic group (75.5%) followed by Amhara (15.7%). Finally, 47.9% of the households were regarded as poor and 18.8% as rich (Table 1).
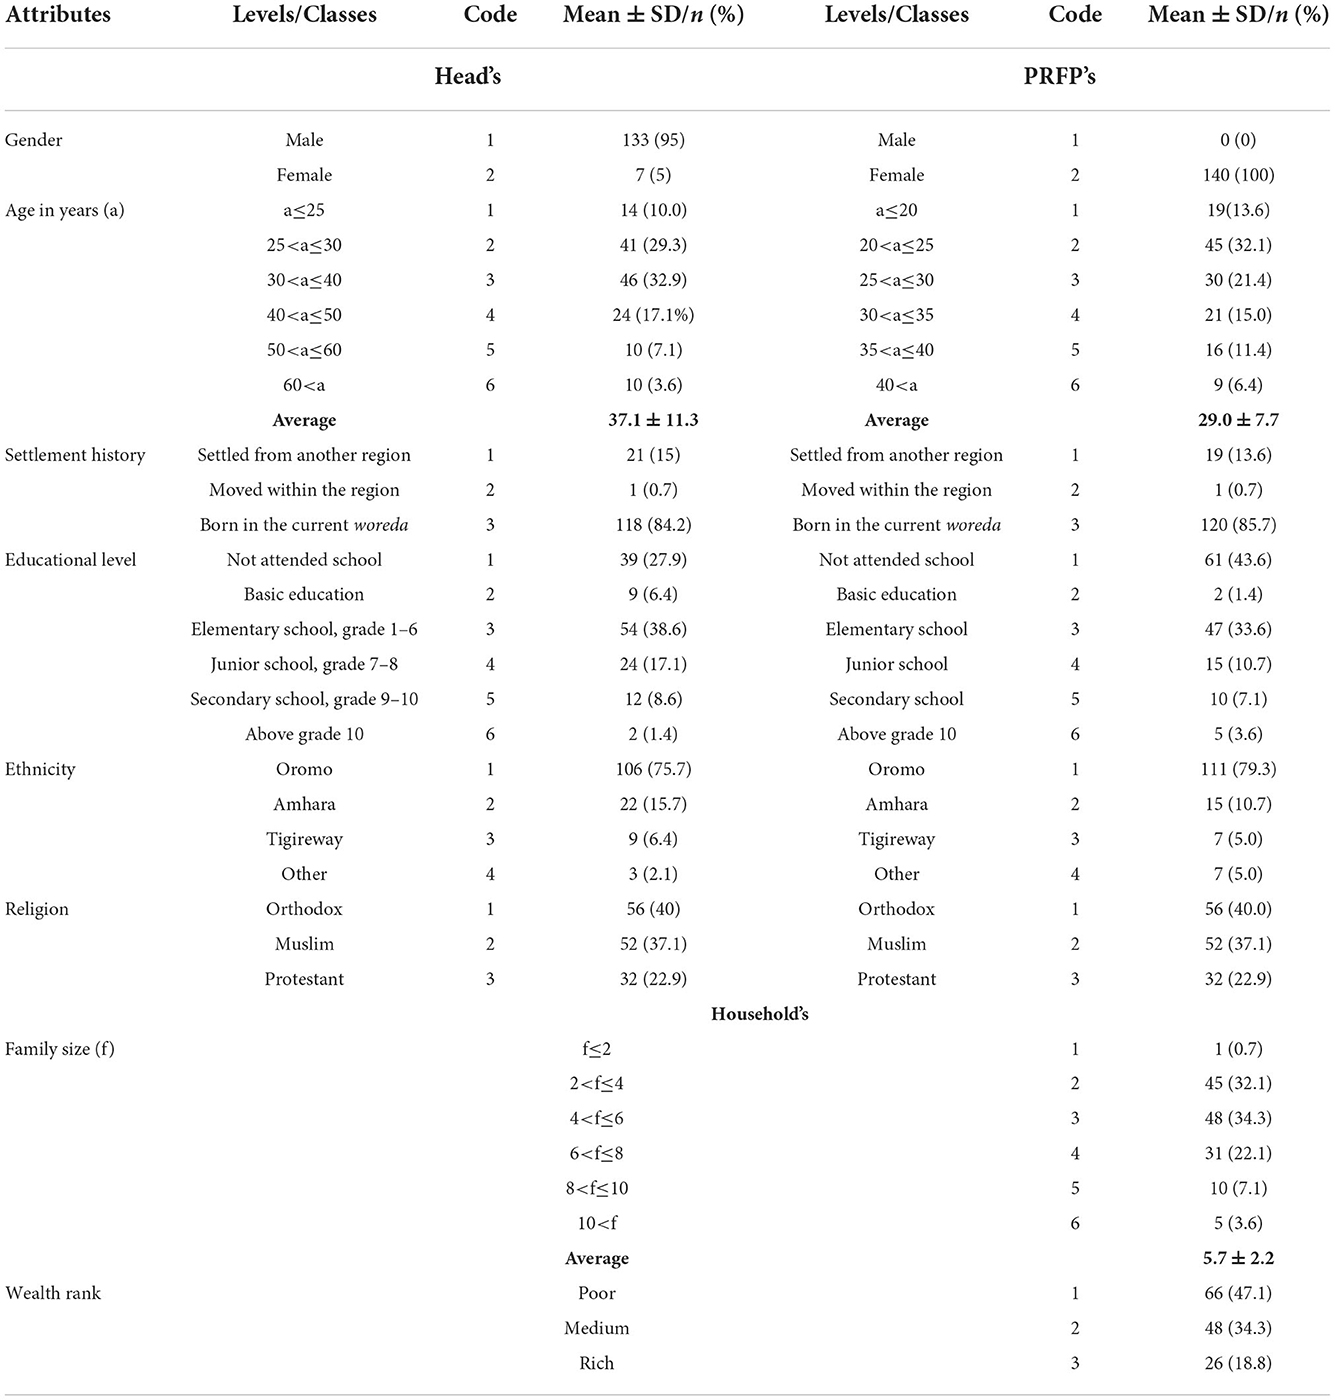
Table 1. Descriptive statistics and respective levels and codes of the socioeconomic and demographic attributes of sample households of Yayu.
Food security status
Based on the estimated HHS, there was no hunger during the surplus season, and more than 83% of the households were also hunger-free in the shortage season. From the households detected as “hungry” (23), only two were severely affected. By adjusting the HHS results with the HFIAS questions, the proportion of food-secure households in the surplus season was revealed to be 70.7%, and in the shortage, season dropped to 18.5%. The mean HFIAS indices ranged between 1.6 ± 3.0 (surplus season) and 10.3 ± 6.2 (shortage season). Most households had a medium access to an optimum dietary energy provision in all seasons, i.e., 23.5% during the shortage and 16.4% during the surplus season. The average HDDS was 6.7 ± 1.2 (surplus season) and 6.4 ± 1.1 (shortage season) (Table 2).
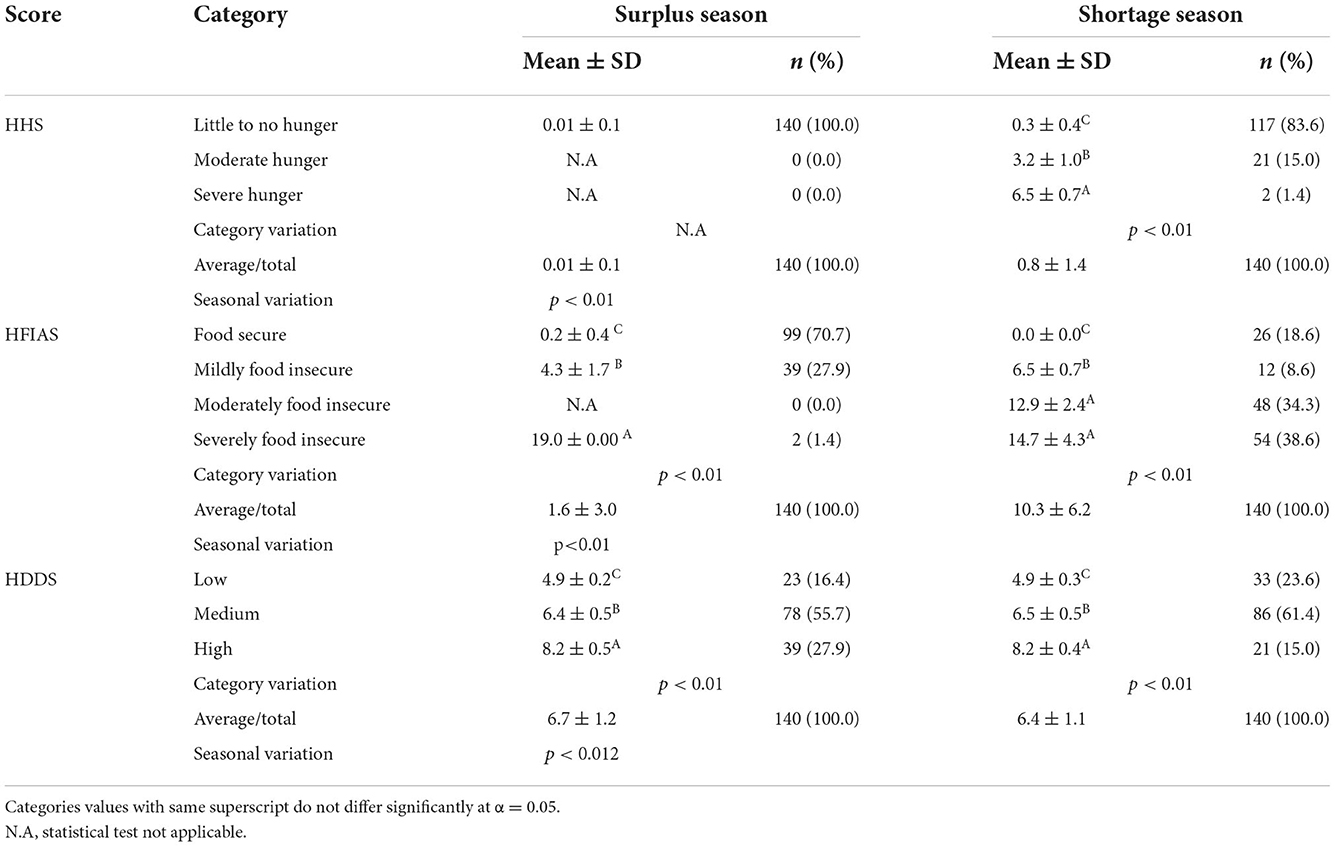
Table 2. Average, standard deviation, count, and proportion of three food security scores (HHS, Household Hunger Scale; HFIAS, Household Food Insecurity Access Scale; HDDS, Household Dietary Diversity Score) across seasons in Yayu.
The Spearman R correlation analysis was performed on the household attributes and the three food security status scores. “Wealth” is significantly correlated (p < 0.001) with all scores except for HHS and HDDS during the surplus season. The highest value obtained was for HFIAS (r = −0.85) and the lowest for HDDS (r = 0.48). “Family size” was highly significantly correlated with HFIAS in both seasons. “Head gender” is significantly (p < 0.01) correlated with HHS and HFIAS in shortage season. Unlike in PRFP, “settlement history” and “ethnicity” of the head has showed significant association with HFIAS (r = 0.17, p < 0.05) and HDDS (r = −0.20, p < 0.05) during shortage time, respectively. In contrast, a significant association of “educational level” was only recorded by PRFP and HDDS (r = 0.26, p < 0.01) in surplus season. Religion has not shown significant association with all of the food security status scores (Table 3).
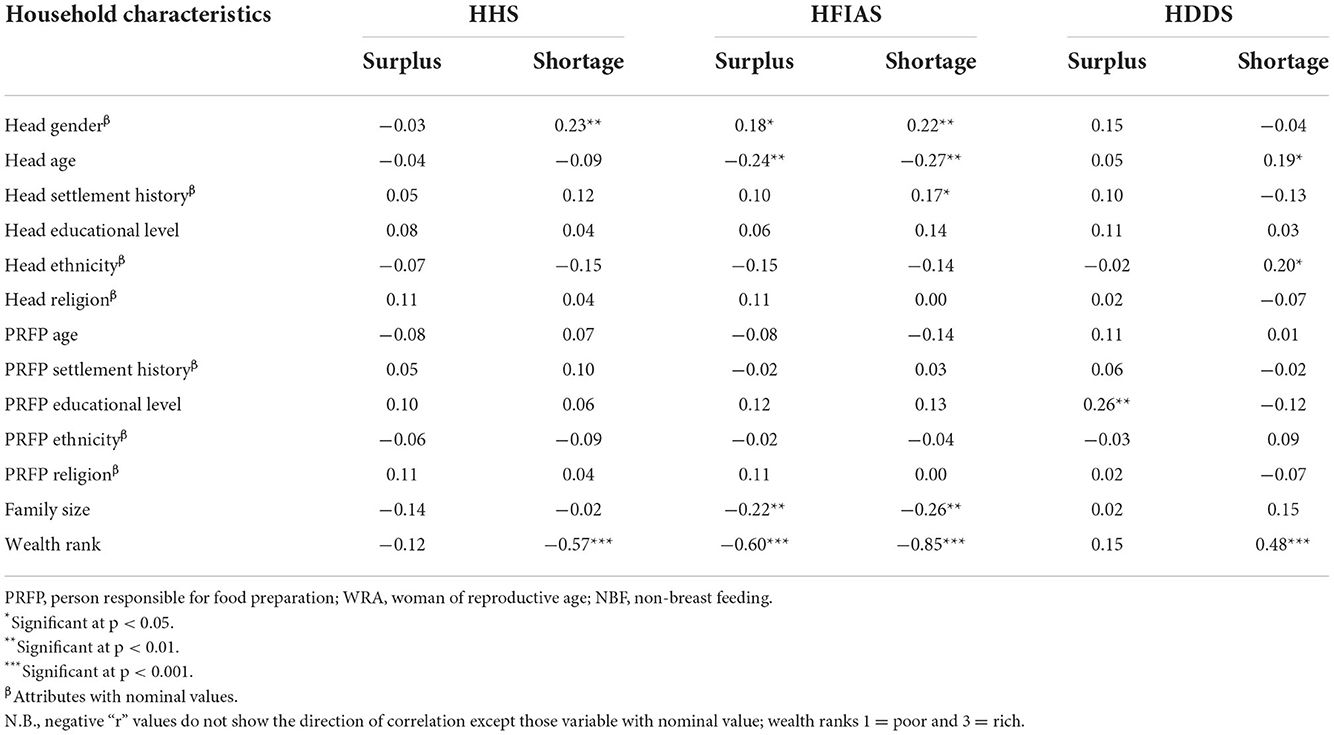
Table 3. Spearman R correlation coefficient among food security scores (HHS, Household Hunger Scale; HFIAS, Household Food Insecurity Access Scale; HDDS, Household Dietary Diversity Score; please note that the third differs from the first two in direction) and characteristics of households in surplus and shortage seasons in Yayu.
Dietary patterns
Considering three-time references (24 h, 7 days, and 4 weeks), and the surplus and shortage seasons, it was found that from the 12 food groups considered, cereals, oil and fats, vegetables, and spices, condiments and beverages, were the food groups consumed by more than 98% of the households. White root and tubers, and dairy products showed higher consumption frequencies during the shortage season, while the remaining food groups showed higher consumption frequencies during the surplus season. Across the three time preferences, only the food group “fish” is consistently absent and considered exotic (Figure 3).
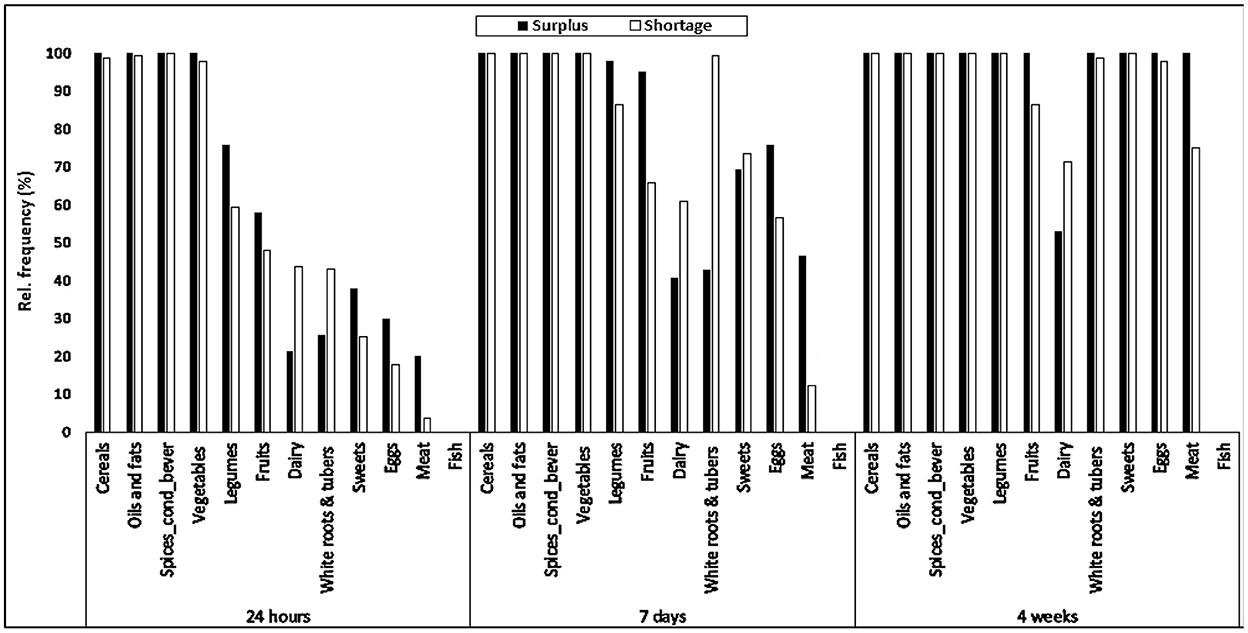
Figure 3. Relative consumption frequency of 12-food groups during two seasons and three reference periods of households in Yayu.
Dietary adequacy
According to the FCS cut-off points, there was no “poor” food consumption. More than 87% of the children and women fell in the category “acceptable.” The mean of the 7-day weighted FCS for NBF children under 5 years was 53.5 ± 14.2 and 56.3 ± 18.1, and for WRA 52.4 ± 1.1 and 54.6 ± 15.7, for the surplus and shortage season, respectively. The means weighted FCS of both target groups were higher in the shortage season (p < 0.05) (Table 4). Apart from this, there was no significant difference among target groups.
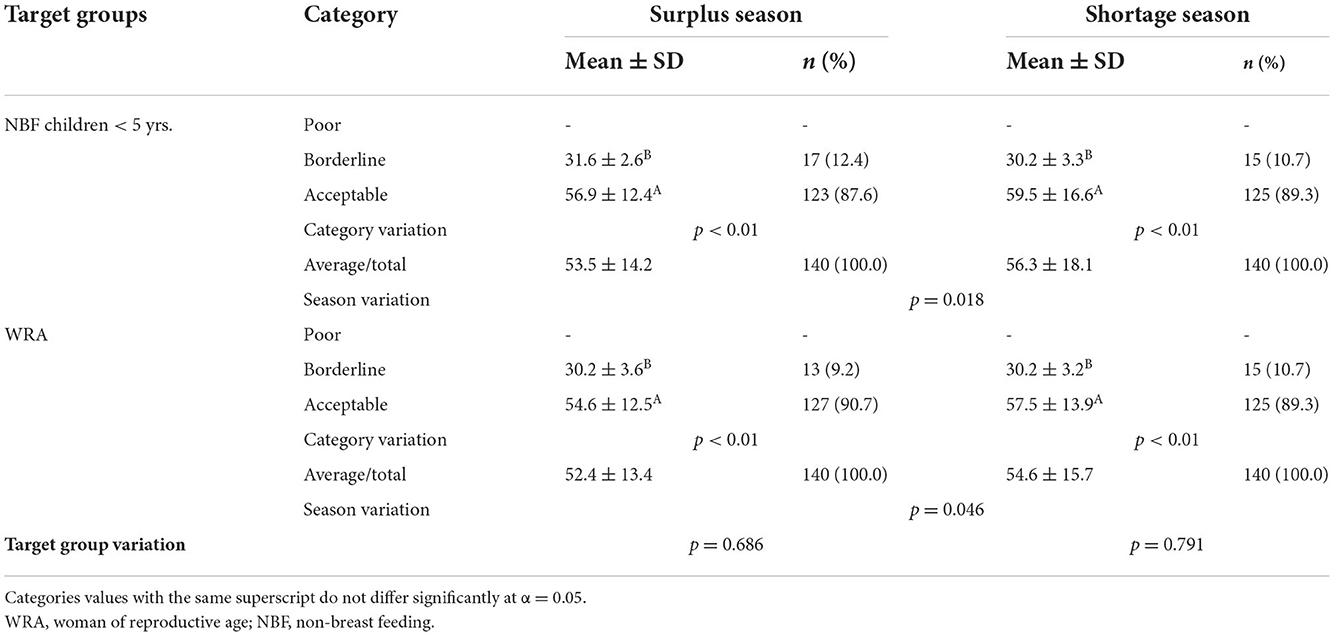
Table 4. Weekly Food Consumption Score of target groups across categories and seasons in Yayu.
A further assessment of key micronutrients intake (vitamin A, protein and heme iron), shows that 6.4% and 17.9% of NBF children under 5 years and WRA, respectively, did not consume any vitamin-A-rich food group during the surplus period. No seasonal variation was observed regarding the consumption of protein-rich foods among children, but 3.6% of women showed no consumption at all of protein during the lean season. The most critical result was observed regarding foods rich in heme iron, as more than 50% of both target groups lacked foods that contain it; even worse, in the surplus season, it increased up to 87.9% for the shortage season (Figure 4).
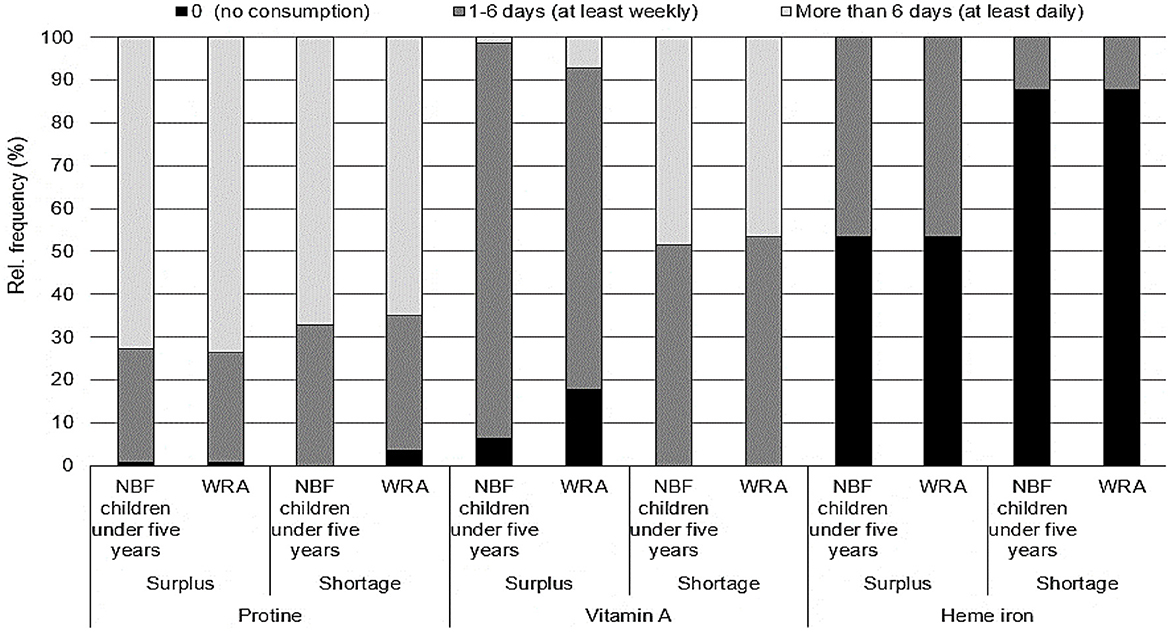
Figure 4. Weekly consumption frequency of target groups of food groups rich in key micronutrients during surplus and shortage seasons in Yayu (WRA, woman of reproductive age; NBF, non-breast feeding).
Correlation analyses shows that “head age,” “family size,” and “wealth rank” are significantly correlated with the FCS for both target groups in both seasons with their highest score of 0.21 (p < 0.05), 0.31 (p < 0.001), and 0.77 (p < 0.001), respectively. “Settlement history” and “ethnicity” of the head and PRFP have shown a highly significant correlation with FCS of both targets during the shortage season with r ranging from 0.22 to 0.26 (Table 5).
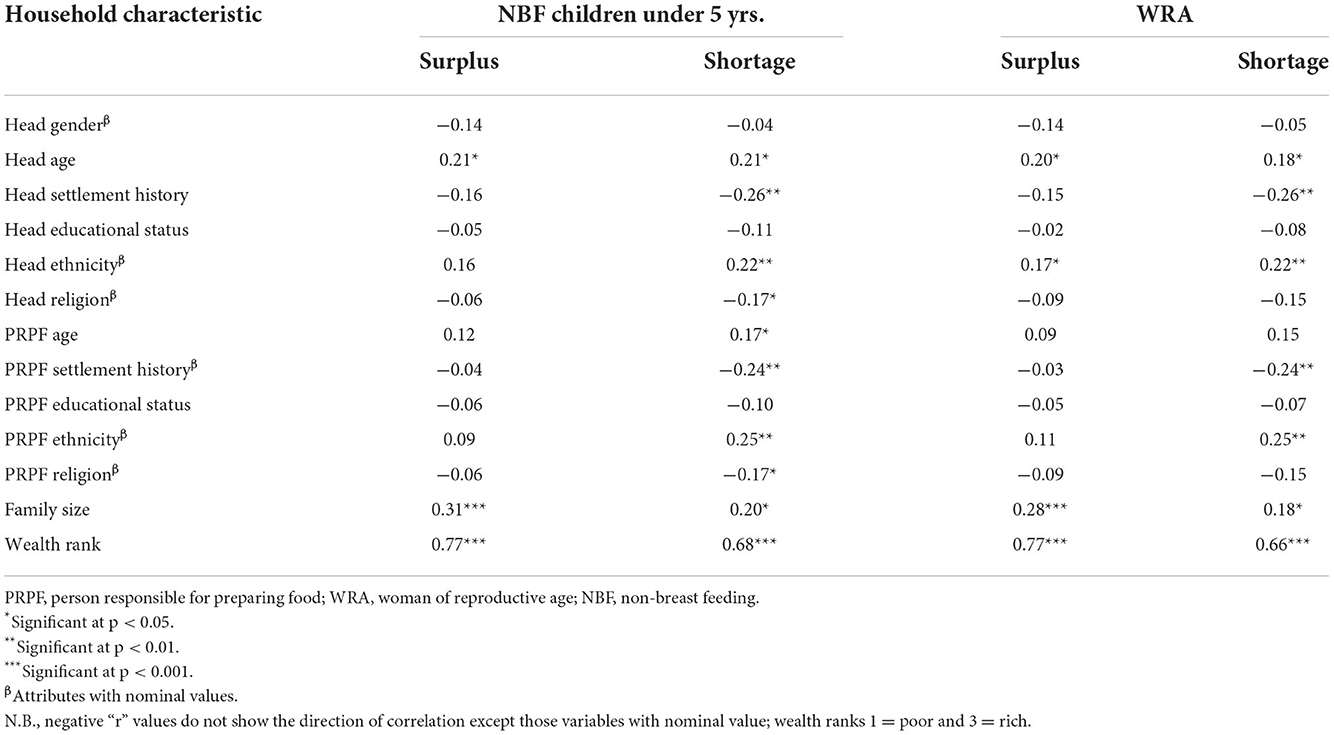
Table 5. Spearman R correlation coefficients among dietary adequacy scores of (FCS, Food Consumption Score) of the two target groups and characteristics of households in surplus and shortage seasons in Yayu.
Nutritional status
NBF children under 5 years
The distribution of WHZ the scores of NBF children under 5 years show that 2.9 and 3.9% of the children were wasted in the surplus and shortage seasons, respectively. The comparison of the WAZ scores against standard cut-off values (WHO, 2006) reveals that about 5 and 10% of the children were underweight, out of which 1.2 and 2.4% were severely underweight during the surplus and shortage seasons, respectively. The distribution of the HAZ shows the prevalence of stunting 17 and 38% in the surplus and shortage seasons respectively, of which 1.4 and 9.2% happen to be severely stunted during the surplus and shortage seasons, respectively (Table 6).
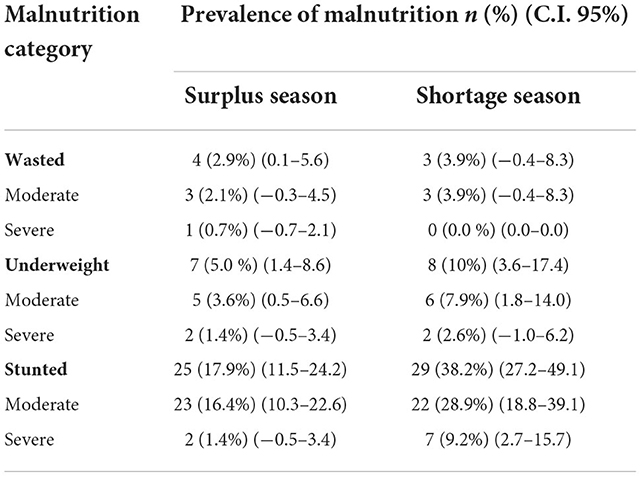
Table 6. Prevalence of malnutrition of children under 5 years during surplus and shortage season in Yayu.
Women of reproductive age
The distribution of the BMI of WRA showed that 10.9% of the assessed individuals were malnourished in the surplus season and 13.6% in the shortage season, while 87.6 and 83.4% fell between the normal ranges in the surplus and shortage seasons, respectively (p < 0.01). Accordingly, tests of variation across the malnutrition categories and seasons revealed being highly significant (p < 0.01) (Table 7).
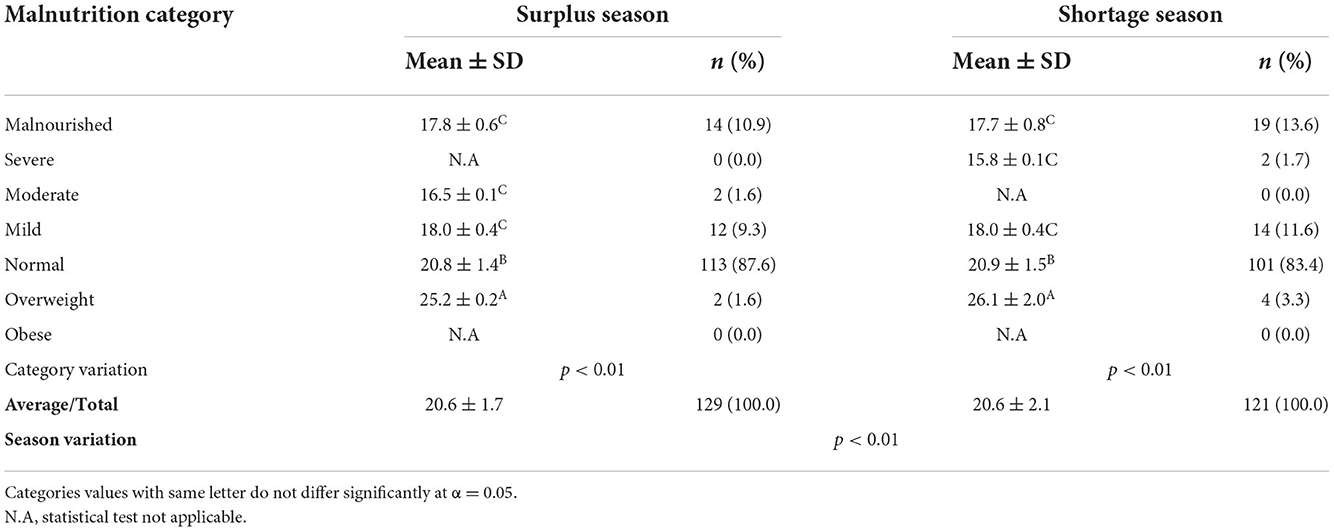
Table 7. Mean, proportion (%) and test of variation of BMI-based nutrition category of women of reproductive age during surplus and shortage seasons in Yayu.
The Spearman R correlation analysis shows that the all anthropometric indicators of NBF children under 5 years (HAZ, WAZ, and WHZ) in both seasons were positively associated with the “wealth rank” and “family size” of the households with a minimum and maximum value of r = 0.20 (p < 0.05) and 0.46 (p < 0.001), respectively. Compared to the z-scores, “Head age” is correlated with two anthropometric indicators of NBF children under 5 years (HAZ and WAZ) of both seasons were 0.24 (p < 0.01) scored as the weakest. Similarly, the educational level of the head and PRFP were positively correlated with the same indicators at least in one of the two seasons at α = 95% (Table 8). Whereas, no household characteristic showed a significant association with the HAZ indicator was also positively correlated with the anthropometric indicators of WRA in both seasons (Table 8).
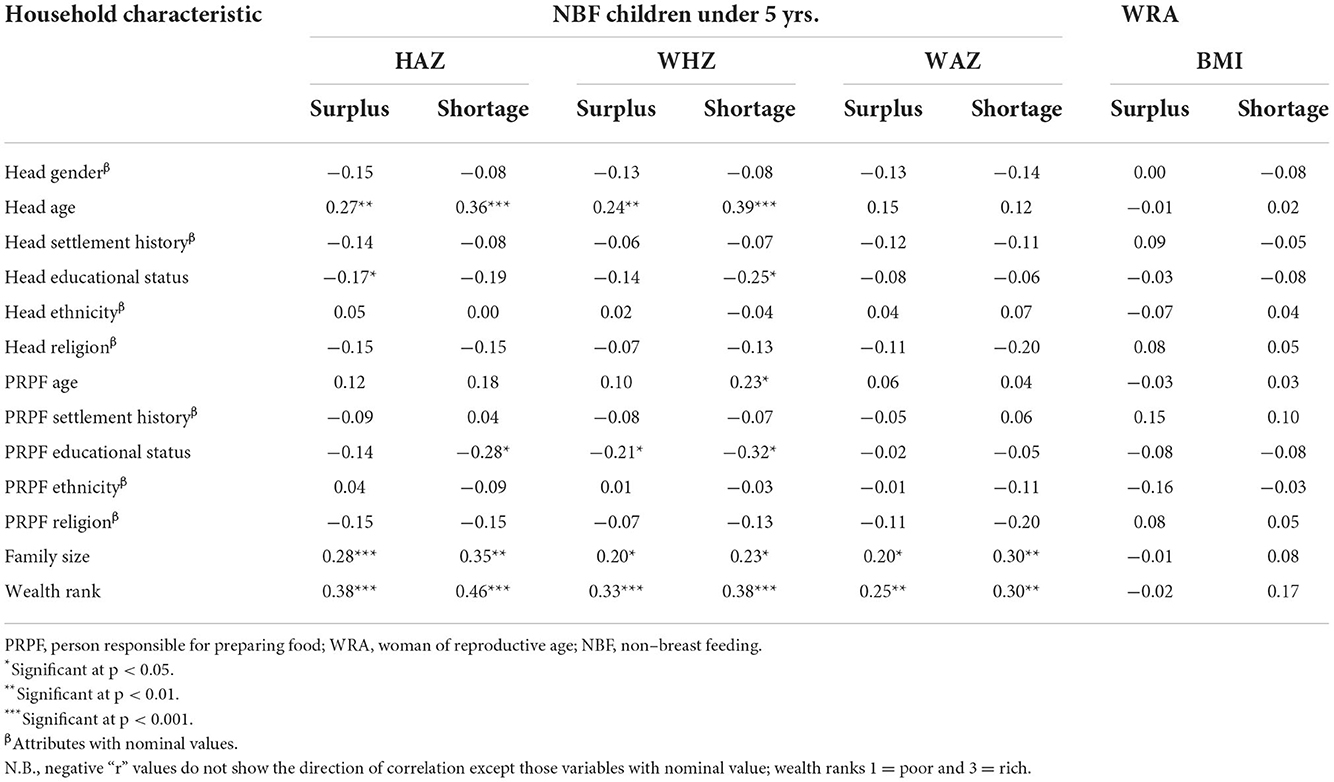
Table 8. Spearman R correlation coefficients among nutritional status scores [weight for height z-score (WHZ), weight for age z-score (WAZ), and height for age z-score (HAZ), and body mass index (BMI) target children and women, respectively] and characteristics of households in surplus and shortage seasons in Yayu.
Discussion
Food security status
Yayu household communities do not suffer hunger during the surplus season. This partly agrees with the annual food security outlook reports of the Famine Early Warning Systems Network from 2005 onwards, which labels Yayu as a hunger-free zone (FEWS NET, 2002, 2004, 2005, 2009, 2011, 2013, 2015, 2017). However, about 16% of the households were affected by hunger during the shortage season, out of which 1.4% fell in the “severely hungry” category. Based on the basic household characteristic of the affected households this might be caused either by big family size or by the insufficient size of farmland of the households, this agrees with a study conducted on smallholder farmers in Zimbabwe (Rubhara et al., 2020). These findings suggest that the seasonal fluctuation may have been ignored in previous assessments. Nevertheless, the majority of the Yayu smallholder farm households can still be regarded as hunger-free.
Other parts of this study Jemal et al. (2018) have linked the food security and nutritional status of the householders of Yayu, to their practice of three dominant land uses: homegarden, coffee agroforestry, and farmland. Households, mostly migrants, who focus on coffee agroforestry may do well in terms of income generation, but are the least food secure. In the data presented here, however, settlement history does not have a statistically significant effect on the food security indicators.
Concerning HFIAS, average values of the surplus (1.6 ± 3.0) and the shortage season (10.3 ± 6.2) of Yayu were lower and higher, respectively, than the national average values of 6.7 ± 6.7 reported by Ali et al. (2013). In Sidama, southern Ethiopia, Joray et al. (2011) observed HFIAS values of 3.6 and 8.8 for the surplus and shortage season, respectively. In the same line, Gebreyesus et al. (2015) reported a mean HFIAS of 6.4 for the Gurahgae zone, also labeled as food-secure. As shown, during the surplus season Yayu had higher food security ratios than other food-secure areas of the country, and during the shortage season, it was also slightly higher than in those areas. This might be due to the growing dependency on marketed food during the shortage season.
Another aspect of the food security status relates to the economic capability of the households to acquire a variety of food, an issue tackled by the HDDS. The average HDDS of Yayu was 6.7 ± 1.2 and 6.4 ± 1.1 for the surplus and shortage season, respectively. The mean value of the surplus season was similar to the national average (6.7) but higher than the one of the shortage season (5.9) (Hirvonen et al., 2015). Also, the Welfare Monitoring Survey of Ethiopia Workicho et al. (2016) reported a mean HDDS value of 5.0 ± 1.9, which is lower than the obtained values for both seasons in Yayu. In similar reports Coates and Galante (2014) and Gebreyesus et al. (2015), found similar seasonal fluctuations for the HDDS.
The association observed between the households' food security and their wealth agree with a study performed in the Sidama communities in southern Ethiopia (Regassa and Stoecker, 2011). Noticeably, the wealth rank estimation is based on the landholding size, which is directly associated with the amount of food (produced) and cash (generated) by a given household can obtain (Yayu, Hurumu, Doreni, and Chora Woreda administration offices).
Dietary pattern
The comparison of the dietary patterns of smallholder farming households in Yayu with the findings of Coates and Galante (2014) and Workicho et al. (2016) at national level are presented in Table 9. The predominance of cereal-based diets, and the consumption values equivalent to the national average values are observed; the same applies to tubers. However, tubers consumption doubles during the shortage season, by their coincident increased availability and scarcity of other staples. This is why white tubers are often labeled as shortage time foods.

Table 9. Comparison of weekly consumption trend of food groups in all regions in Ethiopia against Yayu values.
Concerning other food groups, their weekly consumption values in Yayu were higher than national averages, even during the shortage season, with the exception of meat where consumption is particularly low in the shortage season, and fish that is not consumed at all, issue confirmed by Workicho et al. (2016). In the present study, the share of legumes consumption was 97.7 and 86.4% during the surplus and shortage season, respectively, which are higher than the values for all Ethiopian regions studied by Coates and Galante (2014).
Dietary adequacy
Compared with the national average reported by Central Statistical Agency (CSA), and World Food Programme (WFP) (2014) where 10% of the population exhibits a “poor” dietary adequacy, the households of Yayu perform relatively well. No “poor” dietary adequacy was identified in either season, as Yayu people uses different leaves, roots and tuber crops to cope with seasonal shortages. However, 10.1% of the target children and 9.2% of the women exhibit a borderline nutritional adequacy performance, which suggests a risk of nutrition insecurity in a considerable share of the households.
The study detected non-significant variations in the dietary adequacy by target groups across seasons. In contrast, Hirvonen et al. (2015) reported a significant seasonal variation in the overall dietary intake of 27,835 households in all regions of Ethiopia. On the weekly consumption of key nutrients, heme iron is the most critical nutrient, as its consumption was notably low in both target groups. The situation aggravates in the shortage season, opening the possibility of a chronic deficiency. This problem is not exclusive to Yayu, as it is reported countrywide (Central Statistical Agency (CSA), and World Food Programme (WFP), 2014). Also the interesting finding is the decrease in the consumption of vitamin-A-rich foods in the surplus season, likely due to the reduction in the consumption of dark green vegetables, which in Yayu are considered as “shortage season” food. In addition, the consumption of dairy products was higher in the shortage seasons, concurrent with the higher availability of forage at the beginning of the rainy season.
A correlation between the weekly and daily dietary diversity intake scores and the settlement history and ethnicity of the households was identified. As both are assumedly proxies of knowledge of the type, importance, and management of the flora, which implies that the indigenous knowledge has a positive contribution to the dietary habits of households. This situation should be emphasized in further studies, which should consider the interfaces between social, cultural, nutritional, and ecological parameters as entry points to address FNS.
Nutritional status
In the same line, the anthropometric indicators of NBF children under 5 years confirmed that part of the community is not nutritionally secure, especially during the shortage season, when the lowest value was recorded: 3.9% of wasted children, which fall in the “low prevalence” category of the WHO cut-off points (WHO, 1995). However, these values are still lower than the Ethiopian national average (7–9%). On the other hand, the prevalence of stunting (38.2%) was equivalent to the national levels (36.8–38.4%) (Central Statistical Agency International ICF, 2016; Ethiopian Public Health Institute ICF, 2019) and regarded as “high prevalence” (30–39%) (WHO, 1995) (Table 10).
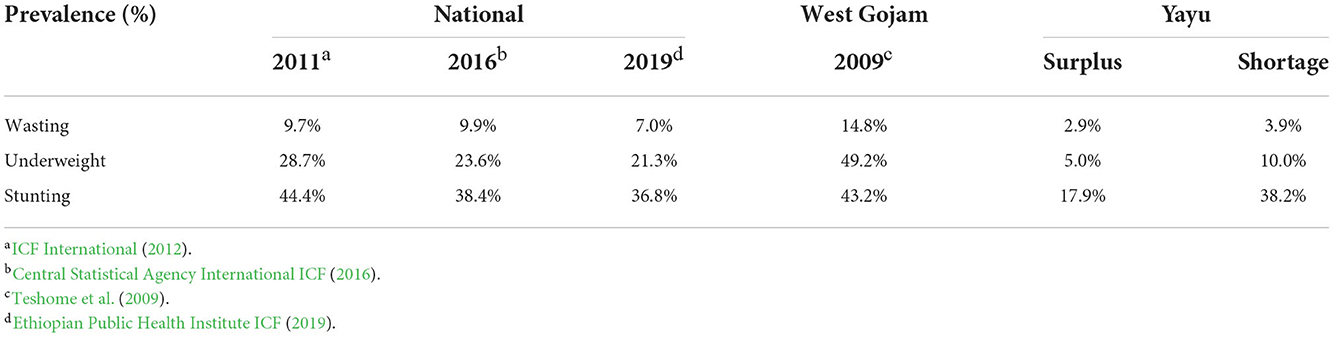
Table 10. Prevalence of wasted, underweight and stunted NBF children under 5 years (national level, west Gojam zone, and Yayu).
The distribution of anthropometric z-scores for the two seasons compared with the WHO standards, shows that the weight for age and the height for age z-scores distribution of the NBF children under 5 years in both seasons, were skewed to the left; and more pronounced during the shortage season (Figures 5B,C). In contrast, the weight to height distribution shows a good fit with WHO standards (Figure 5A).
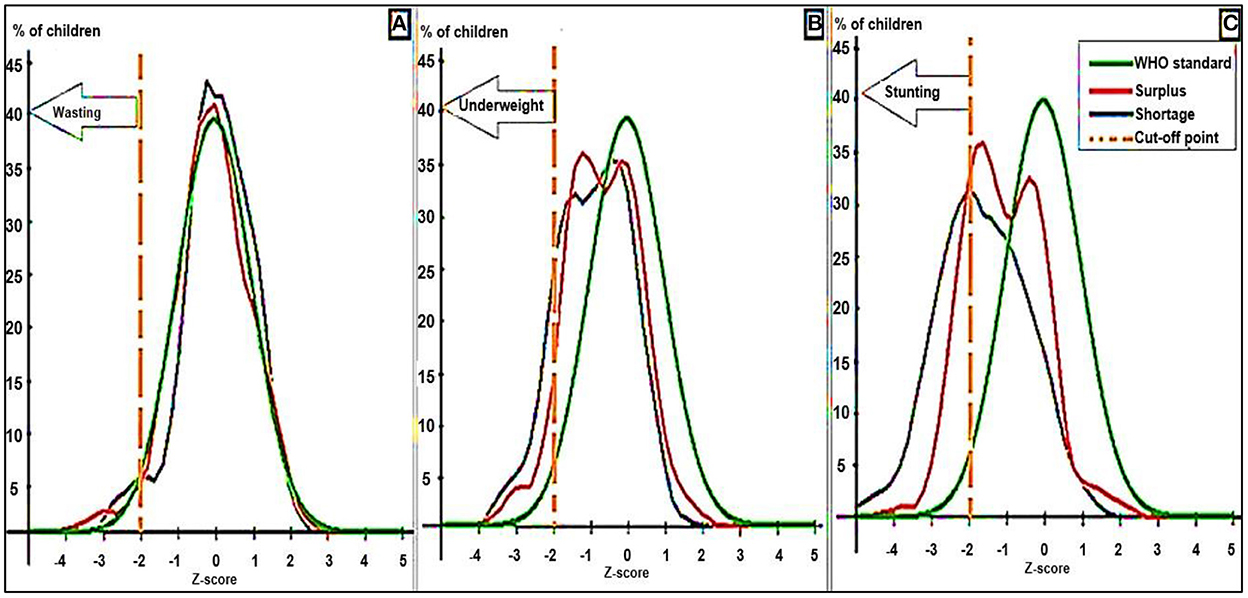
Figure 5. Distribution of anthropometric indicators of NBF children under 5 years in Yayu compared to global WHO references across seasons. (A) Weight for height. (B) Weight for age. (C) Height for age.
In the case of WRA, the anthropometric indicators show that 8.6% of them in Yayu were malnourished or moderately/severely thin. Still, the value is lower than the national value (27%) (ICF International, 2012). But these numbers increased during the shortage season to 13.6%, which WHO defines as a “poor situation,” taken as a warning and suggests the monitoring of the community (WHO, 1995).
Conclusion
The findings indicate that smallholder farming communities of Yayu can be mostly considered hunger-free. Referring to the HFIAS-based food and nutrition security assessment, some households face moderate to severe food insecurity, which relates to their limited access to food. However, the area provides sufficient calories to the majority of households (>95%) and energy-rich staples all year long. Concerning the adequacy of consumed nutrients, the majority of the households surpasses the minimum consumption threshold.
The consumption of protein is common. The dietary diversity increases during the shortage season regardless of the amount of food available, due to the inclusion of milk and shortage-time food in the diets. The consumption of vitamin-A peaks in the shortage season, as people eat more dark green vegetables and dairy products but tend to attach to cereal-dominated diets during the surplus season. However, a chronic iron deficiency is possible due to the very low consumption of heme-iron-rich foods, especially during the shortage season. Alternatively, it was recoded that the existence of plant species rich in these scarce nutrients, but are generally underutilized or even neglected (Callo-Concha et al., 2019).
The observed levels of wasting, underweight and stunting in NBF children under 5 years, and malnourishment in WRA, suggest the existence of food and nutrition insecurity in few households. Food and nutrition security requires the availability of affordable quality food for a healthy life for all people at all times. The findings of the present study indicate seasonal scarcity and qualitative deficiencies in the food consumed by households. Thus, Yayu cannot be considered fully food secure, though the situation is better than in most parts of the country. In general, a mere consideration of cash-crop growing communities (based on their income status) as food secure, is proved no to be a viable but a misleading approach. At least in the case of Yayu.
Further studies on seasonal nutritional deficits, through assessing available resources, utilization trends, farming systems, and related factors are recommended. Besides, as this study is based on a “proxy approach” to determine the food and nutritional security, which has intrinsic limitations, direct and more accurate methods such as blood analyses would provide more precise information on people's food and nutritional security.
Data availability statement
The raw data supporting the conclusions of this article will be made available by the authors, without undue reservation.
Ethics statement
The studies involving human participants were reviewed and approved by Ethical Approval Team of Center for Development Research (ZEF), University of Bonn, Genscheralle 3, 53113 Bonn, Germany. Written informed consent to participate in this study was provided by the participants' legal guardian/next of kin.
Author contributions
OJ, DC-C, and MN contributed to conception, design of the study, and wrote sections of the manuscript. OJ organized the database, performed the statistical analysis, and wrote the first draft of the manuscript. All authors contributed to manuscript revision, read, and approved the submitted version.
Funding
This research was carried out in the framework of the Biomass Web Project (grant number FKZ 031 A258 A) and funded by the German Federal Ministries of Education and Research (BMBF) and of Cooperation and Development (BMZ).
Acknowledgments
The content of this manuscript has been published as part of the thesis of OJ (Jemal, 2018). We are greatly indebted to Wro. Kelemua F.; Wro. Hafiza M.; Ato. Fassil H.; Ato. Henok H. for their cooperation during data collection. We thank also the ECFF (Environment and Coffee Forest Forum) and the Agricultural offices of Yayu and the surrounding Woreda their support and facilitation were indispensable for realization of the field work.
Conflict of interest
The authors declare that the research was conducted in the absence of any commercial or financial relationships that could be construed as a potential conflict of interest.
Publisher's note
All claims expressed in this article are solely those of the authors and do not necessarily represent those of their affiliated organizations, or those of the publisher, the editors and the reviewers. Any product that may be evaluated in this article, or claim that may be made by its manufacturer, is not guaranteed or endorsed by the publisher.
Footnotes
1. ^In Ethiopia, a woreda is the second smallest political-administrative unit. A woreda is composed by a given number of kebele, the smallest administrative political-unit.
2. ^The reserve consists of three concentric zones, i.e., core, buffer and transition zones, which unevenly occurred across the six woreda of the reserve. Many agricultural and-use types are tolerable only in the transition and buffer zones, but the inner most core zone is maintained as intact forests with no human activities permitted (Gole et al., 2009).
References
Achterbosch, T. J., van Berkum, S., Meijerink, G. W., Asbreuk, H., and Oudendag, D. A. (2014). Cash Crops and Food Security Contributions to Income, Livelihood Risk and Agricultural Innovation. Wageningen: Wageningen UR.
Ali, D., Saha, K. K., Nguyen, P. H., Diressie, M. T., Ruel, M. T., Menon, P., et al. (2013). Household food insecurity is associated with higher child undernutrition in bangladesh, ethiopia, and vietnam, but the effect is not mediated by child dietary diversity. J. Nutr. 143, 2015–2021. doi: 10.3945/jn.113.175182
Andreotti, F., Bazile, D., Biaggi, C., Callo-Concha, D., Jacquet, J., Jemal, O. M., et al. (2022). When neglected species gain global interest: lessons learned from quinoa's boom and bust for teff and minor millet. Glob. Food Secur. 32, 100613. doi: 10.1016/j.gfs.2022.100613
Ballard, T., Coates, J., Swindale, A., and Deitchler, M. (2011). Household Hunger Scale: Indicator Definition and Measurement Guide Household Hunger Scale: Indicator Definition and Measurement Guide. Washington, DC: Food and Nutrition Technical Assistance III Project (FANTA); FHI 360.
Berhane, G., Gilligan, D. O., Hoddinott, J., Kumar, N., and Taffesse, A. S. (2014). Can social protection work in Africa? The impact of Ethiopia's productive safety net programme. Econ. Dev. Cult. Change 63, 1–26. doi: 10.1086/677753
Birara, E., Mequanent, M., and Samuel, T. (2015). Assessment of food security situation in Ethiopia. World J. Dairy Food Sci. 10, 37–43. doi: 10.5829/idosi.wjdfs.2015.10.1.9275
Brüntrup, M., and Herrmann, R. (2010). “Bioenergy value chains in namibia: opportunities and challenges for rural development and food security,” in Proceedings to 9th European IFSA Symposium: Building Sustainable Rural Futures; the Added Value of Systems Approaches in Times of Change and Uncertainty, eds I. Darnhofer and M. Grotzer. (Vienna: DIE), 1–17. Available online at: https://www.die-gdi.de/en/others-publications/article/bioenergy-value-chains-in-namibia-opportunities-and-challenges-for-rural-development-and-food-security/ (accessed August 21, 2020).
Callo-Concha, D., Omarsherif, J., and Habtamu, S. (2019). Local alternatives to local problems: The contribution of agroforestry system by-products to food and nutrition security of communities in Southwestern Ethiopia. Food Stud Int. J. 9, 29–42. doi: 10.18848/2160-1933/CGP/v09i01/29-42
Central Statistical Agency (CSA) World Food Programme (WFP). (2014). Ethiopia Comprehensive Food Security and Vulnerability Analysis (CFSVA). Ethiopia Central Statistical Agency and the World Food Programme. Available online at: http://documents.wfp.org/stellent/groups/public/documents/ena/wfp265490.pdf (accessed November 27, 2022).
Central Statistical Agency and International ICF (2016). ETHIOPIA Demographic and Health Survey 2016 Key Indicators Report. Addis Ababa; Rockville, MD: CSA and ICF.
Coates, J., and Galante, T. (2014). Agricultural Commercialization, Production Diversity and Consumption Diversity Among Smallholders in Ethiopia: Results from the National Ethiopia Integrated Survey on Agriculture, Rural Socioeconomic Survey, 2012. Available online at: https://https//pdf.usaid.gov/pdf_docs/PA00KWBN.pdf (accessed November 27, 2022).
Coates, J., Swindale, A., and Bilinsky, P. (2007). Household Food Insecurity Access Scale (HFIAS) for Measurement of Household Food Access: Indicator Guide (v. 3). Washington, DC: FHI 360/FANTA. Available online at: http://www.fao.org/fileadmin/user_upload/eufao-fsi4dm/doc-training/hfias.pdf (accessed August 21, 2020).
Coll-Black, S., Daniel, O., Gilligan John, H., Neha, K., Alemayehu Seyoum, T., and Wiseman, W. (2011). Targeting Food Security Interventions When “Everyone Is Poor:” The Case of Ethiopia's Productive Safety Net Programme. Working Paper 24. Available online at: http://www.ifpri.org/book-757/ourwork/program/ethiopia-strategy-support-program%0Ahttp://www.edri.org.et/ (accessed August 21, 2020).
Devereux, S., Sabates-Wheeler, R., Slater, R., Tefera, M., Brown, T., and Teshome, A. (2006). Ethiopia ' S Productive Safety Net Programme (PSNP) Trends in PSNP Transfers Within Targeted Households Final Report. Addis Ababa. Available online at: https://www.ids.ac.uk/files/PSNPEthiopia.pdf (accessed August 21, 2020).
Dose, H. (2007). Transformation in the Process of Globalisation Securing Household Income among Small-Scale Farmers in Kakamega District : Possibilities and Limitations of Diversification. 41/2007. GIGA Working Papers. Hamburg: GIGA. Available online at: https://www.giga-hamburg.de/workingpapers.%0AGIGA (accessed August 21, 2020).
Ethiopian Public Health Institute ICF (2019). Ethiopia Mini Demographic and Health Survey 2019: Final Report. Rockville, MD. Available online at: https://dhsprogram.com/pubs/pdf/FR363/FR363.pdf (accessed August 21, 2020).
FAO (2009). Draft Declaration of the World Summit on Food Security. Rome's Wor. Rome: The Food and Agriculture Organization of the United Nations. Available online at: http://www.fao.org/fileadmin/templates/wsfs/Summit/Docs/Declaration/WSFS09_Draft_Declaration.pdf (accessed August 21, 2020).
FAO FHI 360 (2016). Minimum Dietary Diversity for Women A Guide to Measurement. Rome: FAO (the Food and Agriculture Organization of the United Nations), FANTA (Food and Nutrition Technical Assistance III Project) and FHI 360. Available online at: http://www.fao.org/3/a-i5486e.pdf (accessed August 21, 2020).
FAOSTAT (2020). FAOSTAT. Available online at: https://www.fao.org/faostat/en/#data/TCL (accessed August 21, 2020).
FEWS NET (2002). Ethiopia: Food Security Update 2002. Available online at: https://reliefweb.int/sites/reliefweb.int/files/resources/9CF3EE6079D3BD7785256B61004C77EB-usaid_eth_14feb.pdf (accessed August 21, 2020).
FEWS NET (2004). ETHIOPIA: Food Security Update 2004. Available online at: https://fews.net/sites/default/files/documents/reports/Ethiopia_200410en.pdf (accessed August 21, 2020).
FEWS NET (2005). ETHIOPIA: Food Security Update 2005. Available online at: https://fews.net/sites/default/files/documents/reports/Ethiopia_200608en.pdf (accessed August 21, 2020).
FEWS NET (2009). ETHIOPIA: Food Security Update 2009. Available online at: https://fews.net/sites/default/files/documents/reports/ethiopia_05_2009_final.pdf (accessed August 21, 2020).
FEWS NET (2011). ETHIOPIA Food Security Outlook 2011. Available online at: https://fews.net/sites/default/files/documents/reports/ET_dekadal_2011_07_26_final.pdf (accessed August 21, 2020).
FEWS NET (2013). ETHIOPIA Food Security Outlook October 2012 to March 2013 The Food Security. Available online at: https://reliefweb.int/sites/reliefweb.int/files/resources/ethiopia_ol_10_2012~%281%29.pdf (accessed August 21, 2020).
FEWS NET (2015). ETHIOPIA Food Security Outlook Update 2015. Available online at: https://fews.net/sites/default/files/documents/reports/Ethiopia_FSOU_12_2015_0.pdf (accessed August 21, 2020).
FEWS NET (2017). ETHIOPIA Food Security Outlook Update August 2017. Available online at: https://fews.net/sites/default/files/documents/reports/ET_FSOU_2017_08_final.pdf (accessed August 21, 2020).
Food Nutrition Technical Assistance III Project (FANTA) (2016). Nutrition Assessment, Counseling, and Support (NACS): A User's Guide—Module 2: Nutrition Assessment and Classification, Version 2. Nutrition Assessment, Counseling, and Support (NACS). Washington, DC. Available online at: https://www.fantaproject.org/sites/default/files/resources/NACS-Users-Guide-Module2-May2016.pdf (accessed August 21, 2020).
Gebreyesus, S. H., Lunde, T., Mariam, D. H., Woldehanna, T., and Lindtjørn, B. (2015). Is the adapted household food insecurity access scale (HFIAS) developed internationally to measure food insecurity valid in urban and rural households of Ethiopia? BMC Nutr. 1, 1–10. doi: 10.1186/2055-0928-1-2
Gilligan, D., John, O., Hoddinot, A., and Taffessen, S. (2008). The Impact of Ethiopia's Productive Safety Net Programme and Its Linkages The Impact of Ethiopia's Productive Safety Net Programme and Its Linkages. 00839. IFPRI Discussion Paper. Washington, DC: The International Food Policy Research Institute. doi: 10.2139/ssrn.1273877
Girma, M., Melese, T., Mussie, S., Zerihun, B., Alemayehu, H., Cornelia van Zyl, M., et al (2021). Nutrition Data Mapping for Ethiopia : Assessment of the Availability and Accessibility of Nutrition-Related Data. Available online at: https://www.nipn.ephi.gov.et/sites/default/files/2020-05/NNP2_pdf.pdf (accessed August 21, 2020).
Gizaw, S. (2013). Resettlement revisited : the post-resettlement assessment in Biftu Jalala Resettlement Site. Ethiop. J. Bus. Econ. 3, 23–57. Available online at: https://www.ajol.info/index.php/ejbe/article/view/111049 (accessed November 27, 2022).
Gole, T. W. (2003). Vegetation of the Yayu Forest in SW Ethiopia: Impacts of Human Use and Implications for in Situ Conservation of Wild Coffea Arabica L. Populations. Rheinischen Friedrich-Wilhelms University of Bonn. Available online at: https://cuvillier.de/uploads/preview/public_file/6946/3898738663.pdf (accessed August 21, 2020).
Gole, T. W. (2015). Environment and Coffee Forest Forum Coffee : Ethiopia ' s Gift to the World The Traditional Production Systems as Living Examples of Crop Domestication, and Sustainable Production and an Assessment of Different Certification Schemes. Environment and Coffee Forest Forum (ECFF). Available online at: https://m.naturskyddsforeningen.se/node/36761 (accessed August 21, 2020).
Gole, T. W., Feyera, S., Kassahun, T., and Fite, G. (2009). Yayu Coffee Forest Biosphere Reserve Nomination Form Part I. Addis Ababa, Ethiopia. Available online at: https://www.academia.edu/39009315/Yayu_Coffee_Forest_Biosphere_Reserve_Management_Plan_1_Yayu_Coffee_Forest_Biosphere_Reserve_Management_Plan (accessed August 21, 2020).
Govereh, J., and Jayne, T. S. (1999). Effects of Cash Crop Production on Food Crop Productivity in Zimbabwe: Synergies or Trade-Offs? ISSN 0731-3438. East Lansing, MI. Available online at: http://www.aec.msu.edu/agecon/fs2/index.htm~MSU (accessed August 21, 2020).
Govereh, J., and Jayne, T. S. (2003). Cash cropping and food crop productivity : synergies or trade-offs? Agri. Econ. 28, 39–50. doi: 10.1111/j.1574-0862.2003.tb00133.x
Hailu, A. G., and Amare, Z. Y. (2022). Impact of productive safety net program on food security of beneficiary households in Western Ethiopia: a matching estimator approach. PLoS ONE 17, 17. doi: 10.1371/journal.pone.0260817
Hashmiu, I., Agbenyega, O., and Dawoe, E. (2022). Cash crops and food security: evidence from smallholder cocoa and cashew farmers in Ghana. Agri. Food Secur. 11, 1–21. doi: 10.1186/s40066-022-00355-8
Hirvonen, K., Taffesse, A. S., and Hassen, I. W. (2015). Seasonality and household diets in Ethiopia. Public Health Nutr. 19, 1723–1730. doi,: 10.1017/S.1368980015003237
ICF International (2012). Children's Health and Nutritional Status: Data from the 2011 Ethiopia Demographic and Health Survey. Calverton, MD. Available online at: https://dhsprogram.com/pubs/pdf/FR255/FR255.pdf (accessed August 21, 2020).
Ilfata, F. (2008). Remote Sensing and GIS Assisted Participatory Biosphere Reserve Zoning for Wild Coffee Conservation: Case of Yayu Forest. Addis Ababa: Addis Ababa University.
Jemal, O., Callo-Concha, D., and Van Noordwijk, M. (2018). Local agroforestry practices for food and nutrition security of smallholder farm households in Southwestern Ethiopia. Sustainability 10, 21. doi: 10.3390/su10082722
Jemal, O., Callo-Concha, D., and Van Noordwijk, M. (2021). Coffee agroforestry and the food and nutrition security of small farmers of South-Western Ethiopia. Front. Sustain. Food Syst. 5, 1–14. doi: 10.3389/fsufs.2021.608868
Jemal, O. M. (2018). The role of local agroforestry practices for enhancing food and nutrition security of smallholding farming households: the case of Yayu area, south-western Ethiopia (Ph.D. dissertation). Rheinischen Friedrich-WilhelmsUniversit?t zu Bonn, Bonn, Germany. Available online at: http://hss.ulb.uni-bonn.de/2018/5157/5157.pdf (accessed November 27, 2022).
Jemal, O. M., and Callo-Concha, D. (2017). Potential of Agroforestry for Food and Nutrition Security of Small-Scale Farming Households. 161. ZEF Working Paper Series, ISSN 1864-6638. Vol. 6. ZEF Working Paper. Bonn. Available online at: http://hdl.handle.net/10419/187467 (accessed August 21, 2020).
Joray, M., G/Egziabher, T., Stoecker, B. J., and Hambidge, K. M. (2011). Seasonal differences in household food insecurity in Sidama Zone, Southern Ethiopia. FASEB J. 25, 10. doi: 10.1096/fasebj.25.1_supplement.986.10
Kassa, B. (2004). Resettlement of peasants in Ethiopia. J. Rural Develop. 27, 223–253. Available online at: https://repository.krei.re.kr/bitstream/2018.oak/18225/1/RESETTLEMENT~OF~PEASANTS~IN~ETHIOPIA.pdf (accessed November 27, 2022).
Kennedy, G., Ballard, T., and Dop, M. C. (2011). Guidelines for Measuring Household and Individual Dietary Diversity. Rome: Food and Agriculture Organization of the United Nations (FAO). Availablde online at: http://www.fao.org/3/a-i1983e.pdf (accessed August 21, 2020).
Keyzer, M. A., Merbis, M. D., Pavel, I. F. P. W., and Van Wesenbeeck, C. F. A. (2005). Diet shifts towards meat and the effects on cereal use: can we feed the animals in 2030? Ecol. Econ. 55, 187–202. doi: 10.1016/j.ecolecon.2004.12.002
Kuhn, A., and Endeshaw, K. (2015). Trends and Drivers of Crop Biomass Demand: Sub-Saharan Africa vs the Rest of the World. Agricultural and Resource Economics, Discussion Papers. 2015:3. Bonn: Institute for Food and Resource Economics, University of Bonn.
Masanjala, W. H. (2006). Cash crop liberalization and poverty alleviation in Africa. Evidence from Malawi 35, 231–240. doi: 10.1111/j.1574-0862.2006.00156.x
Maxwell, D., Coates, J., and Vaitla, B. (2013). How Do Different Indicators of Household Food Security Compare? Empirical Evidence from Tigray. Medford: Feinstein International Center, Tufts University. Available online at: https://fic.tufts.edu/assets/Different-Indicators (accessed August 21, 2020).
Mekonnen, D. A., and Gerber, N. (2017). Aspirations and food security in rural Ethiopia. Food Security 9, 371–385. doi: 10.1007/s12571-017-0654-6
MoARD (2009). Ethiopian Food Security Program 2010-2014. Available online at: http://faolex.fao.org/docs/pdf/eth144896.pdf (accessed August 21, 2020).
Mulu, E., and Mengistie, B. (2017). Household food insecurity and its association with nutritional status of under five children in Sekela District, Western Ethiopia: a comparative cross-sectional study. BMC Nutr. 3, 1–9. doi: 10.1186/s40795-017-0149-z
Pingali, P. L., and Heisey, P. W. (1999). Cereal Crop Productivity in Developing Countries: Past Trends and Future Prospects. 99–30. Economics. Economics Working Paper. Mexico city, Mexico. Available online at: http://repository.cimmyt.org/xmlui/bitstream/handle/10883/979/67351.pdf?sequence=1 (accessed August 21, 2020).
Rajkumar, A. S., Gaukler, C., and Tilahun, J. (2012). Combating Malnutrition in Ethiopia An Evidence-Based Approach for Sustained Results. Washington, DC: The International Bank for Reconstruction and Development/The World Bank. doi: 10.1596/978-0-8213-8765-8
Regassa, N., and Stoecker, B. J. (2011). Household food insecurity and hunger among households in Sidama District, Southern Ethiopia. Public Health Nutr. 15, 1276–1283. doi: 10.1017/S1368980011003119
Rubhara, T. T., Mudhara, M., Oduniyi, O. S., and Antwi, M. A. (2020). Impacts of cash crop production on household food security for smallholder farmers: a case of Shamva District, Zimbabwe. Agriculture 10, 50188. doi: 10.3390/agriculture10050188
Sen, A. (1981). Poverty and Famines An Essay on Entitlement and Deprivation. New York, NY: Oxford University Press. Available online at: https://www.iwanami.co.jp/moreinfo/tachiyomi/6003660.pdf (accessed August 21, 2020).
Swindale, A., and Bilinsky, P. (2006). Household Dietary Diversity Score (HDDS) for Measurement of Household Food Access: Indicator Guide (v.2). Washington, DC: FHI 360/FANTA.
Teshome, B., Kogi-Makau, W., Getahun, Z., and Taye, G. (2009). Magnitude and determinants of stunting in children underfive years of age in food surplus region of Ethiopia: the case of west Gojam Zone. Ethiop. J. Health Dev. 23, 8. doi: 10.4314/ejhd.v23i2.53223
Timmer, C. P. (1997). Farmers and markets: the political economy of new paradigms. Am. J. Agri. Econ. 79, 621–627. doi: 10.2307/1244161
van Noordwijk, M., Bizard, V., Wangpakapattanawong, P., Tata, H. L., Villamor, G. B., and Leimona, B. (2014). Tree cover transitions and food security in southeast Asia. Glob. Food Secur. 3, 200–208. doi: 10.1016/j.gfs.2014.10.005
Virchow, D., Beuchelt, T. D., Kuhn, A., and Denich, M. (2016). “Biomass-based value webs : a novel perspective for emerging bioeconomies in sub-saharan Africa,” in Technological and Institutional Innovations for Marginalized Smallholders in Agricultural Development, eds W. F. Gatzweiler and J. von Braun (Heidelberg; New York, NY; Dordrecht; London: Springer Cham), 225–38.
WFP-VAM (2009). Comprehensive Food Security & Vulnerability Analysis Guidelines. First edit. Vol. 39. Rome: World Food Programme (WFP), Food Security Analysis Service (VAM).
WFP-VAM (2015). Food Consumption Score Nutritional Quality Analysis Guidelines (FCS-N). Rome: United Nations World Food Programme, Food security analysis (VAM). Available online at: https://docs.wfp.org/api/documents/WFP-0000007074/download/ (accessed August 21, 2020).
WHO (1999). Management of Severe Malnutrition: A Manual for Physicians and Other Senior Health Workers In-and-Out. Electronic Engineering (London). Vol. 46. Geneva: World Health Organization.
WHO (2006). WHO Child Growth Standards Length/Height-for-Age, Weight-for-Age, Weight-for-Length, Weight-for-Height and Body Mass Index-for-Age Methods and Development. Developmental Medicine & Child Neurology. Vol. 51. Geneva: World Health Organization. Available online at: https://www.who.int/childgrowth/standards/Technical_report.pdf (accessed August 21, 2020).
WHO (2008). Indicators for Assessing Infant and Young Child Feeding Practices : Conclusions of a Consensus Meeting Held 6–8 November 2007 in Washington D.C., USA. Geneva: World Health Organization. Available online at: https://apps.who.int/iris/bitstream/10665/43895/1/9789241596664_eng.pdf (accessed August 21, 2020).
WHO. (1995). Physical Status: The Use and Interpretation of Anthropometry. Report of a WHO Expert Committee. World Health Organization Technical Report Series. Vol. 854. Geneva: World Health Organization. Available online at: https://onlinelibrary.wiley.com/doi/10.1002/(SICI)1520-6300(1996)8:6%3C786::AID-AJHB11%3E3.0.CO;2-I (accessed November 27, 2022).
Workicho, A., Belachew, T., Feyissa, G. T., Wondafrash, B., Lachat, C., Verstraeten, R., et al. (2016). Household dietary diversity and animal source food consumption in Ethiopia: evidence from the 2011 welfare monitoring survey. BMC Public Health 16, 1–11. doi: 10.1186/s12889-016-3861-8
World Bank. (1986). Poverty and Hunger: Issues and Options for Food Security in Developing Countries. Washington, DC: The International Bank for Reconstruction and Development; The World Bank. Available online at: http://documents.worldbank.org/curated/en/166331467990005748/pdf/multi-page.pdf (accessed August 20, 2019).
World Bank. (2021). Prevalence of Undernourishment (% of Population) - Ethiopia | Data. 2021. Available online at: https://data.worldbank.org/indicator/SN.ITK.DEFC.ZS?locations=ET (accessed November 27, 2022).
Keywords: cash crop, coffee agroforestry, dietary diversity, food access, hidden hunger, nutrition security, seasonal food-insecurity, Yayu Biosphere Reserve
Citation: Jemal OM, Callo-Concha D and van Noordwijk M (2022) Does income imply food security in coffee growing communities? A case study in Yayu, Southwestern Ethiopia. Front. Sustain. Food Syst. 6:1051502. doi: 10.3389/fsufs.2022.1051502
Received: 22 September 2022; Accepted: 21 November 2022;
Published: 14 December 2022.
Edited by:
Gopal Shukla, Uttar Banga Krishi Viswavidyalaya, IndiaReviewed by:
Olutosin Ademola Otekunrin, Federal University of Agriculture, Abeokuta, NigeriaKhulakpam Apshahana, North Eastern Hill University, India
Copyright © 2022 Jemal, Callo-Concha and van Noordwijk. This is an open-access article distributed under the terms of the Creative Commons Attribution License (CC BY). The use, distribution or reproduction in other forums is permitted, provided the original author(s) and the copyright owner(s) are credited and that the original publication in this journal is cited, in accordance with accepted academic practice. No use, distribution or reproduction is permitted which does not comply with these terms.
*Correspondence: Omarsherif M. Jemal, b21hcnNoZXJpZm1vaGFtbWVkQGFyc2l1bi5lZHUuZXQ=; b21hcnNoZXJpZm1tQGdtYWlsLmNvbQ==