Abstract
Grassland-based dairy farms are important for the provisioning of milk and ecosystem services. However, the key factors and interactions that influence the feed use efficiency of grassland-based dairy farms in practice are not well known and understood, and as a consequence no well-targeted recommendations can be provided. This paper addresses the question ‘what are the main factors that determine the variations in calculated feed efficiency and N and P use efficiencies on dairy farms subjected to agri-environmental regulations’. Monitoring and modeling data from ~12000 grassland-based dairy farms in The Netherlands over a 4 year period (2017–2020), collected through the KringloopWijzer model, were analyzed and the data from 2020 were statistically analyzed in detail. Farms greatly differed in milk production intensity (range < 10 to >25 Mg per ha per yr) and in the amount of purchased feed. The 5 and 95 percentile values of frequency distribution of the calculated annual mean feed efficiency at herd level were 0.9 and 1.3 kg milk per kg feed dry matter, respectively. Feed efficiency was statistically related to milk yield and number of young stock per cow, the share of concentrates and silage maize in the ration, and the net energy content of silage grass. At herd level, the 5 and 95 percentile values of the calculated annual mean N use efficiency increased with feed efficiency from 21 to 28%, and those of the annual mean P use efficiency from 32 to 40%. Contrary to expectations, mean surpluses of N and P at farm level remained more or less constant with feed efficiency and the intensity of milk production, but the amounts of purchased feed and manure export strongly increased with the intensity of milk production. The N and P surpluses and use efficiencies at farm level were sensitive to accounting for the externalization of feed production and manure utilization. The modeled ammonia and methane emissions per kg milk produced were relatively low on farms with high feed efficiency. In conclusion, feed use and N and P use efficiencies are key indicator for the profitability and environmental performance of dairy farms. Differences between farms in these key indicators were large, and these differences were related to a limited number of explanatory variables. Our study provides lessons for improving the profitability and environmental performance of grassland-based dairy farms.
Highlights
- Monitoring data of >12,000 dairy farms collected and examined in uniform manner.
- Calculated feed efficiency was related to milk production and young stock per cow.
- Calculated N and P use efficiencies at herd levels were related to feed efficiency.
- Calculated ammonia emissions per kg milk were inversely related to feed efficiency.
- Calculated methane emissions per kg milk were inversely related to feed efficiency.
- Accounting for externalization of off-farm feed production affects NUE and PUE.
Introduction
Feed and nutrient use efficiencies are important indicators for the production and environmental performances of dairy production, and thereby of its sustainability (Meyer and Garrett, 1967; Beever and Doyle, 2007; Powell et al., 2010). Feed costs comprise on average more than 50% of the total cost of production, indicating that small variations in feed efficiency have a large effect on farm profitability. The amount of feed needed to produce milk (and beef) has also massive implications for the area of land needed to produce the required feed. Global consumption of dairy products is projected to increase by about 2% per year (OECD-FAO, 2018), indicating that feed production has to increase as well, depending in part on developments in feed efficiency. Increasing feed production will put additional pressure on cropland and other resources needed for feed production, which are limited (Van Zanten et al., 2018). An added benefit to increasing feed efficiency is that fewer nutrients will be excreted in manure, depending also on the nutrient content of the feed. Lowering the nitrogen (N) and phosphorus (P) contents of manure has considerable benefits for intensive dairy farms struggling with manure management (Franzluebbers et al., 2021; Oenema and Oenema, 2021). Feed efficiency and the composition of the feed have also large implications for enteric methane (CH4) production in dairy cattle and for the composition of animal manure and associated emissions of ammonia (NH3) and nitrous oxide (N2O) (Gerber et al., 2011; Westhoek et al., 2014; Powell and Rotz, 2015; Løvendahl et al., 2018). Global dairy production contributed almost one-third to the total greenhouse gas (GHG) and NH3 emissions from livestock production during recent years (Uwizeye et al., 2020).
Feed efficiency (FE) in dairy production is commonly defined as some ratio of milk outputs and feed inputs. Milk outputs and feed inputs can be defined in different ways thus leading to different definitions of feed efficiency (Beever and Doyle, 2007). Milk output can be defined in terms of milk or milk solids produced, and feed inputs can be defined as gross, digestible, metabolizable, or net energy used by a lactating dairy cow or by the whole herd (including young stock). Essentially all FE expressions have their value, depending on the purpose of the study. For comparing FE of dairy farms, it is important to account for the composition of the herd and the composition of the milk produced. Thus, FE at farm level is defined here as the ratio of the amount of fat and protein corrected milk (FPCM) produced and the gross amount of feed consumed by the herd (including young stock, i.e., replacement cattle) at a farm over a whole year. Similarly, N use efficiency (NUE) at herd level is defined as the ratio of the amount of N in milk and liveweight gain and the amount of N in feed consumed by the herd at a farm (including young stock) per year (Powell et al., 2010). Hence, the feed consumed by dry and sick cows and young stock is also accounted for in our definitions of FE and NUE and phosphorus use efficiency (PUE) at herd level.
Feed efficiency in dairy production is influenced by many factors (Korver, 1988; Connor, 2015). Dairy cattle are ruminants and the quality and digestibility of the required forages are main factors, also because forages make up a large part of the total ration. Forage quality depends on the type and growth stage at harvest, as well as on its conservation after harvest. The introduction of whole-mixed rations has been important for increasing FE of (partially) housed dairy cattle because it allowed to offer the dairy herd a well-balanced and constant ration (e.g., Sova et al., 2014). The composition and health of the herd, lactation stage of the dairy cows, and the maintenance requirements of the cattle are also important factors, as these factors determine how much of the feed energy intake can be devoted to milk production (Connor, 2015; Brito and Silva, 2020). Obtaining an average estimate of the FE at farm level requires an assessment over a whole year, because of the seasonal variations in the aforementioned factors.
Improving FE has been recognized worldwide as a way to considerably reduce costs, minimize environmental impact, optimize land and resource use efficiency, and improve overall farm profitability. A better understanding of the nutritional physiology of cattle and its nutrient requirements has led to advancements in diet formulation, supplementation, and to better techniques for feed processing and storage, and thereby has greatly contributed to improving feed efficiency (Coffey et al., 2016; De Ondarza and Tricarico, 2017; Tedeschi et al., 2017). Feed efficiency depends also on the genetic traits of the herd; the genetic merit of dairy cows in relation to milk production and FE has increased greatly over the last few decades, and further progress is possible (De Haas et al., 2015; Brito et al., 2020). Equally important are the health, comfort and longevity of the dairy herd, also because replacement cattle requires feed for growth and development but produces no milk yet. The quality of forages has increased through breeding programs and through reseeding of pastures, and pasture management has improved over time, through fertilization, drainage, improved grazing management, and timely mowing (Hopkins and Wilkins, 2006; Huguenin-Elie et al., 2019). The introduction of forage maize has contributed to the provision of energy-dense and low-protein forages (Wilkinson and Rinne, 2018; Taube et al., 2020).
While most pig and poultry producers know the FE of the animals at their farm from the accounts of purchased feed and sold animals, most grassland-based dairy farms do not know the FE of the herds at the farm. This is related to the fact that a significant fraction of the feed on grassland-based dairy farms originates from own farm land (through grazing and mowing), while the harvested yields are not measured. As a consequence, there is very little information on variations in FE of grassland-based dairy farms, and on the possible causes of this variations. Thus feed trials are needed to estimate FE on grassland-based dairy farms (De Haas et al., 2015). Alternatively, feed intake can be calculated indirectly, on the basis of the energy and protein requirements of the cattle and the measured composition of the offered feed; this procedure requires a calculation model and an accurate accounting system, such as the KringloopWijzer, which is used on dairy farms in the Netherlands since 2016 (Oenema and Oenema, 2021). Evidently, this calculated FE of the whole herd (lactating and non-lactating cows plus young stock) is a proxy of the ‘true’ FE measured in feed trials.
Here, we provide a detailed analysis of the variations in calculated FE of ~12,000 grassland-based dairy farms in the Netherlands for the period 2017–2020, using the results of monitoring data and supported by model calculations of the KringloopWijzer. The overall objective of our study was to increase the understanding of the variations in FE of the herd on dairy farms, and to unravel the causes of these variations, through graphical and statistical analyses. The specific research questions were (i) what are the variations in calculated FE at farm level, and which factors explain most of this variation, (ii) what are the variations in calculated NUE and P use efficiency (PUE) at herd and farm levels, and which factors explain most of this variation, and (iii) how do calculated ammonia (NH3) and enteric methane (CH4) emissions and N and P surpluses at farm level relate to calculated FE, NUE and PUE. This study builds on an earlier study (Oenema and Oenema, 2021), which analyzed farm data collected through the KringloopWijzer for the years 2013–2015, and focused on the relationships between the intensity of milk production and farm performance indicators.
Materials and methods
Dairy farming in the Netherlands
In total, there were about 17,000 grassland-based dairy farms in the Netherlands in 2018, which produced 14.1 Tg milk per year, and used about two-third of the total agricultural area (1.8 Mha). In addition nearly one-third of the feed (concentrates) was imported from other countries. Most dairy farms are family farms. In 2018, these farms had on average 95 dairy cows and 64 ha of land (80% grassland and 20% forage maize). Larger farms (>150 cows) may have one or more laborers. Most dairy farms make use of professional contractors for field work (manure application and harvesting). About 25% of the dairy farms make use of automatic milking systems (ZuivelNl, 2019). Before 2015, total milk production was limited by tradable milk quota, and from 2017 by tradable production rights, expressed in kg P2O5 (1 kg P2O5 is equivalent to on average 200–230 kg milk, depending on milk production efficiency, and cost 100 to 200 euro per kg, depending on the balance of supply and demand in the market).
All farms are required to adopt agri-environmental regulations. Manure and fertilizer use is constrained by N and P application limits (Schröder and Neeteson, 2008). Manure N application limits ranged from 170 to 250 kg ha−1 yr−1 during the last 5 years, depending on farm-specific permits. Total P application limits ranged from 17 to 52 kg ha−1 yr−1 for arable land and from 33 to 52 P ha−1 yr−1 for grassland, depending on soil P status. There is a ban on the use of synthetic P fertilizer for most dairy farms. Most dairy manure (~95%) of housed cattle is collected as slurry below slatted floor in cubicle houses. A few farms have littered barns and solid manure. The slurry has to be stored in leakproof and covered manure storages, and has to be applied to land using low-emission techniques during the period 16 February to 31 August. Manure production, manure use, and manure export from the farm have to be registered at a governmental office, which verifies the submitted data. Farms with a surplus of manure have to process and export the surplus manure to other farms, which costs €10 to 20 m−3 of slurry, depending on the balance of supply and demand.
Data collection
Formal permission was obtained from the Dutch Dairy Association (ZuivelNL) to use and analyze data from dairy farms anonymously. The data were collected through the KringloopWijzer on an annual basis during the years 2017–2020, but only the 2020 data are used and presented here (see below). Farmers have to complete the data recording in the KringloopWijzer, often with the help of advisors, and submit the results to the Dairy Association for compliance reasons. Farmers use the results also for management decisions.
The KringloopWijzer model and the data collection procedures are described in detail in the Supplementary Information (Supplementary Information A). Four components are distinguished within a dairy farm, i.e., herd, manure, soil and crop (Supplementary Figure S1, Supplementary Table S1). The KringloopWijzer model estimates the energy requirement and supply of the herd, and the N and P flows through the four components of a farms. An output from one component is an input into another component of the farm, but losses are incurred in these transfers. All feed and N and P inputs and outputs at farm level were estimated, based on farm accounts (purchased feed, fertilizers, manure, and exported milk, animals, crop products and manure) and calculations (Supplementary Information A).
The net energy (NE) requirement of cattle is the starting point of the feed use calculations; the NE requirement is expressed in VEM (1 VEM = 6.9 kJ). The total VEM requirement is the sum of the VEM requirement for milk production, maintenance, liveweight gain and reproduction (SI A). For maintenance costs, a distinction is made between lactating cows and dry cows, and between grazing and zero-grazing. The VEM requirement of the total dairy herd (in VEM year−1) is the sum of the VEM requirement of dairy cows, and heifers and calves (replacement dairy cattle). Corrections were made for the feed requirement of any other animals (e.g., beef cattle) on some of the farm; these animals were excluded from the analysis of FE of the dairy herd.
Total annual N and P surpluses at farm level were derived from the difference in total input and total outputs. The N and P use efficiencies at farm level (NUEFarm and PUEFarm) were derived from the ratio of total output and total input. Note that manure export was recorded as a negative import (and not as an output), following Quemada et al. (2020), because this way of recording provides calculated estimations of NUEFarm and PUEFarm which allow a more precise comparison among dairy farms greatly differing in milk production intensity and manure export (Oenema and Oenema, 2021). A detailed description of the algorithms of the KringloopWijzer model can be found in Supplementary Information A and in De Vries et al. (2020).
Supplementary Table S2 provides a summary overview of the farm data from 2017 to 2020. All farm data were checked for plausibility, using a checklist with criteria. For the 2017 data, 31% of the farms were rejected, for 2018 a total of 18%, for 2019 a total of 15% and for 2020 a total of 12% were rejected. Evidently, the quality of the data recording improved over time. Main reasons for rejection of farms were (1) incomplete records, and (2) unlikely records (e.g., harvested grass yields of >20 t (DM ha)−1). We estimated a wide range of indicator values and found that the mean values for the main indicators were rather similar for the 4 years (Supplementary Table S2), although weather conditions differed greatly between these years. Based on the similarity, we decided to analyze only data from 2020 in detail. The sample of farms is representative for dairy farms in The Netherlands; the average farm size and milk production per cow and per ha were similar to the national means (not shown).
Data analyses
Two approaches were applied to unravel feed use and N and P use efficiencies on dairy farms, i.e., a graphical approach and a statistical approach. In the graphical approach, all farm were ordered in ascending feed efficiency (FE, in kg feed DM (FeedDM) per kg milk produced), and then divided in 6 ‘Feed efficiency groups’ according to percentile values (0–10; 10–30; 30–50; 50–70; 70–90; and 90–100%). Hence, groups at the end of the distribution were smaller (having fewer farms), because the variation among farms is larger at the tails of the distribution than in the center of the distribution (Supplementary Figure S2). The differences between the means per feed efficiency group were statistically analyzed by means of ANOVA, using GenStat (VSN International, 2019). The variation among farms in indicator values for each efficiency group were visualized by means of box plots, which present the 25 and 75 percentile values, and the whiskers present the 5 and 95 percentiles. The line in the boxes indicates the median value.
Following Quemada et al. (2020), the effects of externalization of (inefficiencies associated with) feed production, through the purchase of feed from elsewhere, and manure utilization, through export of manure to other farms, were explored by assuming that the N and P in purchased feed was produced with N use and P use efficiencies of 75%, and that the exported manure N was utilized by an efficiency of 50% and manure P with an efficiency of 100%. Hence, we increased the N and P inputs from purchased feed by a factor of 1.33 and halved the amounts of N exported in manure in additional sensitivity analyses. These correction factors were chosen quite arbitrarily. A N and P use efficiency of 75% for purchased feed is higher than the global mean efficiency in crop production (range 40–50%). However, purchased feed often contains by-products and residues (e.g., spent grains, citrus pulp), and to account for these residues we assumed a N use efficiency of 75. The corrected N and P surpluses and NUE and PUE are indicated by “corrected N and P surpluses” and “corrected NUE and PUE”, and provide rough indications of the possible effects of externalization of feed production and manure utilization on intensive dairy farms.
In the statistical approach, relationships between FE, NUE, PUE, N and P surpluses on the one hand and explanatory indicators on the other hand were analyzed with multiple regression models. Prior to the analysis all variables were standardized; the mean value was subtracted from each observation and the result divided by the standard deviation of the mean (i.e., all observations were rescaled per variable; the rescaled observations have a mean of 0 and a standard deviation of 1). We established regression models using a range of potential explanatory indicators (predictors). The relevance of variables was tested using the RSEARCH procedure in GenStat (all possible subset selection; VSN International, 2019). Only explanatory indicators (regressors) that were sufficiently uncorrelated (r < 0.70) have been included in the selection process to avoid the problem of collinearity (Ott and Longnecker, 2010). In case of high correlations, one of the variables was selected for inclusion in the selection process and the other was rejected. To identify the best parameter combinations, the percentage of variance accounted for (; i.e., adjusted for the number of parameters), the value of Mallows' Cp (Ott and Longnecker, 2010), and the p value of the parameter estimates were evaluated. The selected models were based on the marginal increase of with increasing number of variables, a low Cp, and the significance of the parameters (p < 0.05). Results of the regression models for the standardized variables are presented in Table 3, and those with the unstandardized variables are presented in SI C.
Results
Feed and nutrient use efficiencies of dairy farms
Mean FE at farm level ranged from 0.93 kg FCPM (kg feedDM)−1 for feed efficiency (FE) group 1 to 1.34 kg FCPM (kg feedDM)−1 for group 6 (Table 1). The frequency distribution of FE was highly peaked, and slightly skewed to the left (Supplementary Figure S2). Yet, the relatively small differences between the six groups in mean FE were statistically significant. Many other performance indicators also differed significantly between groups (Tables 1, 2). This indicates that FE is a key performance indicator and related directly or indirectly to many other farm performance indicators. It should be noted however, that the statistically significance of the differences between the means per group for nearly all indicators is in part related to the very large number of farms underlying the mean values in Tables 1, 2.
Table 1
| Indicators | Groups of farms, ordered in ascending order of feed efficiency | |||||
|---|---|---|---|---|---|---|
| 1 | 2 | 3 | 4 | 5 | 6 | |
| 0–10% | 10–30% | 30–50% | 50–70% | 70–90% | 90–100% | |
| Feed efficiency (kg FPCM (kg DM)−1) | 0.93 | 1.08 | 1.15 | 1.19 | 1.24 | 1.34 |
| Number of farms per group | 1,277 | 2,559 | 2,527 | 2,556 | 2,553 | 1,272 |
| General farm characteristics | ||||||
| Total farm area (ha) | 52 a | 56 b | 58 bc | 60 cd | 60 cd | 61 d |
| Share of grassland (%) | 90 f | 88 e | 86 d | 85 c | 82 b | 81 a |
| Total milk production per farm (Gg yr−1) | 498 a | 744 b | 927 c | 1,041 d | 1,177 e | 1,305 f |
| Milk production (kg ha−1) | 9,962 a | 13,615 b | 15,998 c | 17,759 d | 19,814 e | 23,292 f |
| Milk production (kg cow−1) | 6,657 a | 8,035 b | 8,792 c | 9,252 d | 9,678 e | 10,077 f |
| Young stock [number (10 cows−1)] | 7.2 f | 6.0 e | 5.6 d | 5.2 c | 4.5 b | 2.7 a |
| Purchased heifers [number (100 cows−1)] | 2 a | 2 a | 2 ab | 3 b | 6 c | 14 d |
| Grazing intensity (hours yr−1) | 1,958 f | 1,432 e | 1,127 d | 954 c | 764 b | 635 a |
| N use efficiency farm (%) | 37 a | 37 a | 38 b | 40 c | 42 d | 45 e |
| Corrected N use efficiency farm (%)* | 31 bc | 31 a | 31 ab | 31 abc | 31 c | 33 d |
| N surplus farm (kg ha−1) | 192 a | 237 b | 263 c | 279 d | 302 e | 332 f |
| Corrected N surplus farm (kg ha−1)1 | 182 a | 222 b | 242 c | 251 d | 266 e | 283 f |
| N surplus farm (g (kg FPCM)−1) | 15 f | 13 e | 12 d | 11 c | 10 b | 9 a |
| Corrected N surplus farm (g (kg FPCM)−1)* | 18 f | 16 e | 16 d | 15 c | 14 b | 14 a |
| Total N output (kg ha−1) | 96 a | 128 b | 156 c | 179 d | 210 e | 264 f |
| N output in milk and animals (kg ha−1) | 65 a | 86 b | 99 c | 109 d | 122 e | 144 f |
| N output in manure (kg ha−1) | 18 a | 29 b | 43 c | 56 d | 72 e | 96 f |
| N output in manure [g (kg FPCM)−] | 1.34 a | 1.59 b | 2.02 c | 2.40 d | 2.76 e | 3.20 f |
| N in purchased feed (kg ha−1) | 95 a | 135 b | 166 c | 190 d | 222 e | 273 f |
| P use efficiency farm (%) | 109 ab | 102 a | 103 a | 113 b | 111 ab | 109 ab |
| Corrected P use efficiency farm (%)* | 44 a | 71 b | 78 b | 77 b | 75 b | 73 b |
| P surplus farm (kg ha−1) | 2 d | 1 c | 1 b | 0 a | 0 a | 0 a |
| Corrected P surplus farm (kg ha−1)* | 7 a | 8 b | 9 c | 9 c | 10 d | 13 e |
| P surplus farm [g (kg FPCM)−1] | 0.2 d | 0.1 c | 0.1 b | 0.0 a | 0.0 a | 0.0 a |
| Corrected P surplus farm [g (kg FPCM)−1]* | 0.6 d | 0.6 c | 0.5 bc | 0.5 a | 0.5 ab | 0.5 abc |
| P output in milk and animals (kg ha−1) | 13 a | 17 b | 19 c | 21 d | 24 e | 28 f |
| Total P output (kg ha−1) | 18 a | 23 b | 28 c | 31 d | 36 e | 45 f |
| P output in manure (kg ha−1) | 3 a | 5 b | 7 c | 8 d | 11 e | 14 f |
| P output in manure [g (kg FPCM)−1] | 0.2 a | 0.3 a | 0.3 b | 0.4 c | 0.4 d | 0.5 e |
| P in purchased feed (kg ha−1) | 15 a | 20 b | 25 c | 28 d | 32 e | 39 f |
| Total NH3 emissions (kg ha−1) | 50 a | 57 b | 60 c | 61 d | 62 e | 64 f |
| Total NH3 emissions [g (kg FPCM−1)] | 4.9 f | 4.0 e | 3.6 d | 3.3 c | 3.0 b | 2.7 a |
| Corrected NH3 emissions [g (kg FPCM−1)]** | 1.4 f | 1.2 e | 1.1 d | 1.0 c | 1.0 b | 0.9 a |
| Total GHG emissions [g CO2-eq (kg FPCM−1)] | 1,381 f | 1,262 e | 1,210 d | 1,175 c | 1,146 b | 1,118 a |
| Enteric CH4 emissions [g CO2-eq (kg FPCM−1)] | 626 f | 547 e | 514 d | 492 c | 464 b | 420 a |
Mean farm characteristics and indicators of 12,770 dairy farms for the year 2020.
Farms were ordered in ascending order of Feed efficiency (kg FPCM (kg DM)−1) and then divided in 6 subsequent groups according to percentile values.
The means are presented for each group.
Different letters behind numbers in a row indicate that the means of the indicator values were significantly different between groups (P < 0.05).
Corrected for the externalization of purchased animal feed and exported animal manure. We assumed that the feed was produced with an efficiency of 75% for both N and P, and that exported manure N was utilized with an efficiency of 50% and manure P with an efficiency of 100%.
Emissions of NH3 from housing systems were estimated using a uniform emission factor of 15% of the TAN content in the manure (see text).
Table 2
| Indicators | Groups of farms, ordered in ascending order of feed efficiency | |||||
|---|---|---|---|---|---|---|
| 1 | 2 | 3 | 4 | 5 | 6 | |
| 0–10% | 10–30% | 30–50% | 50–70% | 70–90% | 90–100% | |
| Indicators herd management | ||||||
| N use efficiency herd (%) | 21.5 a | 23.6 b | 24.8 c | 25.6 d | 26.5 e | 27.9 f |
| P use efficiency herd (%) | 32.3 a | 35.4 b | 36.6 c | 37.7 d | 38.5 e | 39.7 f |
| Milk urea content [mg (100 g milk)−1] | 23.0 e | 22.1 d | 21.6 c | 21.2 b | 21.0 a | 21.1 a |
| CP content ration [g (kg DM)−1] | 164 a | 167 c | 167 c | 167 bc | 166 b | 167 bc |
| Share of maize in ration (%) | 13 a | 15 b | 17 c | 19 d | 21 e | 23 f |
| Share of concentrates in ration (%) | 21 a | 25 b | 26 c | 27 d | 28 e | 30 f |
| Share of by-products in ration (%) | 3 a | 4 b | 5 c | 6 d | 6 e | 7 f |
| Share of grass silage in ration (%) | 43 f | 41 e | 40 d | 38 c | 36 b | 33 a |
| Share of grazed grass in ration (%) | 21 f | 15 e | 12 d | 10 c | 8 b | 7 a |
| Energy content grass silage [g VEM (kg DM)−1]* | 864 a | 885 b | 896 c | 907 d | 914 e | 921 f |
| Indicators soil management | ||||||
| N use efficiency soil (%) | 72 c | 69 b | 68 ab | 68 ab | 67 a | 67 a |
| P use efficiency soil (%) | 97 a | 98 a | 101 ab | 104 b | 105 b | 113 c |
| N surplus soil (kg ha−1) | 100 a | 120 b | 125 c | 126 c | 127 c | 128 c |
| N manure to soil (kg ha−1)** | 214 a | 230 b | 234 d | 233 cd | 232 cd | 231 bc |
| N mineral fertilizer to soil (kg ha−1) | 93 a | 117 b | 123 cd | 124 d | 124 d | 120 c |
| P manure to soil (kg ha−1)** | 29 ab | 30 c | 30 c | 30 b | 29 ab | 29 a |
| P mineral fertilizer to soil (kg ha−1) | 0.1 a | 0.2 ab | 0.2 ab | 0.2 b | 0.2 b | 0.2 ab |
| DM yield grassland (Mg ha−1) | 8.8 a | 9.4 b | 9.6 c | 9.7 c | 9.7 c | 9.6 c |
| DM yield silage maize (Mg ha−1) | 16.3 a | 16.8 b | 17.3 c | 17.4 cd | 17.5 d | 17.5 cd |
| Farm-produced feed (% of total feed intake) | 74 f | 67 e | 63 d | 60 c | 56 b | 52 a |
Mean performance indicators of herd management and soil and crop management of 12,770 dairy farms for the year 2020.
Farms were ordered in ascending order of Feed efficiency [kg FPCM (kg DM)−1] and then divided in six subsequent groups according to percentile values.
The means are presented for each group.
Different letters behind numbers in a row indicate that the means of the indicator values were significantly different between groups (P < 0.05).
VEM, feed energy unit for lactation: 1 VEM = 6.9 kJ.
amounts of manure N and P applied, plus manure N and P from droppings during grazing.
The variation among farms in FE was largest in the end-members of the FE groups (Figure 1), despite the fact that these groups contained half as many farms (Table 1). Farms in feed efficiency groups 2 to 5 had low within-group and also low between-group differences in FE. The mean number of young stock per 10 cows ranged only from 5 to 6 in these groups, suggesting that contract rearing of young stock did not affect the mean FE of these groups much. Farms with a high FE (group 6) had on average a relatively high milk production per cow (10.1 Mg cow−1) and per ha land (23.3 Mg ha−1), and only a few young stock per cow (Figure 1), suggesting that this high apparent FE is in part related to contract rearing. These farms also had relative large shares of silage maize and concentrates in the ration, and a relatively low grazing intensity (Tables 1, 2). This indicates that farms with high FE (group 6) were large in total milk production but not in farm area, and that they had to import a significant portion of the total feed required (Table 1). Farms in group 1 with a relatively low FE were diverse, and had a relatively low milk production per cow (6.7 Mg cow−1) and ha (10.0 Mg ha−1), applied a high grazing intensity (1,958 h year−1), and had on average a high number of young stock per cow [7.2 (10 cows−1)].
Figure 1
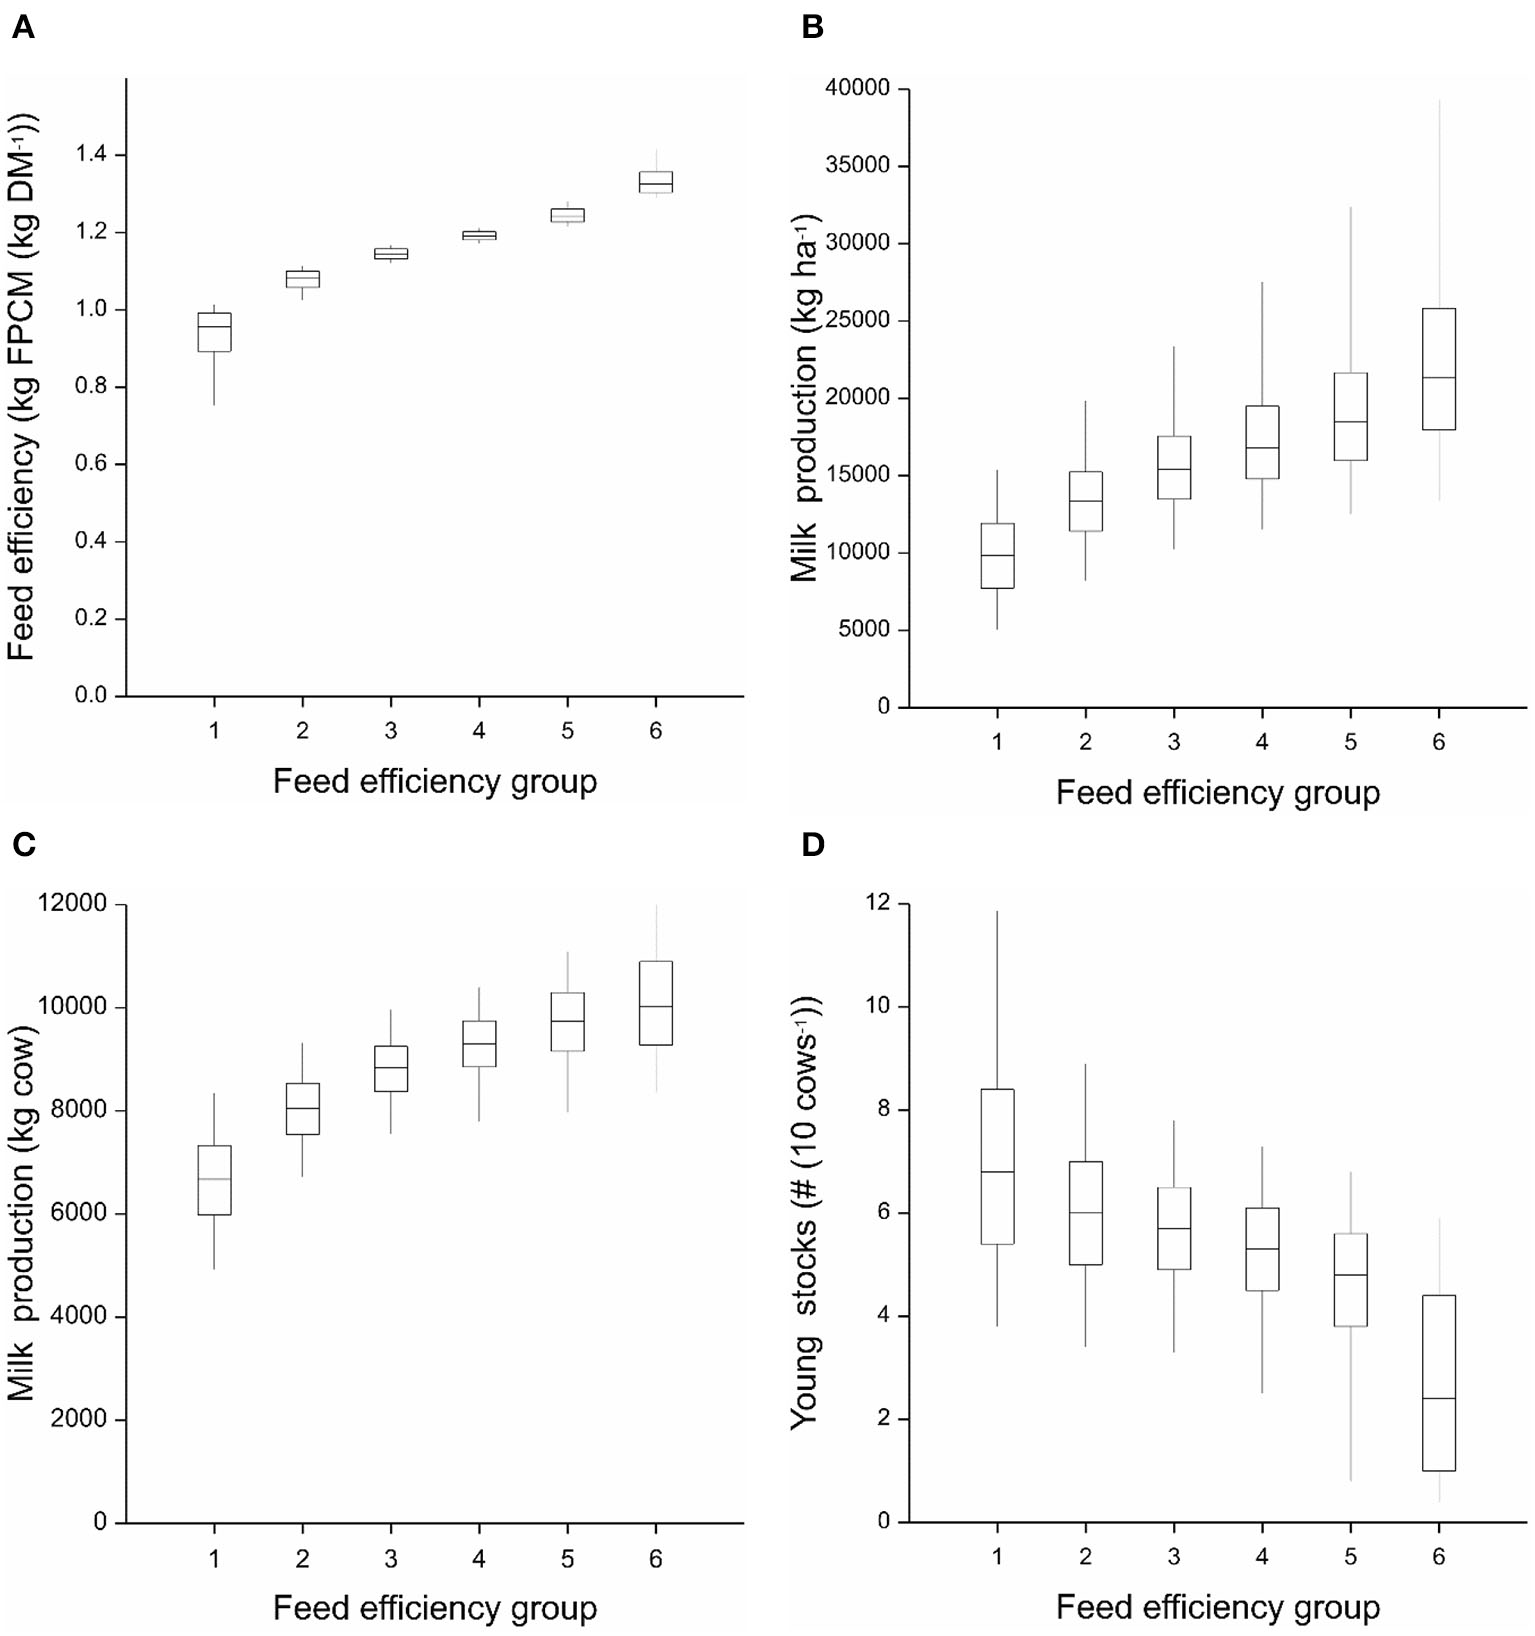
Boxplots of indicator values per group of farms. (A) Feed efficiency expressed in kg feed dry matter (DM) needed per kg milk produced; (B) milk production per ha of farmland; (C) milk production per cow; and (D) number of young stock per 10 cows. The 12.770 farms were ordered in descending order of feed efficiency (expressed in kg feed DM needed per kg milk produced) and then divided in six ‘Feed efficiency groups’ according percentile values (0–10; 10–30; 30–50; 50–70; 70–90; and 90–100%).
NUE and PUE at herd level were strongly related to FE; mean NUEherd increased from 21.5% for group 1 to 27.9% for group 6, and mean PUEherd from 32.3 to 39.7, respectively (Table 2). However, the relative differences between the means of FE groups 1 and 6 were larger for FE (44%) than for NUEherd (30%) and PUEherd (23%). This is related to the fact that the crude protein and P contents of the rations were slightly higher in group 6 than in group 1 (Table 2), and to the fact that NUEherd and PUEherd account for the retention of N and P in both milk and liveweight gain, while FE in our study is only related to milk output. Clearly, group 1 farms had relatively larger output of N and P via animals than group 6 farms.
Mean NUEfarm increased from 37% in group 1 to 45% in group 6, while mean PUEfarm was more or less constant across all feed efficiency groups (range 102 to 113%) (Table 2, Figure 2). The increase of NUEfarm is in part related to the increase in FE (more milk per kg feedDM), but in part also to the externalization of feed production. Farms with relatively high FE had a relatively large milk production per ha farm land, and therefore had to import a significant portion of the required feed. If we correct for externalization, by assuming that the purchased feed was produced by a N use efficiency of 75%, and that the exported manure was utilized on other farms with an N use efficiency of 50%, NUEfarm decreases from 37 to 32% in group 1 and from 45 to 36% in group 6 (Table 1). The high and relative constant PUEfarm across FE groups is mainly a result of strict P application limits, which depend on soil P levels, and which force dairy farms with a manure surplus to export the manure to other farms. Mean export of manure P increased from 3 kg in group 1 to 14 kg ha−1 yr−1 in group 6, while mean export of manure N increased from 18 kg in group 1 to 96 kg ha−1 yr−1 in group 6. A PUEfarm >100% indicates that P outputs exceed P inputs, and that soil P is likely depleted, which is indeed the purpose of the P application regulation; leaching and runoff of soil P to surface waters depend in part on soil P status. Thus lowering of the soil P status will decrease P leaching loss. If soil P decreases below certain target soil P values, P application limits become less strict (Schröder and Neeteson, 2008).
Figure 2
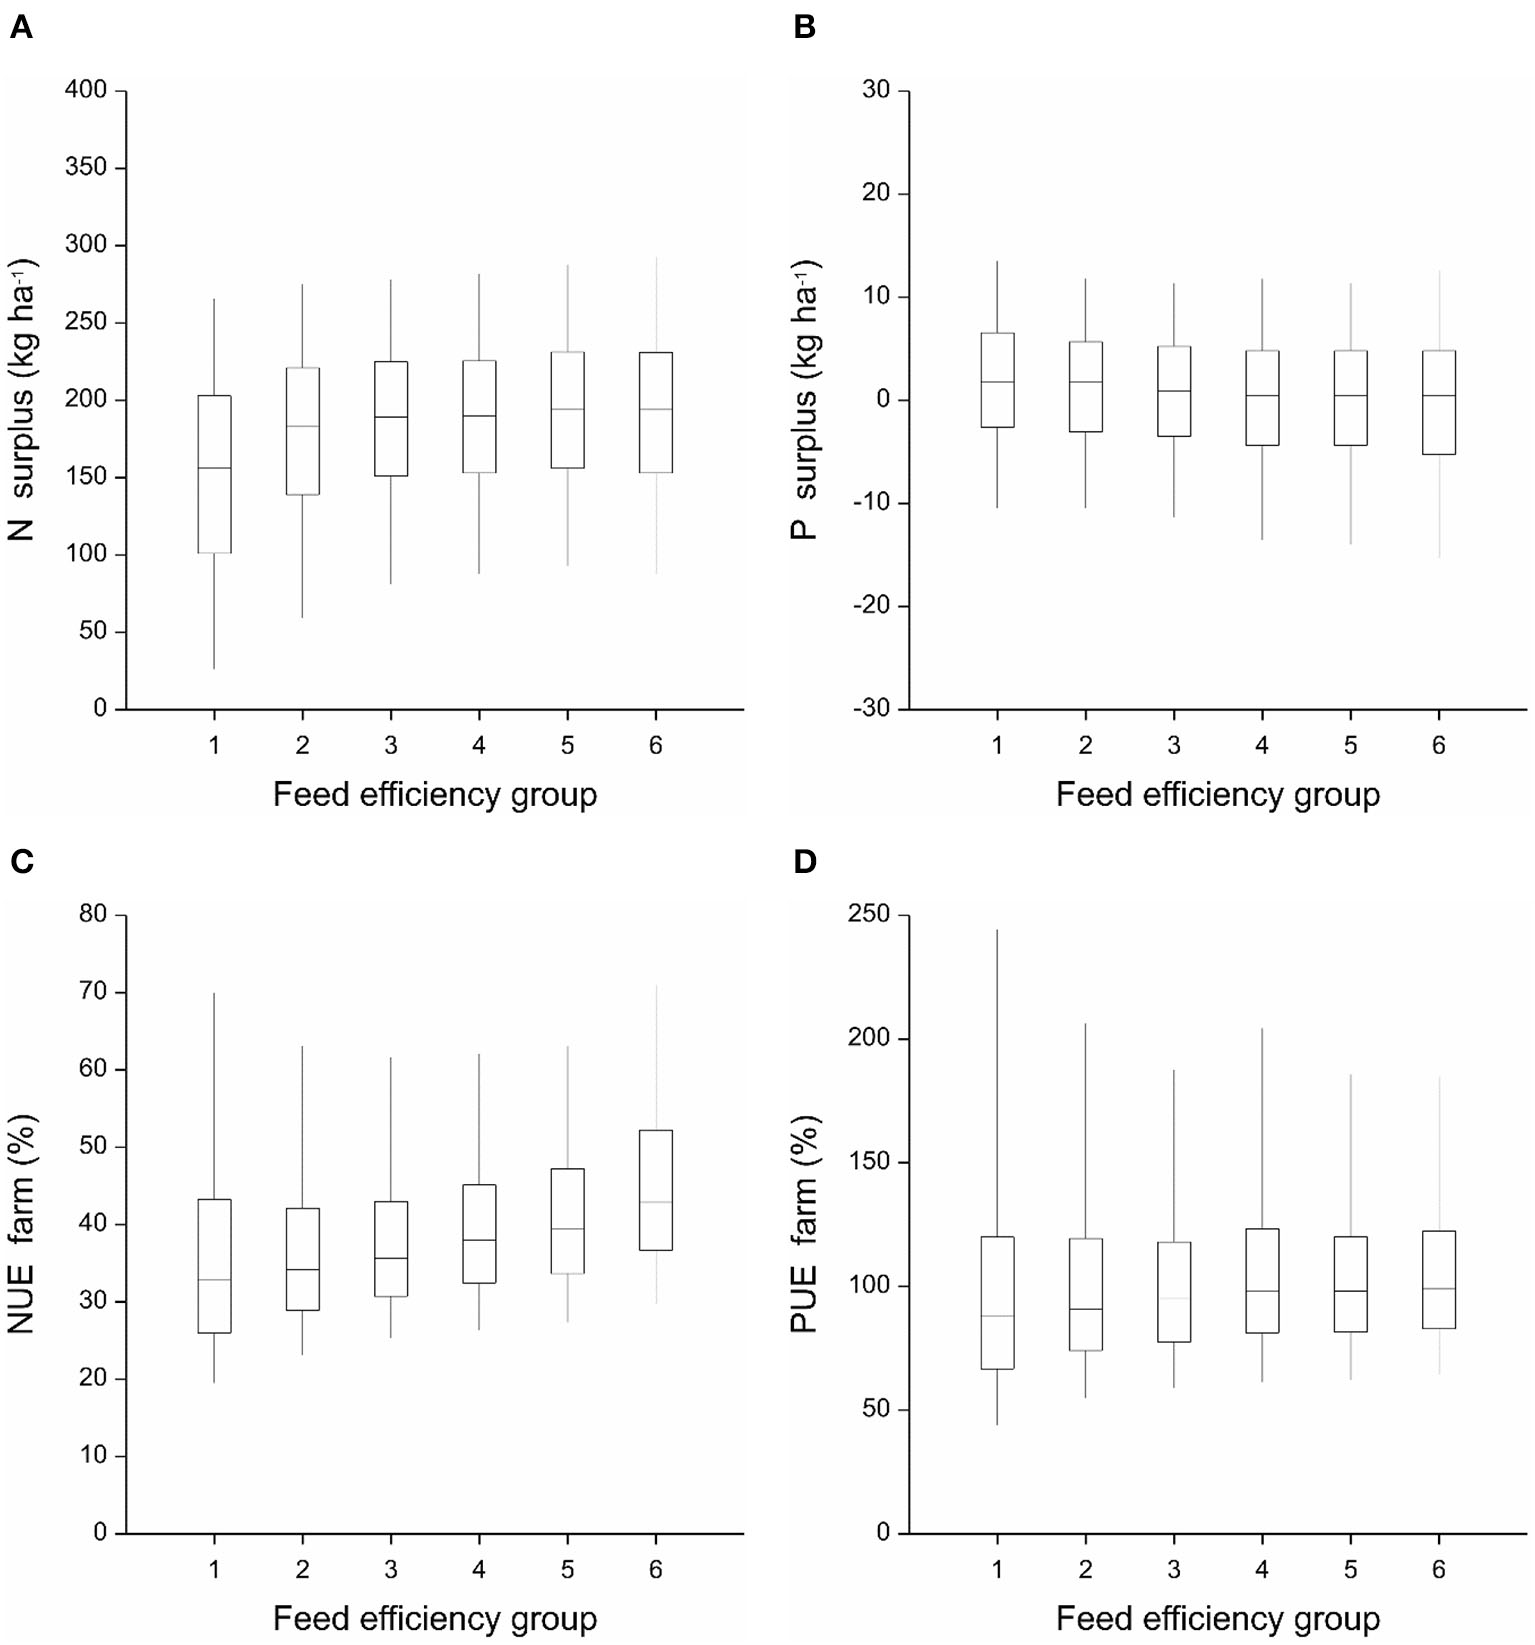
Boxplots of indicator values per group of farms. (A) Nitrogen surplus per ha of farmland; (B) Phosphorus surplus per ha of farmland; (C) Nitrogen use efficiency (NUE) at farm level; and (D) Phosphorus use efficiency (NUE) at farm level. The 12.770 farms were ordered in descending order of feed efficiency (expressed in kg feed DM needed per kg milk produced) and then divided in six “Feed efficiency groups” according percentile values (0–10; 10–30; 30–50; 50–70; 70–90; and 90–100%).
Results of the statistical approach are summarized in Table 3. As much as 93% of the variance in FE could be accounted for by variations in six explanatory variables (predictors). Milk yield and number of young stock per cow were the main influencing variables, followed by the net energy content for lactation in silage grass, and the shares of silage maize and concentrates in the rations. Similarly, the variances in NUEherd and PUEherd were explained for 90% by just five variables; milk production per cow and the crude protein content (for NUEherd) and the P content (for PUEherd) of the ration were the dominant influencing variables (Table 3). Interestingly, the variances in NUEfarm and PUEfarm were strongly related to the N use efficiency of the soil and the P use efficiency of the soil, respectively (Table 3). Hence, NUEfarm and PUEfarm are more influence by the nutrient use efficiency of the soil-crop compartment than by NUEherd and PUEherd, respectively.
Table 3
| Predictors (explanatory variables) | Standardized regression coefficients for farm performance indicators | ||||||||
|---|---|---|---|---|---|---|---|---|---|
| Feed efficiency | NUE herd | PUE herd | NUE farm | PUE farm | N surplus | P surplus | Corrected NH3 emissions* | Enteric CH4 emissions | |
| Milk production (kg cow−1) | 0.605 | 0.534 | 0.469 | ||||||
| Milk production (kg ha−1) | 0.117 | 0.382 | |||||||
| Young stocks [Number (10 cows)−1] | −0.527 | −0.304 | −0.120 | 0.146 | −0.074 | ||||
| Grazing intensity (hours yr−1) | −0.031 | −0.175 | |||||||
| Share of maize in ration (%) | 0.130 | −0.112 | −0.143 | ||||||
| Share concentrates in ration (%) | 0.145 | 0.124 | 0.139 | ||||||
| Share by-products in ration (%) | 0.058 | ||||||||
| Share grass silage in ration (%) | −0.139 | −0.126 | 0.089 | ||||||
| CP content ration (g (kg DM)−1) | 0.038 | −0.600 | 0.10 | ||||||
| P content ration [g (kg DM)−1] | −0.762 | ||||||||
| Energy content grass silage [g VEM (kg DM)−1] | 0.150 | 0.145 | 0.163 | −0.032 | |||||
| CP grass silage [g (kg DM)−1] | 0.101 | ||||||||
| FE [kg FPCM (kg DM)−1] | −0.749 | ||||||||
| N use efficiency herd (%) | 0.257 | −0.117 | −0.838 | ||||||
| P use efficiency herd (%) | 0.031 | −0.013 | |||||||
| N use efficiency soil (%) | 0.771 | −0.919 | |||||||
| P use efficiency soil (%) | 0.919 | −0.912 | |||||||
| R2adj | 93 | 90 | 90 | 66 | 85 | 87 | 82 | 79 | 60 |
Results multiple regression analysis.
Standardized regression coefficients for main farm performance indicators.
Emissions of NH3 from housing systems estimated using a uniform emission factor of 15% of the TAN content in the manure (see text).
Nitrogen and phosphorus surpluses as function of feed efficiency
Mean N surplus at farm level increased with an increase in FE (Figure 2). Mean N surplus was 151 kg ha−1 yr−1 for group 1 and 193 kg ha−1 yr−1 for group 6 (Table 1). Thus farms of group 6 had higher risk of N loss than farms of group 1. This increase is largely related to the larger manure production, and hence larger gaseous N losses from manure in housing systems and manure storages in feed efficiency group 6 compared to group 1. The relative small difference in mean N surplus (42 kg ha−1 yr−1) between farms in group 1 and group 6, while mean milk production more than doubled (from 10.0 to 23.3 Mg ha−1 yr−1), is in part related to the externalization of feed production and manure utilization by dairy farms with high FE and high milk production per ha (Tables 1, 2). Following corrections for the externalization of feed production and manure utilization, the mean corrected N surplus was 182 for group 1 and 283 kg ha−1 yr−1 for group 6; hence, the difference between the two groups in mean corrected N surplus was as much as 101 kg ha−1 yr−1, i.e., the difference more than doubled (Table 1).
Mean N surplus decreased with an increase in FE, when expressed in amounts of N per kg milk produced; mean N surplus was 15 g for group 1 and 9 g (kg FCPM)−1 for group 6. This difference of 6 g N (kg FCPM)−1 remained following corrections for the externalization of feed production and manure utilization (Table 1).
Mean P surplus was relatively constant across FE groups (range 0 to 2 kg ha−1 yr−1) (Figure 2), but increased to 7 kg for group 1 and 13 kg ha−1 yr−1 for group 6 following corrections for the externalization of feed production and manure utilization (Table 1). Mean P surplus was also relatively constant across FE groups when expressed in amounts of P per kg milk (range 0 to 0.2 g (kg FCPM)−1), also following corrections for externalization (range 0.5 to 0.6 g (kg FCPM)−1) (Table 1).
The variances in mean N surplus and mean P surplus were largely accounted for by the N use efficiency of the soil and the P use efficiency of the soil, respectively (Table 3). Milk production per ha also explained a significant portion of the variance in N surplus, but not in P surplus.
Emissions of NH3 and CH4 as function of feed efficiency
Emissions of NH3 mainly originated from cattle manure in housing and manure storages and following application of the manure to grassland and forage land (including droppings from grazing animals). Synthetic N fertilizers and feed storages were minor sources, as calcium ammonium nitrate (CAN; the main N fertilizer) has a low emission potential, and grass and maize silages were well-preserved, in general. Mean total NH3 emissions increased from 50 kg ha−1 yr−1 for FE group 1 to 64 kg ha−1 yr−1 for FE group 6 (Table 1). However, mean total NH3 emissions decreased with FE group when expressed in amounts of NH3 per kg milk; from 4.9 g NH3 (kg FCPM)−1 for group 1 to 2.7 g NH3 (kg FCPM)−1 for group 6 (Table 1). This decrease is related to the increasing milk production per mass of manure N produced, the decreasing number of young stock per cow, and the increasing manure export. The variation within groups was relatively large, especially for group 1 (Figure 3). The variation between farms in NH3 emissions was largely related to the amounts of manure in housing systems and storages, and to the total ammonium (TAN) content of the manure, and not to manure storage type and application technique, because all farms had covered manure storages and had to use low-emission manure application techniques. The TAN content was related to the content and digestibility of protein in the ration, the N retention in animal products, and to the grazing intensity. We used a uniform NH3 emission factor (15% of TAN) for the manure in housing systems, even though about 15–20% of the farms have low-emission housing systems. However, there is debate about the effectiveness of these housing systems in practice (Erisman, 2021). Further, using different emission factors for housing systems would obscure the effects of FE on total NH3 emissions. The statistical analysis revealed that the variance in mean NH3 emissions per farm was strongly related to the variance in NUEherd, while the protein content of the ration had a relatively minor influence (Table 3).
Figure 3
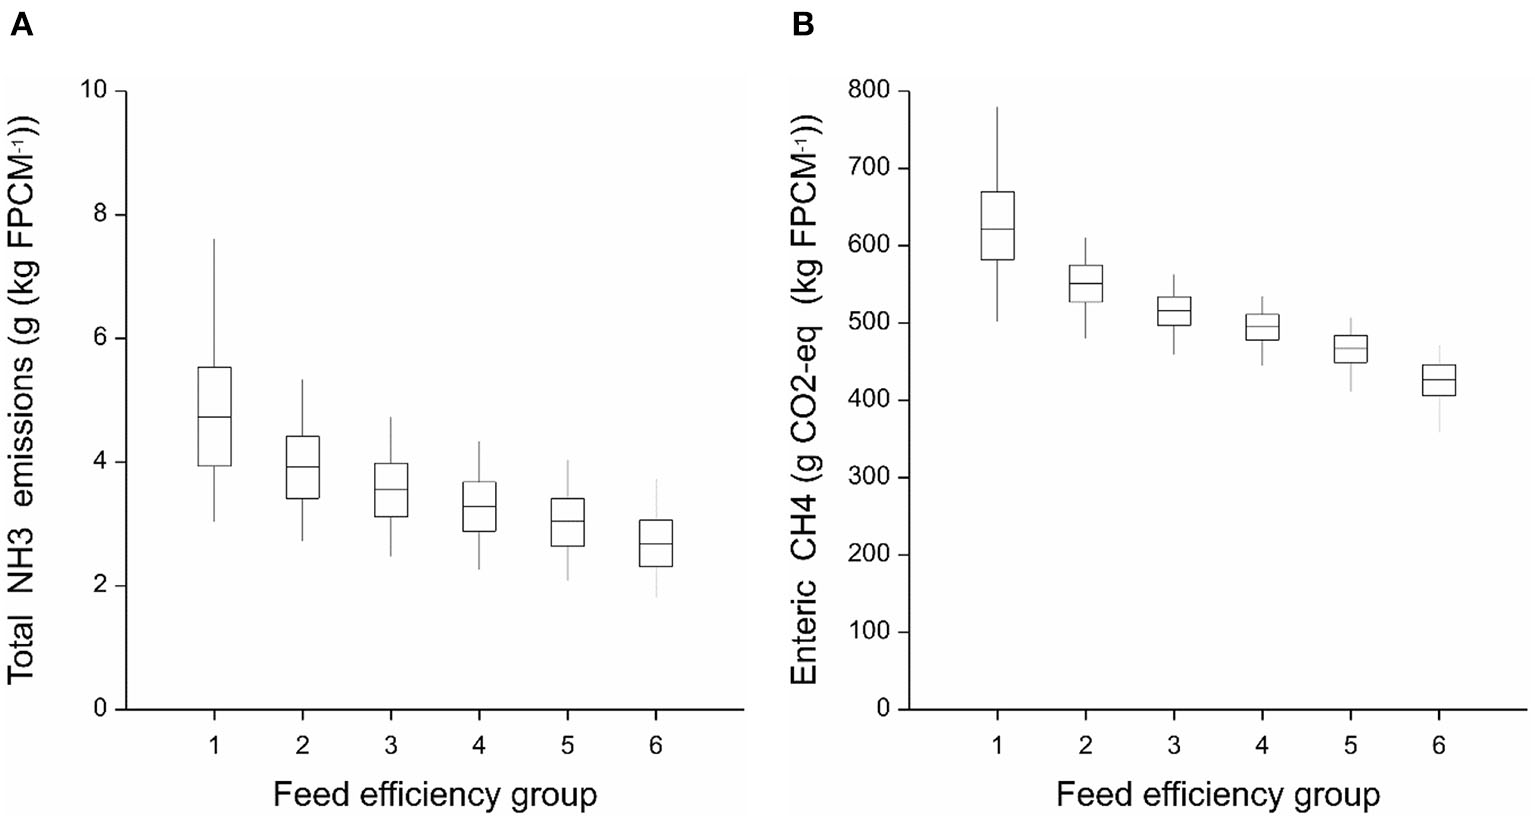
Boxplots of indicator values per group of farms. (A) Total NH3 emissions, expressed in g NH3 per kg milk; and (B) Enteric CH4, expressed in g CO2-eq per kg milk. The 12.770 farms were ordered in descending order of feed efficiency (expressed in kg feed DM needed per kg milk produced) and then divided in six “Feed efficiency groups” according percentile values (0-10; 10-30; 30-50; 50-70; 70-90; and 90-100%).
Emissions of CH4 from dairy farms mainly originate from enteric fermentation in cattle and methanogenesis in stored cattle slurries, roughly in a ratio of 4:1 when averaged over all dairy farms in NL (Van Bruggen et al., 2021). Calculated emissions of CH4 from enteric fermentation decreased with an increase of FE; mean CH4 emissions were on average slightly more than 0.6 kg CO2-eq (kg FCPM)−1 in group 1 and slightly more than 0.4 kg CO2-eq (kg FCPM)−1 in group 6 (Figure 3). The statistical analysis revealed that the variance in mean enteric CH4 emissions per farm was strongly related to the variance in FE (Table 3). Enteric fermentation contributed on average 40 to 60% to the total GHG emissions from dairy farms. Imported feed and fertilizers also had a large share in the total GHG emissions; the emissions associated with feed and fertilizers were estimated using a LCA approach (Supplementary Information A).
Discussion
Toward sustainable dairy production in the Netherlands
Sustainable dairy production commonly encompasses the notion that the milk production must be achieved with little inputs and with little pollution of the environment, while protecting birdlife, biodiversity, and natural landscape elements (Van den Pol-van Dasselaar et al., 2008; Bos et al., 2013; Clay et al., 2020). The dairy production sector in The Netherlands is commonly seen as an economically strong sector (ZuivelNl, 2019), but this sector is strongly implicated in the so-called nitrogen crisis (Stokstad, 2019; Erisman, 2021; Lamkowsky et al., 2021), greenhouse gas emissions and the decline of soil life and birdlife (Onrust et al., 2019; Tanis et al., 2020). Our study suggests that feed efficiency (FE) plays an important role here, through the relationship between FE and feed cost (see below), and between FE and emissions of NH3 and enteric CH4 per kg of milk produced (Tables 1, 2, Figure 3). Likely, there is also a connection between FE and the declines in soil life and birdlife and landscape diversity, as drainage and the intensification and rationalization of grassland use have contributed to high quality feed for a relatively low price, but at the same time have negatively impacted soil life, birdlife and landscape diversity. However, the latter is beyond the scope of the current study; also because no data on soil life, birdlife and landscape diversity is collected in the KringloopWijzer (apart from grazing intensity).
Our study confirms that FE is a key sustainability indicator for dairy farms. The importance of FE for dairy production has been known for long time (Meyer and Garrett, 1967; Korver, 1988; Beever and Doyle, 2007), but this notion was largely inferred from feed trials, experimental studies and confined animal feeding operations. Instead, our conclusions are based on calculations and monitoring data of a large number of common grassland-based dairy farms. There are large differences between these farms in a wide range of indicators values (Tables 1, 2). Differences are notably large between forerunners and laggers (Lamkowsky et al., 2021). Our results indicate that FE is inversely related to NH3 and enteric CH4 emissions per kg milk produced (Figure 3), and that the variance in FE can be explained by a limited number of key variables (Table 3). This information can be used to derive recommendations to increase FE in practice and thereby the environmental performance of dairy production. However, some of the improvement in environmental performance on farms with relatively high FE is created by the externalization of production aspects (feed production, rearing young stock, manure utilization), and thus are overestimates.
Following the implementation of the KringloopWijzer in 2016, dairy farmers in The Netherlands have become informed for the first time on FE and a wide range of other farm performance indicators. These indicators may guide farmers (and their advisors) to increase the performance and sustainability of the farm. Farm advisors recently inferred “feed profit” (FP) from the KringloopWijzer and additional data, which is equivalent to income from milk sales minus direct feed cost [also known as marginal income over feed cost (Bach et al., 2020)]. This is a common indicator for the economic performance of confined animal feeding operations, including pork and poultry producers (e.g., De Llata et al., 2001), but is now also available for grassland-based dairy farms in the Netherlands. In 2018, milk price was about €0.35 per kg milk and mean FP was €0.22 per kg milk, but with large differences between farms (equivalent to ±€400 ha−1 yr−1 (Personal Communication Jaap Gielen, farm advisor). Indicators derived from the KringloopWijzer are also increasingly used to certify milk production methods. Farmers get a premium of € 0.015 per kg milk when cows graze at least 120 days per year for more than 6 h per day. Farmers get a premium of € 0.02 per kg milk when they comply with the targets of “on the way to Planet Proof”, which include targets for grazing intensity and GHG emissions. The KringloopWijzer may be used also to monitor the progress in solving the nitrogen crises, because the dairy sector has a large share in this (Erisman, 2021).
Variations in FE
The median FE was 1.17 kg FCPM (kg feedDM)−1 (mean FE was 1.16) across all 12,770 dairy farms in 2020 (Table 1, Supplementary Figure S2). This value is significantly lower than the mean FE of 1.41±0.15 kg FCPM (kg feedDM)−1 estimated for a sample of 90 dairy farms in Italy (Atzori et al., 2021), based on an interview with farmers and additional calculations. It is also much lower that the median values (1.46 to 1.53 kg FCPM (kg feedDM)−1 for lactating dairy cows derived in a simulation study (Bach et al., 2020). Even the mean FE (1.34 kg FCPM (kg feedDM)−1 of the dairy farms in the 90–100 percentile group do not achieve the FE values mentioned by Bach et al. (2020) and Atzori et al. (2021). The main reason for these differences is that our FE estimates are gross estimates at herd level (including young stock) over a whole year, while the aforementioned estimates relate to a certain lactation stage of lactating dairy cows only. The FE of lactating Holstein Frisian dairy cows commonly ranges from 1.2 to 1.8 kg FCPM (kg feedDM)−1, where the lower value relates to concern cows and to cows >200 days in milk. The higher value relates to mature (2nd and higher lactation) and productive cows <100 days in milk (Beever and Doyle, 2007; Arndt et al., 2015).
The variation among farms in FE was positively related to milk production per cow and negatively to the number of young stock per cow (Table 3). The statistical analysis allowed to estimate FE also at dairy herd level without young stock for each efficiency group (Supplementary Figure S4). Correcting FE for young stock increased the mean FE especially for feed efficiency group 1. Note also that some farms in efficiency groups 5 and 6 outsourced the rearing of young stock; these farms purchased more heifers (Table 1). The shares of silage maize and concentrates in the ration and the energy content of grass silage also had positive relationships with FE. These relationships are all well-understandable; the higher the milk yield per cow, the lower the maintenance cost (Connor, 2015; Brito et al., 2020), and the lower the number of young stock per cow, the lower the allocation of feed energy and protein to liveweight gain (which is not accounted for in our gross FE estimation). The importance of silage maize is relevant, also because about 30% of the farms may not be able to grow silage maize in NL because of poor soil conditions (poor drainage, heavy clay, peat soils). The growth of silage maize on sandy soils is well possible, but under pressure because of the associated high risk for nitrate leaching.
The importance of concentrates is well-known by farmers, but its mean cost (~€0.28 kg−1) are much higher than that of fresh grass harvested through grazing (~€0.05 kg−1), silage grass (~€0.11 kg−1), and silage maize (~€0.07 kg−1) produced on the farm (note that land costs are not included here). Cost of purchased silage maize and grass are in the range of ~€0.15 kg−1, i.e., higher than the variable cost of farm-produced feed. Average feed cost ranges between €0.16 to €0.18 kg−1, i.e., about 50% of the total cost of milk production (Personal Communication Jaap Gielen, farm advisor). Evidently, a common strategy is to lower FE and to increase the yield of farm-produced feed. Increasing FE through increasing milk production per cow and lowering the number of young stock per cow is economically attractive as the mean revenues from milk sales contributed 85–90% to the total revenues of dairy farms in the Netherlands, sales of animals 4 to 8%, and EU income allowances and subsidies 5 to 9% (Agrimatie, 2021). Farms of FE group 1 had a mean FE of 0.93 FCPM (kg feedDM)−1; these farms were relatively small (0.5 Gg milk yr−1), and had on average a relatively low milk production per cow and ha, a high number of young stock per cow, and many grazing hours.
Variations in NUE and PUE
NUEherd and PUEherd were positively related to FE, indicating that increasing FE has also positive impacts on N and P use efficiencies by the herd. NUEfarm was also positively related to FE, but PUEfarm not. Mean NUEherd of the 6 FE groups (Table 1) were in the intermediate range of values suggested by Powell et al. (2010), but their model farms consisted of lactating dairy farms only. Our mean NUEfarm values (37-45%) were also at the lower half of the ranges (35–65%) suggested by Powell et al. (2010) and Powell and Rotz (2015) for dairy herds without young stock, but they were higher than the mean (25%) of grassland-based dairy farms in Ireland (Mihailescu et al., 2015a), which have more grass in the ration than farms in NL. Our estimates were more or less similar to the means (20–40%) found in a global review of grassland based-dairy farms (De Klein et al., 2017). Differences between farms in NUEfarm are in part related to the externalization of feed production and manure utilization by dairy farms with a relatively high (>15 Mg ha−1 yr−1) milk production per ha of farm land (De Klein et al., 2017; Quemada et al., 2020; Oenema and Oenema, 2021). This externalization of feed production and manure utilization by dairy farms occurs on farms with a high milk yield per ha of farm land (Supplementary Table S3). When the dairy farms were ordered in ascending order of milk production per ha of land; the amounts of N and P in purchased feed and in exported manure strongly increased with the intensity of production (Oenema and Oenema, 2021).
PUEherd was positively related to milk production per cow and negatively to the P content of the ration (Table 3). These results confirm the results of a meta-analysis of 44 feed trials: PUEherd (in g g−1) = 0.42 + 0.23 x FE – 0.11 x Pfeed (Klop et al., 2013). This equation explained 76% of the variance in PUEherd, which is less than the 90% explained by the 6 explanatory variables of the regression equation used in our study (Table 3). The range of PUEherd values found by Klop et al. (2013) is more or less similar to values (41–48%) derived when the P nutrient requirements of lactating dairy cattle (NRC, 2001) are followed, but are significantly higher than the ranges (32–40%) found in our study (Table 1). The difference in mean ranges between our study and those of Klop et al. (2013) is related to the fact that our estimates relate to the whole herd over a whole year. There is little data in literature on the variation in PUEherd of dairy farms in practice; a recent farm survey confirmed that most dairy farmers do not know the P content of the ration and PUEherd and PUEfarm (Harrison et al., 2021).
PUEfarm was strongly related to the P use efficiency of the soil-crop compartment and only marginally to PUEherd (Table 3). PUEfarm roughly ranged between 102 and 113%. Such high PUEFarm levels are unlike the situation in most other intensive dairy farms (Spears et al., 2003; Gourley et al., 2012; Mihailescu et al., 2015b). These high PUE values reflect a negative P surplus at farm level and soil P mining, due to P fertilization limits as function of soil P status. The externalization of the (in)efficiencies of feed production also contributed to a high PUE; assigning a P use efficiency coefficient to purchased feed strongly decreased overall mean farm PUE and strongly decreased the differences among FE groups in farm PUE (Table 2). A relative constancy of PUEfarm has also been reported for dairy farms in Virginia, USA (Pearce and Maguire, 2020).
Relationship between FE and NH3 and CH4 emissions
The dairy sector has decreased total NH3 emissions by more than 50% between 1990 and 2020 through a combination of low-protein feeding, increases in productivity and decreases in the number of animals, and low-emission manure storage and manure application to land (Van Bruggen et al., 2021). By 2030, the dairy sector is required to reduce total NH3 emissions by another 50% (Erisman, 2021). There is debate about the measures needed (Stokstad, 2019); about the contributions of low-emission housing systems, low-protein rations, improved low-emission manure application technology and buy-out of dairy farms (i.e., a decrease in the number of livestock). A recent study indicated that there are large differences between forerunners and laggers, and that bridging the gap between these two groups would greatly decrease N surpluses and increase farm income (Lamkowsky et al., 2021). Results of our study indicate that there were large differences among farms in NH3 emissions per kg milk produced. This suggest that there is room for lowering mean NH3 emissions through increasing FE and NUEherd, increasing grazing intensity and decreasing the number of young stock per cow (Table 3). These possible measures are less costly than low-emission housing systems and by-out of dairy farms, and therefore should be explored further. However, the suggested measures may not be feasible on all farms equally.
Following the 2015 Paris Climate Agreement, the Netherlands aims to decrease GHG emissions by at least 49% relative to 1990 (Coenen et al., 2017), and the dairy sector has to reduce CH4 emissions by at least 1.0 MT CO2-eq. Main suggested strategies include changing feed composition, adding feed supplements and improving farm management (McAllister and Newbold, 2008; Cameron et al., 2018; Van Gastelen et al., 2019). Our results support these general strategies; FE and the composition of the ration are the key factors for explaining variations in enteric CH4 emissions among dairy farms (Table 3). Emissions of CH4 from enteric fermentation decreased with an increase of FE (Figure 3, Table 1). Hence, enteric CH4 emissions contributed 45% to the total GHG emissions in group 1 and 38% in group 6; this indicates that GHG emissions associated with other sources (i.e., imported feed) considerably increased with an increasing FE (Table 1).
Conclusions
A unique database with empirical data and supported with model calculations from >12,000 grassland-based dairy farms over 4 years (2017-2020), collected through the KringloopWijzer model, allowed us to examine the relationships between feed efficiency (FE), N use efficiency (NUE), P use efficiency (PUE), and ammonia (NH3) and methane (CH4) emissions at herd and farm levels. Evidently, FE, NUE, PUE and NH3 and methane CH4 emissions were not measured, but calculated on the basis of detailed farm monitoring data and up-to-date models.
Detailed analysis of the 2020 data showed that there were large differences between farms. NUEherd, PUEherd, NUEfarm, PUEfarm, and NH3 and CH4 emissions per kg milk produced were all related to FE; the statistical analysis revealed that the performance indicators were explained by a set of 5 to 6 explanatory variables (Table 3). Surpluses of N and P were strongly influenced by agri-environmental regulations.
The mean FE at herd level was at the lower end of the values presented in literature, but the latter are mainly based on feed trials with lactating dairy cows only. Also, our study accounts for variations across a whole year. The variation in FE among farms (roughly 0.9–1.3 kg (kg FCPM)−1 was related to milk production and the number of young stock per cow, and to the share of silage maize, concentrates, and silage grass in the ration.
Interestingly, emissions of NH3 and CH4 decreased with an increase in FE when emissions were expressed per kg of milk produced. Our study indicates that there is potential for decreasing emissions of NH3 and CH4 from the dairy sector through increasing FE. However, recommendations for enhancing FE should be made at farm level, based on farm-specific data.
The externalization of the (in)efficiencies associated with purchased feed, export of manure, and to a lesser extent the raising of young stock contributed to the apparent increase in NUE and PUE at farm level with increasing FE. We partly corrected for these externalization effects, but note that there is currently no common protocol for accounting externalization effects. We recommend that such common protocol is made, because intensification of dairy production is a worldwide phenomenon, and farm NUE, PUE, N surplus and P surplus are increasingly seen as important performance indicators.
Intensive livestock production is debated because of its roles in resources use, N and P pollution of the environment, greenhouse gas emissions, and their impacts on landscape, birdlife and biodiversity. Our study contributes to this debate by presenting data and insights from intensive grassland-based dairy farms in The Netherlands that greatly differ in intensity and that are challenged by the government, dairy industry and society at large to improve production performance to be able to obtain and prolong a license to produce.
Publisher's note
All claims expressed in this article are solely those of the authors and do not necessarily represent those of their affiliated organizations, or those of the publisher, the editors and the reviewers. Any product that may be evaluated in this article, or claim that may be made by its manufacturer, is not guaranteed or endorsed by the publisher.
Statements
Data availability statement
The raw data supporting the conclusions of this article will be made available by the authors, without undue reservation.
Author contributions
JO and OO contributed to conception and design of the study. All authors contributed to manuscript revision, read, and approved the submitted version.
Acknowledgments
Many scientists have been involved in the development and testing of the KringloopWijzer model. We acknowledge Frans Aarts, Michel de Haan, Léon Šebek, Jaap Schröder, Koos Verloop, Gerjan Hilhorst, Wim van Dijk, and Johan de Boer. We are grateful to all dairy farmers and farm advisors who facilitated the proper use of the KringloopWijzer. We acknowledge ZuivelNL for providing the database.
Conflict of interest
The authors declare that the research was conducted in the absence of any commercial or financial relationships that could be construed as a potential conflict of interest.
Supplementary material
The Supplementary Material for this article can be found online at: https://www.frontiersin.org/articles/10.3389/fsufs.2022.846561/full#supplementary-material
References
1
Agrimatie (2021). Agro & food portal of Wageningen Economic Research. Available online at: https://www.agrimatie.nl/themaResultaat.aspx?subpubID=2232§orID=2245&themaID=2272&indicatorID=2079 (assesed December 15, 2021).
2
ArndtC.PowellJ. M.AguerreM. J.CrumpP. M.WattiauxM. A. (2015). Feed conversion efficiency in dairy cows: repeatability, variation in digestion and metabolism of energy and nitrogen, and ruminal methanogens. J. Dairy Sci.98, 3938–3950. 10.3168/jds.2014-8449
3
AtzoriA. S.ValsecchiC.MancaE.MasoeroF.CannasA.GalloA. (2021). Assessment of feed and economic efficiency of dairy farms based on multivariate aggregation of partial indicators measured on field. J. Dairy Sci.104, 12679–12692. 10.3168/jds.2020-19764
4
BachA.Terr,éM.VidalM. (2020). Symposium review: decomposing efficiency of milk production and maximizing profit. J. Dairy Sci.103, 5709–5725. 10.3168/jds.2019-17304
5
BeeverD. E.DoyleP. T. (2007). Feed conversion efficiency as a key determinant of dairy herd performance: a review. Aust. J. Exp. Agric.47, 645–657. 10.1071/EA06048
6
BosF. F. P.SmitA. L.SchröderJ. J. (2013). Is agricultural intensification in The Netherlands running up to its limits? NJAS - Wagening. J. Life Sci.66, 65–73. 10.1016/j.njas.2013.06.001
7
BritoA. F.OliveiraH. R.HoulahanK.et al. (2020). Genetic mechanisms underlying feed utilization and implementation of genomic selection for improved feed efficiency in dairy cattle. Can. J. Anim. Sci.100, 587–604. 10.1139/cjas-2019-0193
8
BritoA. F.SilvaL. H. P. (2020). Symposium review: Comparisons of feed and milk nitrogen efficiency and carbon emissions in organic versus conventional dairy production systems. J. Dairy Sci.103, 5726–5739. 10.3168/jds.2019-17232
9
CameronL.ChagundaM. G. G.RobertsD. J.LeeM. A. A. (2018). Comparison of milk yields and methane production from three contrasting high-yielding dairy cattle feeding regimes: Cut-and-carry, partial grazing and total mixed ration. Grass Forage Sci.73, 789–797. 10.1111/gfs.12353
10
ClayN.GarnettT.LorimerJ. (2020). Dairy intensification: Drivers, impacts and alternatives. Ambio.49, 35–48. 10.1007/s13280-019-01177-y
11
CoenenP. W. H. G.Van der MaasC. W. M.ZijlemaP. J.AretsE. J. M. M.BaasK.van den BergheA. C. W. M.et al. (2017). Greenhouse Gas Emissions in the Netherlands 1990-2015: National Inventory Report 2017. RIVMReport 2017—0033. Bilthoven: RIVM National Institute for Public Health and the Environment.
12
CoffeyE. L.HoranB.EvansR. D.BerryD. P. (2016). Milk production and fertility performance of Holstein, Friesian, and Jersey purebred cows and their respective crosses in seasonal-calving commercial farms. J. Dairy Sci.99, 5681–5689. 10.3168/jds.2015-10530
13
ConnorE. E. (2015). Invited review: Improving feed efficiency in dairy production: challenges and possibilities. Animal.9, 395–408. 10.1017/S1751731114002997
14
De HaasY.PryceJ. E.CalusM. P.WallE.BerryD. P.LøvendahlP.et al. (2015). Genomic prediction of dry matter intake in dairy cattle from an international data set consisting of research herds in Europe, North America, and Australasia. J. Dairy Sci.98, 6522–6534. 10.3168/jds.2014-9257
15
De KleinC. A.MonaghanR. M.AlfaroM.GourleyC. J.OenemaO.PowellJ. M. (2017). Nitrogen performance indicators for dairy production systems. Soil Res.55, 479–488. 10.1071/SR16349
16
De LlataM. L.DritzS. S.LangemeierM. R.et al. (2001). Economics of increasing lysine:calorie ratio and adding dietary far for growing-finishing pigs reared in a commercial environment. J. Swine Health Prod.9, 215–223.
17
De OndarzaM. B.TricaricoJ. (2017). REVIEW: Advantages and limitations of dairy efficiency measures and the effects of nutrition and feeding management interventions. Prof. Anim. Sci.33, 393–400. 10.15232/pas.2017-01624
18
De VriesM.Van DijkW.De BoerJ.De HaanM. H. A.Oenema.JVerloop.JLagerwerfL. A. (2020). Calculation Rules of the Annual Nutrient Cycling Assessment (ANCA), Background Information About Farm-Specific Excretion Parameters (update of ANCA report 2018). Wageningen: Wageningen University. 10.18174/533905
19
ErismanJ. L. (2021). Setting ambitious goals for agriculture to meet environmental targets. One Earth. 4. 10.1016/j.oneear.2020.12.007
20
FranzluebbersA.HuntD.TelfordG.BittmanS.KetteringsQ. M. (2021). Integrated crop-livestock systems: lessons from New York, British Columbia, and the south-eastern United States. Front. Agric. Sci. Eng.8, 81–96. 10.15302/J-FASE-2020365
21
GerberP. J.VellingaT. V.OpioC.SteinfeldH. (2011). Productivity gains and greenhouse gas emissions intensity in dairy systems. Livest Sci.139, 100–108. 10.1016/j.livsci.2011.03.012
22
GourleyC. J. P.DoughertyW. J.WeaverD. M.AaronsS. H.AwtyI. M.GibsonD. M.et al. (2012). Farm-scale nitrogen, phosphorus, potassium and sulphur balances and use efficiencies on Australian dairy farms. Anim. Prod. Sci.52, 929–944. 10.1071/AN11337
23
HarrisonB.DorigoM.ReynoldsC.SinclairL.RayP. (2021). Phosphorus feeding practices, barriers to and motivators for minimising phosphorus feeding to dairy cows in diverse dairy farming systems. Animal. 15. 10.1016/j.animal.2021.100248
24
HopkinsA.WilkinsR. (2006). Temperate grassland: key developments in the last century and future perspectives. J. Agric. Sci.144, 503–523. 10.1017/S0021859606006496
25
Huguenin-ElieO.StuderB.KöllikerR.ReheulD.ProboM.BarreP.et al. (2019). “Improving sown grasslands through breeding and management,” in Proceedings of the Joint 20th Symposium of the European Grassland Federation and the 33rd Meeting of the EUCARPIA Section ‘Fodder Crops and Amenity Grasses’. Zürich, Switzerland.
26
KlopG.EllisJ. L.BanninkA.KebreabE.FranceJ.DijkstraJ. (2013). Meta-analysis of factors that affect the utilization efficiency of phosphorus in lactating dairy cows. J. Dairy Sci.96, 3936–3949. 10.3168/jds.2012-6336
27
KorverS. (1988). Genetic aspects of feed intake and feed efficiency in dairy cattle: A review. Livest. Prod. Sci.20, 1–13. 10.1016/0301-6226(88)90049-8
28
LamkowskyM.OenemaO.MeuwissenM. P. M.AngF. (2021). Closing productivity gaps among Dutch dairy farms can boost profit and reduce nitrogen pollution. Environ. Res. Lett.16, 124003. 10.1088/1748-9326/ac3286
29
LøvendahlP.DiffordG. F.LiB.ChagundaM. G. G.HuhtanenP.LidauerM. H.et al. (2018). Selecting for improved feed efficiency and reduced methane emissions in dairy cattle. Animal.12, s336–s349. 10.1017/S1751731118002276
30
McAllisterT. A.NewboldC. J. (2008). Redirecting rumen fermentation to reduce methanogenesis. Aust. J. Exp. Agric.48, 7–13. 10.1071/EA07218
31
MeyerJ. H.GarrettW. N. (1967). Efficiency of feed utilization. J. Anim. Sci.26, 638–646. 10.2527/jas1967.263638x
32
MihailescuE.MurphyP. N. C.RyanW.CaseyI. A.HumphreysJ. (2015b). Phosphorus balance and use efficiency on 21 intensive grass-based dairy farms in the South of Ireland. J. Agric. Sci.153, 520-537. 10.1017/S0021859614000641
33
MihailescuE.RyanW.MurphyP. N. C.CaseyI. A.HumphreysJ. (2015a). Economic impacts of nitrogen and phosphorus use efficiency on nineteen intensive grass-based dairy farms in the South of Ireland. Agric. Syst.132, 121–132. 10.1016/j.agsy.2014.09.008
34
NRC (2001). Nutrient Requirements of Dairy Cattle, 7th edn. Washington, DC: National Research Council, National Academy Press.
35
OECD-FAO (2018). OECDFAO Agricultural Outlook 2018-2027. Chapter 7: Dairy and dairy products. http://dx.doi.org/10.1787/agr_outlook-2018-en (accesed December 15, 2021)
36
OenemaJ.OenemaO. (2021). Intensification of grassland-based dairy production and its impacts on land, nitrogen and phosphorus use efficiencies. Front. Agr. Sci. Eng.8, 130–147. 10.15302/J-FASE-2020376
37
OnrustJ.WymengaE.PiersmaT.OlffH. (2019). Earthworm activity and availability for meadow birds is restricted in intensively managed grasslands. J. Appl. Ecol.56, 1333–1342. 10.1111/1365-2664.13356
38
OttR. L.LongneckerM. (2010). An introduction to statistical methods and data analysis. 6th ed.Florence, Italy: Cengage.
39
PearceA.MaguireR. (2020). The state of phosphorus balance on 58 Virginia dairy farms. J. Environ. Qual.49, 324–334. 10.1002/jeq2.20054
40
PowellJ. M.GourleyC. J. P.RotzC. A.WeaverD. M. (2010). Nitrogen use efficiency: a potential performance indicator and policy tool for dairy farms. Environ Sci Policy13, 217–228. 10.1016/j.envsci.2010.03.007
41
PowellJ. M.RotzC. A. (2015). Measures of nitrogen use efficiency and nitrogen loss from dairy production systems. J. Environ. Qual.44, 336–344. 10.2134/jeq2014.07.0299
42
QuemadaM.LassalettaL.JensenL. S.GodinotO.BrentrupF.BuckleyC.et al. (2020). Exploring nitrogen indicators of farm performance among farm types across several European case studies. Agric. Syst.177, 102689. 10.1016/j.agsy.2019.102689
43
SchröderJ. J.NeetesonJ. J. (2008). Nutrient management regulations in The Netherlands. Geoderma.144, 418–425. 10.1016/j.geoderma.2007.12.012
44
SovaA. D.Le BlancS. J.McBrideB. W.De VriesT. J. (2014). Accuracy and precision of total mixed rations fed on commercial dairy farms. J. Dairy Sci. 97 (1), 562-571. 10.3168/jds.2013-6951
45
SpearsR. A.YoungA. J.KohnR. A. (2003). Whole-farm phosphorus balance on western dairy farms. J. Dairy Sci.86, 688-695. 10.3168/jds.S0022-0302(03)73648-0
46
StokstadE. (2019). Nitrogen crisis threatens Dutch environment—and economy. Science.366, 1180–1181. 10.1126/science.366.6470.1180
47
TanisM. F.MarshallL.BiesmeijerJ. C.van KolfschotenL. (2020). Grassland management for meadow birds in the Netherlands is unfavourable to pollinators. Basic Appl. Ecol.43, 52–63. 10.1016/j.baae.2019.12.002
48
TaubeF.VogelerI.Klu,ßC.HerrmannA.HaslerM.RathJ.et al. (2020). Yield progress in forage maize in NW Europe—breeding progress or climate change effects?Front. Plant Sci.11, 1214. 10.3389/fpls.2020.01214
49
TedeschiL. O.AlmeidaA. K.AtzoriA. S.MuirJ. P.FonsecaM. A.CannasA. (2017). A glimpse of the future in animal nutrition science. 1. Past and future challenges. Rev. Bras. de Zootec.46, 438–451. 10.1590/s1806-92902017000500011
50
UwizeyeA.de BoerI. J. M.OpioC. I.SchulteR. P. O.FalcucciA.TempioG.et al. (2020). Nitrogen emissions along global livestock supply chains. Nature Food.1, 437–446. 10.1038/s43016-020-0113-y
51
Van BruggenC.BanninkA.GroenesteinC. M.HuijsmansJ. F. M.LagerwerfL. A.LuesinkH. H.et al. (2021). Atmospheric Emissions from Agricultural Activities Calculated with NEMA for 1990–2019, Statutory Research Tasks Unit for Nature and the Environment, WOt-Technical Report 203. Wageningen University & Research.
52
Van den Pol-van DasselaarA.VellingaT. A.JohansenA.KennedyE. (2008). To graze or not to graze, that's the question. Grassland Sci. Europe.13, 706–716
53
Van GastelenS.DijkstraJ.BanninkA. (2019). Are dietary strategies to mitigate enteric methane emission equally effective across dairy cattle, beef cattle, and sheep?J. Dairy Sci.102, 6109–6130. 10.3168/jds.2018-15785
54
Van ZantenH. H. E.HerreroM.Van HalO.RöösE.MüllerA.GarnettT.et al. (2018). Defining a land boundary for sustainable livestock consumption. Glob. Chang. Biol.24, 4185–4194. 10.1111/gcb.14321
55
VSN International (2019). Genstat for Windows 19th Edition. Hemel Hempstead, UK: VSN International. Available online at: Genstat.co.uk
56
WesthoekH.LesschenJ. P.RoodT.WagnerS.De MarcoA.Murphy-BrokernD.et al. (2014). Food choices, health and environment: effects of cutting Europe's meat and dairy intake. Glob Environ Change.26, 196–205. 10.1016/j.gloenvcha.2014.02.004
57
WilkinsonJ. M.RinneM. (2018). Highlights of progress in silage conservation and future perspectives. Grass Forage Sci.73, 40-52. 10.1111/gfs.12327
58
ZuivelNl (2019). Dutch dairy in figures 2019. Available online at: https://www.zuivelnl.org/uploads/images/Marktinformatie-en-Export/20200209-ZuivelNL-Zuivel-in-Cijfers-ENG_lowres_spreads.pdf
Summary
Keywords
ammonia, externalization, feed efficiency, forage, manure, milk yield, production intensity, nitrogen and phosphorus surpluses
Citation
Oenema J and Oenema O (2022) Unraveling feed and nutrient use efficiencies in grassland-based dairy farms. Front. Sustain. Food Syst. 6:846561. doi: 10.3389/fsufs.2022.846561
Received
31 December 2021
Accepted
30 August 2022
Published
29 September 2022
Volume
6 - 2022
Edited by
Tom Misselbrook, Rothamsted Research, United Kingdom
Reviewed by
Julio Cesar Pascale Palhares, Brazilian Agricultural Research Corporation (EMBRAPA), Brazil; Laurence Shalloo, Moorepark Animal and Grassland Research Centre-Teagasc, Ireland
Updates
Copyright
© 2022 Oenema and Oenema.
This is an open-access article distributed under the terms of the Creative Commons Attribution License (CC BY). The use, distribution or reproduction in other forums is permitted, provided the original author(s) and the copyright owner(s) are credited and that the original publication in this journal is cited, in accordance with accepted academic practice. No use, distribution or reproduction is permitted which does not comply with these terms.
*Correspondence: Jouke Oenema jouke.oenema@wur.nl
This article was submitted to Waste Management in Agroecosystems, a section of the journal Frontiers in Sustainable Food Systems
Disclaimer
All claims expressed in this article are solely those of the authors and do not necessarily represent those of their affiliated organizations, or those of the publisher, the editors and the reviewers. Any product that may be evaluated in this article or claim that may be made by its manufacturer is not guaranteed or endorsed by the publisher.