Abstract
In West Africa, rampant urbanization is changing food systems, including the magnitude and composition of food flows and the length of supply chains. An increasing body of literature discusses pathways to sustainable transformation of urban food systems taking into account links between urban and rural spaces. Research and policy have focused on the role of cities as consumption centers receiving food from local, regional, and global hinterlands. This study aims at widening the perspective on the role of cities in food distribution, by bringing into focus a city's function as a consumption, aggregation, and disaggregation center. The analysis is based on a comprehensive set of primary data on food flows collected in four West African cities across different seasons. The analysis shows that the investigated cities are integrated into multi-scale urban and market networks. Their position within these networks interacts with their reliance on other territories for food supply and with their functions, such as the aggregation of goods. The capital cities of Ouagadougou (Burkina Faso) and Bamako (Mali) relied more on lower-rank urban settlements further away, while Tamale, a secondary city in Ghana, acted as an assembly market for local rural producers and in turn supplied larger urban centers. Bamenda, a secondary city in Cameroon, acted as a consumption center sourcing mainly from its hinterland. Beyond that, city functions were context-specific and varied according to type of product and season. Extending the perspective on the role of cities has implications for policy, including bringing into focus and strengthening midstream segments, such as market and transport links.
Introduction
In recent years, food system approaches have increasingly dealt with urban areas. Increasing urban demand for more and more diverse food and the role of cities in processing and trading food products are just a few of many interlinkages between food and urban systems (Seto and Ramankutty, 2016). In West Africa, strong population growth, rapid urbanization, rising incomes, and changing diets are the main drivers of the transformation of food systems. Urbanization and income growth govern demand in particular for convenient, processed, prepared food, as well as for fresh and perishable food such as fruits, vegetables, meat, and fish (Zhou and Staatz, 2016; Tschirley, 2020). In West Africa, urban households purchase up to 90% of their food at food markets (Allen and Heinrigs, 2016; Bricas et al., 2016), which are dominated by traditional channels, such as open-air markets (Elbehri et al., 2013; Moustier et al., 2021). As cities expand and new urban agglomerations emerge, urban marketing networks gain increasing influence in rural areas (Allen and Heinrigs, 2016; Tschirley, 2020), which goes along with growing rural–urban trade volumes, the increasing reliance of rural households on purchased food, and new actors along the supply chain (Reardon et al., 2019). As a result, supply chains elongate and the average distance between food consumption and production increases (Reardon et al., 2019).
Discussions in international policy fora and academia have addressed the links between rural and urban spaces in food systems. A growing body of literature, including work on urban and peri-urban agriculture (UPA, Drechsel and Keraita, 2014) and City-Region Food Systems (CRFS, Blay-Palmer et al., 2018), highlights the role of local and regional food sources for more sustainable and resilient food systems. On the other hand, urban food supply chains can cross borders. In the framework of regional integration in West Africa, a region with different agroecological conditions, intra-regional trade among members of the Economic Community of West African States (ECOWAS) is promoted and expected to foster food security and economic development. Thus, debates around (urban) food systems are often divided along the different spatial scales of food provisioning.
The “foodshed” concept1 is increasingly being used as a basis to empirically assess the links between cities and their sources of food; however, there is no coherent methodological framework for comparative analyses and it is often constrained by limited data (Schreiber et al., 2021). Studies aiming at assessing food flows differ substantially in terms of spatial scale, coverage, and data availability. Where secondary data were not readily available, a common situation in low-income countries, most food flow studies, with the exception of Drechsel et al. (2007), relied on tracing food back to its source based on market surveys (Moustier et al., 2004; Gunasekera, 2012; Brisson et al., 2019), or ethnographic methods (Wegerif and Wiskerke, 2017). Thus, the city is seen as the focal point draining resources from local and global hinterlands, a view, which neglects its multiple roles in food systems other than for consumption. As part of food system transformations, the midstream segments—connecting producers to consumers—expand rapidly, such as wholesale and retail distribution systems, warehousing, cold storage, food preservation, processing, and packaging (Reardon, 2015). According to Allen and Heinrigs (2016), the non-agricultural food economy accounts for 40% of the value addition of the overall food economy in West Africa. Despite the increasing economic importance of the middle segments of agri-food supply chains, the focus in research and policy debates has been on food security and nutrition on the one hand, and agricultural production on the other. The large number of micro-, small-, and medium-enterprises that operate in the middle segments are called the “missing” or “hidden” middle due to the lack of data and information about them (Reardon, 2015; Veldhuizen et al., 2020).
Our study aimed at widening the perspective on the role of cities in food distribution beyond that of urban consumption, by considering both external sources of food supplying the city and the city as a source of food to locations elsewhere. The wider perspective acknowledges the city's multi-functional roles as consumption, aggregation and disaggregation centers and adopts the notion of cities as “nodes” in a food distribution network. The study also extends the current body of literature by considering context-specific complementarities in urban food supply that may arise from different spatial scales for food provisioning, which can vary according to season, product, and city.
Our study relied on a large empirical set of data on urban food flows across different spatial scales and seasons from four cities in the West African countries of Ghana, Burkina Faso, Mali, and Cameroon, where data scarcity has been an ongoing challenge. We analyzed more than 100,000 entries of food in- and outflows of different magnitudes and at different spatial scales, comprising city–hinterland to international flows. The objectives of our study were to (i) assess urban food flows, i.e. food flow composition, quantity, and origin, for different cities and seasons and to (ii) examine the multi-functional roles of these cities in food distribution networks. We compared cities' food flows and their roles in food distribution networks in terms of their differences in city size, accessibility, and farming system zones. Our analysis also aimed at providing insights into the diversity and complexity of today's West African food systems and at contributing to the debate on (urban) food provisioning from local to global scales.
Study Sites
Our study was conducted across four rapidly growing West African cities with different sizes and located in different farming system zones: Tamale in Ghana, Bamenda in Cameroon, Bamako in Mali, and Ouagadougou in Burkina Faso (Figure 1). Ouagadougou and Bamako are national capitals, each having more than 2 million inhabitants, whereas Bamenda and Tamale are medium-sized regional capitals with populations of more than 300,000 as of 2015. Between 1970 and 2010, both Bamako and Ouagadougou had an annual urban growth rate of about 6% while Tamale experienced an annual growth of 3% (OECD/SWAC, 2020). In Bamenda, annual urban growth rates averaged 6% between 1970 and 2010, but decreased to 3.8% between 2000 and 2010 (OECD/SWAC, 2020). Apart from Bamenda in Cameroon, the cities are part of the “Economic Community of West African States” (ECOWAS) and located on major trade corridors connecting the Sahelian landlocked countries with each other and with coastal countries (Torres and van Seters, 2016).
Figure 1
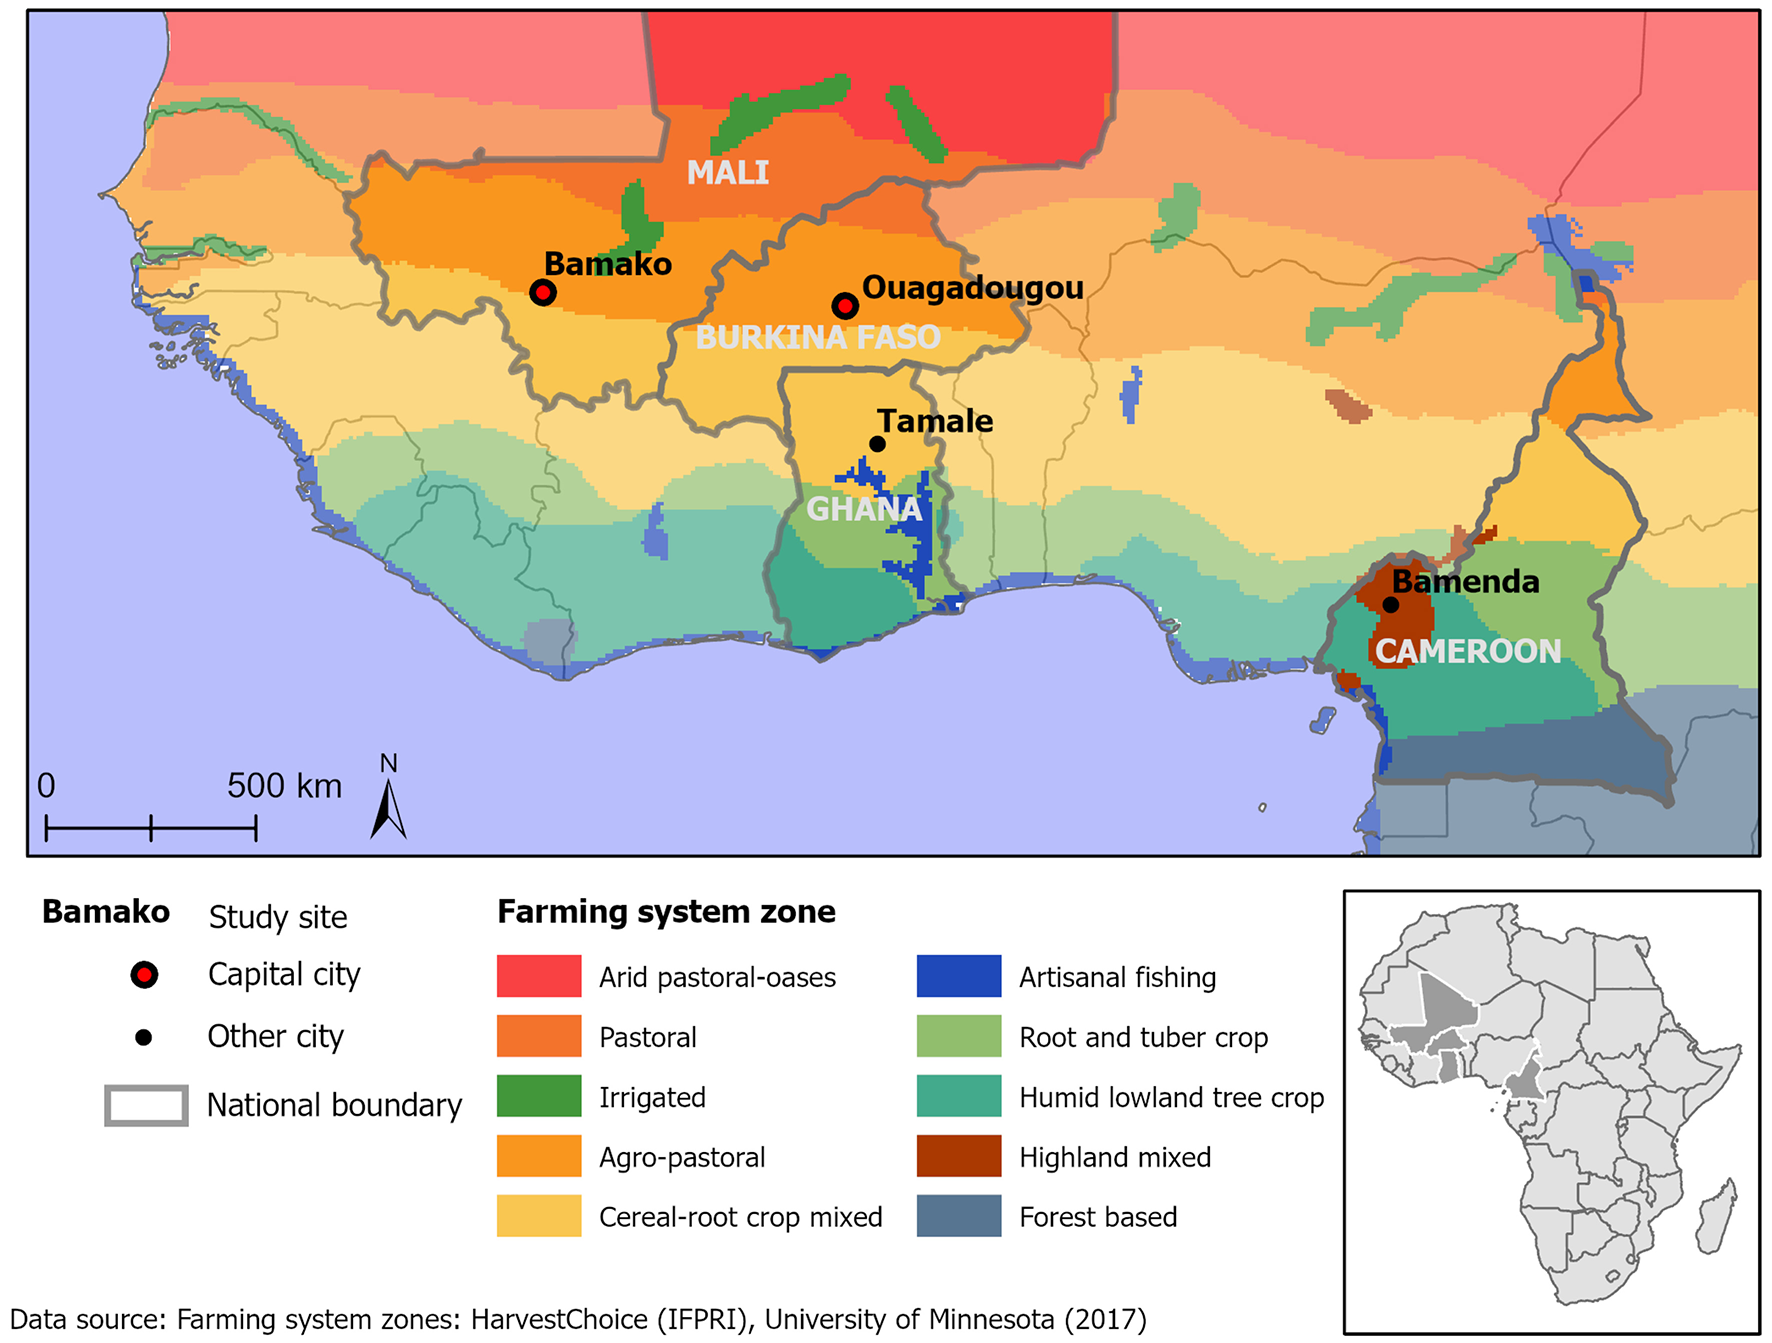
Location of the study sites and agro-ecological farming zones (Data source: HarvestChoice (IFPRI), University of Minnesota, 2017).
Food supply in these cities is affected by biophysical conditions, including climate and soil, and economic and cultural factors shaping consumption preferences, contemporary and historical trade regimes, and agricultural specialization.
The climate and vegetation of West Africa are characterized by a strong north–south gradient over relatively short distances from the hyper-arid Saharan desert in the north through the Sahel to the humid tropics in the south and fairly uniform east–west conditions. The rainfall gradient ranges between <400 mm annually in the Sahel and almost 3,000 mm in the southern part of the coastal countries (Blein et al., 2008; Nicholson, 2018). Accordingly, farming system zones show a distinct north–south gradient and range from humid lowland tree crops in southern Ghana and central Cameroon to agro-pastoral and pastoral farming systems (Figure 1; Garrity et al., 2012). The Sahel, stretching over the agro-pastoral and pastoral zone, is particularly exposed to high inter-annual rainfall variability (Nicholson, 2018), affecting the rural population that depends on rainfed agriculture and livestock rearing.
Bamenda is located in the Western Highlands of Cameroon at an altitude of 1,600 m above sea level, and is as such a part of the highland mixed farming zone. Due to its cooler and humid climate and volcanic soils (Feldt et al., 2020), Bamenda has higher agricultural potential than the other cities. Tamale is located in the cereal–root crop mixed farming system, which relies on the production of sorghum (Sorghum bicolor Moench.), maize (Zea mays L.), pearl millet (Pennisetum glaucum L.), cassava (Manihot esculenta Crantz.), yam (Dioscorea spp.), legumes and cattle, and is claimed to have one of the highest agricultural growth potentials in Africa (Garrity et al., 2012). Ouagadougou and Bamako are located on the cereal–root crop transition to the agro-pastoral farming system. Livelihoods in the agro-pastoral farming system depend largely on sorghum, some maize, pearl millet, pulses, sesame (Sesamum indicum L.), cattle, sheep, goats, and poultry. Burkina Faso and Mali in particular have a history of irrigation zones focused on rice and vegetable production, such as the “Office du Niger” in Mali, with 100,000 ha of irrigated area (de Steenhuijsen Piters et al., 2021).
Materials and Methods
The aim of this study was to capture all food entering and exiting the cities by different transport types and channels. The collected data provide comprehensive information on the variety of products, their quantities, and their origin, and how these attributes vary across the cities and seasons. The data also give insights into supply chains, based on incoming and outgoing transport types, quantities, and travel distances, and the role of cities in shaping food flows at different spatial scales.
Data
The paper relies on a comprehensive dataset from a series of surveys on food flows from the four West African cities Tamale (Ghana), Bamenda (Cameroon), Ouagadougou (Burkina Faso), and Bamako (Mali). In the four cities, transport by road is the major channel for food transport, and the only channel in Bamenda and Tamale. In the capital cities Ouagadougou and Bamako, additional transport channels are available, but at small scale or only for few selected products, such as the railway connecting Ouagadougou with Abidjan, Côte d'Ivoire that mainly transports imported goods from the port, and the waterway on the river Niger, connecting Bamako seasonally with locations in Guinea upstream and the country's northern downstream (Supplementary Materials).
Data were collected between 2013 and 2017 in different seasons and with a focus on road surveys (Figure 2). We covered three seasons in Bamako, Ouagadougou, and Tamale, and two seasons in Bamenda. In Tamale, we captured peak and hot season data in two consecutive years. Each survey took place for 6–8 days on all access roads to the city. The number of days was based on the length of local market cycles, which historically differs in the cities and ranges from 3- to 8-day cycles (Smith, 1971). The number of access roads varied by city and ranged from 5 in Tamale (4 major and 1 minor road) to 10 in Bamako (5 major and 5 minor roads). Data collection took place 24 h/day on major roads, and 12 h on minor roads. Data were recorded at existing check points operated by security forces (Tamale, Bamenda, Figure 3), or other governmental agents, including phytosanitary services (Bamako), as well as at toll gates (Ouagadougou).
Figure 2
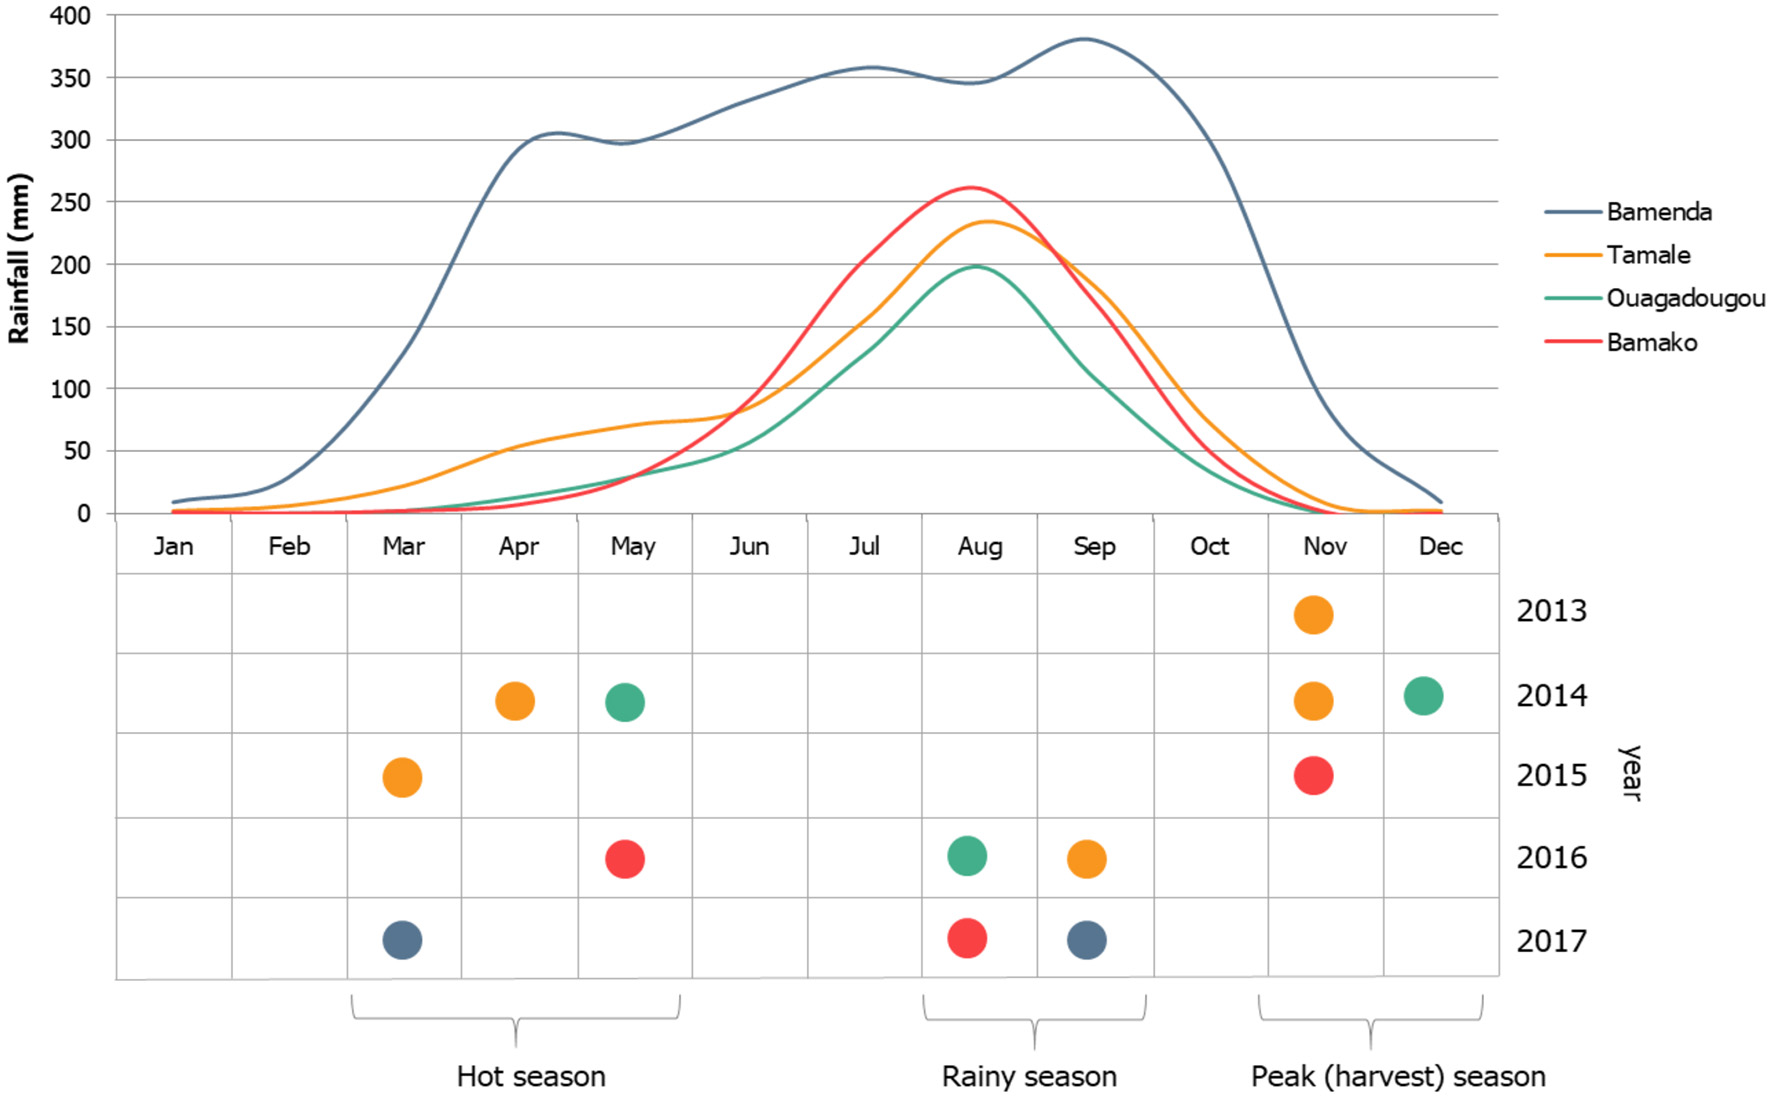
Monthly rainfall (in mm) and timing of the food flow surveys in the West African cities Bamako, Ouagadougou, Bamenda, and Tamale (source: Rainfall data from Climate-Data, 2021).
Figure 3
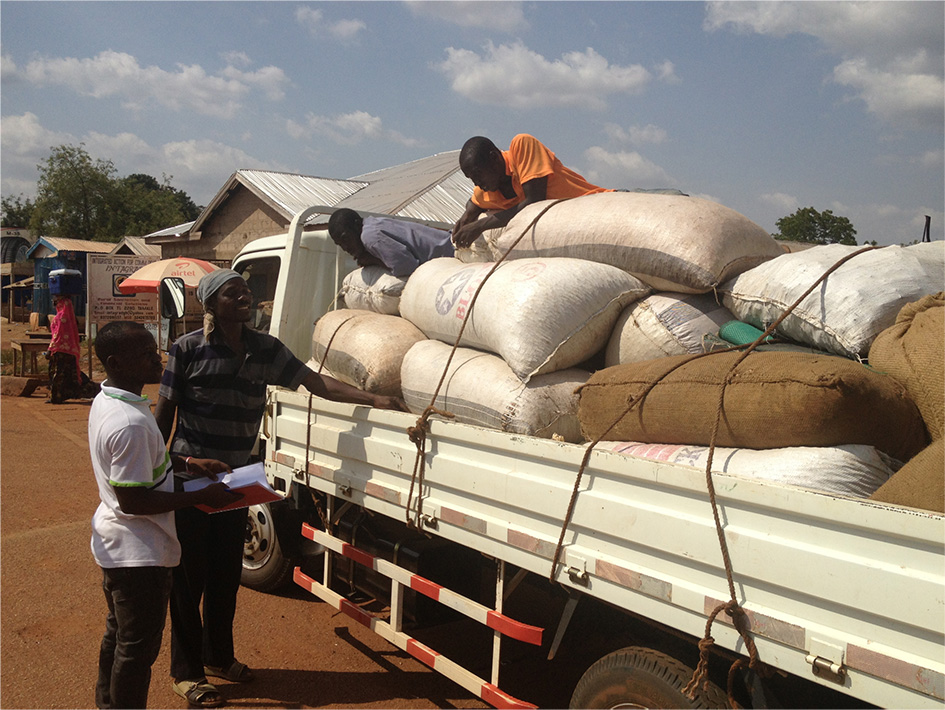
Recording of data at a checkpoint in Tamale, Ghana, in 2013.
This required authorizations from different agencies and building trust with the staff on the ground, which was crucial to support our work, for instance to stop vehicles. Enumerators underwent thorough training and supervision. One enumerator on each side of the road listed food movements, including information such as (1) type of product, (2) quantity and unit, (3) geographical source, and (4) destination of flows. Furthermore, metadata, such as number plate, date and time were noted. When vehicles did not stop, and enumerators were not able to talk to the driver or the driver's assistant, the transported quantity was estimated wherever the type of product could be identified. In an average of 8% (Bamenda), 12% (Tamale), 38% (Ouagadougou), and 42% (Bamako) of the cases, source and destination locations could not be determined (Table 1). The original list of commodities included unprocessed food products, livestock, firewood and charcoal, animal feed and slightly processed products, such as flour. For this study we used a subset of products (section Analysis).
Table 1
| City | Year | Season | Total (counts) | Missing values (in % of total) | |||
|---|---|---|---|---|---|---|---|
| Quantity | Unit | Source | Destination | ||||
| Tamale | 2013 | Peak | 7,228 | 1 | 1 | 13 | 13 |
| 2014 | Hot | 6,369 | 2 | 1 | 7 | 8 | |
| 2014 | Peak | 7,305 | 2 | 2 | 10 | 9 | |
| 2015 | Hot | 6,639 | 0 | 0 | 15 | 13 | |
| 2016 | Rainy | 4,057 | 1 | 1 | 17 | 15 | |
| Ouagadougou | 2014 | Peak | 6,771 | 0 | 0 | 29 | 28 |
| 2014 | Hot | 6,022 | 0 | 0 | 40 | 40 | |
| 2016 | Rainy | 10,336 | 0 | 0 | 47 | 47 | |
| Bamako | 2015 | Peak | 7,609 | 0 | 0 | 30 | 30 |
| 2016 | Hot | 12,378 | 0 | 1 | 40 | 40 | |
| 2017 | Rainy | 16,831 | 0 | 0 | 57 | 57 | |
| Bamenda | 2017 | Hot | 9,511 | 0 | 1 | 4 | 4 |
| 2017 | Rainy | 12,893 | 0 | 3 | 11 | 11 | |
| Total | 113,949 | ||||||
Number of entries per survey in four West African cities used for this analysis and missing values in percent.
The subset of entries only contains selected commodities and no duplicates. The number of days per survey varied and the number of entries does not correspond to the number of trips as entries are commodity-specific and one vehicle can transport several commodities.
The data we present in this paper are mostly quantitative, summarizing flow data collected during the surveys. However, we also collected qualitative data to supplement the quantitative data collection. These included visits to various markets within and outside the cities, visits to primary production areas, and interviews with traders, transporters, farmers, and municipal authorities (assembly people, market inspectors). For instance, according to informants in the transport sector, overloading in Ghana is common and not reflected in official papers, for example in waybills required for cross-border trade (Supplementary Materials). These types of qualitative information were necessary to understand the situation on the ground as accurately as possible. However, uncertainties remain (section Limitations).
Each city has particular conditions for food distribution, which resulted in adjustments in data collection. For instance, in Bamenda, in- and outflows were also recorded at bus stations, because food was commonly transported on intercity buses, in small unit quantities, and by different passengers. Capturing these diverse products on the road would have been impossible; therefore, we recorded these products during loading and offloading at the city's bus stations. A similar adjustment was made in Tamale, where food from nearby rural market places, traded by a number of different traders was captured at these markets. In Tamale, we also recorded flows at the main wholesale market in the city center to compensate for one road without a check point. Duplicates were removed before analysis.
Processing and Preparation
Data were entered and processed in a PostgreSQL database with a PostGIS extension. This allowed geocoding of locations (origin and destination of flows), for which only names were captured during data collection. Cleaning included removing duplicates and standardizing terms, such as for units, products, and metadata. Food was transported in a variety of units, including baskets, sacks, and vehicles, which all required calibration, that is the assignment of specific volumes, which was done through in situ volume measurements. Product densities were also determined through in situ measurements, or through secondary sources yielding final weights. Thereby, we distinguished between different processing levels, e.g., dry and fresh fish, which, after quantification, were merged.
Tables containing calibration lists (SupplementaryMaterials), metadata, spatial characteristics of source and destination locations, and secondary data were joined with the primary data, and daily quantities per data row calculated. Source and destination locations were classified as rural or urban using a combination of distance to and size of the next urban settlement derived from the Africapolis database (OECD/SWAC, 2020). For instance, a location within 3 km to a small town's center with 10,000–30,000 inhabitants was classified urban, and rural beyond the 3 km radius. The distance threshold increased with city size and represented 10 km for medium-sized urban settlements with 100,000–300,000 inhabitants and 25 km for urban centers with more than 3,000,000 inhabitants (Supplementary Materials).
Locations were also classified according to the spatial scale relative to the focal city. These spatial units included:
Local hinterland (within 50 km to the city center),
Other locations within national boundaries,
Intra-regional, including other ECOWAS member countries, and
International locations excluding ECOWAS countries.
We are aware of the simplistic hinterland boundary set here, which is based on linear distance, and is supposed to demonstrate general trends to compare the cities. Future research may wish to explore options of using travel times to delineate the hinterland or define city-specific solutions.
Our study captured the immediate upstream and downstream supply chain segments, but not the entire supply chain. Therefore, additional processing was necessary where the source of products referred to potential hubs, such as ports or other coastal countries (without further specification). These sources can point to international sources, when imported from the global market, or intra-regional sources, when produced within the region. These flows primarily concerned wheat (flour, Triticum aestivum L.), rice (Oryza sativa L.), potato (Solanum tuberosum L.), onion (Allium cepa L.), and fish. In order to assign shares of international and intra-regional sources to flow quantities, we relied on FAOSTAT (2014) food balance sheets on imported and production quantity (Supplementary Materials).
Analysis
For analysis we used a subset of data with common products, which covered all food groups, except for leafy vegetables, and apart from non-processed food items, also included slightly processed food, such as flour and dried products (Supplementary Appendix 1). We only captured goods crossing the urban boundaries, and could not account for goods produced and consumed within the urban boundary. Therefore, we omitted leafy vegetables, such as amaranth (Amaranthus L.) and lettuce (Latuca sativa L.), which are produced almost exclusively in urban and peri-urban agriculture at the study sites and dominate urban crop production (Karg et al., 2016; Bellwood-Howard et al., 2021). Throughout the paper, we used fresh weight (kilograms, grams) for the quantification of food flows; for per capita values, we relied on the Africapolis database for urban population size (OECD/SWAC, 2020). In order to put fresh weight, emphasizing products with high water content, into perspective, and in order to obtain an indication of data coverage, flows were also converted into kilocalories (kcal), as a proxy for dietary energy supply. Thereby, the equivalents in kcal were computed considering the edible portion of food products using FAO nutritional tables (Stadlmayr, 2012). For livestock excluding poultry, the ratio of carcass weight to live weight, averaged over country-specific values, was used as proxy for the edible portion (FAO, 2022). Estimates of daily caloric inflows do not represent intake as they do not account for outflows, food losses, and food waste.
For the analysis, we considered three types of flows:
(1) Inflows, i.e. flows with the focal city as the destination and from an outside source,
(2) Outflows, i.e. flows with the focal city as the source and to a destination outside, and
(3) Transit flows, i.e. flows with a source and destination located outside the focal city. Transits flows were divided by two as they were recorded when both entering and exiting.
The classification of flows into these categories was only possible for entries with information on source and destination locations. Given the missing location information (Table 1), overall quantities would be underestimated. Therefore, we determined the quantity per city, product and season without location information, and added its share to individual flows (not for the maps in section City Functions in Selected Food Supply Chains).
Where season is not specifically mentioned in this paper, mean values across all seasons were computed. For percentages, for example with respect to the share provided by different spatial units, we first computed the seasonal percentages, and then calculated their mean. In the case of Tamale, where we covered two peak and hot seasons, respectively, the seasonal mean values were computed first (Supplementary Materials). For section City Functions in Food Distribution, the mean unit quantity, i.e., the mean quantity transported per product and vehicle, and the weighted mean distance were computed for incoming and outgoing flows, respectively. Secondary data on rail and air freight were included in the analysis of incoming and outgoing quantities but omitted for computing the average unit quantity (rail and air), and distance (air).
Limitations
Limitations of the study refer to the study design and the complexity of the food provisioning system. Inherent to the study design is that inner-urban food production and distribution, both market-oriented and subsistence, are not captured because our check points were located outside the urban area. Another shortcoming relating to the study design is the limited survey period, so the balance between incoming and outgoing flows does not equate with food remaining in the city. For instance, outgoing quantities of maize from inner-urban warehouses, left unregistered, exceeded the incoming quantities. Related to this is the data gap in Tamale, where one road without a checkpoint was not covered. To compensate for this, flows were recorded at the main wholesale market in the city center, however, vehicles traveling along this road and targeting warehouses in the city were missed.
One should also be aware that the limited survey period only represents a limited part of a season and that substantial fluctuation may be unaccounted for. Supplementary Appendix 2 shows the variations in inflow quantity and the origin of vegetables in the same season across years for Tamale. While we aimed at a 100% coverage of flows entering and exiting the cities, this was not possible. For instance, livestock herded into cities and thereby bypassing the main roads was not captured. Therefore, the quantities presented in this article should be considered conservative.
We did not capture processed food, such as canned tomato paste or vegetable oil, which is often imported from international sources and potentially has an impact on domestic food systems. As already mentioned, our study only captured the immediate upstream and downstream supply chain segments, and not the entire supply chain from farm to fork, and also not the resulting flows of food waste (Drechsel and Karg, 2018).
Political instability in some cities resulted in adjustments in data collection. For instance, in October 2014, due to the revolution in Ouagadougou, the peak season survey had to be postponed to December. In Bamenda, the emerging political crisis did not allow for a third survey in the peak season, and the introduction of “ghost town” activities, that is general strikes as part of a wider protest against authorities, prevented the ordinary flow of goods. Therefore, traffic flows and our survey activities were limited to the “non-ghost-town” days, which may have led to an overestimation of daily flows.
Results
Cities as Focal Points Attracting Food Flows
Quantity and Composition of Food Flows
Inflows
Feeding cities requires net amounts of food entering the city large enough to meet the daily needs of a growing urban population. For a city the size of Bamako, the urban food system comprising imports, production, trade, processing and transport, must feed 2.8 million inhabitants (OECD/SWAC, 2020). Considering a minimum daily calorie intake per capita of 2,100 kilocalories,2 the minimum dietary calorie requirement for Bamako is estimated at 5.88 billion kilocalories a day. For a secondary city of the size of Bamenda (312,337 inhabitants), 656 million kilocalories a day are needed (OECD/SWAC, 2020).
Staple crops, such as cereals, roots, tubers and plantains, dominated food inflows in all cities. The quantity of cereals entering the city ranged from 1,168 tons/day3 (420 g/cap/day) in Bamako to 231 tons/day (738 g/cap/day) in Tamale (Figure 4). Food inflows differed between cities in quantity and composition. Large amounts of roots, tubers, and plantains entered Bamenda (623 g/cap/day) and Tamale (415 g/cap/day) daily whereas these products played only a minor role in Bamako's (123 g/cap/day) and Ouagadougou's (35 g/cap/day) composition of food inflows (Figure 4). Tamale had the largest per capita inflows of cereals and legumes with an average of 738 g/cap/day of cereals (mostly maize and rice). The daily per capita quantity of vegetables also differed between cities, with higher quantities in Bamako (210 g/cap/day) and Ouagadougou (119 g/cap/day).
Figure 4
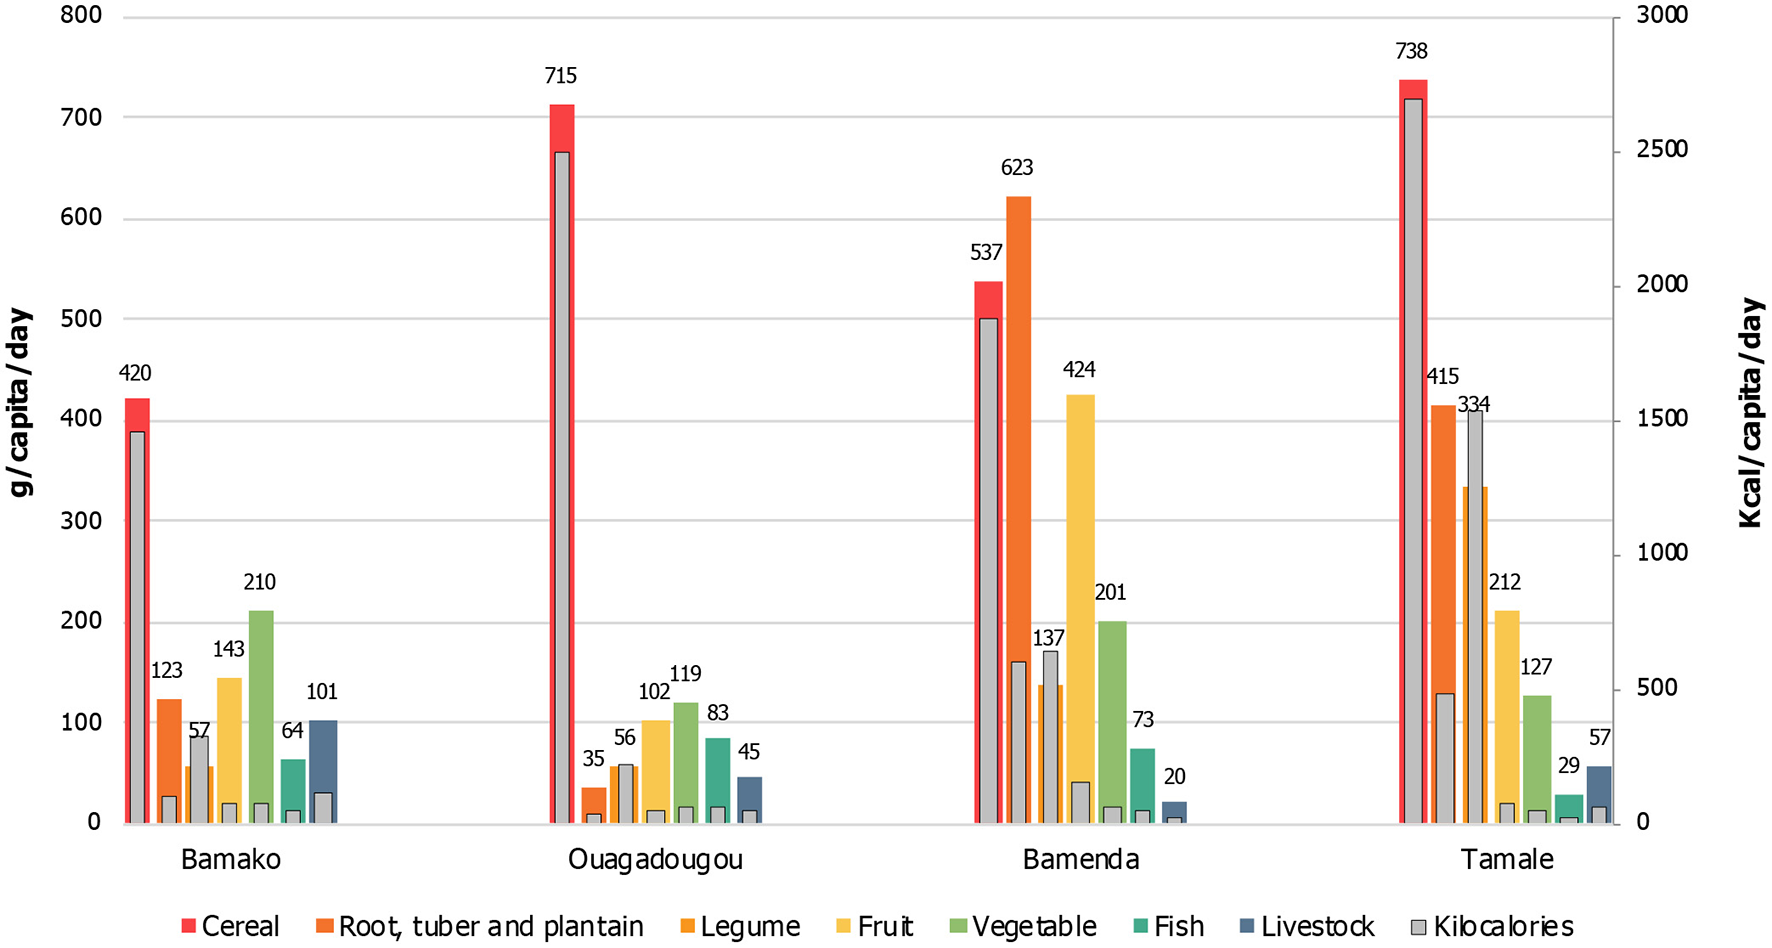
Daily per capita quantity entering the West African cities of Bamako, Ouagadougou, Bamenda, and Tamale [incoming flows in g/capita/day (left axis) and kcal/capita/day (right axis)]—average over three (two) seasons (Bamenda, Cameroon).
Converting food inflows into kilocalories, we recorded an average of 2,181 kcal/cap/day for Bamako, 2,966 kcal/cap/day for Ouagadougou, 4,911 kcal/cap/day for Tamale, and 3,402 kcal/capita/day for Bamenda. Daily caloric inflows have to interpreted with care keeping outgoing flows in mind, in particular for Tamale (section Origin of Food Flows). A high share of caloric inflow was provided by staple crops, in particular cereals. The share of cereals in total calories was 67% for Bamako, 84% for Ouagadougou, 55% for Tamale, and 55% for Bamenda. In all four cities, legumes were the second largest food group in terms of caloric inflows, representing 15% of total calories for Bamako, 7% for Ouagadougou, 31% for Tamale, and 19% for Bamenda. Groundnuts (Arachis hypogaea L.), beans, and soybeans [Glycine max (L.) Merr.; in Tamale only], relatively high in calories, represented the three main sources of calories within the food group. Roots, tubers, and plantains were also relatively important in Tamale and Bamenda, accounting for, respectively, 10 and 18% of total calories.
Seasonality induced changes in food inflows, influencing the above results. Some products clearly peaked in specific seasons or were available only seasonally. These concerned primarily perishable tree crops such as mango (Mangifera indica L.), avocado (Persea Americana Mill.), and orange (Citrus sinensis), but also watermelon [Citrullus lanatus (Thunb.) Matsum. & Nakai]. Mango was particularly seasonal with a clear peak in the hot season. In Bamako, for example, an average quantity of 274 tons (99 g/cap/day) of mango entered the city daily during the hot season, while no mango entry was recorded during the peak and the rainy seasons.
Outflows
In cities as consumption centers, incoming quantities of most products clearly exceeded outgoing quantities. Products with very small outgoing flows, in particular fresh fruits, vegetables, and livestock, were likely carried to cities for the sole purpose of consumption, apart from further processing and fattening (livestock). However, cities also act as hubs, forwarding food to locations elsewhere (sections City Functions in Food Distribution and City Functions in Selected Food Supply Chains). In this regard, outflows can constitute a substantial share of incoming volumes. Therefore, considering outgoing food flows is crucial in understanding the roles of cities in food distribution and allows to put incoming flows, and the nutritional value embodied in these flows, into perspective. Overall, total outgoing quantity accounted for 22% of total incoming quantity for Bamako and Bamenda, 39% for Ouagadougou, and 75% for Tamale. Products with major outflows in all cities were storable, such as cereals and pulses, mainly rice, maize, wheat, millet, beans, and groundnuts. Other, more perishable products may undergo processing in the city to prolong shelf-life before redistribution, including cassava flour (“gari”) or dried chili pepper. Finally, some outgoing products were specific to cities, such as yam and watermelon (Tamale), cattle and onion (Ouagadougou), potato, cabbage and leek (Allium ampeloprasum subsp. Ampeloprasum L.; Bamenda) and mango [Ipomoea batatas (L.) Lam.; Bamako].
Origin of Food Flows
Food products may be locally available or sourced from territories that are further away. The local hinterland, national, intra-regional, and international sources contributed differently to cities' total food supply, depending on the type of product, cities, and seasons. Bamako and Ouagadougou depended the least on their hinterland with only 7% (Bamako) and 8% (Ouagadougou) of total daily incoming food quantity coming from local sources (within 50 km to the city center). In Tamale and Bamenda, this share reached 29 and 44%, respectively (Figure 5). However, looking at absolute quantities coming from local sources reveals a different picture: they ranged from 175 (Tamale), over 221 (Ouagadougou, Bamako) to 273 tons/day (Bamenda) from the cities' local hinterland. Including other national locations, domestic sources contributed 69% (Bamako), 61% (Ouagadougou), 80% (Bamenda), and 92% (Tamale) to daily incoming food quantity. Intra-regional trade was relatively important for Bamako (12%) and Ouagadougou (14%) and for certain food products (Figure 5). The analysis of transit flows further sheds light on the scale of intra-regional trade (Box 1). International sources provided 19% (Bamako), 25% (Ouagadougou), 18% (Bamenda) and 8% (Tamale) of daily incoming quantity.
Figure 5
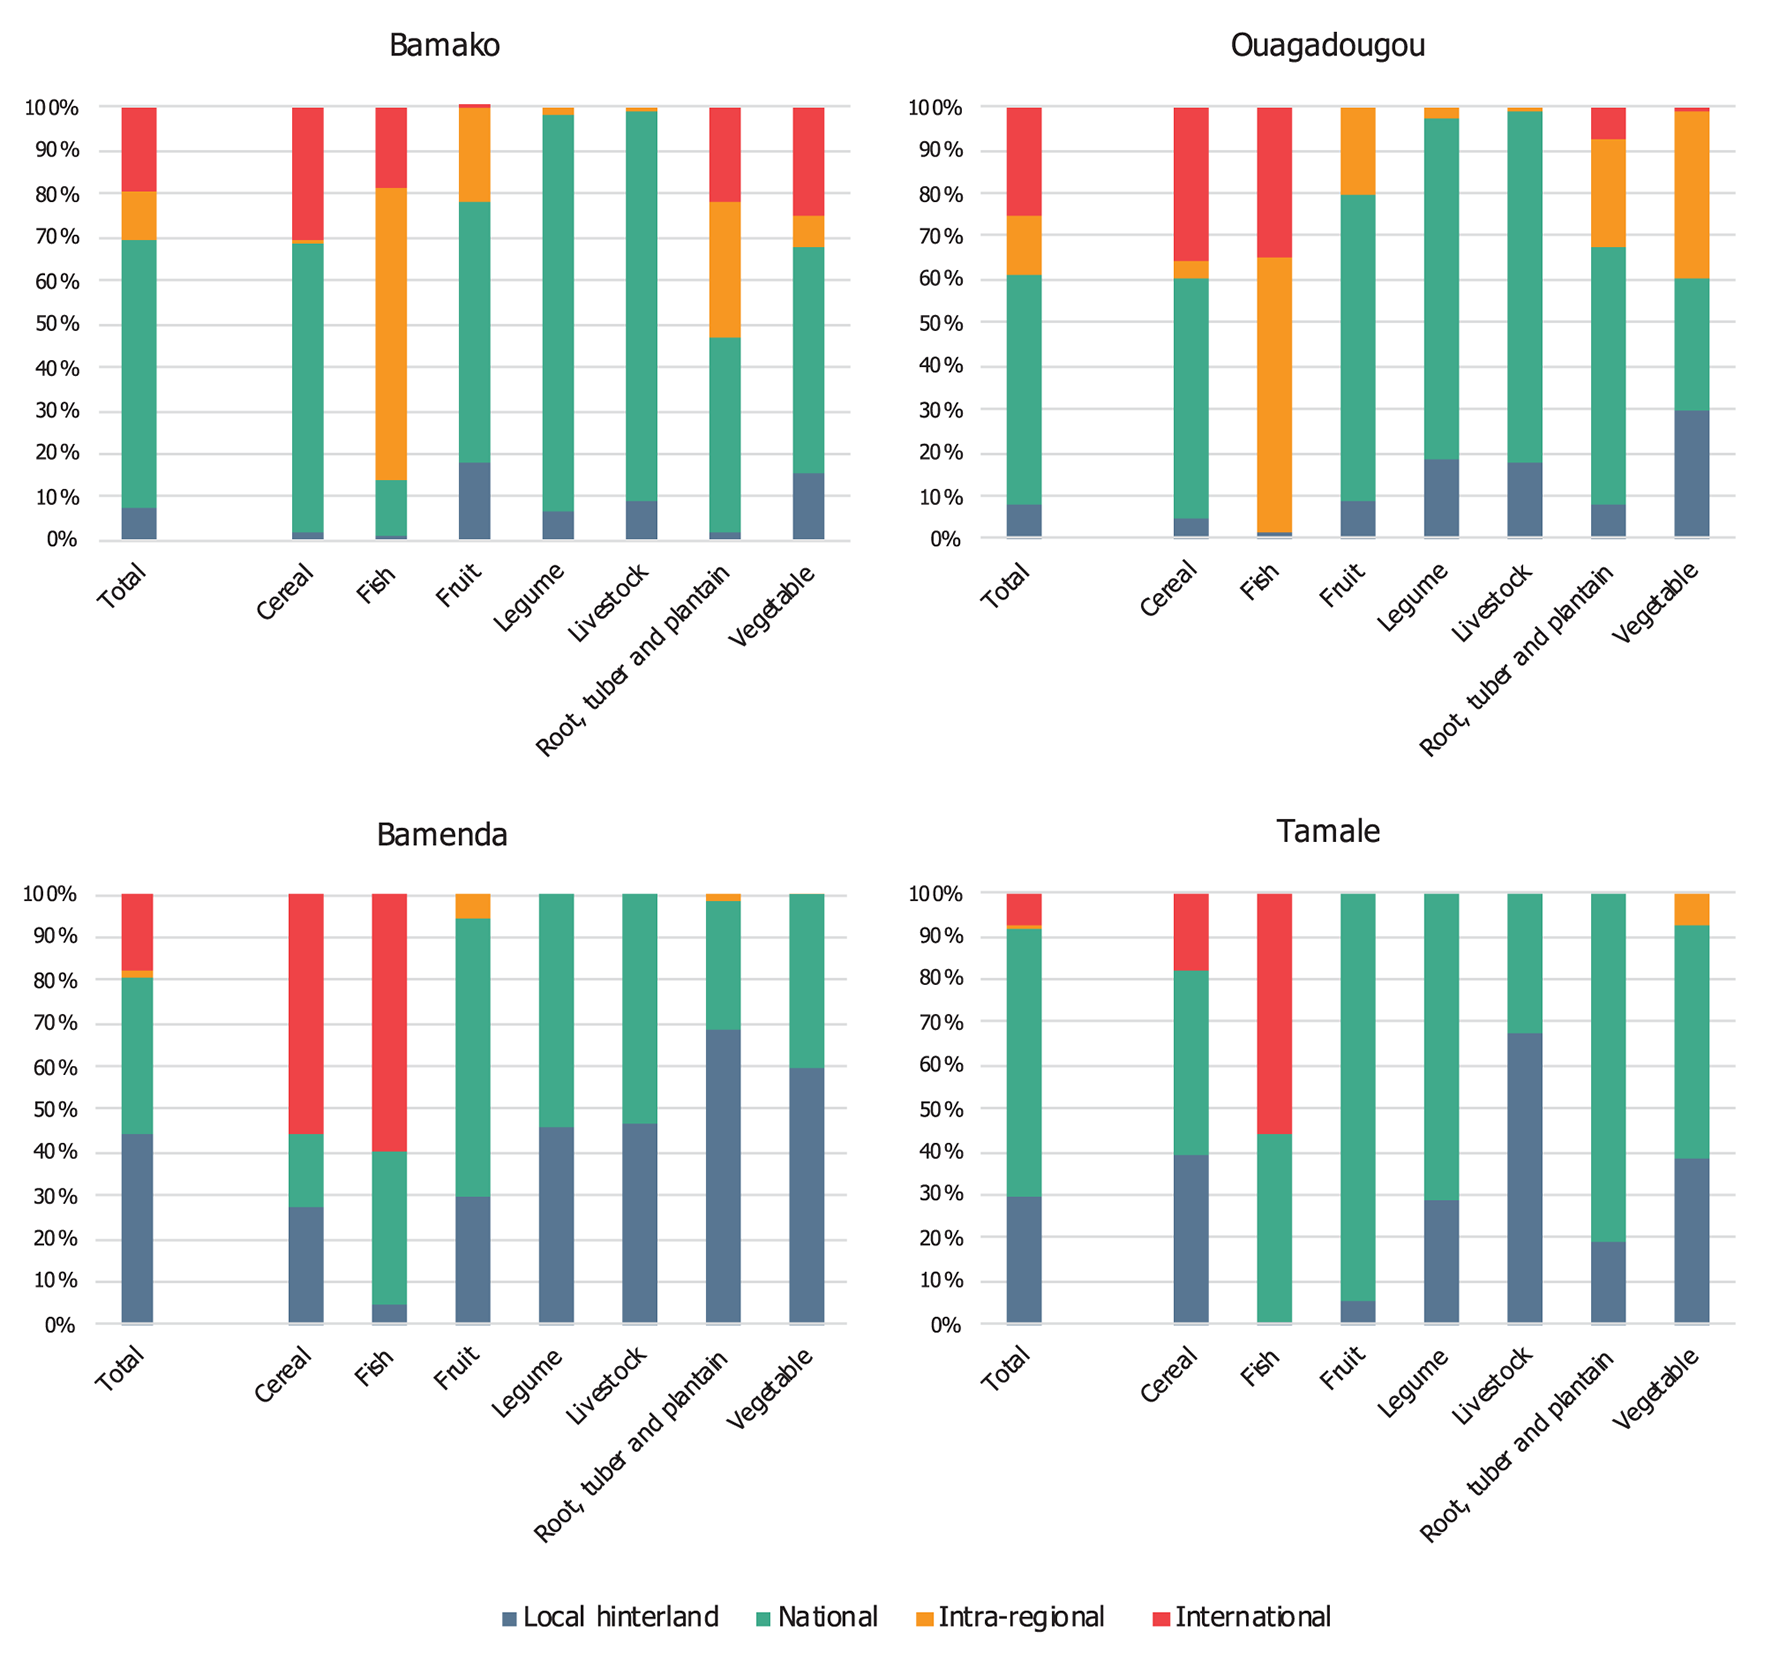
Average share of incoming food group quantity coming from the different origin categories for the West African cities of Bamako, Ouagadougou, Bamenda, and Tamale (local hinterland, national, intra-regional and international) [average % over the three (two) seasons (Bamenda, Cameroon)].
Different food groups had different territorial links, with similarities among cities. In all cities, a significant share of the total daily incoming quantity of cereals and fish was provided by international sources (Figure 5). Wheat was commonly sourced from overseas while maize, sorghum, and millet were mostly produced nationally. Rice and fish were both produced in the region and imported. For instance, in 2014, Ghana produced 46% of its rice and 36% of its marine fish supplies and imported the remainder from international sources (FAOSTAT, 2014). A surprisingly high proportion of vegetables was traveling long distances, with important variations according to the type of vegetable and the season. In Bamako and Ouagadougou, 32 and 40%, respectively, of total daily incoming quantity of vegetables came from across the borders (intra-regional and international sources). For instance, in Ouagadougou, 98% of the incoming avocado was provided by intra-regional trade during the rainy and hot season (Supplementary Appendix 2). In Bamako, 47% of incoming onion was imported from international sources, with strong seasonal variations. In Ouagadougou, onion was mainly sourced from national (37%) and intra-regional (54%) trade. In Ouagadougou and Tamale, tomato was both sourced from the local hinterland, national and intra-regional sources (with strong seasonal variations). At the same time, some vegetables were mainly sourced in the vicinity of cities. For instance, more than 30% (63%) of the incoming cabbage (Brassica oleracea L.), 59% (67%) of cucumber (Cucumis sativus L.), and 43% (64%) of eggplant (Solanum melongena L.) were coming from the local hinterland in Ouagadougou (Bamako). In Tamale, chili pepper (Capsicum L.), eggplant, and okra [Abelmoschus esculentus (L.) Moench] were also mainly sourced from the local hinterland.
Box 1 Transit flows across West Africa.
Transit flows are flows that pass through a city without a major stop and present the third category of flows, besides incoming and outgoing flows. Transit flows provide information on sub-regional flows beyond the four case study sites and contribute to a greater understanding of the organization of food trade, such as trade networks and the location of hubs beyond the focal city.
The analysis of major cross-border transit flows revealed different major regional suppliers for specific products (Figure 6). Niger produced onion for the entire sub-region, Senegal was a major supplier of fish to a number of countries and cattle from Burkina Faso crossed several borders to neighboring coastal countries. Coastal countries connected their landlocked neighbors to the international market for imported goods, such as fish, rice, and wheat, and seasonally onion and potato. In turn, exported goods traveled from landlocked to coastal countries (mango, sweet potato). Other flows from Ghana to Sahelian countries concerned goods produced in the more humid production areas of Ghana (avocado, banana, orange, plantain [Musa spp.], yam) vis-à-vis legumes (beans, groundnuts, cowpeas) and cattle, and seasonally onion and tomato, from Sahelian to coastal countries. The climatic north–south gradient creates different agro-ecological zones and drives the exchange of agricultural goods. This is reflected in the high number of transit vehicles recorded in Tamale (section Food Transportation and Distance), located along a major north–south corridor.
For some food groups, differences observed between cities can be partly explained by farming system zones in which cities are located and the fact that some countries share common production areas for specific food products. A city's farming system zone can influence the type and quantity of inflows as well as their source location. Ouagadougou and Bamako, located on the same latitude, showed similarities in the scale covered by incoming products, such as fish, rice, and yam. These products were purchased from southern coastal countries (such as Ghana and Côte d'Ivoire) where they are either produced (banana, yam) or imported from overseas (fish, rice). The cities both mainly relied on intra-regional trade for roots, tubers, and plantains [31% (Bamako) and 25% (Ouagadougou)] while Bamenda and Tamale relied on national sources.
Figure 6
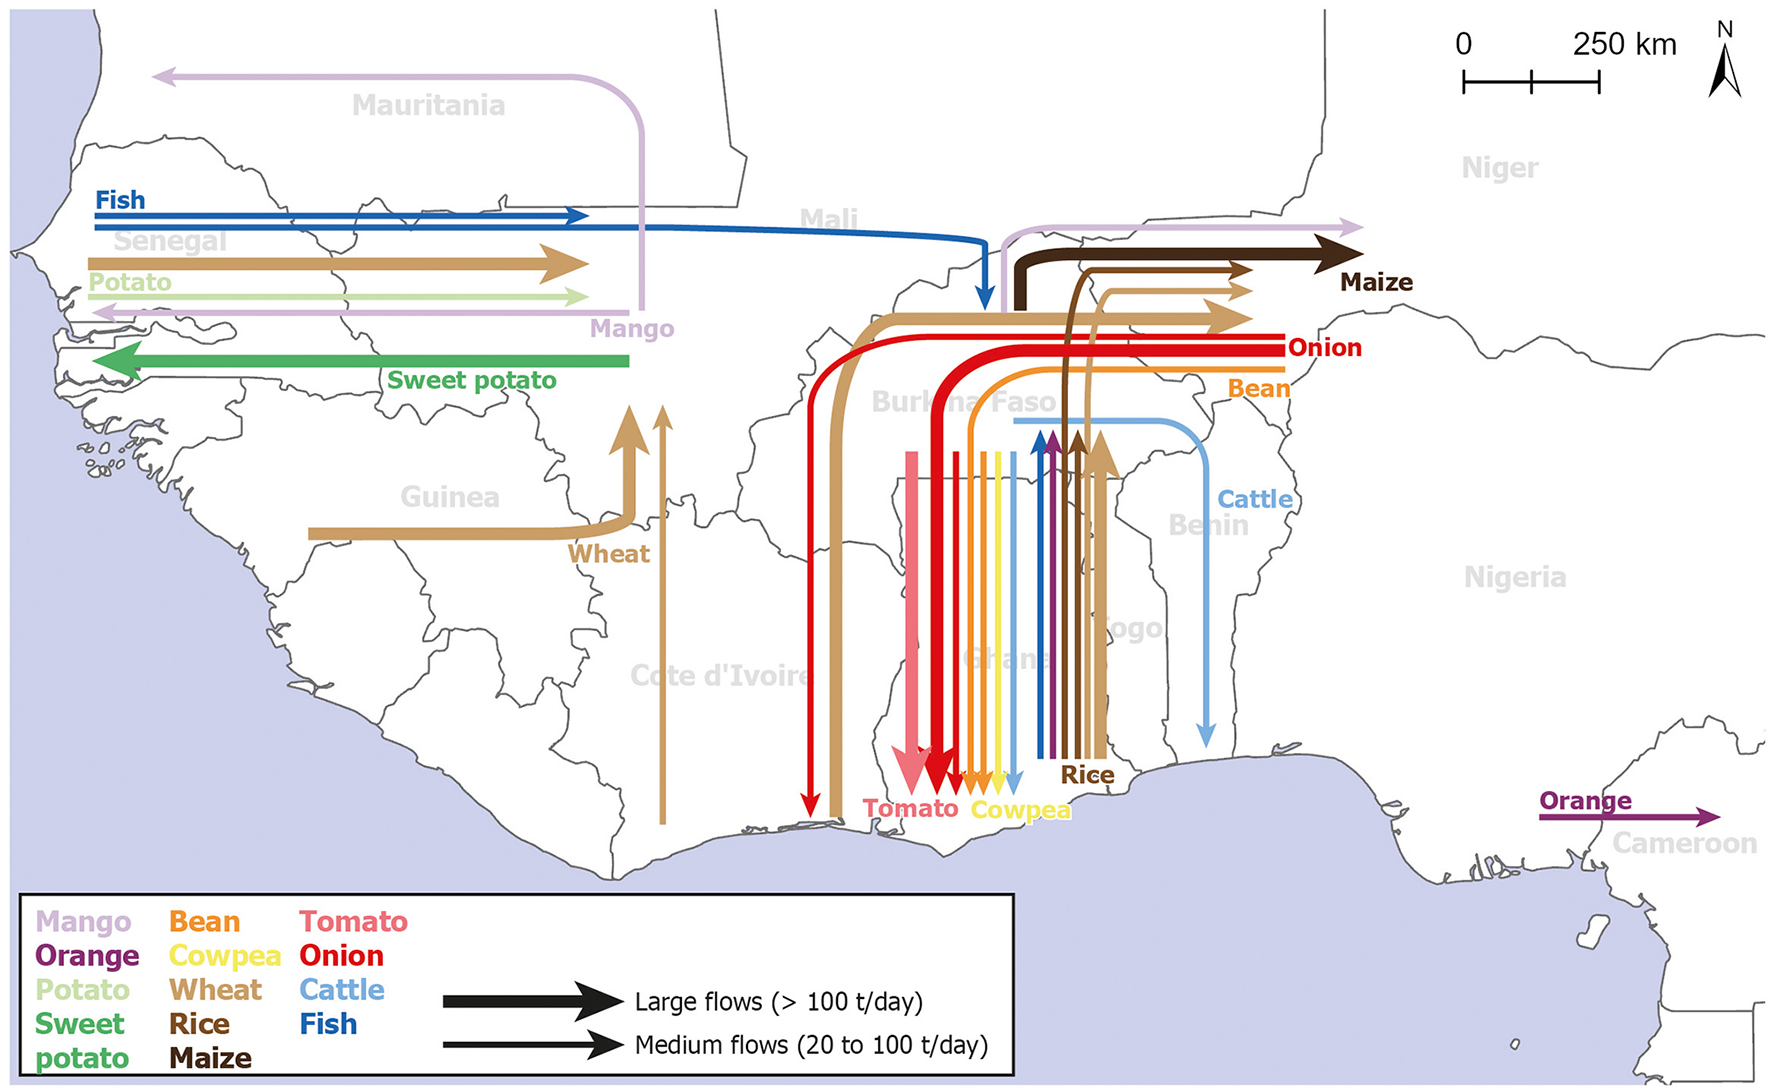
Cross-border transits recorded in the West African study sites Bamako, Ouagadougou, Bamenda, and Tamale (season with maximum flow volume; excludes flows coming from or going to study sites; see Supplementary Appendix 3 for small cross-border transit flows).
The origin of food products varied by season. For some products, the origin changed from local hinterland to more distant national sources from one season to the other. For instance, cabbage entering Ouagadougou was mostly traded from the local hinterland during the peak season (79% of incoming quantity) while it was sourced from more distant national sources during the hot and rainy seasons [90% (hot) and 99% (rainy)]. Such patterns were observed for many vegetables (Supplementary Appendix 2). At the same time, we observed seasonal reliance on global markets for some specific products. In Bamako, potatoes were sourced from within the country, in particular Sikasso, during the hot season, while they were provided by international sources during the peak and rainy seasons [77% (peak) and 99% (rainy)], mostly channeled through Senegal or Morocco. Similar patterns were observed for onion entering Bamako (section City Functions in Selected Food Supply Chains).
Cities as Nodes in a Network
Food Transportation and Distance
Feeding cities is a major logistical challenge. The bulk of food is transported to cities by road using a wide range of vehicles.
The type of vehicles ranged from articulated trucks to motorbikes and bicycles and contributed differently to cities' food supply. Articulated trucks carried large quantities per unit while other types of vehicles (such as cars, taxis, motorbikes, motorized tricycles, or bicycles) carried much smaller unit quantities. For instance, in Bamako, the average quantity of food products carried by an articulated truck was 29 tons compared to 634 kg for a motorized tricycle and 92 kg for a motorbike. Therefore, many trips do not necessarily translate into large overall quantities. Bamenda had the most trips (Figure 7), both in absolute numbers and per capita, however, the average amount carried by inbound vehicles was quite low. The share of vehicles carrying less than 100 kg was 13% for Bamako, 23% for Ouagadougou, 15% for Tamale, and 32% for Bamenda. In Bamako, 17% of incoming vehicles carrying food transported a quantity greater than (or equal to) 20 tons. This share reached 14% for Ouagadougou against only 3% for Tamale and 3% for Bamenda. In addition to in- and outbound trips, transit vehicles passed through the cities (without stopping). Tamale had the highest number of transiting trucks and articulated trucks for the selected products (95 vs. 35 in Ouagadougou, 25 in Bamako and 7 in Bamenda).
Figure 7
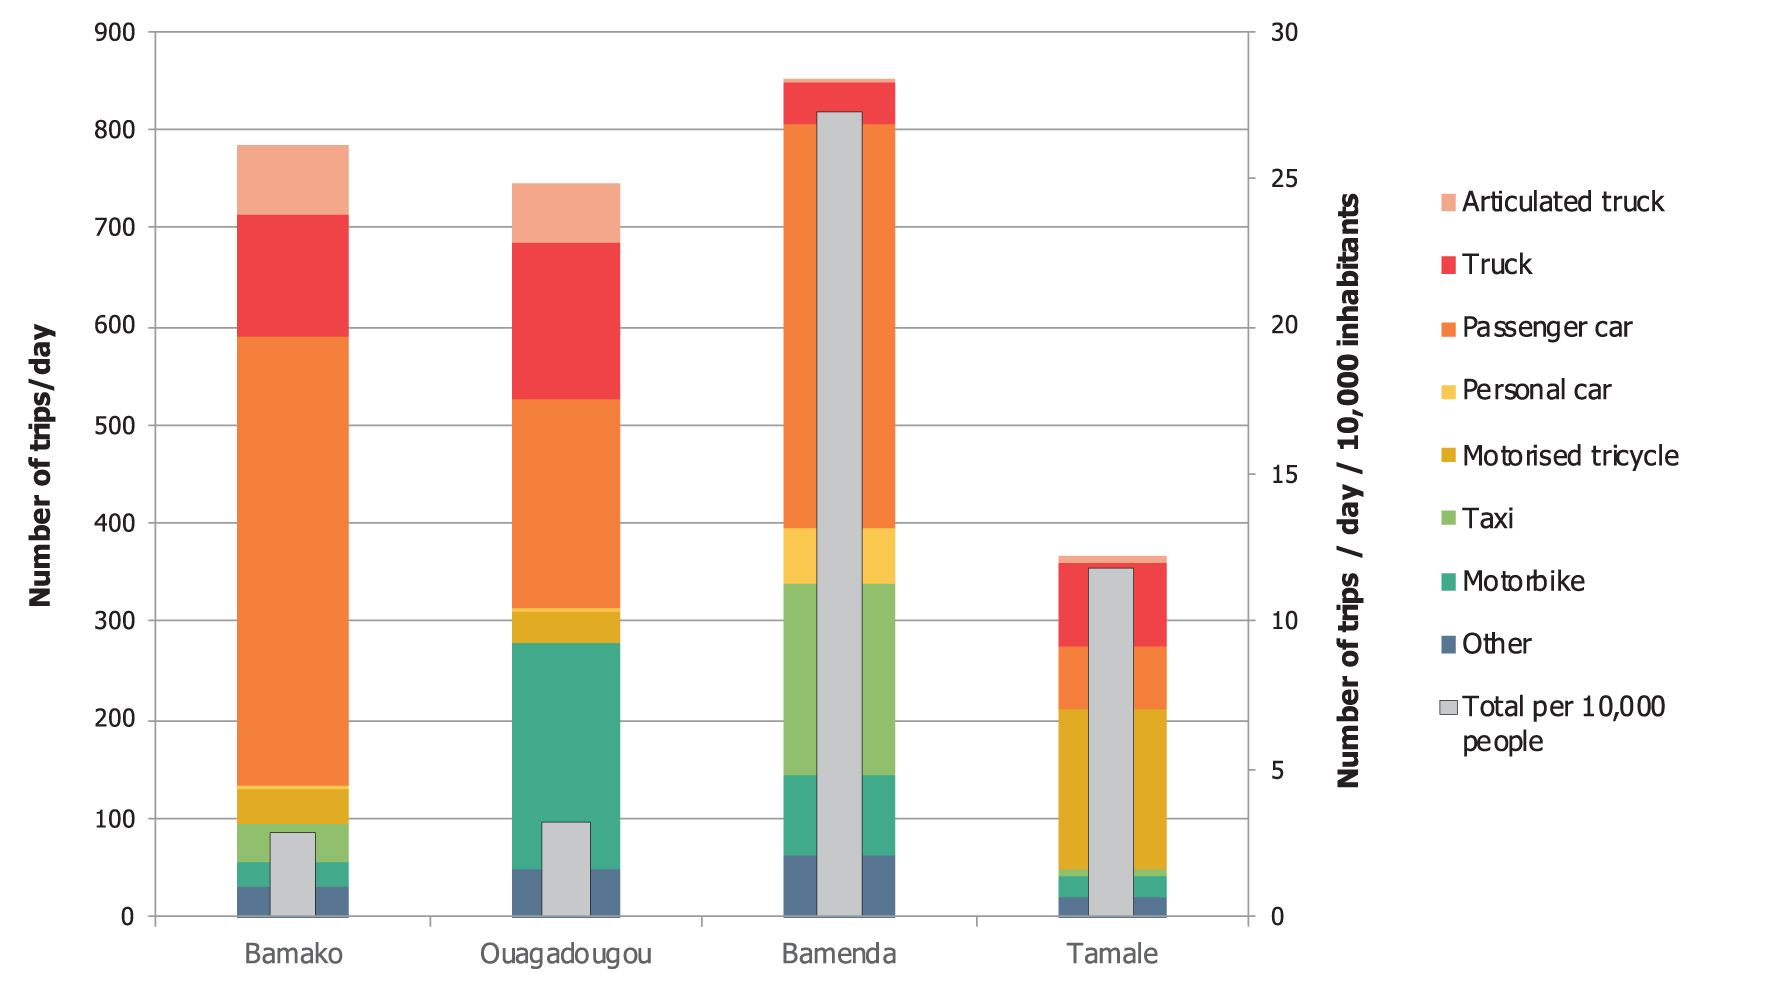
Number of trips (incoming and outgoing) per day by different transport types (left axis) and by 10,000 inhabitants (right axis) in the West African cities of Bamako, Ouagadougou, Bamenda, and Tamale (average across all seasons, for selected products; values were adjusted according to missing location data, see Table 1).
Bamenda and Tamale in particular, sourced more food from close compared to distant sources (Figure 8). More distant peaks represent national production hubs, such as Niono and Sikasso for Bamako, and Bobo-Dioulasso for Ouagadougou, imported goods from ports (Douala for Bamenda) or neighboring countries (Ghana for Ouagadougou). The cumulative number of trips increased more rapidly than the overall quantity. For instance, in Bamako 26% and in Ouagadougou 52% of incoming vehicles from the local hinterland carried 7 and 8% of the daily incoming food. In Tamale and Bamenda, 72 and 71% of incoming vehicles came from the local hinterland, carrying 29 and 44%, respectively, of the daily incoming quantities. Thus, the average unit quantities (quantities transported per trip) increased with increasing travel distance from the city. This is expected as transport costs increase with distance (in absolute terms but decrease per weight unit) and transport of some goods is only profitable when they are transported in large quantities (Tracey-White, 2005). Hence, large quantities correlated with long-distance transportation and vice versa while small vehicles, carrying small loads, dominated the flows within the cities' hinterland. Cumulative outgoing quantities show a distance-related pattern similar to incoming quantities for all cities except Tamale, the city with the most substantial outflows (Figure 8; section Quantity and Composition of Food Flows). Tamale provided relatively small quantities to nearby locations and outgoing quantities peaked at the distance to large urban centers in the central and southern part of the country. The number of outbound trips shows a logarithmic curve for all cities, similar to the incoming number of trips.
Figure 8
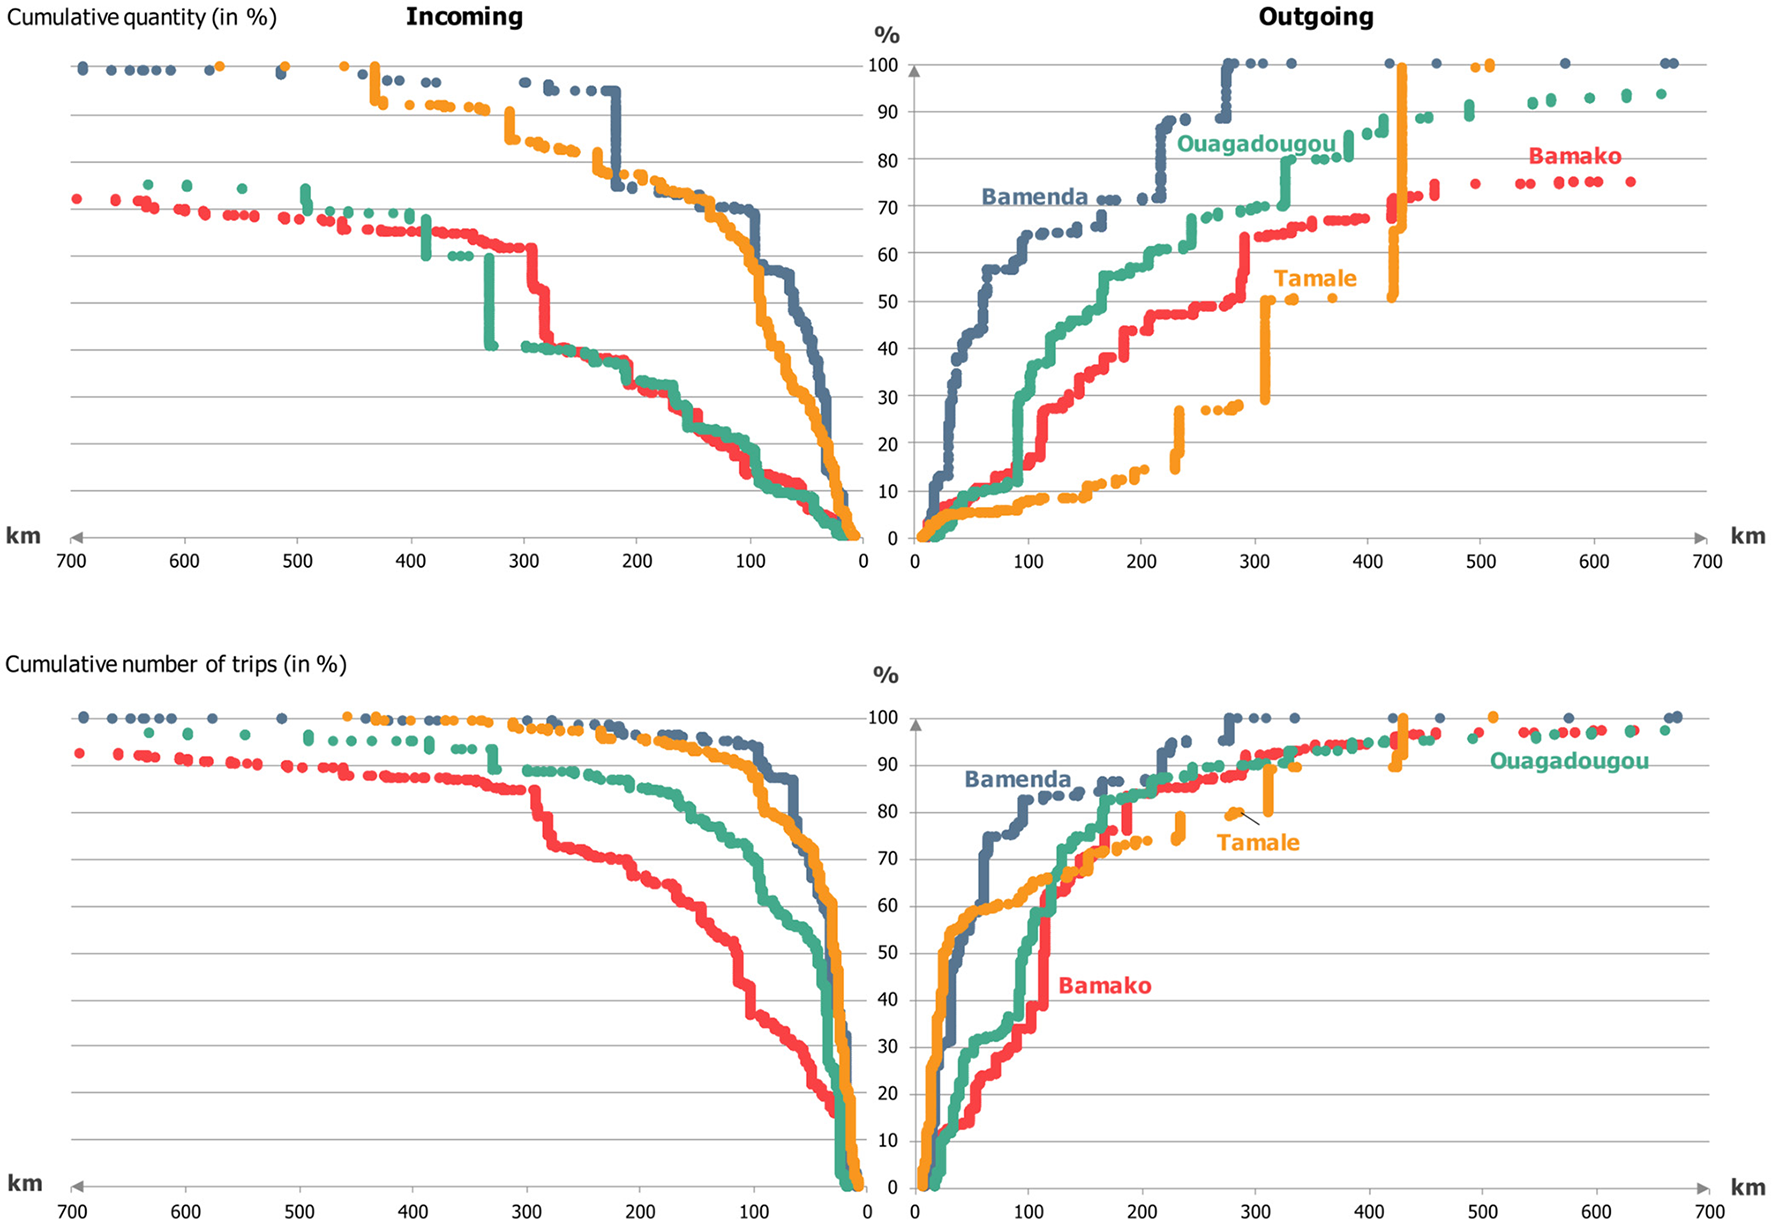
Cumulative transport characteristics along a distance gradient from the city center of the West African cities of Bamako, Ouagadougou, Bamenda, and Tamale (note: distances represent the immediate upstream and downstream segments, which do not necessarily represent places of origin or final destinations; across all seasons, for selected products).
Source locations are defined as the immediate upstream source and therefore do not necessarily represent the primary source but can aggregate goods from their own catchment. Overall, source locations classified as urban dominated in all cities and provided 89% (Ouagadougou) to 53% (Tamale) of incoming food quantities. Taking a detailed look at the source locations revealed that rural locations and small towns of between 10,000 and 50,000 inhabitants contributed 71 and 62%, respectively, to food inflow in Tamale and Bamenda, compared with 33% and 37% in Bamako and Ouagadougou (Figure 9). There is a relationship between the size and distance of source locations: while large urban centers with more than 100,000 inhabitants were the major suppliers over longer distances >200 km, supplying 64% (Bamako) to 97% (Bamenda) of food coming from distant sources (Tamale: 88%, Ouagadougou: 83%), rural sources were more or almost equally important than urban sources for food supplied by the local hinterland (Tamale: 90%, Bamenda: 36%, Bamako: 84%, Ouagadougou: 54%).
Figure 9
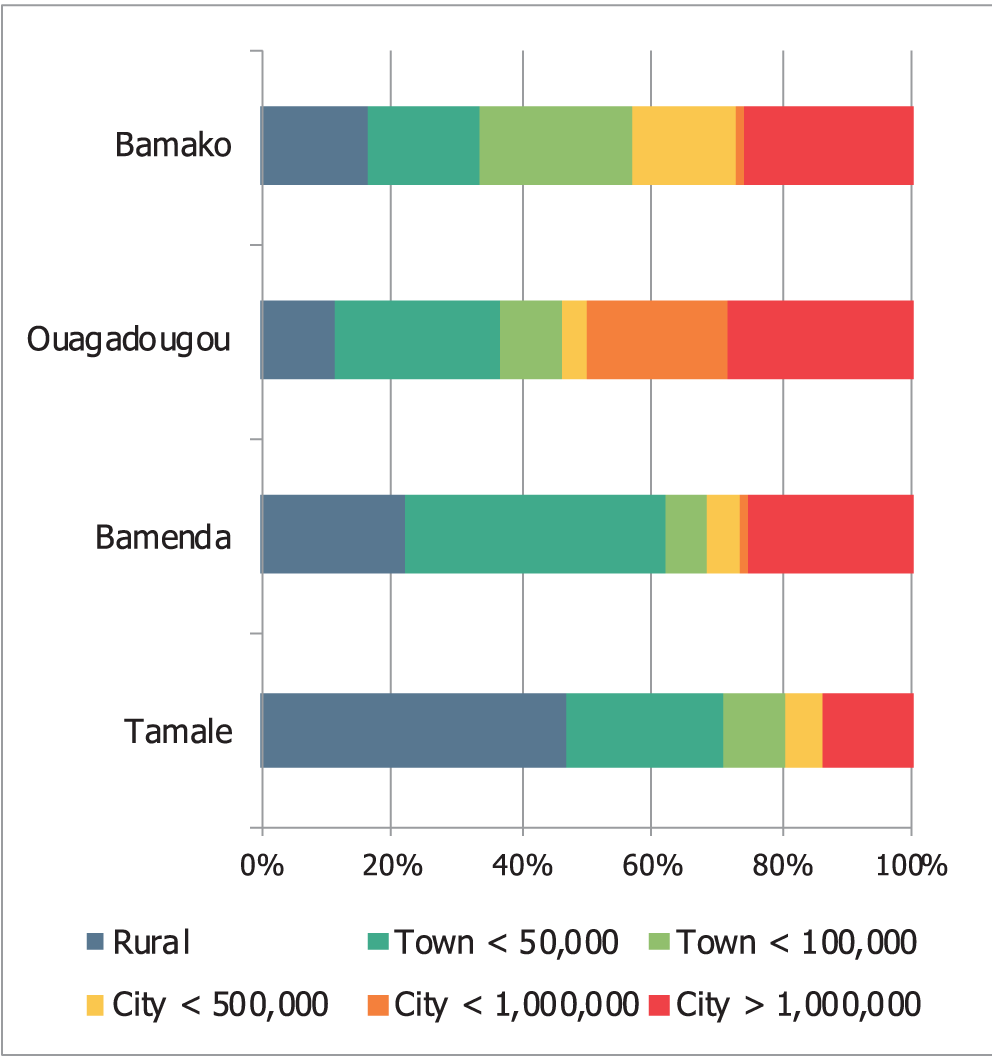
Share of settlements of different sizes to food inflows in the four West African cities of Bamako, Ouagadougou, Bamenda, and Tamale (average across all seasons).
City Functions in Food Distribution
Plotting individual products according to their incoming (vertical axis) and outgoing (horizontal axis) travel distance (Figure 10) provides insights into the cities' upstream and downstream supply segments and therefore into the role of cities in structuring food supply chains. Most products are clustered in the bottom left area of the graph with average inbound and outbound distances being shorter than 500 km. Products, which covered longer inbound distances, also covered shorter outgoing distances and vice versa. Thereby, the four cities differed in their upstream and downstream distances: Bamenda exhibited the most localized catchment area covering its wider hinterland, with regard to both incoming and outgoing distances, followed by Tamale, reflecting the cities' strong reliance on local sources (sections Origin of Food Flows and Food Transportation and Distance). In Ouagadougou and Bamako, all products covered—on average—more than 100 km, incoming and outgoing.
Figure 10
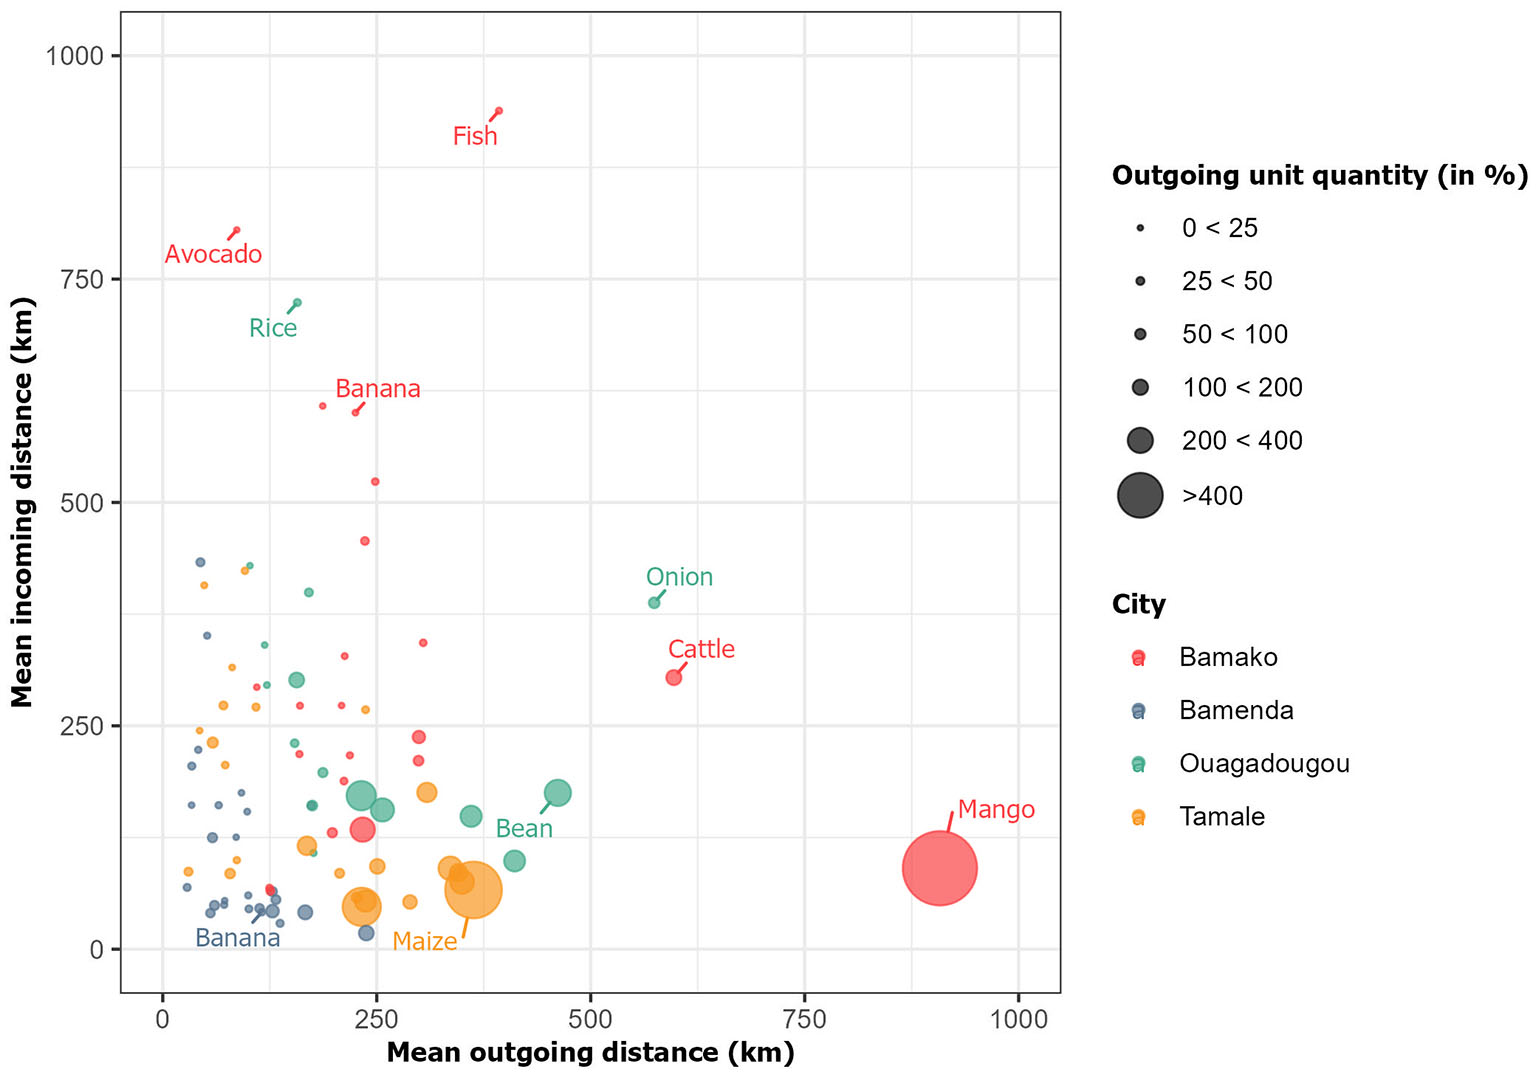
Mean incoming and outgoing travel distance for individual products in the four West African cities of Bamako, Ouagadougou, Bamenda, and Tamale during the hot season (products with incoming quantity above 5 gram/cap/day; size of bubbles reflects the ratio of mean outgoing unit quantity to mean incoming unit quantities in %; mean distance weighted according to quantity).
Outgoing unit quantities, that is the load carried by one vehicle, are presented as the ratio to incoming unit quantities and increased with increasing outgoing distance. This strongly indicates that prior to traveling to distant locations these products were aggregated in the cities, i.e., entering in smaller unit quantities and reloaded onto larger vehicles. Tamale had the largest outgoing unit quantities, with certain products increasing six-fold compared with incoming unit quantities and covering longer outgoing distances. This pattern highlights Tamale's function as an assembly and wholesale market. Products traveling shorter outgoing distances (for Bamenda and Tamale within 125 km; for Ouagadougou and Bamako within 250 km) often exhibited smaller proportional outgoing unit quantities. These products reflect the disaggregation function of cities, receiving large unit quantities of food for in situ consumption and further distribution in smaller units. Ouagadougou and Bamako exhibit this function, for example for imported goods.
City Functions in Selected Food Supply Chains
The City as a Consumption Center (Example: Plantain)
Plantain is one of the major staple crops in Bamenda and accounted for 9% of the total calorie inflow. The local hinterland was the major supplier of plantain, providing 70% of total inflows. Ninety four percent (94%) of all plantain came from within 100 km. Only 7% of inflows left the city for other locations, suggesting a high level of urban consumption. More than half of outgoing flows (52%) supplied only two large urban centers, Douala and Bafoussam. Outgoing unit quantities were smaller than incoming unit quantities, confirming that Bamenda does not act as a wholesaler to other locations, but mainly serves as a consumption center with some small-scale disaggregation (Figure 11).
Figure 11
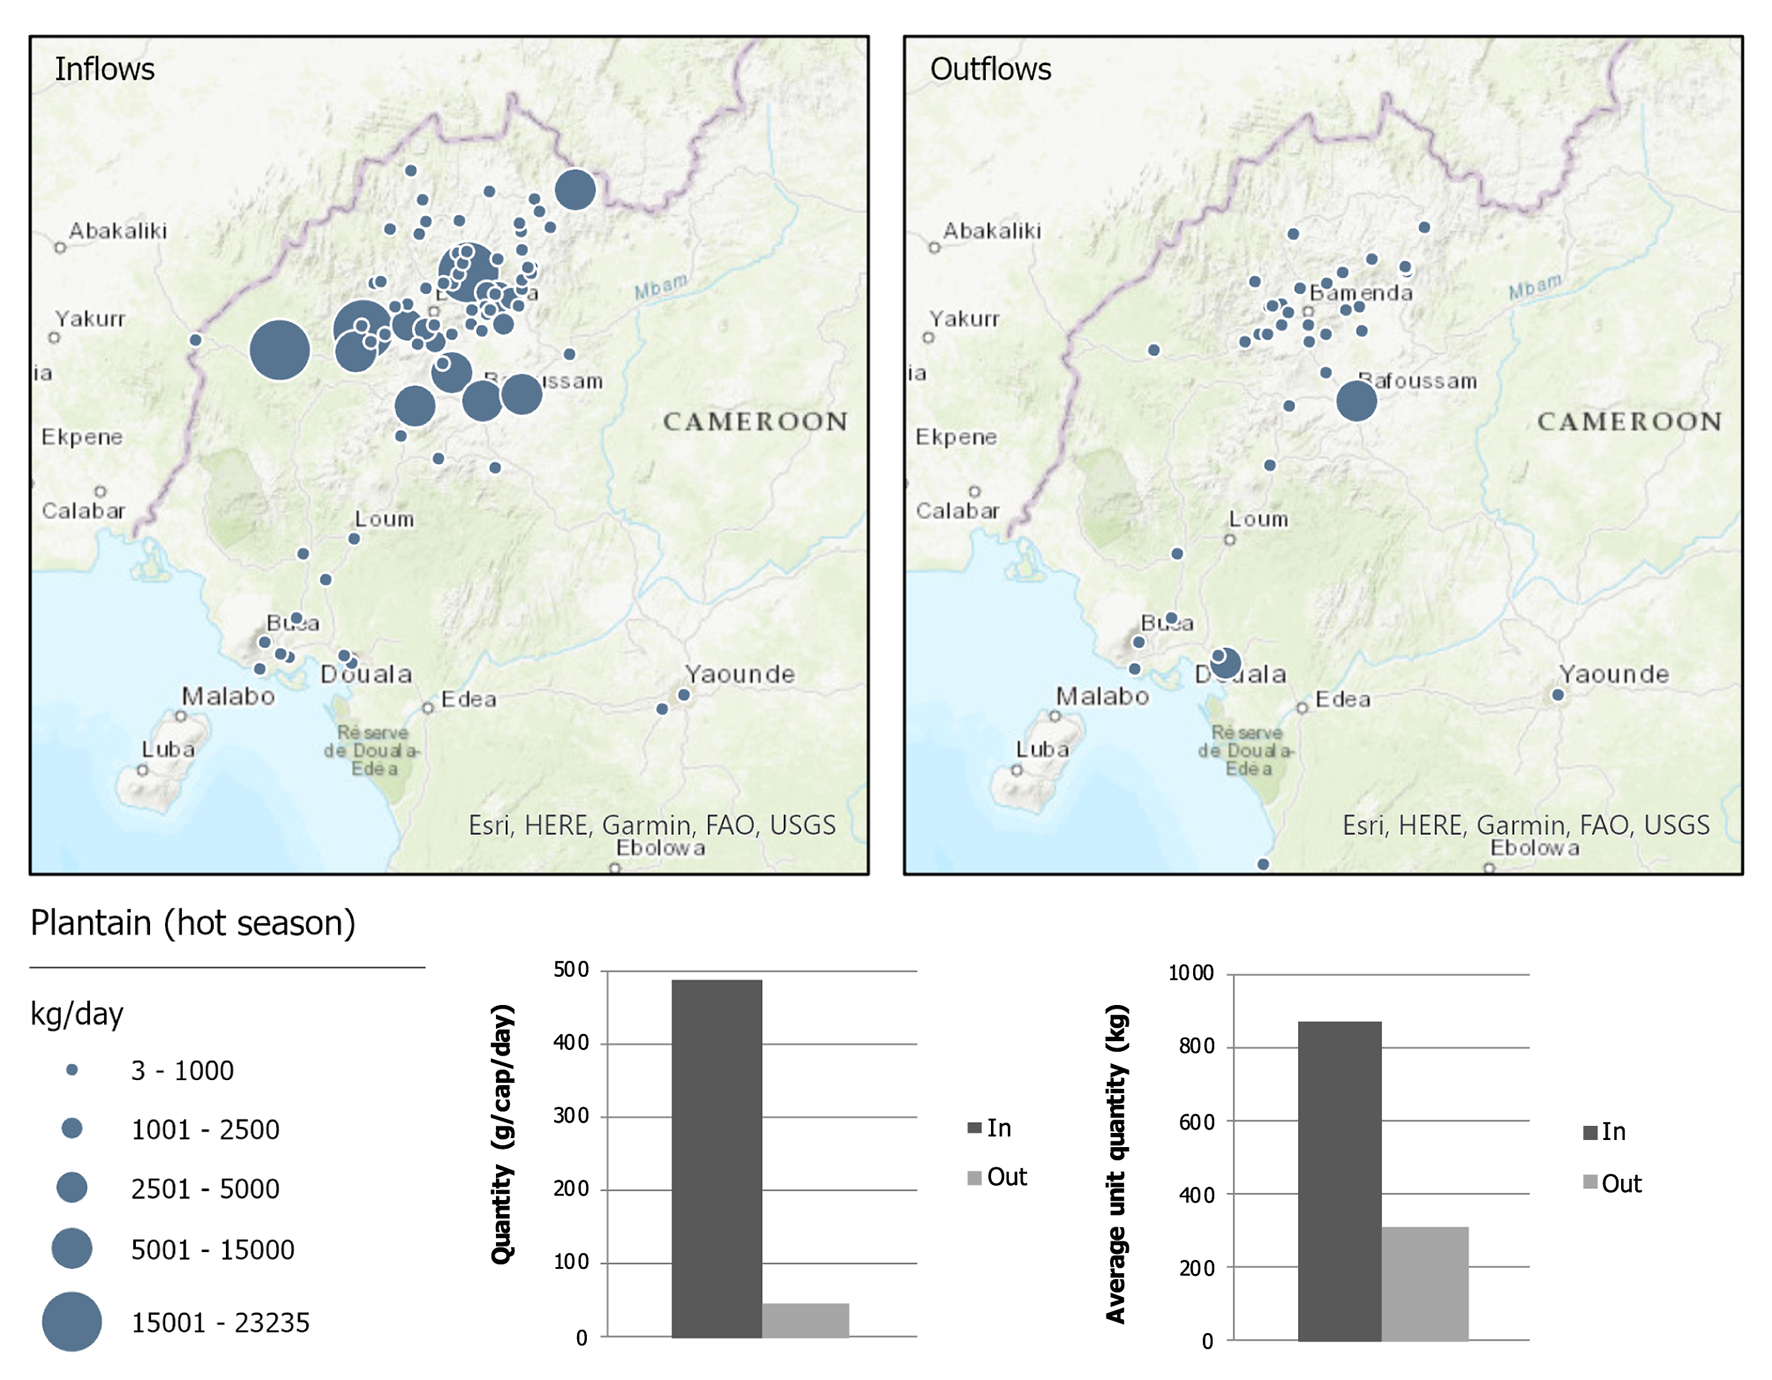
Incoming and outgoing flow characteristics of plantain in the city of Bamenda, Cameroon (hot season).
The City as a Receiving and Disaggregation Center of Imported Goods (Example: Rice)
Imported goods from overseas, such as rice, wheat, and fish, were channeled from ports directly to urban centers, in particular to the capital cities Bamako and Ouagadougou. Potato and onion were also imported seasonally, mainly to Bamako. These flows were characterized by relatively high outgoing shares (section Quantity and Composition of Food Flows), that is cities acted as trade hubs, from where these products were transported to other locations in the country. While wheat was generally imported, fish and rice were also produced in the region. The reliance on imported rice differed across cities: while Ouagadougou received almost 90% of its rice supplies from intra-regional or international trade (46% by rail from Abidjan), the other cities depended to a higher extent on national sources (Bamako: 44%; Bamenda: 29%; Tamale: 71%).
Rice is a major food product supplying 30% of the caloric inflows to Ouagadougou. At the same time, 77% of the rice inflows across seasons were leaving the city again, amounting to 41% of total outflows. In the peak season, 96% of incoming rice flows left the city for other locations (Figure 12). While 91% of incoming flows came from only four locations, 90% of outflows supplied 34 locations across the country (Figure 12). More than 89% of the rice outflows went to urban locations; about half of the total outflows to small towns with fewer than 50,000 inhabitants (47%) and to locations within 125 km. The disaggregation pattern is reflected in substantial differences between incoming and outgoing unit quantities, with an average quantity of more than 25 tons transported by incoming vehicles vs. 4.3 tons transported by outbound vehicles.
Figure 12
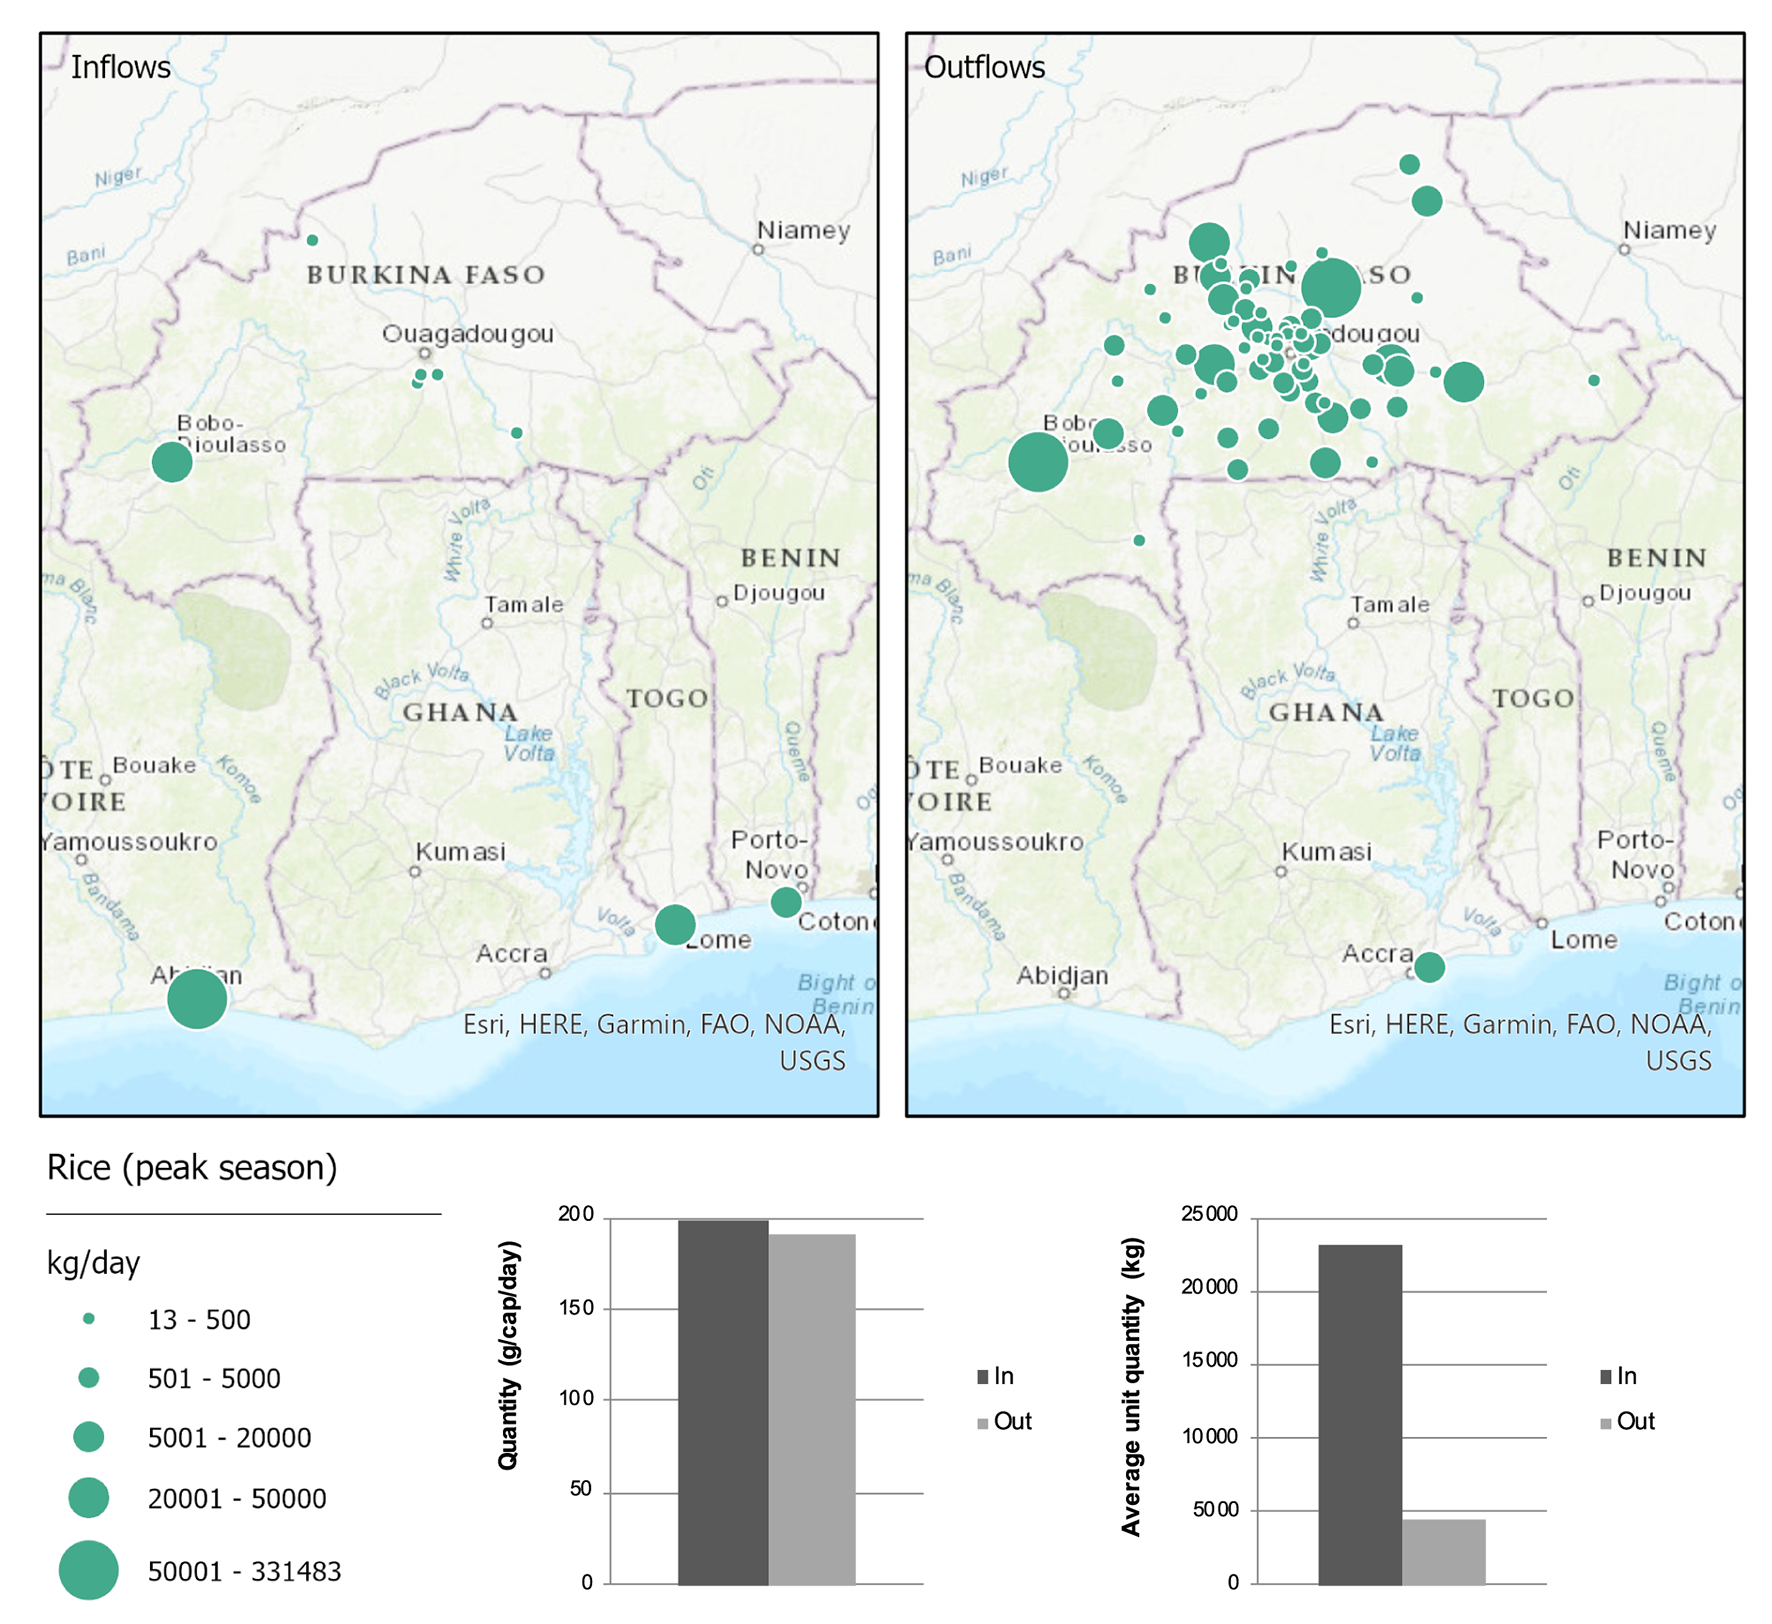
Incoming and outgoing flow characteristics of rice in the city of Ouagadougou, Burkina Faso (peak season).
The City as an Assembly and Wholesale Market (Example: Maize)
Cities can act as assembly markets for nearby producers. Tamale, located in a major cereal-producing region, acts as a collector of staple crops, maize in particular, that are produced in the wider hinterland. Maize is the major supplier of calories to the city, accounting for 26% of total calorie inflows.
According to our data, almost half of all maize inflows (47%) came from within the local hinterland, in very small unit quantities and from many scattered sources (Figure 13). More than two-thirds of the maize inflows came from rural areas and 21% from small towns with fewer than 50,000 inhabitants. In all seasons, outgoing flows, partly originating from urban warehouses, exceeded the incoming flows because inflows to urban warehouses in Tamale were partly unaccounted for (section Limitations). Most maize outflows traveled in large quantities to the urban centers in the central and southern part of the country; 59% to Accra and Tema alone. Data for Ouagadougou revealed a different picture: the proportion of outgoing flows in relation to incoming flows was relatively small (22%) compared with Tamale and incoming unit quantities exceeded outgoing unit quantities, thus, outgoing flows were transported in smaller units. Bobo-Dioulasso was the main supplier and provided 46% of all maize inflows to Ouagadougou. This pattern suggests that Ouagadougou had the role as receiving center, similar to Accra in Ghana, and Bobo-Dioulasso acted as an aggregator for nearby producers and as a large-scale supplier of maize, similar to Tamale.
Figure 13
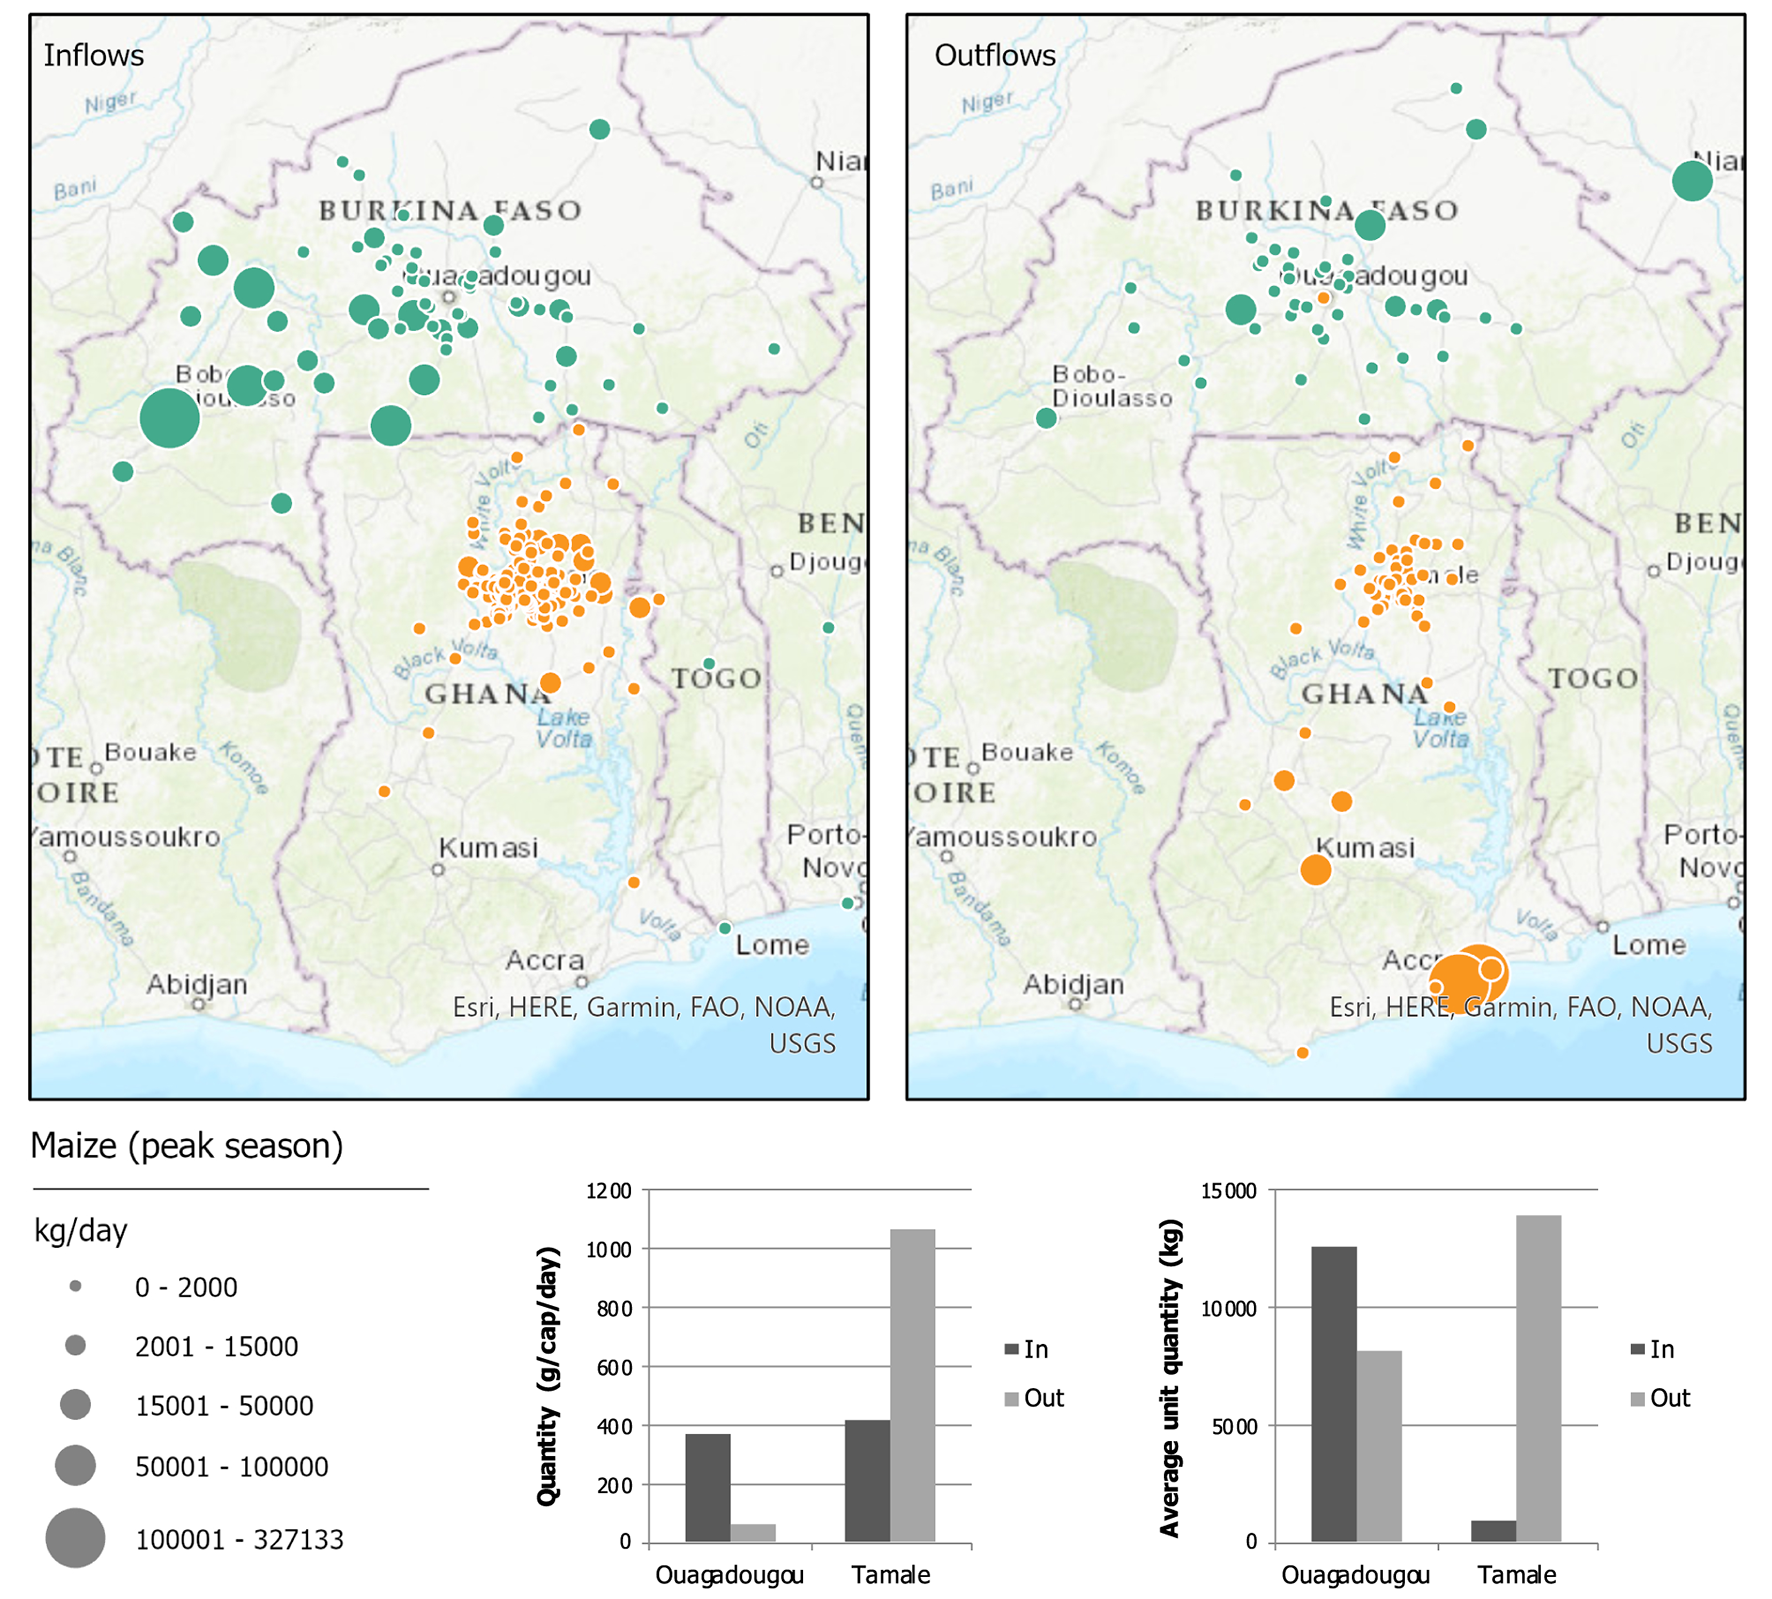
Incoming and outgoing flow characteristics of maize in the West African cities of Ouagadougou and Tamale (peak season).
In Tamale, other crops, such as groundnut, millet, and yam, were also exported in large quantities to the southern part of the country. However, export volumes did not exceed transit flows passing through the city. Tamale exported on average 229 tons of maize per day against 43 tons of transiting maize flows. On the other hand, 32 tons of yam left Tamale daily, with transits accounting for 224 tons per day, traveling mainly from other locations in north-eastern Ghana, such as Yendi, to central and southern Ghana. Thus, Tamale was not the main supplier and other towns, which were closer to the respective production area, may have acted as assembly and wholesale markets for these products (e.g., Bawku in the upper-east region for millet, and Yendi close to the Togolese border for soybean and yam).
Hybrid Functions and Seasonality (Example: Onion)
Onion was one of the major vegetables in all cities, in Ouagadougou and Bamako even the predominant vegetable, as measured by incoming per capita quantities. Onion supply was highly seasonal, in terms of incoming quantities as well as places of origin and destination. The main production period in the sub-region is during the hot season. In this season, Bamako relied on national sources for onion, with the major suppliers being Niono (69%) and Mopti (11%). Bamako was the largest onion exporter of the four cities, with 61% of the inflows going to neighboring countries, mainly to Guinea (Figure 14). Large outgoing flows (118 tons/day) and very low levels of transit flows (2 tons/day) reflect Bamako's disaggregation function for onion in the hot season. This situation changed in the other seasons: In the peak season, Bamako imported 95% of its onion supplies via the port in Dakar, Senegal, while, in the rainy season, 65% was imported from international sources, channeled through Senegal (35%), Abidjan (18%), and Morocco (13%). These imports were reflected in higher unit quantities, but smaller overall quantities. In these seasons, outgoing flow quantities decreased and mainly supplied national sources: only 15% and 23% of the outgoing flows were exported to neighboring countries in the peak and rainy seasons.
Figure 14
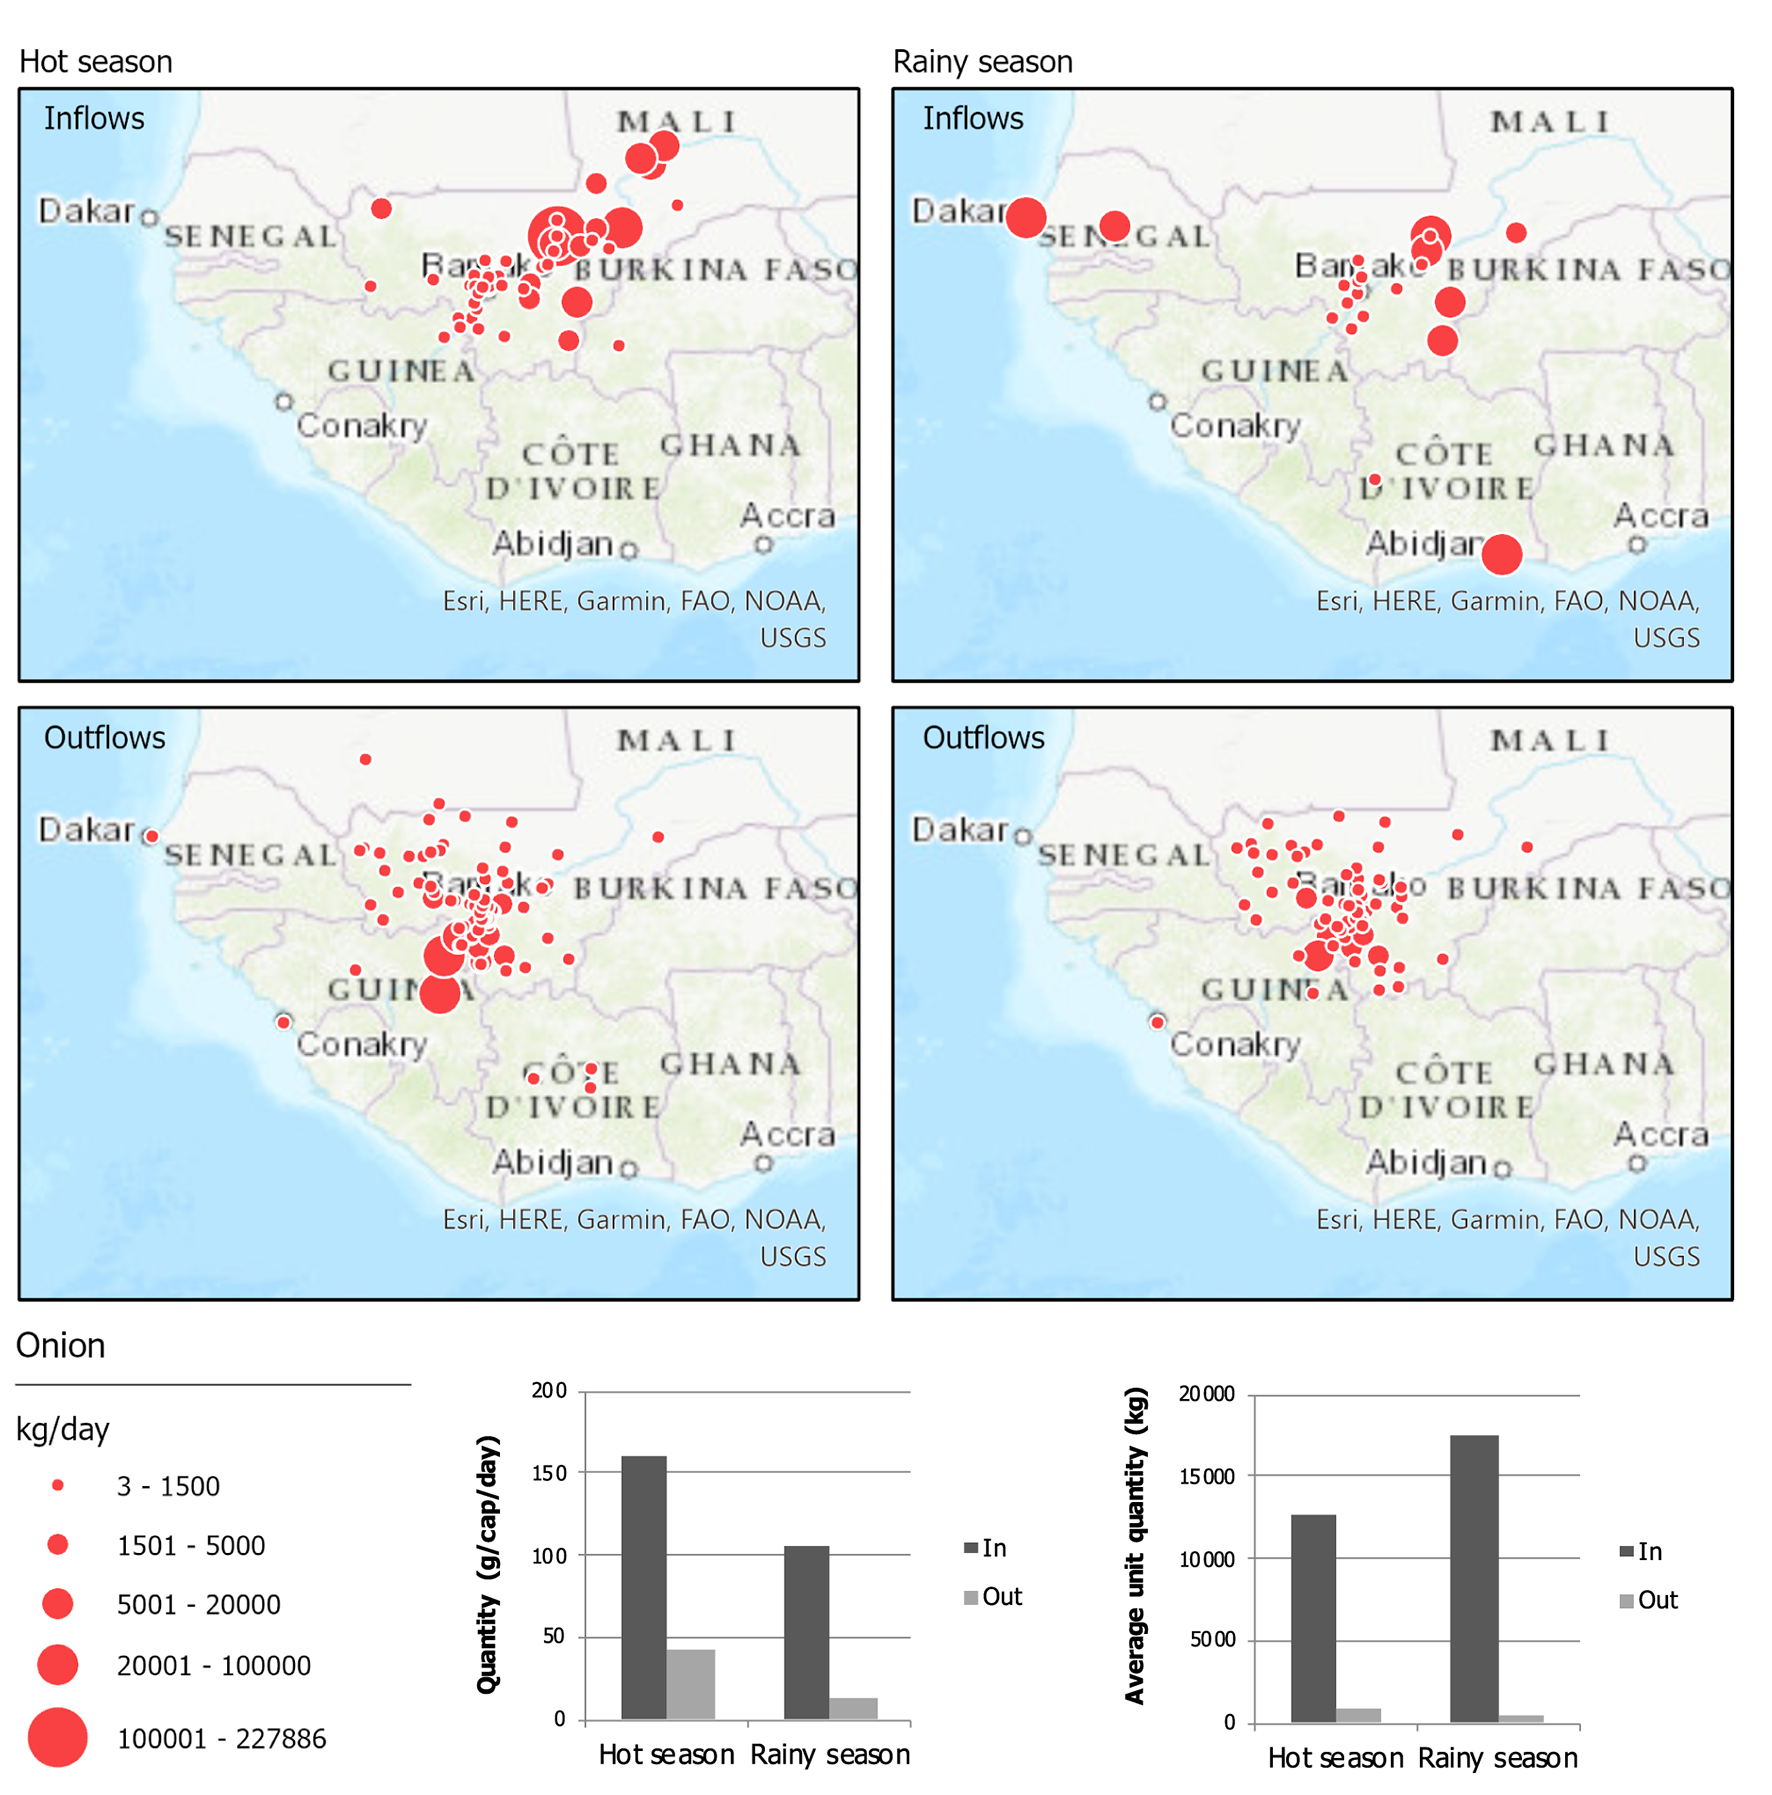
Incoming and outgoing flow characteristics of onion in the city of Bamako, Mali (hot and rainy season).
Discussion
Logistics in Food Distribution
Rising urban demand for a greater diversity of food and the spatial configuration of market places determine the magnitude and the direction of food movements. Our study quantified food flows to and from primary and secondary West African cities. Across all seasons and cities, staple crops dominated food inflows, confirming general consumption trends with a high reliance on carbohydrates for calorie intake (Haggblade et al., 2012). However, food inflows are not synonymous with food actually consumed, not only because our set of products did not include processed food, but also because outgoing flows and other factors such as food losses were not accounted for. The difficulty in translating inflows into consumption is also related to the increasingly complex and important mid-stream segments, including processing, storage, wholesaling, and logistics, which are largely missing in policy debates (Reardon, 2015; Allen and Heinrigs, 2016). West African cities rely not only on food producers but also on a large panel of intermediaries (transporters, market operators, and traders) and services that connect producers with consumers. For instance, many vehicles and a range of modes of transport are involved in urban food supply, including transiting trucks. We recorded 500–900 vehicles transporting the selected food commodities in the cities daily. An increase in food flows involves rising logistics requirements at the city level, in terms of transport (road infrastructure, traffic, and congestion), as well as warehouses, wholesale markets, and cool storage.
City–Hinterland Connections
In the West African context, physical access to markets, commonly conceptualized as distance, travel time, or travel costs, is a major component of overall market access due to high transport prices in the region, coupled with poor efficiency (Teravaninthorn and Raballand, 2009). Moreover, formal and informal barriers on roads and at border crossings add to travel time and costs (Akoto-Danso and Karg, 2020). According to OECD/SWAC (2013), the distance to market measures how easily goods, information, capital, and labor move between two locations. Distance and transport cost were key parameters in the early development of spatial economic models, shaping spatial settlement patterns (the “central place theory” by Christaller, 1968) and agricultural land use around these settlements (Thünen, 1826). Therefore, farmers close to urban areas can benefit more from urban demand for food and higher incomes than their more remote counterparts. For instance, several studies have confirmed a positive relationship between proximity to the urban center and farm profitability (Jayne et al., 2018; Vandercasteelen et al., 2018). Our aggregated data, not further specified according to product or season, showed that all cities relied on local sources for their food supply, albeit to different degrees (Figure 8). Bamenda and Tamale sourced a particular high portion of their total food requirements from their local hinterland, while the proportion of local sources to total inflows was considerably smaller in Ouagadougou and Bamako. Although the data do not provide information on the proportion of subsistence vs. commercial farmers, and the level of marketing in the source regions, other indicators support how proximity to cities facilitates access to food value chains and urban markets: first, there are relatively more connections between cities and locations nearby (compared with distant locations), characterized by a higher number of trips, a larger share of small vehicles, and accordingly, smaller unit quantities, which are an indication for direct marketing. Second, a higher share of rural sources in the vicinity, compared with more distant areas, indicates a higher share of products directly from the farm-gate. Rural sources can include farms and rural assembly markets; urban sites are more difficult to interpret: they can be assembly markets absorbing produce from nearby rural areas, or wholesale markets sourcing from distant areas, too.
Although distance contributes to explaining spatial structures in food trade, in particular when considering city–hinterland connections, it is not the only factor. Cities do not exist in isolation but are part of the wider food distribution network comprising local, regional, and global scales. Cities and markets are intertwined and cities are, similar to market places, integrated into higher- and lower-level urban structures.
Food Networks and City Functions
Taking into account the flow of food out of cities in addition to inflows, provides insights into the way food distribution systems are structured in space and into the role of cites as nodes in these systems. Our data show that cities are structuring elements of the food supply chain: short incoming travel distances with smaller unit quantities often go along with long outgoing travel distance with larger unit quantities, and vice versa. As mentioned, the degree to which local sources contributed to total urban food inflows varies greatly. Bamenda and Tamale sourced 44 and 29%, respectively, of total food inflows from their local hinterland, compared with 7 and 8% for Bamako and Ouagadougou. Thus, the secondary cities relied more on proximate sources and therefore exhibited overall smaller catchments than the capital cities. They also relied more on lower rank sources, including rural locations and small towns. The capital cities sourced similar absolute quantities from their hinterland than the smaller cities, but in addition relied more on distant sources. Apart from product-specific and seasonal factors, the catchment size has to do with their higher market demands that need to be met and with the cities' position in the network of settlements and the market function, which they represent.
The spatial arrangement of settlements and the flow of services and goods between them has been traditionally described by hierarchical structures, including the Central Place Theory (Christaller, 1968), according to which smaller settlements, serving smaller catchments, are nested into the larger catchment of larger settlements. Applied to the flow of food, the hierarchy of markets as well as their catchment areas increase from production to consumption. Early analyses described the spatio-temporal mechanisms of food distribution in West Africa through traditional periodic markets at different hierarchies in terms of varying importance of their wholesaling function (Hill, 1966; McKim, 1972). Tracey-White (2005) introduced a classification of markets at different hierarchical levels, such as rural primary markets, assembly markets, wholesale markets, and retail markets: rural primary markets, which are usually arranged on a periodic basis, are characterized by direct sales by producers and retail to rural consumers; they can also perform an assembly function. At assembly markets, greater quantities of produce are traded, and are often combined with rural and town markets. Wholesale markets are located within or near major cities and may be supplied by assembly centers in rural areas or directly from farms (Tracey-White, 2005). Secondary cities, such as Tamale, or Bobo-Dioulasso in Burkina Faso, are often assembly and wholesale markets for agricultural goods, as demonstrated in this study for maize. While traditional periodic markets still play an important role today in channeling cereals from rural areas to Tamale (Karg et al., 2018), marketing channels are different for other crops. For instance, fresh fruits and vegetables are more likely to be channeled to the city directly from the farm-gate without passing through different levels of hierarchy markets first (section Perishability and Supply Chain Length).
The capital cities of Ouagadougou and Bamako act as retail markets, that is at the highest hierarchical level, for many products. Additionally, they act as hubs for the disaggregation of imported goods and also a limited number of domestic goods. Outflows amounted to 22 and 39% of the inflows, respectively, for Bamako and Ouagadougou, with rice accounting for 29 and 41% of total outflows. Most outflows went to urban locations. Thus, direct recipients of redistributed goods were mainly towns of different sizes that in turn may supply their rural hinterlands to meet the needs of rural people who are increasingly dependent on the market for food (Allen and Heinrigs, 2016). This illustrates that food flows are not always uni-directional, moving from rural to urban and from low to high hierarchical levels.
Transport Networks and Accessibility
Our study showed that Tamale acts as an assembly and wholesale market for certain grains, collecting produce from nearby locations and exporting it at large scale to the major urban centers in the country. The city assembles directly from the producer as shown by the high share of rural sources and has the highest share of outflows (75%) among the cities. Studies suggest that small- and medium-sized cities are more integrated in the agriculturally dominated hinterland and stress the function of these centers for providing services, such as agricultural input and output markets and processing facilities, to the surrounding areas, and thereby offering opportunities for regional development (Andersson Djurfeldt, 2015; Agergaard et al., 2019).
The example of Tamale shows how rural producers are integrated into national, even international, supply chains through a functioning market and transport network and thereby access urban markets elsewhere. According to Satterthwaite and Tacoli (2003), rural producers' physical access to markets is determined by transport links not only connecting producer areas to local urban centers but also connecting local small and intermediate urban centers to other markets.
The traffic volume caused by transit vehicles on urban roads can further shed light on the integration of cities into transport networks. Most transits were recorded in Tamale, where on average 95 trucks per day passed through the city. This is due to Tamale's location on a major north–south corridor linking Sahelian countries with the port (Torres and van Seters, 2016), the production areas, and large urban consumption centers in Ghana.
At the same time, Tamale can benefit from these functional transport links for fast transport of aggregated produce to the country's large urban centers in the south. A lack of functioning transport links may partly explain the situation in Bamenda: the city relies as much on local sources as Tamale and is located in a favorable agricultural production environment, but it trades only few products across longer distances and relies mainly on its wider hinterland for outbound flows. The low level of transit flows (7 trucks/day) confirms the poor road infrastructure in Bamenda and its minor importance beyond the city–hinterland scale. For instance, small quantities of oranges from Nigeria to Cameroon represented the only cross-border transits moving through Bamenda.
Length of Supply Chains
The cities' functions and their reliance on specific territories for food supply not only depend on their size and their position in the food network, but they also differ according to the type of product and season, that is one city can have different functions.
Perishability and Supply Chain Length
Perishable products are commonly associated with very strong territorial links, in other words more perishable food is produced close to cities, where cool storage and transport are lacking, such as in many countries of Africa and Asia (Moustier, 2017). A strong relationship between product and distance traveled has been documented for leafy vegetables, such as amaranth and lettuce, which, after one day, are no longer fresh (Bon et al., 2010; Moustier, 2017; Lemeilleur et al., 2019). Therefore, these commodities are produced in urban and peri-urban agriculture in many cities in Africa and Asia, including our study cities (Karg et al., 2016; Bellwood-Howard et al., 2021). This is why these products are not part of the flows analyzed and discussed in this article (section Analysis). However, this does not apply to fruits and vegetables in general. Our data show that fruits and vegetables covered a range of distances and originated both from the local hinterland and from across borders. For instance, tomato, avocado, orange, and banana traveled long distances and were traded within the region such as between Ghana and Burkina Faso. On the other hand, large shares of particular vegetables, such as cabbage, cucumber, and eggplant for Bamako, and zucchini (Cucurbita pepo subsp. pepo convar. giromontiina), tomato, and spring onion for Ouagadougou, were produced in the local hinterland, with shares of up to 100% in specific seasons (Supplementary Appendix 2). The high contribution of the local hinterland to the supply of these products can be due to their perishable nature, but possibly can also be explained by higher margins from producing high-value crops, such as vegetables, close to the city, a relationship, which was described in von Thünen's (1826) early model on agricultural land use around cities and has been demonstrated in different studies (Jayne et al., 2018; Vandercasteelen et al., 2018).
The term ‘short supply chain' is commonly used to refer to a limited number of intermediaries and/or short distances. According to Moustier (2017), relational proximity refers to a small number of intermediaries and is a characteristic of food chains, whatever their spatial length, although it is higher in shorter chains. Thus, spatial proximity and relational proximity are two different concepts (Stein and Santini, 2021). Allen and Heinrigs (2016) noted that food chains are short for “perishable goods like vegetables and fruit,” with generally zero to one intermediary between producers and consumers. This is in line with our data: apart from few exceptions, fresh vegetables (excluding dried onion), fruits, and livestock showed no or very low levels of outflows indicating in situ consumption, whereas most dry grains showed high levels of outgoing flows. This suggests that perishable products cover fewer intermediaries before consumption compared to storable products; that is, they exhibit short supply chains in terms of the number of intermediaries, while they can cover long distances. Thus, one has to differentiate between highly perishable products, such as leafy vegetables, which are usually transported over short distances, and perishable products, including a variety of fresh fruits and vegetables, which can travel long distances but exhibit shorter food chains in terms of relational proximity, and less perishable products, such as onions, which can travel long distances and cover a number of intermediaries.
Seasonal Patterns
The length of supply chains also depends on the season. Lemeilleur et al. (2019) showed for Rabat (Morocco) how imports are mobilized in periods of seasonal unavailability of local vegetables. Moustier (2017) demonstrated accordingly that peri-urban tomato and cabbage supply varies highly, depending on the season. Our data confirm the impact of seasonality on the length of supply chains and the geographical source. In some cases, we observed a seasonal change in the origin of food products, from the hinterland to more distant national or intra-regional sources (section Origin of Food Flows). In other cases, cities seasonally relied on the global market for some specific products. According to Torres and van Seters (2016), countries use import restrictions to protect local producers during major production seasons. During off-seasons, some products, seasonally available at the national level, are imported or sourced from overseas, such as onion and potato entering Bamako. Thus, for some products, seasonal variations imply shifting from national to intra-regional or international production. These results are in line with previous findings (Joubert et al., 2018; Sibanda and von Blottnitz, 2018) that showed for southern African countries, how imports complemented domestic production in times of seasonal shortages. Thus, seasonal variations can highly influence the complexity of food supply chains, the distance traveled by some products, and the way food is transported to the city.
Intra-Regional Trade
Our analysis revealed significant intra-regional food flows for specific products including perishable products, such as tomato, avocado, and orange. These data stem from inflows to cities as well as from transit flows that passed through our study cities. According to OECD/SWAC (2013), there is no reliable and systematic source of information about the size of the intra-regional market, in terms of either amounts traded or the direction of flows. It is also largely informal and therefore poorly documented [World Bank, Food and Agriculture Organization of the United Nations (FAO), 2021]. Our data on major cross-border flows can thus enrich the discussion regarding intra-regional food flows. The highly different agro-ecological and climatic conditions induce complementarities in agricultural production and directly impact intra-regional food flows. Some crops are specific to certain climates, and as such to relatively enclosed territory. This is the case for roots, plantains, and tubers produced in Ghana's tuber belt and other coastal countries, leading to increasing levels of tuber and plantain-based consumption toward the southern part of West Africa (Drechsel et al., 2007). As their production is very localized, these products are traded within the region, from coastal to Sahelian countries (Figure 6). Our data also confirm flows of imported goods from coastal to landlocked countries. Our data not only provide detailed information on major north–south and south–north flows, but they also reveal major supplier countries for specific products, such as Niger for onion, Burkina Faso for cattle, and Senegal for fish, driven by agricultural and trade policies, as well as specific projects, such as large-scale irrigation schemes (Figure 6; Supplementary Appendix 3).
Policy Implications
Food System Resilience
Some scholars consider spatial scale of food distribution a key factor in food system resilience. This can include short supply chains (Vieira et al., 2018), or the reliance on multiple scales to enhance system resilience (Battersby, 2014; Schipanski et al., 2016), whereas a heavy dependence on the global food market is often considered risky. Food system resilience is a multi-faceted concept and whether certain scales of food distribution enhance systemic resilience is highly context-specific. Therefore, our data alone cannot be the basis for resilience assessment, but they provide evidence on the spatial linkages between a city and its source regions, which can support the assessment of a city's reliance on specific regions, and in turn predict shortages, such as when crop production in a specific region fails due to climatic and other shocks. The analysis can be commodity- or production area-specific or cut across commodities as in the case where the armed conflict in Cameroon's Anglophone regions has severely constrained farming activities and trade, including in Bamenda's local hinterland, resulting in acute food insecurity (USAID, 2020). Future research may explore the relevance of diversity of agriculture production for supply continuity and the nutritional value embedded in food flows for healthy diets, as part of resilient urban food systems. Our analysis also revealed major transport channels and cities' vulnerabilities in case of disruptions, such as border closure or road blockages. For instance, during the ongoing COVID-19 pandemic, in West Africa, cross-border trade of perishable produce in particular has faced severe difficulties due to restrictions imposed by governments (Ross, 2020). Policy action to prepare for and adapt to infrastructure disruptions can include diversifying distribution networks, investing in local food storage, but must account for local context. Resilience-enhancing measures for climate change-related shocks include investing in early warning systems, risk transfer mechanisms (social protection and insurance), and promoting climate resilient good practices at the farm level and along the value chain, based on risk-driven policies and planning processes (Carucci et al., 2019).
Integrated Urban Networks
A shift of focus from the city as a focal point consuming food from external sources toward the city as one node in a network of cities has implications for policy. It calls for an integrated multi-level policy process that takes into account the local, national, regional, and international scale. Steinhübel and Cramon-Taubadel (2021) showed the effects of polycentric urbanization patterns on agricultural intensification and off-farm employment, and de Bruin et al. (2021) discussed how dispersed urbanization patterns, rather than centralized ones, can connect rural and urban regions. Our study showed that the cities sourced between more than 60% (Bamako, Ouagadougou) and 92% (Tamale; Bamenda: 80%) of their largely unprocessed food supplies from national sources, thereby relying to a large degree on rural places and towns, which in turn source from their rural hinterland. Specifically, small producers can be integrated into national value chains if integrated into transport and market networks. For example, rural producers in Tamale's hinterland are linked to the countries' large urban centers through Tamale's aggregation and wholesale function. To improve connections between higher-level urban markets and food producers requires investments in road and other transport infrastructure, from the city–hinterland to the national scale. Thus, the notion of food networks can support the development of inclusive food systems by integrating smallholders elsewhere.
Opportunities at the City Level
With growing cities and increasing rural–urban supply chains “the center of gravity in Africa's food system moves to urban areas,” increasingly managed by new actors including mayors, city councils, and urban planners (Haggblade, 2020). This has been demonstrated by the Milan Urban Food Policy Pact, an agreement among cities to develop more sustainable urban food systems, which has been signed by over 200 city mayors (https://www.milanurbanfoodpolicypact.org/). Cities can apply strategies and investments to manage agricultural input and output markets, food processing, and food safety systems, and to eventually enhance food system resilience. These include the recognition and promotion of peri-urban agriculture, the preservation of agricultural land areas through land use planning and zoning as well as targeted investments in infrastructure and services, such as allocating spaces to wholesale and livestock market, managing (cold) transport to and within growing cities, storage and warehousing, and providing associated services related to finance, communication, and food safety. New governance structures require political will, the use of available policy and planning instruments (infrastructure and logistics, public procurement, licenses, land use planning), the involvement of different government departments and jurisdictions (local and provincial), new organizational structures at different scales (municipal, district etc.), as well as new tools and monitoring frameworks (Carey and Cook, 2021).
Conclusions
Nested at different scales of food distribution from local to international, cities act as recipients and hubs of food flows. The way food networks are structured in space has to do with the market and transport network and the position of the city within these networks (organizational and physical). Thereby, the size and function of a city is strongly linked to its integration into higher- and lower-level urban and market structures. For instance, Tamale, a regional capital and secondary city, acts as an assembly market for surrounding producers; it is therefore highly integrated into its agricultural hinterland and supplies the country's large urban centers. The capital cities of Bamako and Ouagadougou, on the other hand, source more food from lower-level urban centers further away. While the relative contribution of local sources to food inflows therefore highly differed in the four study sites, all cities exhibited strong linkages with locations in their local hinterland, including smallholder farmers accessing the urban retail and wholesale market. At a regional scale, food flows are strongly linked to farming system zones. City functions are not static: they can vary depending on product and season. For instance, while some perishable products do cover long distances, they exhibit short organizational supply chains and for some products, cities rely on international sources during the off-season.
This study contributes empirical evidence to a region that lacks systematic, cross-country, and multi-temporal data on food distribution networks. It widens the perspective on the role of cities in food distribution away from a focus on urban consumption toward a city's multi-functional role as a consumption, aggregation, and disaggregation center. Thus, the study provides evidence in support of the neglected intermediary segments by putting the city, including its facilities, services, and infrastructure into focus. The study also calls for taking context into account, such as a city's specific function in the wider food network and accounting for product- and season-specific variations. This has implications for policy, including bringing into focus and strengthening midstream segments, such as market and transport links, and the integration of cities in multi-scalar polycentric urbanization networks. New governance structures, centered in cities, require the use of available instruments as well as new intersectoral policies at different administrative levels.
Funding
This study was funded by a DFG research fellowship (Grant Number KA 5270/1-1). Data collection was carried out as part of the project UrbanFoodPlus, co-funded by the German Federal Ministry of Education and Research (BMBF) and the German Federal Ministry for Economic Collaboration and Development (BMZ), under the initiative GlobE—Research for the Global Food Supply (Grant Numbers 031A242-A and 031A242-D). The article processing charge was funded by the University of Kassel open access fund.
Publisher's Note
All claims expressed in this article are solely those of the authors and do not necessarily represent those of their affiliated organizations, or those of the publisher, the editors and the reviewers. Any product that may be evaluated in this article, or claim that may be made by its manufacturer, is not guaranteed or endorsed by the publisher.
Statements
Data availability statement
The raw data supporting the conclusions of this article will be made available by the authors, without undue reservation.
Author contributions
HK: conceptualization, methodology, formal analysis, investigation, writing—original draft, writing—review and editing, and visualization. JB: conceptualization, formal analysis, writing—original draft, writing—review and editing, and visualization. EA-D: methodology, investigation, and writing—review and editing. PH: conceptualization and writing—review and editing. PD: writing—original draft, writing—review and editing, and funding acquisition. LA: investigation and writing—review and editing. AB: writing—review and editing, project administration, and funding acquisition. All authors contributed to the article and approved the submitted version.
Acknowledgments
We are grateful to our local partners in the study cities for their support, in particular Prof. George Nyarko from the University for Development Studies (UDS) in Tamale, Ghana, Dr. Zacharia Gnankambary and Dr. Désiré Jean-Pascal Lompo from Université de Dédougou, Dédougou, Ndzerem Stephen Njodzeka and the team from Strategic Humanitarian Services (Shumas) in Bamenda, Cameroon, and Dr. Seydou Sidibé from the Institut d'Economie Rurale (IER) in Bamako, Mali. We thank Mark Hoschek and the University of Freiburg for supporting data management, the team of the Sahel and West Africa Club (SWAC/OECD) for their contributions, Billa Samuel, who supported data collection in Bamako, Mali, and our enumerators in all four cities. The publication supports the One CGIAR initiative on Resilient Cities through Sustainable Urban and Peri-urban Agrifood Systems.
Conflict of interest
The authors declare that the research was conducted in the absence of any commercial or financial relationships that could be construed as a potential conflict of interest.
Supplementary material
The Supplementary Material for this article can be found online at: https://www.frontiersin.org/articles/10.3389/fsufs.2022.857567/full#supplementary-material
Footnotes
1.^A foodshed is the geographic location that produces food for a particular population similar to a watershed for water supply. Another aspect of the foodshed literature deals with local food systems and local food self-sufficiency in a more normative way.
2.^For a typical population in a developing country, assuming a standard population distribution, body size, ambient temperature, pre-emergency nutritional status, and light physical activity level.
3.^Unless otherwise stated, quantities in the text refer to all seasons (i.e., average quantity over the three seasons).
References
1
AgergaardJ.TacoliC.SteelG.ØrtenbladS. B. (2019). Revisiting rural–urban transformations and small town development in sub-Saharan Africa. Eur J Dev Res31, 2–11. 10.1057/s41287-018-0182-z
2
Akoto-DansoE. K.KargH. (2020). Trading Food Across West African Borders (Full Version). UrbanFoodPlus. Available online at: https://univideo.uni-kassel.de/video/Trading-Food-across-West-African-Borders-full-version/9f8eee1ab23e865b6476ce5a4d7eae19 (accessed May 8, 2022).
3
AllenT.HeinrigsP. (2016). Emerging Opportunities in the West African Food Economy. West African Papers 1. Paris: OECD Publishing.
4
Andersson DjurfeldtA. (2015). Urbanization and linkages to smallholder farming in sub-Saharan Africa: Implications for food security. Global Food Secur.4, 1–7. 10.1016/j.gfs.2014.08.002
5
BattersbyJ. (2014). The need for a diverse and responsive food system. Urban Agric. Mag.27, 10–12. Available online at: https://ruaf.org/document/urban-agriculture-magazine-no-27-climate-change-and-disaster-risk-reduction/ (accessed May 8, 2022).
6
Bellwood-HowardI.AnsahI. G. K.DonkohS. A.KorbéogoG. (2021). Managing seasonality in West African informal urban vegetable markets: the role of household relations. J. Int. Dev. 33, 874–893. 10.1002/jid.3562
7
Blay-PalmerA.SantiniG.DubbelingM.RentingH.TaguchiM.GiordanoT. (2018). Validating the city region food system approach: enacting inclusive, transformational city region food systems. Sustainability10, 1680. 10.3390/su10051680
8
BleinR.SouleB. G.DupaigreB. F.YerimaB. (2008). “Agricultural Potential of West Africa. Economic Community of West African States (ECOWAS),” in Foundation pour l'agriculture et la ruralité dans le monde (FARM).
9
BonH.de ParrotL.MoustierP. (2010). Sustainable urban agriculture in developing countries. A review. Agron. Sustain. Dev. 30, 21–32. 10.1051/agro:2008062
10
BricasN.TchamdaC.MoutonF. (Ed.) (2016). L'Afrique à la conquête de son marché alimentaire intérieur: Enseignements de dix ans d'enquêtes auprès des ménages d'Afrique de l'Ouest, au Cameroun et du Tchad. Collection ≪ Études de l'AFD ≫ 12, Agence Française de Développement.
11
BrissonE.Emile-GeayP.D'AngeloL. (2019). Systèmes d'approvisionnement et de distribution alimentaires. Étude de cas sur la ville de Niamey (Niger).Technical report 50, Agence Française de Développement (AFD).
12
CareyJ.CookB. (2021). The Milan Urban Food Policy Pact Monitoring Framework: A Practical Handbook for Implementation. Rome: FAO.
13
CarucciM.Roman MalecR.SantiniG. (2019). Beyond Urban: City-Region Food Systems for Resilient and Sustainable Development. Urbanet. Available online at : https://www.urbanet.info/beyond-urban-city-region-food-systems/ (accessed May 8, 2022).
14
ChristallerW. (1968). Die zentralen Orte in Süddeutschland: Eine ökonomisch-geographische Untersuchung über die Gesetzmässigkeit der Verbreitung und Entwicklung der Siedlungen mit städtischen Funktionen, 2nd ed. Darmstadt: Wissenschaftliche Buchgesellschaft
15
Climate-Data (2021). Climate Data Bamenda, Ouagadougou. Bamako, Tamale: Climate-data.org
16
de BruinS.DengerinkJ.van VlietJ. (2021). Urbanisation as driver of food system transformation and opportunities for rural livelihoods. Food Sec. 13, 781–798. 10.1007/s12571-021-01182-8
17
de Steenhuijsen PitersB.TondelF.NelenJ.WenninkB.IngramV.KruijssenF.AkerJ. (2021). West African Food System Resilience. Wageningen Economic Research, Report 2021-006.
18
DrechselP.GraefeS.FinkM. (2007). Rural-Urban Food, Nutrient and Virtual Water Flows in Selected West African Cities.IWMI Research Report Series 115. Colombo: IWMI.
19
DrechselP.KargH. (2018). “Food flows and waste: planning for the dirty side of urban food security,” in Integrating Food Into Urban Planning, eds Y. Cabannes, C. Marocchino. Geneva: UCL Press and FAO.
20
DrechselP.KeraitaB. (2014). Irrigated Urban Vegetable Production in Ghana: Characteristics, Benefits and Risk Mitigation.Second edition. Colombo: International Water Management Institute (IWMI).
21
ElbehriA.KaminskiJ.KoromaS.IafrateM.BenaliM. (2013). “West Africa staple food systems: an overview of trends and indicators of demand, supply, and trade,” in Rebuilding West Africa's Food Potential: Policies and Market Incentives for Smallholder-Inclusive Food Value Chains, ed A. Elbehri (Rome), 1–42.
22
FAO (2022). Technical Conversion Factors for Agricultural Commodities. Available online at: https://www.fao.org/fileadmin/templates/ess/documents/methodology/tcf.pdf (accessed May 8, 2022).
23
FAOSTAT (2014). Food Balances: Import Quantity; Production Quantity. Item codes 2761-2764, 2511, 2531, 2602, 2807. Available online at: https://www.fao.org/faostat/en/#data/FBS (accessed May 8, 2022).
24
FeldtT.KargH.Kadaour,éI.BessertL.SchlechtE. (2020). Growing struggle over rising demand: How land use change and complex farmer-grazier conflicts impact grazing management in the Western Highlands of Cameroon. Land Use Policy95, 104579. 10.1016/j.landusepol.2020.104579
25
GarrityD.DixonJ.BoffaJ.-M. (2012). “Understanding African farming systems: science and policy implications,” in Food Security in Africa: Bridging Research Into Practice, Sydney, Australia.
26
GunasekeraJ. (2012). Report of the Food Flow Mapping: Kesbewa Urban Area. Colombo: Janathakshan Guarantee Ltd.
27
HaggbladeS. (2020). Chapter 1: The Feeding Africa's Cities: Opportunities, Challenges, and Policies for Linking African Farmers with Growing Urban Food Markets and Overview, in: AGRA (Ed.), Africa Agriculture Status Report. Feeding Africa's Cities: Opportunities, Challenges, and Policies for Linking African Farmers with Growing Urban Food Markets. Nairobi, Kenya.
28
HaggbladeS.LongabaughS.BoughtonD.DembeléN.DialloB.StaatzJ.TschirleyD. (2012). Staple food market sheds in West Africa. MSU International Development Working Paper 121.
29
HarvestChoice (IFPRI) University of Minnesota. (2017). Agroecology - Farming Systems.tiff.zip. CELL5M: a multidisciplinary geospatial database for Africa South of the Sahara. Harvard DataverseV5, 7RIFT5. 10.7910/DVN/G4TBLF/7RIFT5
30
HillP. (1966). Notes on traditional market authority and market periodicity in West Africa. J. African Hist.7, 295–311.
31
JayneT. S.ChamberlinJ.BenficaR. (2018). Africa's unfolding economic transformation. J. Dev. Stud.54, 777–787. 10.1080/00220388.2018.1430774
32
JoubertL.BattersbyJ.WatsonV. (2018). Tomatoes and Taxi Ranks: Running Our Cities to Fill the Food Gap. Cape Town: African Centre for Cities, University of Cape Town.
33
KargH.Bellwood-HowardI.Akoto-DansoE. K.SchlesingerJ.ChagomokaT.DrescherA. (2018). Small-town agricultural Markets in Northern Ghana and their connection to rural and urban transformation. Eur. J. Dev. Res.31, 95–117. 10.1057/s41287-018-0171-2
34
KargH.DrechselP.Akoto-DansoE.GlaserR.NyarkoG.BuerkertA. (2016). Foodsheds and City Region Food Systems in Two West African Cities. Sustainability8, 1175. 10.3390/su8121175
35
LemeilleurS.d'AngeloL.BrissonE.BoyetA.LançonF.MoustierP. (2019). Les systèmes de distribution alimentaire dans les pays d'Afrique méditerranéenne et Sub-saharienne Repenser le rôle des marchés dans l'infrastructure commerciale. Notes techniques 51. Agence Française de Développement.
36
McKimW. (1972). The periodic market system in Northeastern Ghana. Econ. Geogr.48, 333–344.
37
MoustierP. (2017). Short urban food chains in developing countries: signs of the past or of the future?Nat. Sci. Soc. 25, 7–20. 10.1051/nss/2017018
38
MoustierP.HoldsworthM.AnhD. T.SeckP. A.RentingH.CaronP.BricasN. (2021). Priorities for Inclusive Urban Food System Transformations in the Global South. Food Systems Summit Brief.
39
MoustierP.VagneronI.ThaiB. T. (2004). Organisation et efficience des marchés de légumes approvisionnant Hanoi (Vietnam). Cahiers Agric. EDP Sci. 13, 142–147. Available online at: https://agritrop.cirad.fr/519729/ (accessed May 8, 2022).
40
NicholsonS. E. (2018). Climate of the Sahel and West Africa. Oxford: Oxford University Press.
41
OECD/SWAC (2013). Settlement, Market and Food Security. West African Futures.Paris: OECD Publishing.
42
OECD/SWAC (2020). Africapolis (database). Available online at: www.africapolis.org (accessed February 11, 2020).
43
ReardonT. (2015). The hidden middle: the quiet revolution in the midstream of agrifood value chains in developing countries. Oxford Rev. Econ. Policy31, 45–63. 10.1093/oxrep/grv011
44
ReardonT.EcheverriaR.BerdeguéJ.MintenB.Liverpool-TasieS.TschirleyD.ZilbermanD. (2019). Rapid transformation of food systems in developing regions: Highlighting the role of agricultural research and innovations. Agric. Syst.172, 47–59. 10.1016/j.agsy.2018.01.022
45
RossA. (2020). West African Food Trade Under Strain as COVID-19 Shuts Borders. Available online at: https://www.reuters.com/article/us-health-coronavirus-food-africa-idUSKBN2330RV (accessed May 8, 2022).
46
SatterthwaiteD.TacoliC. (2003). The Urban Part of Rural Development: The Role of Small and Intermediate Urban Centres in Rural and Regional Development and Poverty Reduction. Working Paper Series on Rural-Urban Interactions 9. International Institute for Environment and Development.
47
SchipanskiM. E.MacDonaldG. K.RosenzweigS.ChappellM. J.BennettE. M.KerrR. B.et al. (2016). Realizing Resilient Food Systems. Bioscience. 66, 600–610. 10.1093/biosci/biw052
48
SchreiberK.HickeyG. M.MetsonG. S.RobinsonB. E.MacDonaldG. K. (2021). Quantifying the foodshed: a systematic review of urban food flow and local food self-sufficiency research. Environ. Res. Lett. 16, 23003. 10.1088/1748-9326/abad59
49
SetoK. C.RamankuttyN. (2016). Hidden linkages between urbanization and food systems. Science352, 943–945. 10.1126/science.aaf7160
50
SibandaL.von BlottnitzH. (2018). “Food value chains in Kisumu, Kitwe, and Epworth: environmental and social hotspots,” in Urban Food Systems Governance and Poverty in African Cities.London: Routledge.
51
SmithR. H. T. (1971). “West-African market-places: temporal periodicity and locational spacing,” in The Development of Indigenous Trade and Markets in West Africa: Studies Presented and Discussed at the Tenth International African Seminar at Fourah Bay College, Freetown, December 1969, ed C. Meillassoux (London: Oxford University Press for the International African Institute), 319–346.
52
StadlmayrB. (2012). West African Food Composition Table - Table de composition des aliments d'Afrique de l'Ouest. Rome: CGIAR.
53
SteinA. J.SantiniF. (2021). The sustainability of “local” food: a review for policy-makers. Rev. Agric. Food Environ Stud. 2021, 1–13. 10.1007/s41130-021-00148-w
54
SteinhübelL.Cramon-TaubadelS. (2021). Somewhere in between towns, markets and jobs – agricultural intensification in the rural–urban interface. J. Dev. Stud.57, 669–694. 10.1080/00220388.2020.1806244
55
TeravaninthornS.RaballandG. (2009). Transport prices and costs in Africa: a review of the international corridors. Washington, DC: World Bank.
56
ThünenJ. H. (1826). Der isolirte Staat in Beziehung auf Landwirthschaft und Nationalökonomie oder Untersuchungen über den Einfluß, den die Getreidepreise, der Reichthum des Bodens und die Abgaben auf den Ackerbau ausüben. Hamburg.
57
TorresC.van SetersJ. (2016). Overview of trade and barriers to trade in West Africa: Insights in political economy dynamics, with particular focus on agricultural and food trade. ecdpm Discussion Paper 195. Maastricht: European Centre for Development Policy Management.
58
Tracey-WhiteJ. (2005). Rural–Urban Marketing Linkages: An Infrastructure Identification and Survey Guide.FAO Agricultural Service Bulletin 161. Rome: Food and Agriculture Organization of the United Nations (FAO).
59
TschirleyD. (2020). “Chapter 2: Opportunities in Africa's growing urban food markets,” in Africa Agriculture Status Report. Feeding Africa's Cities: Opportunities, Challenges, and Policies for Linking African Farmers with Growing Urban Food Markets, ed AGRA (Kenya: Nairobi).
60
USAID (2020). Food Assistance Fact Sheet. Cameroon: USAID.
61
VandercasteelenJ.BeyeneS. T.MintenB.SwinnenJ. (2018). Cities and agricultural transformation in Africa: evidence from Ethiopia. World Dev.105, 383–399. 10.1016/j.worlddev.2017.10.032
62
VeldhuizenL. J.GillerK. E.OosterveerP.BrouwerI. D.JanssenS.van ZantenH. H.SlingerlandM. A. (2020). The missing middle: connected action on agriculture and nutrition across global, national and local levels to achieve sustainable development goal. Global Food Secur.24, 100336. 10.1016/j.gfs.2019.100336
63
VieiraL. C.Serrao-NeumannS.HowesM.MackeyB. (2018). Unpacking components of sustainable and resilient urban food systems. J. Clean. Prod.200, 318–330. 10.1016/j.jclepro.2018.07.283
64
WegerifM. C. A.WiskerkeJ. S. C. (2017). Exploring the staple foodscape of Dar es Salaam. Sustainability9, 1081. 10.3390/su9061081
65
World Bank Food and Agriculture Organization of the United Nations (FAO). (2021). A Blueprint for Strengthening Food System Resilience in West Africa: Regional Priority Intervention Areas.Washington, DC: World Bank and UN FAO.
66
ZhouY.StaatzJ. (2016). Projected demand and supply for various foods in West Africa: implications for investments and food policy. Food Policy61, 198–212. 10.1016/j.foodpol.2016.04.002
Summary
Keywords
foodshed, food supply chain, urban food system, urbanization, central places, GIS, spatial analysis
Citation
Karg H, Bouscarat J, Akoto-Danso EK, Heinrigs P, Drechsel P, Amprako L and Buerkert A (2022) Food Flows and the Roles of Cities in West African Food Distribution Networks. Front. Sustain. Food Syst. 6:857567. doi: 10.3389/fsufs.2022.857567
Received
18 January 2022
Accepted
26 April 2022
Published
31 May 2022
Volume
6 - 2022
Edited by
Amy Ickowitz, Center for International Forestry Research (CIFOR), Indonesia
Reviewed by
Stepha McMullin, World Agroforestry Centre, Kenya; Marc Wegerif, University of Pretoria, South Africa
Updates
Copyright
© 2022 Karg, Bouscarat, Akoto-Danso, Heinrigs, Drechsel, Amprako and Buerkert.
This is an open-access article distributed under the terms of the Creative Commons Attribution License (CC BY). The use, distribution or reproduction in other forums is permitted, provided the original author(s) and the copyright owner(s) are credited and that the original publication in this journal is cited, in accordance with accepted academic practice. No use, distribution or reproduction is permitted which does not comply with these terms.
*Correspondence: Hanna Karg hanna.karg@gmx.de
This article was submitted to Land, Livelihoods and Food Security, a section of the journal Frontiers in Sustainable Food Systems
Disclaimer
All claims expressed in this article are solely those of the authors and do not necessarily represent those of their affiliated organizations, or those of the publisher, the editors and the reviewers. Any product that may be evaluated in this article or claim that may be made by its manufacturer is not guaranteed or endorsed by the publisher.