Abstract
While the value of agriculture to the Canadian economy is well established, its extensive indirect and induced value through upstream and downstream industries is not. Input-Output (I/O) analyzes are a common tool that measure the direct, indirect and induced impacts of an industry to the entire economy. We reviewed I/O analyzes that used economic multipliers to estimate the total contribution of agricultural industries to Canada's economy. Reports underwent data extraction for output, Gross Domestic Product (GDP), jobs, labor income and taxes generated. We found that when indirect and induced economic impacts are considered, the value of agricultural industries is much greater than traditional valuations indicate. Beef and canola were the two largest industries in terms of GDP and jobs, with direct impacts constituting less than half of their total impacts. Recent and thorough I/O analyzes are available for only a limited number of agricultural industries. There is a need for I/O analyzes covering key agricultural industries at the regional and national level using uniform methodology and recent data and multipliers. This information is essential to gain a systemic understanding of the true economic value of agriculture and to inform policies and investment that maximizes the potential of agricultural industries.
Introduction
In Canada, primary agriculture—defined as work that is performed within the boundaries of a farm, nursery or greenhouse—accounts for just over 2% of Gross Domestic Product (GDP) and employs 269,300 people (Agriculture Agri-Food Canada, 2021). However, the overall contribution of agriculture to Canada's economy goes far beyond the work performed within farm boundaries. Primary agriculture is a key building block for downstream food and beverage processing industries, retailers, foodservice providers and other industries that rely on agricultural inputs. Moreover, primary agriculture helps support upstream industries and knowledge economies from seed, fertilizers and other chemical inputs to engineering and veterinary services, pharmaceuticals and academia. These are the direct impacts (businesses that incur expenses and receive revenue as a direct consequence of farm operations) and some indirect impacts (suppliers of the industries that are directly affected). In addition to these more obvious impacts, the induced impacts of agriculture arise from shifts in spending on goods and services because of changes to the payroll of the directly and indirectly affected industries and their employees.
Standard valuations of agriculture in Canada, the U.S. and the E.U. follow economic approaches that account for primary agriculture and some downstream sectors that rely on its inputs such as food and beverage processing, food retail and foodservice providers (Statistics Canada, 2020; USDA, 2020; Eurostat, 2021). By these boundaries, Canada's agriculture and agri-food system accounted for just over 7% ($139.3 billion) of GDP and employed 2.1 million people, which represented 11% of jobs in Canada (Statistics Canada, 2020). Similarly, in the U.S. agriculture, food and related industries contributed approximately 5% (USD$1.109 trillion) of GDP and provided 11% of U.S. employment (USDA, 2020). In Europe, agriculture accounted for 1.3% (€173.3 billion) of GDP and 4.5% of employment (Eurostat, 2021). This figure was calculated as the difference between the value of everything that the E.U. primary agricultural sector produced and the costs of the services and goods used in the production process, adjusted for taxes and subsidies on products. The goods and services used in the production process include farmers' purchasing items like feed and veterinary services, seeds and plants, fertilizers, herbicides, insecticides, and pesticides, plus fuel for farming equipment. Subtracting the cost of goods and services paints a conservative estimate of the role of agri-food in the economy as it fails to account for GDP generated by these purchases.
A systemic understanding of the far-reaching economic effects of agricultural industries is essential to inform policy and the level of investment from private and public sectors (Dietzenbacher et al., 2013). Input-output (I/O) models capture the systemic effects of a sector through the economy (Johnson and Noguera, 2012). They represent the interdependencies among sectors to measure the direct, indirect and induced impacts of one sector or industry (Leones et al., 1994; Miernyk, 2020). Canada lacks I/O analyzes of its agricultural industries, though some industries and provincial governments have published their own analyzes. We reviewed published I/O analyzes that measured the total contribution of various agricultural industries in terms of output, GDP, jobs, labor income, and tax revenue to synthesize what is known about the true value of agriculture in Canada and where gaps in knowledge need to be addressed.
Methods
Data sources
Sources represented a broad spectrum of actors across Canadian agriculture including industry, academia and all levels of governments. A keyword matrix was used to guide literature search by combining the following keywords:
- Terms for methodology: Input-Output (I/O) analysis, Multiplier analysis, Direct, Indirect, and/or Induced;
- Terms for metrics: Added value, Gross domestic product (GDP), Jobs, Employment, Labor / Labor income, and/or Tax revenue;
- Terms for agricultural sectors: Animal production, Crop production, Horticulture, Canola, Soybean, Soy, Wheat, Oats, Barley, Malting barley, Rye, Flaxseed, Dry peas, Lentils, Mustard seed, Canary seed, Sunflower seed, Chickpeas/Garbanzo beans, Sugar, Maple syrup, Maple tree, Potatoes, Tree fruit, Fruit, Vegetables, Corn, Tomato, Cucumber, Green pea, Bean (Green and Wax), Cabbage, Cauliflower, Broccoli, Brussels sprout, Carrot, Rutabaga, Turnip, Beet, Radish, Shallot, Onion (Green, Spanish, Yellow, Cooking), Celery, Lettuce, Spinach, Pepper, Pumpkin, Squash, Zucchini, Asparagus, Berries, Apple, Pear, Plum, Cherry, Peach, Apricot, Grape, Strawberry, Raspberry, Cranberry, Blueberry, Saskatoon, Greenhouse, Nursery, Mushroom, Beef, Pork, Hogs, Chicken, Turkey, Poultry, Eggs, Dairy, Sheep, Lamb, Irrigation, Agri-business, Seed, Fertilizer, Pesticide, and/or Herbicide;
- Terms for locations: Canada, national, Alberta (AB), British Columbia (BC), Manitoba (MB), Nova Scotia (NS), Newfoundland (NF), Northwest Territories (NT), Nunavut (NU), Ontario (ON), Quebec (QC), Prince Edward Island (PE), Saskatchewan (SK), and/or Yukon (YT).
Iterations were repeated with terms for each key agricultural industry in Canada. All principal field crops and horticultural production, and all livestock and animal product industries listed by Statistics Canada were searched separately. Every province/territory and its abbreviation were searched separately to obtain provincial/territorial-level literature. Snowballing and reference mining was also done. Academic and international databases including the United States Department of Agriculture (USDA), Eurostat, World Bank and the Food and Agriculture Organization of the United Nations (FAO) were searched for comparative assessment.
Papers were excluded if they did not measure the direct, indirect and induced impacts of an industry or if they did not use I/O methodology. Papers published between January 2005 and January 2022 were retained. A total of 15 publications were retained for this review. Publishers of the retained papers included Canola Council of Canada, Soy Canada, Beef Cattle Research Council, Chicken Farmers of Canada, Dairy Farmers of Canada, Canadian Horticultural Council, provincial governments of Alberta and Prince Edward Island, BC Agriculture Council & Investment Agriculture Foundation, BC Dairy Association, Ontario Agri-Business Association, Alberta Irrigation Projects Association, Econometric Research Ltd., and Canadian Agri-Food Policy Institute.
Data extraction and analysis
Papers underwent quantitative data extraction guided by a question-driven Supplementary Table S1. We extracted five key measurements from papers: GDP, jobs, labor income, output and tax revenues. Monetary figures were recorded in $CAD billion, unadjusted for the year of data used in the paper. All figures are for the most recent year for which the paper reported data, though some reports took an average value of a multi-year dataset. GDP was defined as the unduplicated added value of goods and services produced annually. Jobs were defined as the number of annual full-time equivalent (FTE) jobs that an industry accounted for annually. Labor income was defined as the industry's contributions to the income of workers and other members of society annually. Output was defined as the total gross value of goods and services produced by the industry annually Tax revenues were defined as the total federal, provincial and municipal taxes generated by an industry annually.
Data were analyzed by qualitative and quantitative analysis using Microsoft Excel (Silverman, 2015). A narrative synthesis framework was used to synthesize studies and analyze relationships within and between studies (Popay et al., 2006). The first element of the analysis—developing a preliminary synthesis—was done through tabulation and grouping of data. The second element—relationships within and between studies—was explored using basic statistical analysis as a descriptive tool, qualitative case descriptions, and conceptual mapping. Narrative synthesis was considered appropriate due to the small number of studies reviewed, the interdisciplinary nature of I/O analysis content, and the heterogeneity of I/O methodologies included.
I/O methodology
I/O models consist of a system of linear equations, each one of which describes the distribution of an industry's product throughout the economy (Miller and Blair, 2009). One is concerned with the activity of industries that produce goods (outputs) and consume goods from other industries (inputs) in the process of producing each industry's own output. At the heart of I/O analyzes are economic multipliers, which show linkages between a change in output in one industry and its ripple effects on others (Cross and Ghanem, 2006). Economic multipliers can be understood as the strength of re-circulating initial expenditures within the economic system. In Canada, the Statistics Canada I/O Model was widely used by reports in this review. Statistics Canada publishes industry by industry input-output multipliers that show inter-industry transactions, making them suited to be used as the basis for I/O modeling (Statistics Canada, 2022a).
Results
State of knowledge and gaps
Fifteen reports published between 2005 and 2021 were included in our study and subsequently synthetized (Table 1). The only national-level multi-industry I/O analysis was published by the Canadian Agri-Food Policy Institute (2005) using data from 1999. Industries that have completed I/O analyzes at the national level include canola and horticulture. Industries that have published I/O analyzes at both the national and provincial or regional level include soy, beef, chicken, turkey and dairy. At only the provincial level, I/O analyzes are available for sugar beet (Alberta), potatoes (Prince Edward Island), crop input supply industries (Ontario) and the irrigation industry (Alberta). One province—British Columbia—has published a provincial-level I/O for crop and animal production, and southern Ontario has published an I/O analysis for agriculture and food systems in that region of the province.
Table 1
| Industry | Region | Publisher | Year of data | Parameters of the analysis | Direct GDP | Total GDP | Total labor income | Total output | Direct jobs | Total jobs | Total tax revenue |
|---|---|---|---|---|---|---|---|---|---|---|---|
| Canola | Canada | Canola Council | 2015 | Canola and canola product production | 10.90 | 26.70 | 11.20 | 74,000 | 177,000 | ||
| Soybeans | Canada | Soy Canada | 2014 | Soybean industry | 2.20 | 5.64 | 12.73 | 20,809 | 54,435 | 1.27 | |
| Sugar | AB | Alberta Sugar Beet Growers' Association | 2009-2019 | Sugar beet production and processing (AB) | 0.12 | 0.20 | 0.05 | 975 | 2,150 | ||
| Horticulture | Canada | Canadian Horticultural Council | 2004-2005 | Fruit, vegetable, and mushroom industries | 6.64 | 13.41 | 7.95 | 29.05 | 90,139 | 197,438 | 5.84 |
| Potatoes | PI | Government of Prince Edward Island | 2016 | Potato industry (PI) | 0.23 | 0.53 | 0.24 | 1.35 | 1,768 | 5,016 | 0.05 |
| Potatoes | Canada | Government of Prince Edward Island | 2016 | Potato industry (PI) | 0.23 | 0.78 | 0.38 | 1.89 | 1,818 | 7,086 | 0.07 |
| Beef | Canada | Beef Cattle Research Council | 2018-2020 | Cow-calf, backgrounding, feeder/feedlots | 19.60 | 51.60 | 11.70 | 71,453 | 347,352 | ||
| Beef | Western Canada | Beef Cattle Research Council | 2018-2020 | Cow-calf, backgrounding, feeder/feedlots (Western) | 14.80 | 38.80 | 51,923 | 258,130 | |||
| Beef | Eastern Canada | Beef Cattle Research Council | 2018-2020 | Cow-calf, backgrounding, feeder/feedlots (Eastern) | 4.80 | 12.80 | 19,530 | 89,222 | |||
| Beef | AB | Beef Cattle Research Council | 2018-2020 | Cow-calf, backgrounding, feeder/feedlots (AB) | 10.30 | 20.50 | 26,158 | 80,724 | |||
| Chicken | Canada | Chicken Farmers of Canada | 2019 | Chicken farming and processing | 2.80 | 5.76 | 87,200 | 2.20 | |||
| Turkey | BC | BC Dairy, Egg and Poultry Industries | 2015 | Turkey farming and processing (BC) | 0.14 | 1,758 | 0.04 | ||||
| Turkey | Canada | BC Dairy, Egg and Poultry Industries | 2015 | Turkey farming and processing | 0.37 | 1.11 | 14,301 | 0.36 | |||
| Dairy | Canada | Dairy Farmers of Canada | 2009 | Dairy production and processing | 4.42 | 15.10 | 49.99 | 50,753 | 215,104 | 3.02 | |
| Dairy | BC | BC Dairy Association | 2019 | Dairy cattle, milk production and dairy product manufacturing (BC) | 1.23 | 3.77 | 12,470 | 0.29 | |||
| Dairy | BC | BC Dairy, Egg and Poultry Industries | 2015 | Dairy industry (BC) | 1.51 | 14,759 | 0.24 | ||||
| Dairy | AB | BC Dairy, Egg and Poultry Industries | 2015 | Dairy industry (AB) | 2.03 | 17,743 | 0.36 | ||||
| Dairy | SK | BC Dairy, Egg and Poultry Industries | 2015 | Dairy industry (SK) | 0.41 | 4,805 | 0.07 | ||||
| Dairy | MB | BC Dairy, Egg and Poultry Industries | 2015 | Dairy industry (MB) | 0.58 | 7,955 | 0.09 | ||||
| Agri-business | ON | Ontario Agri Business Association | 2016 | Crop input supply, grain elevators and feed manufacturers (ON) | 1.66 | 3.24 | 6.95 | 8,346 | 29,823 | 0.05 | |
| Irrigation industry | AB | Alberta Irrigation Projects Association | 2011 | Irrigation industry (AB) | 0.53 | 3.64 | 2.36 | 55,889 | 1.30 | ||
| Crop / animal production | BC | BC Agriculture Council Investment Agriculture Foundation | 2019 | Crop and animal production (BC) | 1.87 | 3.90 | 8.49 | 35,100 | 55,000 | 0.95 | |
| Agriculture | Southern ON | Econometric Research | 2011 | Agriculture (southern ON) | 7.49 | 15.15 | 8.90 | 29.29 | 115,106 | 214,063 | 4.40 |
| Agriculture | Canada | Canadian Agri-Food Policy Institute | 1999 | Agriculture (Canada) | 8.79 | 16.09 | 8.33 | 37.22 | 160,541 | 357,521 | 5.28 |
Summary of input-output analyzes by industry and region.
I/O analyzes are unavailable for many grains including wheat, oats, barley, and lentils. Further, there are no I/O analyzes for fruit and vegetable industries other than a Canada-wide I/O of horticulture and the Prince Edward Island potato industry. Eggs, pork, aquaculture, and farming also lack I/O analyzes. There is a dearth of I/O information about support industries such as seeds, fertilizers, herbicides, pesticides, veterinary services and pharmaceuticals. Specialty products such as maple syrup also lack I/O analyzes.
Top industries
The most prominent agricultural industry in Canada was beef. For Canada as a whole, the cattle sector contributed $51.6 billion to GDP and was directly or indirectly associated with creation of nearly 350,000 full-time equivalent jobs. Canola was the second most lucrative sector in Canada, contributing $26.7 billion to GDP and accounting for 177,000 jobs.
The distribution of impacts within and between industries and regions
There were large differences between the direct contributions of a sector and its total, including indirect and induced, impact. Within industries, the distribution of impacts differed by region (Figure 1). For beef, direct impacts constituted between one quarter and one half of total GDP and jobs, while indirect impacts, contributed mainly by industry support provided by other non-agricultural sectors, constituted the next largest share. Direct impacts were larger in western provinces. In Alberta, the direct GDP of beef was half of the total GDP; in eastern Canada, the direct GDP of beef was just one third of total GDP of beef, which indicates that the indirect and induced impacts are an important consideration.
Figure 1
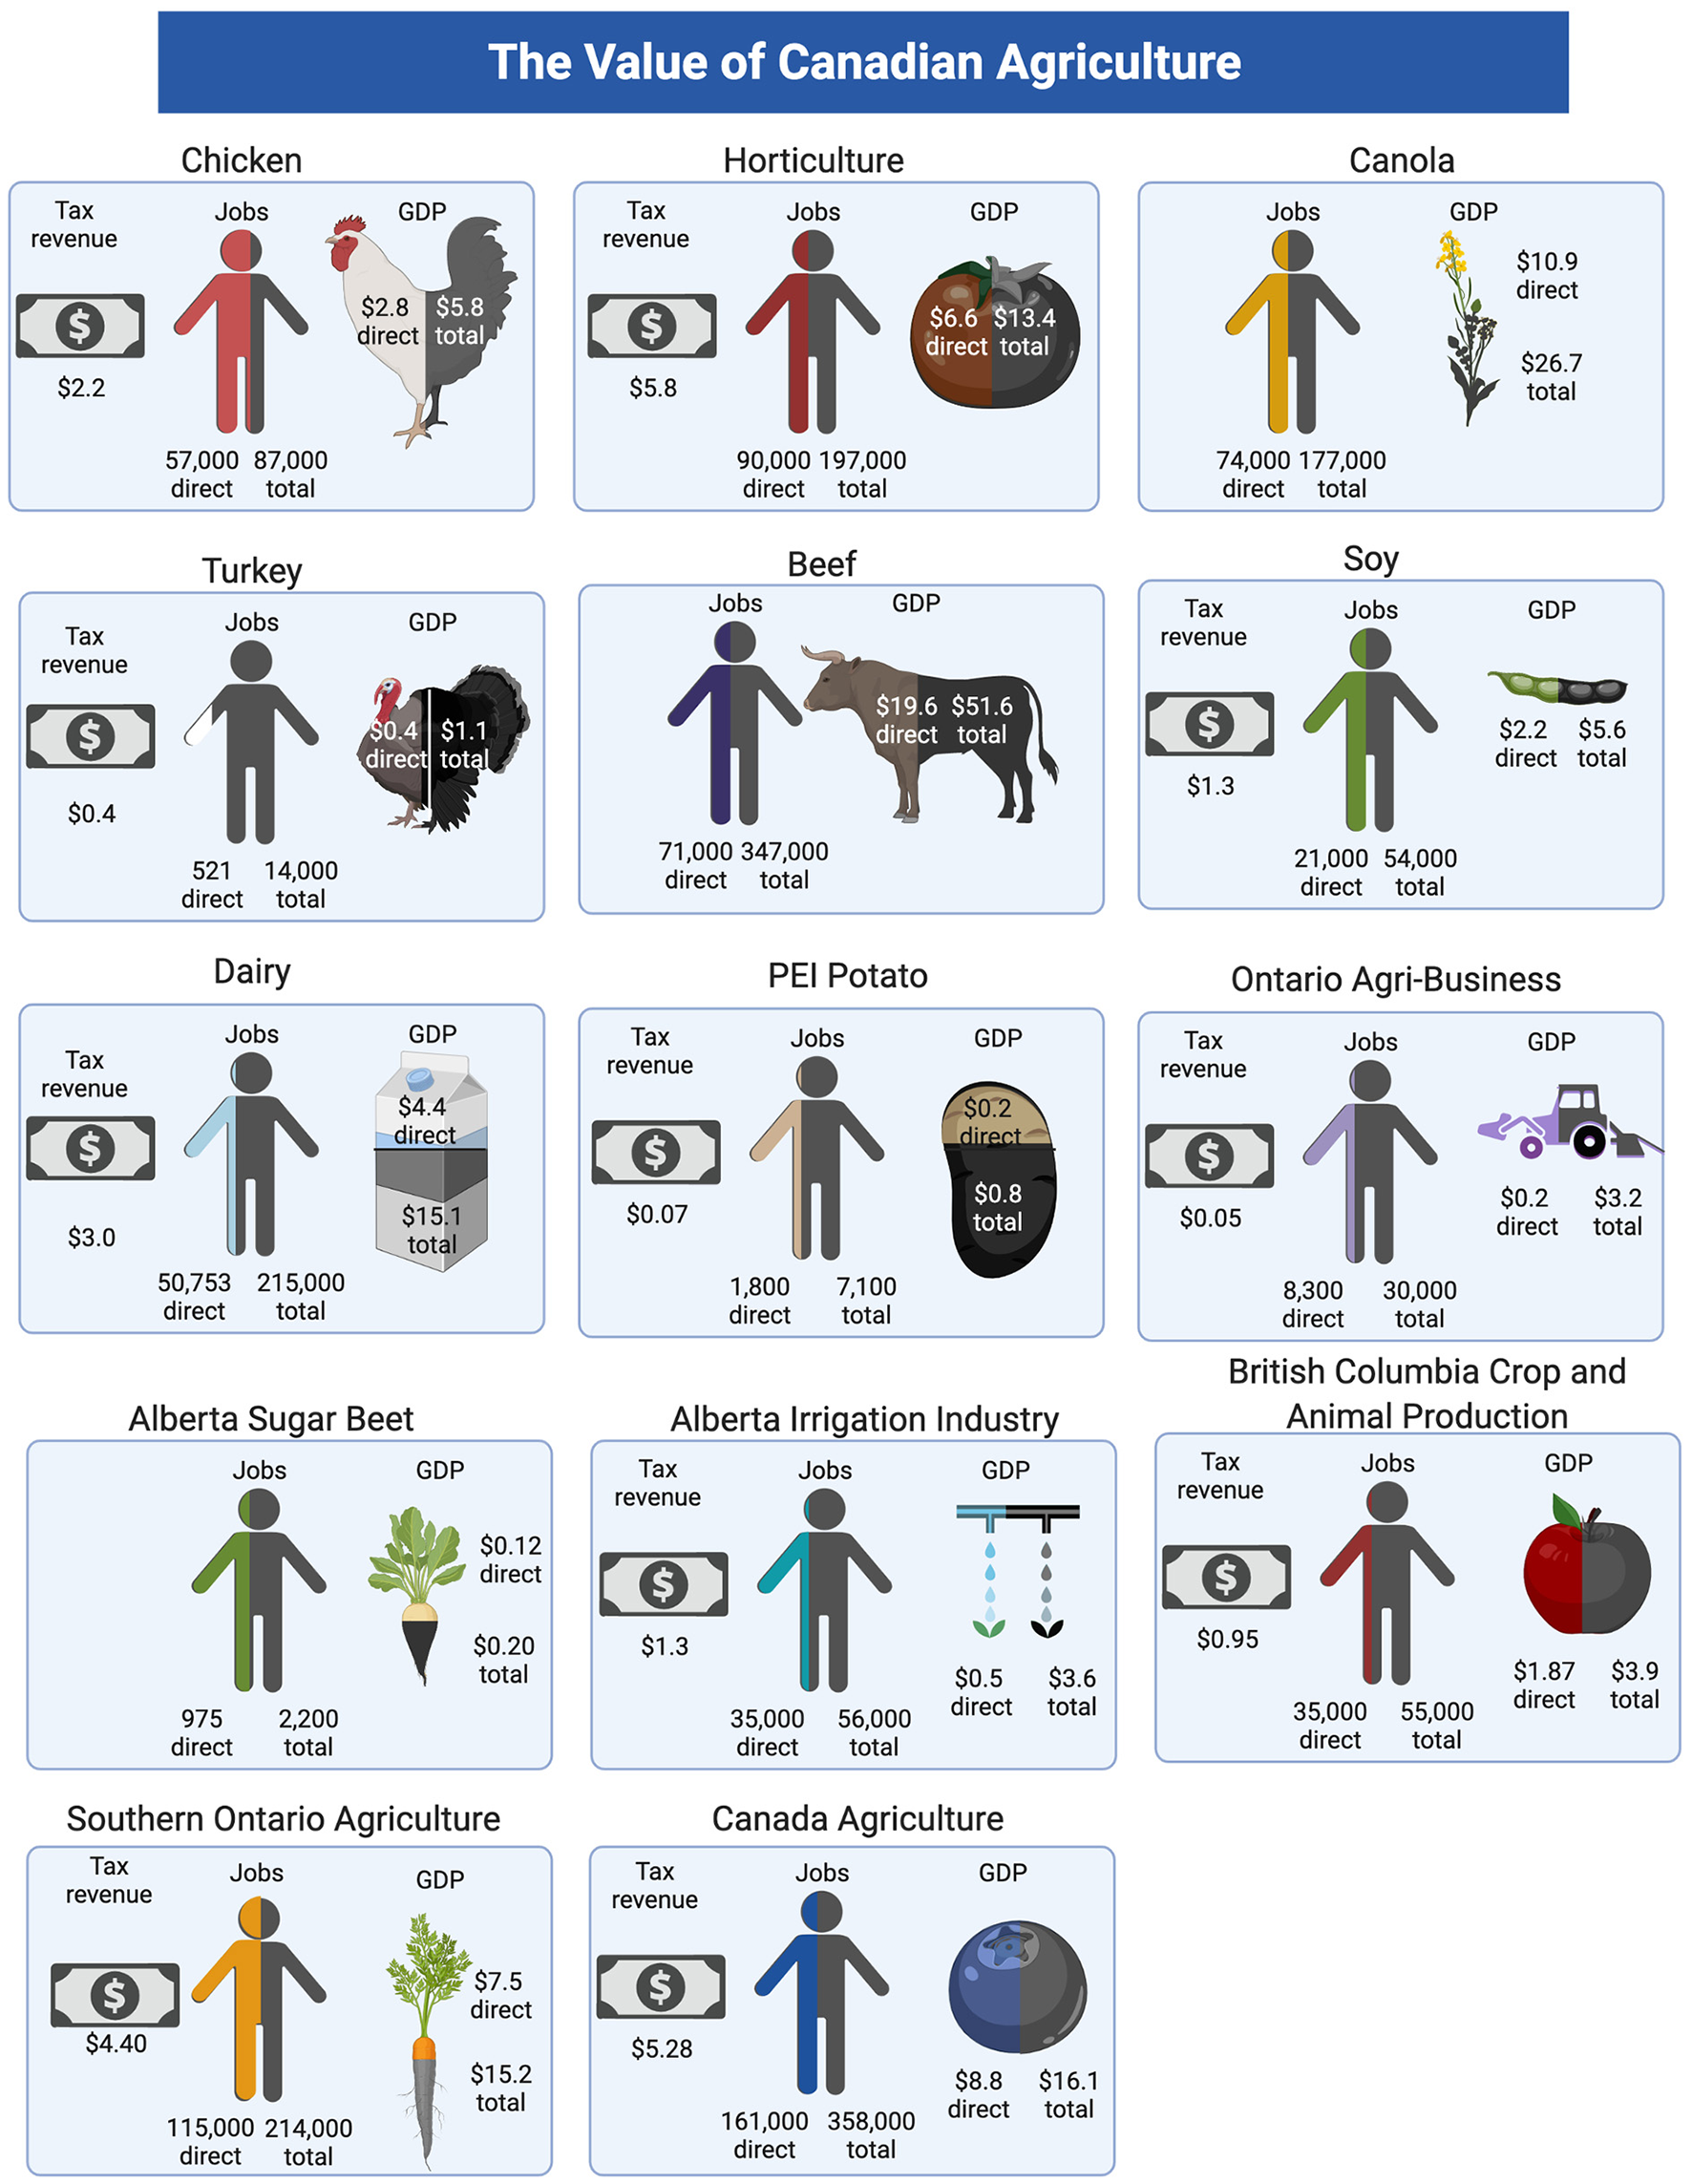
The value of Canadian agriculture by industry and region. This figure summarizes the direct and total (direct, indirect, and induced) economic impacts in terms of GDP and jobs from 15 input-output analyzes of Canadian agricultural industries. Gross domestic product (GDP) in $CAD billion represents the total direct, indirect and induced value added to the Canadian economy by that sector. Jobs in FTE represent the total number of direct, indirect or induced full-time equivalent jobs supported per year by that sector. Tax revenues in $CAD billion represent the total tax contribution to municipal, provincial and federal governments generated by that sector. GDP and job figures come from 15 papers using data from different years and calculations based on different multipliers; totals may not add up among industries or make sense in comparisons between industries. Created with BioRender.
The proportion of GDP relative to jobs generated by an industry was consistent between some top industries. Beef and canola—two of the biggest contributors to both GDP and jobs—accounted for similar ratios of GDP to jobs. However, the ratio of GDP to jobs differed by region within industries such as beef and dairy. For beef, nearly half of its national GDP impact occurred in Alberta alone ($20.5 billion), but Alberta only accounted for less than a quarter of the jobs (80,724 jobs).
Publishers of I/O analyzes
Industry associations and marketing boards were common publishers of I/O analyzes. These included the Canola Council of Canada, Beef Cattle Research Council and Dairy Farmers of Canada. These are often voluntary and not-for-profit organizations funded through membership dues or donations that represent the interests of producers and businesses within their sector. Provincial governments and not-for-profit organizations also commissioned I/O analyzes. Groups typically partnered with consultants or academic institutions to complete I/O analyzes.
Discussion
Agricultural industries in Canada are closely tied to many other economic activities. I/O analyzes show that agricultural industries make a much higher contribution to the economy than indicated by traditional economic valuations that fail to capture indirect or induced impacts.
Comparability across analyzes
The I/O methodology and metrics reported were similar across studies in this review. Due to small methodological differences the results of these I/O analyzes are not directly comparable. Some analyzes calculated specific multipliers rather than use the generalized national or provincial multipliers published by Statistics Canada. Even analyzes by the same industry sometimes used different specificity of multipliers (e.g., dairy). Also, multipliers change over time as the economy changes. Multipliers and data used by the analyzes in this review ranged from 1999 to 2020, with an average year of 2015. The papers applied multipliers from various years to data from various years, which limits comparability across studies.
Comparison to other industries
Relative to other key industries in Canada, top agricultural industries rank highly in terms of contribution to GDP and jobs. Canada's beef industry contributed more to GDP than marine industries but less than oil and gas ((Ganter et al., 2021). The industry accounts for half the number of jobs created by oil and gas, and a similar number of jobs as created by the airport industry. Canola accounts for over double the GDP of Ontario mineral production, but less GDP than the airport industry (Canadian Airports Council, 2019). In terms of jobs, Canola contributed about a third of the jobs created by oil and gas.
Canada's information and communication technology (ICT) industry, which includes ICT manufacturing and wholesaling, communication services, and software and computer systems, was directly responsible for $96.8 billion GDP and 556,209 jobs. Its total direct, indirect and induced GDP was nearly double at $177 billion GDP while its overall contribution to jobs was over double at 1,279,000 jobs (Government of Canada, 2020). The oil and gas sector, defined as the sum of oil and gas extraction and oil and gas investment, ranks below ICT with a total GDP impact of $128.1 billion with a direct GDP impact of $79.3 billion (Kaplan, 2021). The sector directly accounted for 216,285 jobs, with a total impact of over 611,000 jobs. The job shares are much lower than the GDP share because the oil and gas industry is capital intensive. Marine industries in Canada were worth $20.0 billion direct GDP, which nearly doubles to $36.1 billion when indirect and induced GDP are added (Department of Fisheries and Oceans, 2021). This sector includes marine industries in the public and private sector from commercial fishing, tourism and recreation, and government departments. Canada's commercial airport industry had a direct impact of 194,000 jobs and $19 billion in GDP. Its total impact was 355,000 jobs and $35 billion in GDP (Canadian Airports Council, 2019). In Ontario, mineral production accounted for $6.98 billion direct contribution to GDP which almost doubled to $12.1 billion when indirect and induced benefits across Canada are considered (Ontario Mining Association, 2015).
A real-world application: I/O can improve policy
I/O analyzes are important tools that help predict the breadth of consequences for agricultural policies (Helming et al., 2001; Barker et al., 2007). Following the discovery of potato wart in two Prince Edward Island fields, exports of fresh potatoes to the U.S. were banned by the Canadian Food Inspection Agency in November 2021. Potato farm cash receipts totaled $250.3 million to the Prince Edward Island economy; of that, the U.S. fresh potato market was worth $120 million (Statistics Canada, 2022b). I/O analysis for the same year indicated that the actual impact of the potato export ban was much greater than the direct value indicated by farm cash receipts. The potato sector (farming and processing) supported $1.35 billion in sales on Prince Edward Island and $544.7 million in other Canadian provinces (Ghaith, 2020). It boosted provincial GDP by over $527 million, created 5,016 jobs in the province, contributed $240 million in wages and generated $48.9 million in taxes. Nationally, it created 7,086 jobs and generated over $73 million in taxes. These figures include the direct impact of potato revenue as well as the indirect and induced impacts such as sales generated by industries that supply the potato sector and the labor income it creates.
PEI Potato Board chair John Visser told CBC News that he would like to see “compensation for the potatoes that have been destroyed and the damage that was done” (Fraser, 2022). Policy measures to compensate potato farmers for their losses only addresses a small portion of the problem. The economic loss from stalled potato exports has indirect and induced effects throughout the provincial and national economies; I/O analyzes indicate the magnitude of these effects to inform policy. Farmers, governments and citizens need I/O information to inform policymaking and ensure that compensation for shortfalls in an agricultural industry takes into account the full economic impact of that industry.
Limitations
There is debate about the strengths and weaknesses of I/O models in assessing the contribution of industry sectors to the economy. One of the most significant limitations is the assumption that extra output can be produced in one area without taking resources away from other activities, thus overstating economic impacts. The actual impact is likely to be dependent on the extent to which the economy is operating at or near capacity (Fellows and Winter, 2018). Additionally, the validity of estimating induced effects is frequently challenged (Jacques et al., 2011). The purpose of taking them into consideration is to approximate the total impact of an industry. Ignoring them creates uncertainty. Precautions can be taken by the studies to avoid overestimating induced impacts, such as including no more than 15 iterations; making various deductions from the income of individuals (e.g., income taxes, employee contribution to pension funds, employment insurance, household savings) before simulating spending of household revenue; and avoiding assigning remuneration to every hour worked by farm operators in order not to overestimate the induced effects of production because the hours worked include unpaid hours which do not generate any re-expenditure and therefore induced impacts. The I/O model, without induced effects, generate results similar to a computable general equilibrium (CGE) model (Fellows and Winter, 2018).
One of the main limitations of I/O methodology is that it fails to incorporate non-monetary values. Yet, the value of agriculture in its ability to provide ecosystem service is tremendous (Garibaldi et al., 2017; Vanbergen et al., 2020). The agricultural sector not only produces food, but it also provides ecosystem services like pollination, pest control, soil conservation and biodiversity (Lhermie, 2021). Although beyond the scope of our study, any sound policy targeting the economy of the agricultural sector should consider the multifunctionality of agriculture.
Systematic search methodology was used to find I/O reports pertaining to Canadian agriculture. However, the diversity of platforms publishing reports (i.e., private industry, government, and academic websites and publications) and the breadth of agricultural sectors mean that some reports may have been missed by the search criteria.
Conclusion
The value of agricultural industries to the Canadian economy is much greater than the obvious direct impacts of primary production. I/O analyzes measuring the direct, indirect and induced impacts of agricultural industries across the economy indicate the true importance of these sectors to GDP and jobs throughout Canada. I/O analyzes have been completed for some sectors of Canadian agriculture, but many sectors still lack these comprehensive valuations.
There is a need to complete a Canada-wide I/O analysis covering all key agricultural industries using up-to-date data and uniform methodology. This information is essential to communicate the true economic value of agriculture to the Canadian economy and to inform policy and investment in agricultural industries.
Funding
This work was supported by UFA Co-operative Ltd. and the Rural Communities Foundation (RCF) in a sponsorship agreement that supports research, research dissemination, and public outreach. The sponsors were not involved in the study design, collection, analysis, interpretation of data, the writing of this article, or the decision to submit it for publication.
Publisher's note
All claims expressed in this article are solely those of the authors and do not necessarily represent those of their affiliated organizations, or those of the publisher, the editors and the reviewers. Any product that may be evaluated in this article, or claim that may be made by its manufacturer, is not guaranteed or endorsed by the publisher.
Author disclaimer
Any recommendations, opinions, findings or conclusions expressed in this publication are those of the publishing authors and do not necessarily represent those of UFA and RCF.
Statements
Author contributions
EW and GL contributed to the conception and design of the paper, manuscript revisions, read, and approved the submitted version. EW reviewed the literature and wrote the manuscript. All authors contributed to the article and approved the submitted version.
Acknowledgments
The authors would like to thank Dr. Ziad Ghaith, Adjunct Faculty, University of Prince Edward Island, for his insights.
Conflict of interest
The authors declare that the research was conducted in the absence of any commercial or financial relationships that could be construed as a potential conflict of interest.
Supplementary material
The Supplementary Material for this article can be found online at: https://www.frontiersin.org/articles/10.3389/fsufs.2022.940968/full#supplementary-material
Supplementary Table S1Input-output analyzes by industry and region (full data extraction table).
References
1
Agriculture Agri-Food Canada (2021). Agriculture and Agri-Food Canada Overview of the Sector. Available online at: https://agriculture.canada.ca/sites/default/files/documents/2021-11/sector-eng.pdf (accessed March 1, 2022).
2
Alberta Agriculture Forestry (2020). Economic Impact of Alberta's Sugar Beet Industry. Available online at: https://open.alberta.ca/dataset/1fb55ce9-3d7d-4c5a-9d62-5694474d7c1a/resource/f8f873c1-c41f-4a3d-8042-a4322c09d96c/download/af-economic-impact-of-albertas-sugar-beet-industry-2020-10.pdf (accessed March 2, 2022).
3
Alberta Irrigation Projects Association (2015). Economic Value of Irrigation in Alberta. Prepared by Paterson Earth and Water Consulting Ltd. Available online at: https://www1.agric.gov.ab.ca/$department/deptdocs.nsf/all/irr15523/$file/economic-value-irrigation-alberta.pdf (accessed March 5, 2022).
4
BarkerT.EkinsP.FoxonT. (2007). Macroeconomic effects of efficiency policies for energy-intensive industries: the case of the UK Climate Change Agreements, 2000–2010. Energy Econ.29, 760–778. 10.1016/j.eneco.2006.12.008
5
BC Dairy Association (2020). Study of the BC Dairy Industry. Prepared by MNP LLP. Available online at: https://bcdairy.ca/wp-content/uploads/2021/09/Economic_Impacts_of_BC_Dairy_Industry_-_Dec_1_2020_-_FINAL_REPORT_-_with_IAF_.pdf (accessed March 5, 2022).
6
BC DEPI (2018). The Economic Impact of British Columbia's Dairy, Egg and Poultry Industries: 2018 Update. https://bcchicken.ca/wp-content/uploads/2018/10/2018-07-17-DEPI-FINAL.pdf (accessed March 5, 2022).
7
Canadian Agri-Food Policy Institute (2005). The Economic Impact of Agriculture in Canada: A Three Dimensional Perspective. Prepared by Econometric Research Limited. Available online at: https://capi-icpa.ca/wp-content/uploads/2005/05/The-Economic-Impact-of-Agriculture-in-Canada-A-Three-Dimensional-Perspective-2005.pdf (accessed March 6, 2022).
8
Canadian Airports Council (2019). Economic Impact: Canada's Airports in 2016. Prepared by InterVISTAS Aviation Transportation Tourism. Available online at: https://canadasairports.ca/wp-content/uploads/2019/07/Economic-Impact-of-Canadas-Airports-Final.pdf (accessed April 23, 2022).
9
Canadian Horticultural Council (2007). Fresh Thinking for a Competitive Canada: Growing the Five Billion Dollar Canadian Horticultural Production Sector. Prepared by The Canadian Horticultural Council and JRG Consulting Group. Available online at: https://hortcouncil.ca/wp-content/uploads/2017/05/CHC_Growing-the-Horticulture-industry_Eng.pdf (accessed March 6, 2022).
10
Canola Council of Canada (2016). The Economic Impact of Canola on the Canadian Economy. Prepared by LMC International. Available online at: https://www.canolacouncil.org/download/215/pages/5255/lmc_canola_10-year_impact_study_-_canada_final_dec_2016 (accessed March 7, 2022).
11
Chicken Farmers of Canada (2018). The 2018 Economic Impact of the Poultry and Egg Industries in Canada. Prepared by Kevin Grier Marketing Analysis and Consulting Inc. Available online at: https://www.chickenfarmers.ca/wp-content/uploads/2020/10/Economic-Contribution-Infographic-2020_E.pdf (accessed March 6, 2022).
12
CrossP.GhanemZ. (2006). Multipliers and Outsourcing: How industries interact with each other and affect GDP. Canadian Economic Observer 11-010-XIB. Available online at: https://www150.statcan.gc.ca/n1/pub/11-010-x/00106/9000-eng.htm (accessed on April 6, 2022).
13
Dairy Farmers of Canada (2011). The Economic Impact of the Dairy Industry in Canada. Prepared by ÉcoRessources Consultants. Available online at: https://www.dairyfarmers.ca/content/download/1088/8440/version/5/file/EcoRessourcesDFC2011-Economic-Impact-Canada.pdf (accessed March 5, 2022).
14
DietzenbacherE.LenzenM.LosB.GuanD.LahrM. L.SanchoF.et al. (2013). Input–output analysis: the next 25 years. Econ. Syst. Res.25, 369–389. 10.1080/09535314.2013.846902
15
Eurostat (2021). Performance of the Agricultural Sector. Available online at: https://ec.europa.eu/eurostat/statistics-explained/index.php?title=Performance_of_the_agricultural_sector#Value_of_agricultural_output (accessed March 3, 2022).
16
FellowsG. K.WinterJ. (2018). Getting to Know Models: A primer and critique on Input-Output and Computable General Equilibrium Models and Their Uses for Policy and Project Analysis. The School of Public Policy, University of Calgary. Available online at: https://www.policyschool.ca/wp-content/uploads/2019/01/Fellows-Ottawa-7Dec18.pdf (accessed April 6, 2022).
17
Fisheries Oceans Canada (2021). Direct, indirect and induced Gross Domestic Product 2018 ($Millions) of Marine sectors in Canada. Available online at: https://www.dfo-mpo.gc.ca/stats/maritime/tab/mar-tab4-eng.htm#tablep-fna (accessed April 23, 2022).
18
FraserS. (2022, March 31). Americans say P.E.I. potatoes to be allowed into mainland U.S. ‘soon.' CBC News. Available online at: https://www.cbc.ca/news/canada/prince-edward-island/pei-potato-wart-announcement-1.6386556 (accessed April 6, 2022).
19
GanterS.CrawfordT.IrwinC.RobichaudV.DeMaio-SukicA.WangJ.et al. (2021). Canada's Ocean and Economic Contribution of Marine Sectors. Catalogue No. 16-002-X. Available online at: https://www150.statcan.gc.ca/n1/pub/16-002-x/2021001/article/00001-eng.htm
20
GaribaldiL. A.Gemmill-HerrenB.D'AnnolfoR.GraeubB. E.CunninghamS. A.BreezeT. D. (2017). Farming approaches for greater biodiversity, livelihoods, and food security. Trends Ecol. Evolut.32, 68–80. 10.1016/j.tree.2016.10.001
21
GhaithZ. (2020). The Prince Edward Island Potato Sector: An Economic Impact Analysis. Charlottetown, PE: Strategic Policy and Evaluation Division, Department of Agriculture and Land. Available online at: https://www.princeedwardisland.ca/sites/default/files/publications/af_potato_econ_impact_study.pdf (accessed March 2, 2022).
22
Government of Canada (2020). 2020 Canadian ICT Sector Profile – Automotive, Transportation and Digital Technologies Branch. Cat. No. Iu62-2E-PDFISSN 1913-0171. Available online at: https://www.ic.gc.ca/eic/site/ict-tic.nsf/vwapj/ICT_Sector_Profile2020_eng.pdf/$file/ICT_Sector_Profile2020_eng.pdf (accessed April 25, 2022).
23
HelmingJ. F.PeetersL.VeendendaalP. J. J. (2001). “Assessing the consequences of environmental policy scenarios in Flemish agriculture,” in Agricultural Sector Modelling and Policy Information Systems (Bonn), 237–245.
24
JacquesL.-S.MordonM.LeBretonM. (2011). The Economic Impact of the Dairy Industry in Canada. Prepared by ÉcoRessources Consultants. Available online at: https://www.dairyfarmers.ca/content/download/1088/8440/version/5/file/EcoRessourcesDFC2011-Economic-Impact-Canada.pdf (accessed April 6, 2022).
25
JohnsonR. C.NogueraG. (2012). Accounting for intermediates: production sharing and trade in value added. J. Int. Econ.86, 224–236. 10.1016/j.jinteco.2011.10.003
26
KaplanL. (2021). The Oil and Gas Sector's Contribution to Canada's Economy: The Canadian Energy Centre Fact Sheet #48. Available online at: https://www.canadianenergycentre.ca/wp-content/uploads/2021/12/CEC-FS-48-Oil-Gas-Sectors-Contribution-to-Canadas-Economy-V2-Nov-28-2021.pdf (accessed April 22, 2022).
27
KulshreshthaS.NagyC. (2021). Economic Impacts of Cattle Sector in Canada – A Regional Multiplier Analysis. Prepared for CanFax Research Services and the Beef Cattle Research Council. Available online at: https://www.beefresearch.ca/files/pdf/Final-Multiplier-Report-June-2021.pdf (accessed March 6, 2022).
28
LeonesJ.SchluterG.GoldmanG. (1994). Redefining agriculture in interindustry analysis. Am. J. Agric. Econ.76, 1123–1129. 10.2307/1243403
29
LhermieG. (2021). Shaping agricultural policies in the Anthropocene era: what can we learn from the DPSIR framework? The Simpson Centre at the School of Public Policy, University of Calgary. SPP Briefing Paper Volume 14:25.
30
MiernykW. H. (2020). The Elements of Input-Output Analysis, ed R. Jackson (Morgantown, WV: WVU Research Repository).
31
MillerR. E.BlairP. D. (2009). Input-Output Analysis Foundations and Extensions, 2nd Edn.Cambridge: Cambridge University Press.
32
Ontario Agri Business Association (2016). Updated Economic Impact Study of the Ontario Agri-Business Industry. Prepared by MNP LLP. Available online at: https://www.oaba.on.ca/downloads/Economic%20Study%20-%20Final%20October%2030%202016.pdf (accessed March 23, 2022).
33
Ontario Mining Association (2015). Mining in Ontario: The Latest Trends and Industry Outlook. Prepared by the Ontario Mining Association in partnership with the Ministry of Northern Development and Mines and Hickling Arthurs Low Corporation. Available online at: https://oma.on.ca/en/resourcesGeneral/OMA-Economic-Report.pdf (accessed April 25, 2022).
34
PopayJ.RobertsH.SowdenA.PetticrewM.AraiL.RodgersM.et al. (2006). Guidance on the conduct of narrative synthesis in systematic reviews. A Product from the ESRC Methods Programme Version 1, b92.
35
SilvermanD. (2015). Interpreting Qualitative Data. London: Sage Publishing.
36
Soy Canada (2016). Economic Impact Study of the Canadian Soybean Industry. Prepared by MNP LLP. http://soycanada.ca/wp-content/uploads/2015/06/Soy-Canada-Economic-Impact-Study_reduced.pdf (accessed March 23, 2022).
37
Statistics Canada (2020). Overview of the Canadian Agri-Food System. Available online at: https://agriculture.canada.ca/en/canadas-agriculture-sectors/canadian-food-system/overview-canadian-agri-food-system (accessed March 1, 2022).
38
Statistics Canada (2022a). Tables 15-207-X: Symmetric Input-Output Tables. Available online at: https://www150.statcan.gc.ca/n1/en/catalogue/15-207-X (accessed April 5, 2022).
39
Statistics Canada (2022b). Table 32-10-0045-0: Farm cash receipts, annual (x 1,000). Available online at: https://www150.statcan.gc.ca/t1/tbl1/en/tv.action?pid=3210004501 (accessed April 10, 2022).
40
USDA (2020). Selected charts from Ag and Food Statistics: Charting the Essentials. Administrative Publication No. 083. Available online at: https://www.ers.usda.gov/webdocs/publications/96957/ap-083.pdf?v=4352.5 (accessed March 2, 2022).
41
VanbergenA. J.AizenM. A.CordeauS.GaribaldiL. A.GarrattM. P.Kovács-HostyánszkiA.et al. (2020). Transformation of agricultural landscapes in the Anthropocene: nature's contributions to people, agriculture and food security. Adv. Ecol. Res.63, 193–253. 10.1016/bs.aecr.2020.08.002
Summary
Keywords
multiplier analysis, agriculture, economy, Canada, input-output analysis (IO)
Citation
Windfeld E and Lhermie G (2022) The value of Canadian agriculture: Direct, indirect, and induced economic impacts. Front. Sustain. Food Syst. 6:940968. doi: 10.3389/fsufs.2022.940968
Received
10 May 2022
Accepted
14 October 2022
Published
03 November 2022
Volume
6 - 2022
Edited by
Rosalind Malcolm, University of Surrey, United Kingdom
Reviewed by
Jared Carlberg, University of Manitoba, Canada; Muhammad Abdul Aziz, Ca' Foscari University of Venice, Italy
Updates
Copyright
© 2022 Windfeld and Lhermie.
This is an open-access article distributed under the terms of the Creative Commons Attribution License (CC BY). The use, distribution or reproduction in other forums is permitted, provided the original author(s) and the copyright owner(s) are credited and that the original publication in this journal is cited, in accordance with accepted academic practice. No use, distribution or reproduction is permitted which does not comply with these terms.
*Correspondence: Emma Windfeld emma.windfeld@ucalgary.ca
This article was submitted to Social Movements, Institutions and Governance, a section of the journal Frontiers in Sustainable Food Systems
Disclaimer
All claims expressed in this article are solely those of the authors and do not necessarily represent those of their affiliated organizations, or those of the publisher, the editors and the reviewers. Any product that may be evaluated in this article or claim that may be made by its manufacturer is not guaranteed or endorsed by the publisher.