 Ellen Audia
 Lisa A. Schulte
 John Tyndall
- Department of Natural Resource Ecology and Management, Iowa State University, Ames, IA, United States
While provisioning ecosystem services generated through agricultural production are high, this often comes at the expense of other ecosystem services. Approaches that support both farm income and a balanced array of ecosystem services are needed. We employed a landscape modeling approach to demonstrate the financial and ecosystem service outcomes of strategically restoring grassland cover within a Corn Belt agricultural watershed. We assessed potential changes associated with a “Baseline” land use scenario and two alternative scenarios for the Grand River Basin (Iowa and Missouri, USA). In a “Buffered” scenario we simulated the impacts of replacing cropland within 20 m of streams with restored native grassland cover. In a “Productivity-based” scenario we simulated the replacement of annual row crops on poorly performing croplands with native grassland cover. Grasslands comprised 0.4% of the Baseline scenario. Grassland was expanded to 0.8% of the watershed in the Buffered scenario, reducing annual nutrient and sediment loss by 1.44%, increasing soil carbon sequestration by 0.12% over 10 years, and increasing pollinator abundance by 0.01%. The estimated annual value of these enhancements was $1.7 million for nitrogen reduction, $0.1 million for phosphorus reduction, $0.5 million for sediment reduction, and $1.3 million for soil carbon sequestration. Grassland comprised 4.9% of the watershed in the Productivity-based scenario, reduced annual nutrient and sediment loss by 11.50%, increased soil carbon sequestration by 1.13% over 10 years, and increased pollinator abundance by 0.42%. The estimated annual value of enhancements was $18 million for nitrogen reduction, $1.4 million for phosphorus reduction, $2.5 million for sediment reduction, and $14 million for soil carbon sequestration. We also calculated the value of grassland biomass for a potential energy market. The benefit of producing and selling grassland biomass ranged -$445 to $1,291 ha−1 yr−1. Scaled to the watershed, annual revenues ranged -$7.3 million to $21.1 million for the Buffered scenario and -$44.2 million to $128.8 million for the Productivity-based scenario. This study was the first to quantify changes in revenue and the value of ecosystem services associated with grassland restoration in the Grand River Basin and can help inform discussion among watershed stakeholders.
Introduction
Ecosystem goods and services are the benefits humans derive from nature, which include provisioning (e.g., food), regulating (e.g., water purification), cultural (e.g., recreation and spirituality), and supporting services (e.g., soil formation and nutrient cycling) (MEA, 2005). Agroecosystems have been traditionally designed to produce the provisioning ecosystem goods of food, feed, forage, fiber, bioenergy, and pharmaceuticals (Power, 2010). In the past 60 years, global cropland expansion and green technologies such as high-yielding cultivars, fertilizers and pesticides, and mechanization have enabled cereal yields to increase by 280 percent (Ritchie and Roser, 2019). However, the low diversity, high input agricultural systems that work to maximize crop yields also tend to have negative environmental impacts, including on soil health, water quality, and wildlife habitat, among other impacts (Foley et al., 2005; Power, 2010; Asbjornsen et al., 2014; Liebman and Schulte, 2015). For instance, of the 585 impaired waterbodies in Iowa most are related to bacteria, fish kills, and algal growth, all of which are largely due to agricultural runoff (Iowa Department of Natural Resources, 2020). Another example of this is the hypoxic zone in the Gulf of Mexico, which is a result of nutrient loss from agricultural lands within the Mississippi River Basin (Gulf Hypoxia Action Plan, 2008), and impairs the Gulf region's ability to provide seafood and support tourism. Agriculture's ability to take advantage of emerging environmental markets, such as for flood control, clean water, and carbon reduction can also be limited as it is difficult to accurately measure and value the effects of agricultural conservation practices on ecosystem services and facilitate payments to landowners (Reed, 2020).
To sustain agriculture's traditional role, shore up its unintended negative environmental impact, and support the expansion into new roles, efforts are being made to strategically restore native perennial grassland within the U.S. Corn Belt's annual crop matrix (e.g., Glover et al., 2010; DeLuca and Zabinski, 2011; Hirsh et al., 2013; Schulte, 2014; Zhou et al., 2014). There is a growing body of research supporting the need to maintain continuous living cover in agroecosystems and understand the economic feasibility of doing so (e.g., Schulte et al., 2006, 2017; Meehan et al., 2013; Asbjornsen et al., 2014; Bonner et al., 2014; Zilverberg et al., 2014; Zimmerman et al., 2019).
Perennials can maintain ecosystem services while contributing to existing and emerging markets such as bioenergy, outdoor recreation (e.g., agritourism), hunting, and nutrient and carbon crediting (Meehan et al., 2013; Zilverberg et al., 2014; John and McIsaac, 2017; Powell et al., 2018; Ha and Wu, 2022; Zimmerman et al., 2022).
Grassy feedstocks from restored perennial grassland are being promoted for renewable fuel production. These grassy feedstocks can be grown in areas where annual row crop production is chronically less profitable and/or areas of high conservation value (Gelfand et al., 2013; Meehan et al., 2013; Brandes et al., 2016; Schulze et al., 2016; Mishra et al., 2019; Khanna et al., 2021; Martinez-Feria et al., 2022). Converting low-yielding cropland to grassland cover has the potential to improve the overall profitability of farm fields (Bonner et al., 2014; Brandes et al., 2018; Nair et al., 2018). The cost of grassland establishment and management tends to be lower than for cash crops, and depending on local or regional market development, perennial systems may out compete annual systems in terms of productivity and profitability (Tilman et al., 2006; Gelfand et al., 2013; Manatt et al., 2013; Brandes et al., 2016). New markets for bioenergy grassland crops could subsequently foster emerging ecosystem and or commodity markets and the ecosystem services associated with grassland systems provide widespread public benefits, such as climate regulation, water purification, and recreational services, some of which can be monetized (Johnson et al., 2012; Meehan et al., 2013; Mishra et al., 2019).
Our goal with this research was to evaluate one method of agroecosystem perennialization – strategically restoring and/or reconstructing grassland composed of native species as a biomass crop (hereafter referred to as bioenergy grassland) – to jointly expand agricultural markets and enhance ecosystem service outcomes in the Grand River Basin (GRB), located in Iowa and Missouri, USA. The GRB was chosen for this study because it represents an agriculturally dominated watershed contributing to water quality impairments in the Mississippi River Basin. While grasslands have a variety of different uses (e.g., grazing land, hay, bedding), the GRB and surrounding region has for decades hosted projects that seek to simultaneously meet bioenergy production and conservation goals through perennial grassland restoration (e.g., Shepherd, 2000; Austin, 2011; Butler, 2019; Prairie Lands, 2022). Our specific objectives for the GRB were to (1) create alternative land use scenarios that meet both bioenergy development and conservation goals; (2) assess the potential ecosystem service outcomes associated with current land use and alternative land use scenarios, specifically impacts to nutrient and sediment retention, carbon sequestration, and pollinator abundance; (3) determine potential private financial and public economic outcomes associated with the current land use and alternative scenarios; and (4) inform agricultural and natural resource decision-making.
Methods
Study area
The Grand River Basin is located in southwest Iowa (38%) and northwest Missouri (62%), USA. The entire watershed has an area of 20,460 km2, most of which lies in Missouri and entirely within the Dissected Till Plains (Pitchford and Kerns, 1999; NRCS, 2006). The topography of the basin is mostly composed of rolling and undulating uplands dissected by broad, flat stream valleys (Pitchford and Kerns, 1999). Shales, sandstones, and limestones underlie the watershed and the predominating soils are silt loams and silty clay loams derived from glacial drift and loess (Pitchford and Kerns, 1999; NRCS, 2006). Based on a weather station in the central area of the basin, Gentry County, average temperatures in the GRB for the period 2000–2022 ranged from 5.3 to 17.6, and annual precipitation ranged from 0 cm to 112 cm (http://agebb.missouri.edu/weather/stations/).
Land use in the basin is estimated to be 30% cropland, 44% pasture, 17% forest, 3.7% water/wetland, 4.2% urban, and 0.6% grassland and shrubland (Figure 1). Over 200,000 hectares of the watershed is enrolled in the USDA Conservation Reserve Program (USDA FSA, 2020).
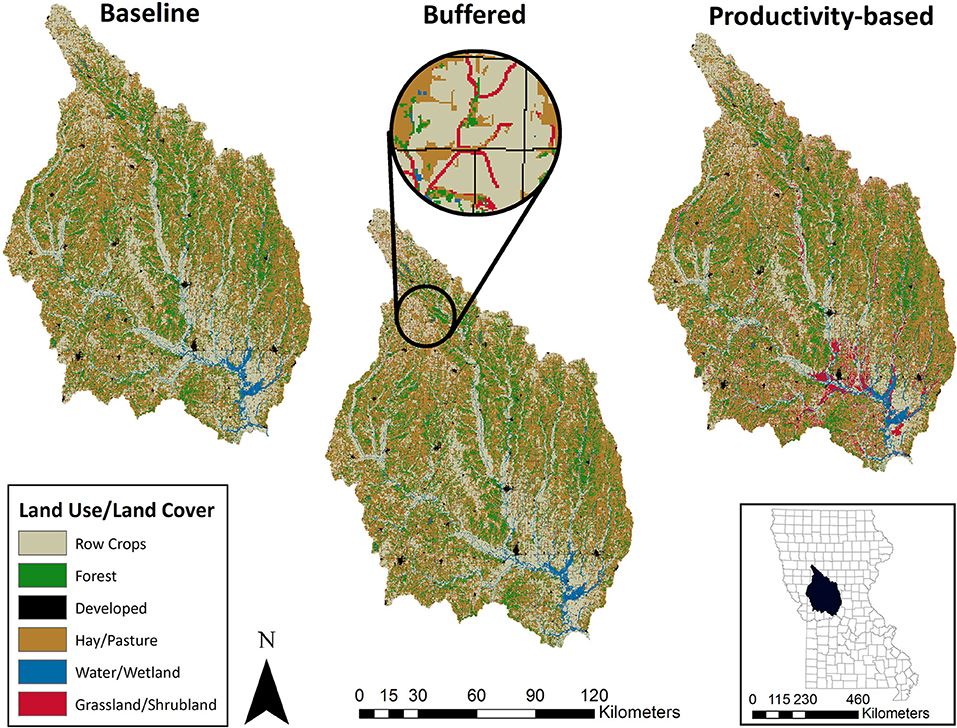
Figure 1. Land use/land cover distributions for the Baseline, Buffered, and Productivity-based scenarios in the Grand River Basin, located in southwest Iowa and northwest Missouri, USA, based on the National Land Cover Dataset (Multi-Resolution Land Characteristic Consortium (MRLCC), 2018).
Major environmental impairments within the GRB include water quality degradation and habitat loss (Pitchford and Kerns, 1999). The Section 303 (d) list of impaired waters (category 5) in Iowa includes 585 impairments, six of which occur in the GRB and are bacterial and biological in character (Iowa Department of Natural Resources, 2020). The list in Missouri includes 481 impairments, 11 of which occur in the GRB, with bacteria, dissolved oxygen, mercury in fish, and heavy metals being the reasons for impairment (MoDNR, 2020). Excess nitrogen and phosphorus are also listed as impairments, and 20% of all pollutants come from non-point sources (MoDNR, 2020). Missouri and Iowa are major contributors to nutrient loading in the Mississippi/Atchafalaya River Basin (MARB) (Alexander et al., 2008), with agricultural land contributing between 50–60% of the nutrients (MoDNR, 2014). Iowa and Missouri have both pledged to reduce nutrient loading in response to the 2008 Gulf Hypoxia Action Plan (MoDNR, 2014; Iowa Nutrient Reduction Strategy (INRS), 2017), to shrink the hypoxic dead zone that occurs there (Gulf Hypoxia Action Plan, 2008). Various agricultural best management practices and green infrastructure have been encouraged and implemented to help control nutrient and sediment loss (MoDNR, 2014; Iowa Nutrient Reduction Strategy (INRS), 2017).
Habitat quality and loss are also of concern in the GRB. Native Midwestern landscapes are considered critically endangered as >50% of the native vegetation in the region has been converted to other vegetation types (Hoekstra et al., 2005). Loss of vegetation richness and simplification of landscapes can negatively influence soil formation, erosion control, water retention, nutrient cycling, and habitat quality all of which impact plant and animal biodiversity (Schulte et al., 2006; Power, 2010). In Iowa and Missouri, native prairie has been replaced mainly by agricultural and urban land (Iowa Department of Natural Resources, 2015; Missouri Department of Conservation, 2015). Such land use change is the primary threat to plant and animal biodiversity within grasslands (Hirsh et al., 2013; Iowa Department of Natural Resources, 2015; Missouri Department of Conservation, 2015). This landscape conversion in Iowa and Missouri has led to very low numbers or even extirpation of many native wildlife species (Iowa Department of Natural Resources, 2015; Missouri Department of Conservation, 2015). Sedimentation, and nutrient loading from runoff, and channelization and levee construction in streams cause aquatic and riparian habitat degradation throughout Iowa and Missouri as well (Iowa Department of Natural Resources, 2015; Missouri Department of Conservation, 2015).
Modeling framework
We employed a five-step methodological approach. We first identified two contrasting land use scenarios – a “Buffered” and a “Productivity-based” scenario – to compare with current land use in the GRB, based on the 2016 National Land Cover Dataset (Multi-Resolution Land Characteristic Consortium (MRLCC), 2018). Descriptions of each NLCD land cover type can be found in the Supplementary material (Supplementary Table S1). For the Buffered scenario, we identified all row-cropped areas within 20 m of a perennial stream and shifted them to bioenergy grassland. For the Productivity scenario, we shifted land use from row crops to bioenergy grassland in areas that have low corn and soybean yield potential based on the National Commodity Crop Productivity Index (NCCPI; Dobos et al., 2012), which we obtained from the gSSURGO database (gSSURGO Database, 2020). Cropland with a NCCPI value of < 0.5 was shifted to bioenergy grassland. We chose 0.5 as the cutoff point because those soils would likely have a history of chronic economic loss. Dobos et al. (2008) present a bivariate fit regression of corn yield from 35 different states and NCCPI and indicate that expected corn yield ranged from 40 bushels per acre to about 160 bushels per acre with an average of about 110 bushels per acre. For context, from 2016 to 2022 the average breakeven corn yield in six Iowa counties (Black Hawk, Fremont, Hamilton, Mills, Tama, and Wright) was 190 bushels per acre (Iowa State University Extension and Outreach (ISUEO), 2022). Furthermore, Li et al. (2016) used crop insurance data from Midwestern states including Iowa and Missouri to indicate that crop insurance losses increase at low to medium NCCPI value ranges and begins to decrease after the 0.65 NCCPI value. Bioenergy grassland was defined as a planted system based on a conservation-oriented prairie seed mix suitable for the region. Specifically, average seed mix costs were based on regional prices for mesic pollinator 10/30 (10 grasses/30 forbs) plantings designed to provide supportive environments for honeybees and butterflies. Second, we used the Integrated Valuation of Ecosystem Services and Tradeoffs model (InVEST; Natural Capital, Project, 2019) model to estimate ecosystem service outcomes in the GRB, including nutrient delivery ratios, sediment delivery, carbon storage, and pollinator abundance, based on current land use and the Buffered and Productivity-based land-use scenarios. Third, we conducted a comprehensive net present value financial assessment associated with the bioenergy grassland as a source of herbaceous biomass feedstocks. Fourth, ecosystem service and net present value outputs were then combined in a social benefit-to-cost analysis. Finally, we created maps and other graphics to demonstrate bioenergy grassland, ecosystem service, and financial opportunities. Detailed descriptions of data, models, and analysis procedures can be found in the Supplementary material.
Results
Land use/land cover change
The total amount of cropland decreased by 0.4% in the Buffered and 4.5% in the Productivity-based scenarios. A total of 7,743 ha of row-cropped land was converted to grassland vegetation in the Buffered scenario and 91,274 ha in the Productivity-based scenario (Supplementary Table S2). Approximately 1.2% of the Buffered area overlapped with the Productivity-based area. These areas of overlap are dispersed throughout the GRB, but occur mainly in the northern and southern portions (see Supplementary Figure S1 in the Supplementary material). It should be noted that our scenarios did not account for any additional shifts in land use that may well accompany the changes in cropped land that we present. These changes could include converting pasture or non-agricultural land (e.g., treed areas, fence rows, conservation land) to cropped land or adopting less diverse crop rotations. Such changes would likely have impacts on both the economic and environmental outcomes of our overall analysis (Bonham et al., 2006; Fleming, 2014).
Ecosystem services
Results indicate that integration of bioenergy grassland into either perennial stream buffers or low-yielding cropland increased ecosystem service outcomes (Table 1). In the Buffered scenario, annual sediment retention increased by 86,088 Mg (0.72% reduction in loss compared to baseline), annual total nitrogen retention increased by 35 Mg (0.23% reduction), annual phosphorus retention increased by 11 Mg (0.49% reduction), carbon sequestration increased by 127,093 Mg C over 10 years (0.12% increase), and pollinator abundance increased by 0.01%. In the Productivity-based scenario, relative to baseline, annual sediment retention increased by 404,678 Mg (3.37% reduction), annual nitrogen retention increased by 379 Mg (2.53% reduction), annual phosphorous retention increased by 132 Mg (5.59% reduction), carbon sequestration increased by 1,212,990 Mg C over 10 years (1.13% increase), and pollinator abundance increased by 0.42%. Across all modeled services, the Productivity-based scenario facilitated a greater increase in ecosystem services than the Buffered scenario at the watershed level (Table 1). In the Buffered scenario, the greatest enhancement of ecosystem services occurred in the northern portion of the GRB, while in the Productivity-based scenario the greatest enhancement of ecosystem services occurred in the south-central portion of the GRB and along the Grand River (Figure 2). These relationships are likely caused by the dominance of cropland in the south and along the Grand River, and the high concentration of perennial streams intersecting cropland in the north (Supplementary Figure S1).
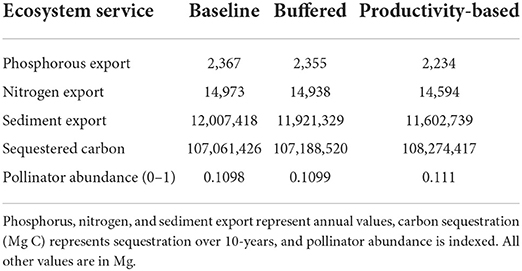
Table 1. Baseline, buffered, and productivity-based scenario outputs for ecosystem services generated by InVEST (v 3.7.0) in the Grand River Basin, Iowa and Missouri, USA.
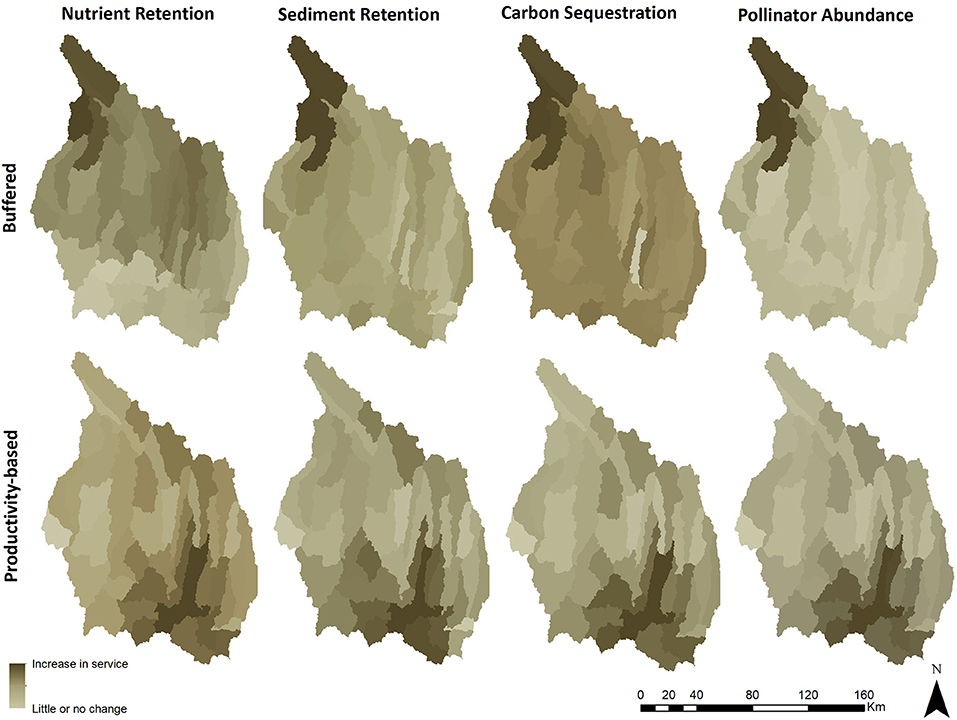
Figure 2. Changes in ecosystem services across the Grand River Basin (IA and MO, USA) for Buffered and Productivity-based scenarios compared to current land use/land cover baseline.
We also calculated annual ecosystem service outcomes for each scenario per-ha of restored native grassland (Figure 3). In the Buffered scenario, phosphorous loss was reduced by 1.48 kg ha−1, nitrogen loss was reduced by 4.54 kg ha−1, sediment loss was reduced by 12.26 tons ha−1, and carbon storage increased by 1.64 Mg ha−1 yr−1. In the Productivity-based scenario, phosphorous loss was reduced by 1.45 kg ha−1, nitrogen loss was reduced by 4.15 kg ha−1, sediment loss was reduced by 4.89 tons ha−1, and carbon storage increased by 1.33 Mg ha−1 yr−1.
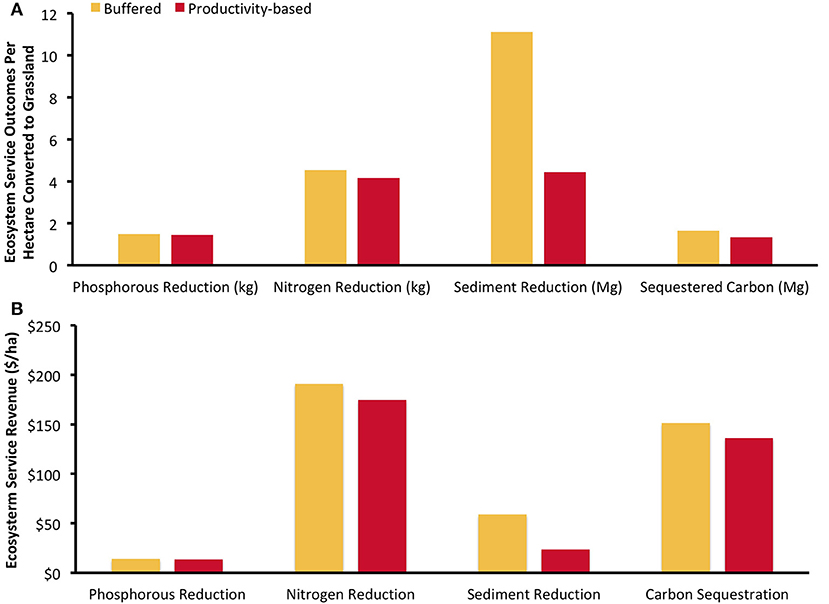
Figure 3. Per hectare annualized ecosystem service outcomes in each alternative scenario simulated in the Grand River Basin, Iowa and Missouri, USA (A); phosphorus, nitrogen, and sediment values are loss reduction while the carbon value is an increase. Annualized ecosystem service related revenue also shown (B).
Economic valuation
We estimated baseline field-level per-ha annualized costs (2022 USD; Supplementary Table S9) and net revenue associated with producing a bioenergy grassland crop in Iowa and Missouri assuming three discount rates, three different yields, and eight different farmgate selling prices for the biomass. Our cost assessment methods are similar to those utilized in studies that examined perennial cover establishment as either an in-field practice or in riparian areas (e.g., Roberts et al., 2009; Bravard et al., 2022) as well as part of biomass production systems (James et al., 2010; Manatt et al., 2013). The costs and net revenues for bioenergy grassland crop varied depending on scenario due to differences in the opportunity cost of land and the assumed biomass yield which impacted harvesting costs. Opportunity costs of land were calculated by using area-weighted land rent estimates for the counties in the GRB which are largely determined by relevant soil productivity measures; the Corn Suitability Rating in Iowa and the National Commodity Crop Productivity Index in Missouri (Massey and Brown, 2021; Plastina et al., 2022). As noted in Bravard et al. (2022) crop productivity indices are significant factors in determining area land rent as they provide a comparative numerical ranking of soil quality relative to producing a base crop (corn in this case). The average baseline annualized cost of establishing, managing and harvesting a bioenergy grassland crop over a 10-year management horizon in the GRB was estimated to be $592 ha−1 for the Buffered scenario, and $588 ha−1 for the productivity scenario (using a real discount rate of 5%; Supplementary Table S10). Production costs also varied with discount rates (7–9%) from $591 ha−1-$705 ha−1 (Supplementary Table S10). Here we discuss results that use a 10-year average real discount rate of 5% (Table 2). The results from the other two discount prices can be found in the Supplementary material (Supplementary Tables S12, S13). Breakeven prices vary somewhat between the Buffered scenario and the Productivity-based scenario. For the Buffered scenario, results indicate that a biomass selling price above $88 Mg−1 will produce positive net revenue given yields ≥ 6.7 Mg ha−1, a selling price above $50 Mg−1 will produce positive net revenue given yields ≥ 13.5 Mg ha−1, and a selling price above $35 Mg−1 will produce positive net revenue given yields greater than or equal to 20.2 Mg ha−1 (Table 2). For the Productivity-based scenario, results indicate that a biomass selling price above $88 Mg−1 will produce positive net revenue given yields ≥ 6.7 Mg ha−1, a selling price above $49 Mg−1 will produce positive net revenue given yields ≥ 13.5 Mg ha−1, and a selling price above $35 Mg−1 will produce positive net revenue given yields ≥ 20.2 Mg ha−1 (Table 2). These results reflect assumed static establishment, management and harvesting costs for an acre of bioenergy grassland in Iowa and Missouri (Supplementary Table S9), a range of potential but unmeasured yield outcomes, and the assumption that biomass harvest would not occur until year three of the analytical horizon. We also assume that current average land rent is an adequate measure of the opportunity cost of land. The reality is that actual opportunity costs of land may be higher or lower than land rent in any given year and is dependent upon commodity and production prices (Tyndall et al., 2013). Nevertheless, because commodity markets are volatile and difficult to predict, somewhat more temporally stable land rent markets are often deemed an acceptable proxy (Tyndall and Roesch, 2014). Because land rent is largely based on inherent soil productivity, the relative comparative findings among scenarios should remain unchanged (Zimmerman et al., 2019). Ultimately, costs and revenue vary temporally and spatially depending on site-level conditions, production practices, weather, policy, and market conditions for biomass but also various inputs such as land, fertilizer, labor, and seed (Tyndall et al., 2021). Individual biomass systems may also experience additional costs associated with prolonged establishment periods or maintaining the health of any given stand of biomass. Some farmers may experience costs associated with whole stand reestablishment in the case of crop failure or hazard damage due to weather (Liu et al., 2011). Furthermore, in the productivity scenario the in-field costs of grass harvest, baling and on-site transportation and storage would likely be highly variable due to the heterogeneous scale, shape and patchy nature of the biomass systems presented (Nair et al., 2017). Likewise, accessibility in riparian areas can be complicated by moisture conditions during harvest periods and the care often needed to minimize harvest impact in hydrologically sensitive areas (Erdozain et al., 2020). Ultimately the spatial fragmentation of the biomass systems presented in our study would likely carry additional, but unaccounted for logistical and or environmental costs associated with harvesting and on-site handling of biomass materials (Ferrarini et al., 2017).
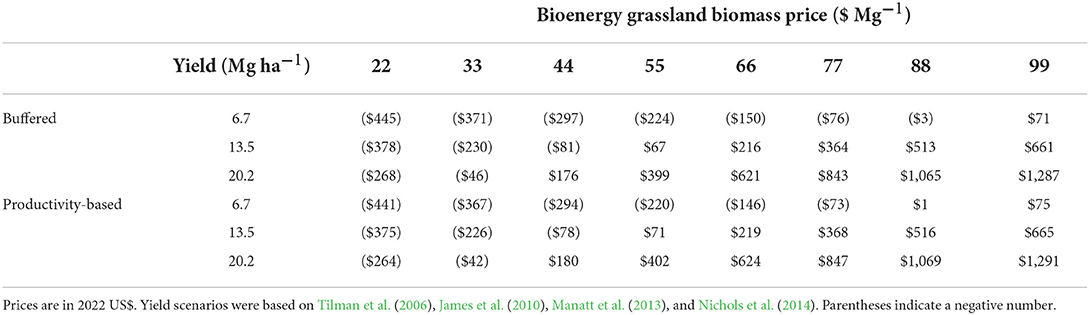
Table 2. Per hectare annualized net revenue of establishing, harvesting and selling bioenergy grassland biomass in Iowa and Missouri, USA given yield and scenario dependent annualized production costs at a 5% discount rate.
Total potential biomass yields in the GRB ranged from 58,075 to 174,226 Mg yr−1 in the Baseline scenario, 110,149 to 330,446 Mg yr−1 in the Buffered scenario, and 671,900 to 2,015,701 Mg yr−1 in the Productivity-based scenario. Given these yields and assuming farmgate selling prices between $22 and $99 Mg−1, total biomass net annual revenue ranged from –$7,311,371 and $21,119,430 in the Buffered scenario, and –$44,227,025 to $128,827,270 in the Productivity scenario (Table 3).
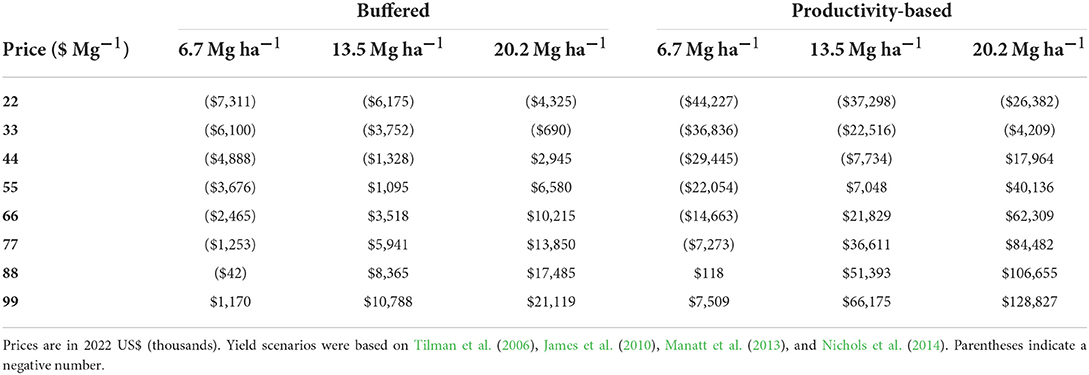
Table 3. Total annual net revenue generated from each modeled scenario in the Grand River Basin assuming yields of 6.7, 13.5, and 20.2 Mg ha −1, farmgate selling prices between $22 and $99 Mg−1, and yield and scenario dependent annualized production costs.
We estimated the potential economic value generated from ecosystem service enhancement for each modeled scenario in the GRB. The annualized value for carbon sequestration within the GRB is the highest among all analyzed ecosystem services in both scenarios. In the Buffered scenario, we estimate the annualized value of nitrogen reduction to be $1,700,529, phosphorus reduction to be $124,089, sediment reduction to be $524,921, and carbon sequestration to be $1,348,229. For the Productivity-based scenario, we estimate the annualized value of nitrogen reduction to be $18,330,016, phosphorus reduction to be $1,428,914, sediment reduction to be $2,467,500, and carbon sequestration to be $14,294,696. Across all modeled services, the Productivity-based scenario generated more ecosystem service related revenue, but also converted a much larger area out of annual crops. We therefore calculated ecosystem service related revenue per-hectare of restored native grassland as well (Figure 3). In the Buffered scenario, we estimated the annualized value of nitrogen reduction to be $220 ha−1, phosphorous reduction to be $16 ha−1, sediment reduction to be $68 ha−1, and carbon sequestration to be $174 ha−1, for a combined annual ecosystem service value of $478 ha−1. For the Productivity-based scenario, we estimated the annualized value of nitrogen reduction to be $201 ha−1, phosphorous reduction to be $16 ha−1, sediment reduction to be $27 ha−1, and carbon sequestration to be $157 ha−1, for a combined annual ecosystem service value of $401 ha−1.
Discussion
Ecosystem services
We constructed and modeled two land-use scenarios for the GRB using InVEST (v 3.7.0) to compare ecosystem service enhancement relative to a baseline scenario. Ecosystem services were enhanced in both the Buffered and Productivity-based scenarios, with greater enhancement in the Productivity-based scenario at the watershed scale. This was primarily due to the variation in area converted to bioenergy grassland in each scenario. Perennial vegetation has been proven to reduce nutrient and sediment loss from agricultural fields, store carbon, and increase pollination services (DeLuca and Zabinski, 2011; Meehan et al., 2013; Asbjornsen et al., 2014; Schulte et al., 2017; Zimmerman et al., 2019), and thus the per unit ecosystem service values assigned to perennial land uses in this model were based on empirical data.
Multiple empirical and modeling studies have determined that increasing perennial vegetation on a landscape will help reduce nutrient and sediment loss to waterbodies (e.g., Dabney et al., 2001; Vaché et al., 2002; Helmers et al., 2012; Asbjornsen et al., 2014; Zhou et al., 2014; Schulte et al., 2017). Perennial vegetation, with its abundant and complex root system increases the ability of agricultural land to slow, filter, and store water (Hernandez-Santana et al., 2013; Gutierrez-Lopez et al., 2014; Zhou et al., 2014). These findings support our results that increasing grassland cover on a landscape will reduce nutrient and sediment loss to waterbodies. We found that the Productivity-based scenario, which simulated land use change from row crops to bioenergy grassland on a greater number of hectares, more greatly reduced nutrient and sediment loss than the Buffered scenario at the watershed scale. Although this relationship might be true in a modeling context, after a certain point more perennial vegetation on a landscape does not necessarily lead to more or measurable water quality benefits. For example, when planting prairie strips within row-cropped catchments in Iowa, Schulte et al. (2017) found little difference in water quality measures between fields with 10% prairie vs. 20% prairie indicating that impacts were not a function of area converted. Dosskey et al. (2002), Dosskey et al. (2005) recorded similar findings regarding the effects of perennial vegetation on water quality. There can also be significant lags associated with the implementation of conservation practices and water quality benefits (Meals et al., 2010), which we did not incorporate in this analysis. Our results, thus, represent reductions in nutrients and sediment independent of time.
When all ecosystem services were measured per unit area of restored grassland, the Buffered scenario performed more efficiently than the Productivity-based scenario. In terms of nutrient and sediment reduction, this is likely due to how grassland was restored on the landscape as well as how InVEST measures nutrient and sediment export. InVEST in part determines nutrient and sediment export of a given pixel in the landscape by measuring the size (or length), slope, and vegetation's retention efficiency and maximum retention efficiency (nutrient export) or C-factor (sediment export) of the area upslope (or downslope) from that pixel to understand the nutrient delivery ratio or soil erosion probability of that pixel. The difference in placement of native grassland between the Buffered and Productivity-based scenario is likely the main reason for the difference in area based nutrient and sediment reduction. While field scale and downstream water quality management practices are spatially explicit in their effectiveness (Rao et al., 2009; Schulte et al., 2017), the area-based differences in nutrient reduction between scenarios were small (<1 kg ). The difference in per hectare sediment reduction is large (7 tons ha−1), and should be more carefully considered. Multiple factors related to site history, topography, and soil affect whether an in-field or edge-of-field practice will be most effective at generating conservation outcomes on any particular field (Tomer et al., 2013). However, multiple studies have found that while perennial vegetation applied within fields keeps nutrients and soil in place (Helmers et al., 2012; Zhou et al., 2014), also placing it within riparian areas can further enhance water quality (Vaché et al., 2002; Dabney et al., 2006). It should be noted that approximately 1.2% of the buffered area was located in areas of low productivity that were also converted to herbaceous vegetation in the Productivity-based scenario. These areas of overlap were mostly located in the northern and southern portions of the GRB (Supplementary Figure S1), and less in the central portion.
Compared to other studies, the reductions in nitrogen and phosphorous we present in the GRB for each land use scenario are conservative. For example, the Iowa Nutrient Reduction Strategy determined that streamside buffers have the ability to reduce phosphorous by 18% and nitrate-nitrogen by 7%, and within-field perennial crops could reduce phosphorous by 29% and nitrate-nitrogen by 18% (depending on area of land converted) (Iowa Nutrient Reduction Strategy (INRS), 2017). Helmers et al. (2011) found restoring only 5% more of a catchment to prairie strips resulted in over 70% reductions in total nitrogen and phosphorous. In terms of per-hectare reductions, Tyndall et al. (2013) cite that prairie strips can reduce phosphorous by 7.32 kg ha−1 and nitrogen by 31.93 kg ha−1. These values are much higher than the per hectare values we present in our scenarios: the Productivity-based scenario restored 4.5% of the GRB to grassland (91,274 ha), resulting in a 2.5–5.6% increase in nutrient retention of the landscape. We do not model the use of prairie strips in our analysis, which are likely better at reducing nutrients due to their spatially explicit placement within field vs. within-watershed as in our case.
Polasky et al. (2011) also used InVEST to simulate multiple alternate land cover scenarios for the state of Minnesota, in which one scenario restored marginal agricultural lands and 100 m of lands along all streams to pre-settlement vegetation (i.e., open water, restored forest, restored grassland, restored wetland, and unknown restored cover). Polasky et al. (2011) found that restoring only ~3% of the land in the state could reduce phosphorous export by 34%. One difference between their study and ours is that they restored lands to pre-settlement vegetation, which included a mix of vegetation types including grassland, wetland, savanna, woodland, and forest, while we restored lands to perennial grassland. Regardless, InVEST modules are designed only to understand the effects of land management (see Hamel, 2014 for model assessment) and results are often sensitive to geographic location, spatial scale, input data (i.e., precipitation, export coefficients), and the resolution of those data sets (Salata et al., 2017; Benez-Secanho and Dwivedi, 2019). For example, Redhead et al. (2018) found that InVEST's nutrient reduction model performed well in terms of the relative magnitude of nitrogen and phosphorus export, but could over or underestimate actual nutrient export by as much as 65%.
Our findings suggest the need for either land use conversion to a much greater amount of continuous living cover and/or the need to include and combine multiple practices (e.g., prairie strips) in order to meet water quality targets for Iowa and Missouri (see Zimmerman et al., 2019). However, incorporating more spatially explicit practices such as prairie strips into our modeling framework and/or using a more robust model like SWAT would only be possible for an investigation considering a different spatial extent, given the distribution of stream gauge stations and monitoring data available in the GRB. Further analyses are also needed that incorporate impacts to subsurface flow and tile drainage through the use of conservation practices that impact those flows (i.e., wetlands, bioreactors, etc.).
Carbon storage was also enhanced with both scenarios compared to the Baseline. The higher amount of carbon stored in the Productivity-based scenario at the watershed level is again due to the larger relative area of bioenergy grassland. Others have demonstrated the potential for perennial vegetation to store carbon below-ground (DeLuca and Zabinski, 2011; Liebman et al., 2014). Compared to certain row crops, perennial species have much more extensive root systems that stay in the ground all year allowing for higher levels of belowground biomass and carbon storage (DeLuca and Zabinski, 2011; Whitmore et al., 2015). For instance, Guzman and Al-Kaisi (2010) found that tallgrass prairie remnant in Iowa had 86% greater belowground carbon storage than a corn-soy rotation, and Glover et al. (2010) found perennial grasslands in Kansas to have 43 Mg ha−1 more soil carbon than annual wheat fields. The per unit values of belowground carbon storage assigned to each land cover type in this analysis were based on empirical data that demonstrate this difference. Since InVEST simply aggregates these per pixel values, scenarios with more potential to store carbon will have greater sequestration as is seen in the Productivity-based scenario. When considered per hectare, the Buffered scenario stored slightly more carbon (~0.3 Mg ha−1). It should be stated that InVEST does not incorporate changes in the rate of carbon storage through time and, eventually, the rate decreases as an equilibrium is reached. The timeline for when this equilibrium is reached depends on climate, soil type, land use, and other factors and occurs over time horizons >50 years (Paustian and Cole, 1998). In this analysis we converted depleted cropland in which soil carbon stocks are likely diminished compared to soils that have never been cultivated. Therefore, in the relatively short 10-year period in which we simulated carbon storage the relationship between increased grassland vegetation and carbon storage was likely linear (Paustian and Cole, 1998). Still, because estimates from this portion of the analysis simply represent potential, we did not consider eventual equilibrium within the landscape. Regardless, with support from a wide body of research (Power, 2010; e.g., Guzman and Al-Kaisi, 2010; DeLuca and Zabinski, 2011; Whitmore et al., 2015), this analysis reveals opportunities to increase the carbon storage potential of the GRB's annual row-crop matrix through the implementation of perennial grassland.
Pollinator abundance as a function of habitat suitability was also modeled in the GRB under each land use scenario. The index of pollinator abundance in the baseline scenario was very low at only 0.1098. Although the pollinator abundance index increased in both alternative scenarios, gains were minor (Table 1). We included three bee genera (Lassioglossum, Melissodes, and Agopostemon) that are commonly found in Midwestern agricultural landscapes like the GRB, as well as Monarch butterflies (Danaus plexippus) as a charismatic insect in conservation need. Monarchs have declined by 80% in North America over the past two decades due to habitat loss (Iowa Monarch Conservation Consortium (IMCC), 2018). Low numbers of pollinators have been reported in highly disturbed and fragmented landscapes (Winfree et al., 2009; Potts et al., 2010; Kennedy et al., 2013) of the U.S. Corn Belt. Foraging resources are often lacking in agriculturally dominated landscapes (Hellerstein et al., 2017) like the GRB (Table 1), and it is therefore not surprising that pollinator abundance estimates were low in the Baseline scenario. The marginal change in pollinator abundance between alternative scenarios and Baseline reflect the relatively small – even if strategic – land use changes incorporated into our scenarios. They also might lie in the complex relationships between pollinators and the landscape that InVEST cannot capture. Models that relate land cover and pollinator abundance across large landscapes are often simplified and limited, a possible result of data coarseness or an incomplete understanding of ecological relationships (Cunningham et al., 2018; Sharp et al., 2018). Many pollinators respond to fine scale landscape features that are not reflected in existing LULC data and/or are challenging to incorporate into models (Sharp et al., 2018).
The InVEST pollinator model assumes resource and nesting availability is uniform across each land cover type (Sharp et al., 2018). In reality, land cover types can vary greatly across space and time due to differences in soil, climate, topography, and management decisions. Additional experimental work is needed to inform landscape and watershed estimations. However, not having enough perennial vegetation on the landscape or in the right places might also explain these marginal changes in abundance. Bennett et al. (2014), using different methods, also measured pollinator abundance in southeast Michigan under two land use scenarios and found that converting 600,000 ha (70%) of agricultural land to perennial bioenergy crops could increase pollinator abundance by 600% in some areas. This might suggest that in order to more greatly increase pollinator abundance in the GRB, more than 91,274 ha of bioenergy grassland would need to be planted, and likely in arrangements that better support their food and nesting needs. Further analyses should compare InVEST to other pollinator models and experiment with more land use scenarios and arrangements.
The greatest opportunities for ecosystem service enhancement occurred primarily in the south-central part of the GRB when targeting low productivity cropland, and in the northern part of the GRB when targeting riparian areas of perennial streams. These spatial relationships exist because most of the row-cropped land in the GRB is along the Grand River and concentrated around its outlet at the bottom of the basin, and the majority of the perennial streams that intersect row-cropped lands are in the northern part of the basin (Figure 2). Incorporating bioenergy grassland within these areas will enhance ecosystem services, and in the Productivity-based scenario it will do so while minimizing costs. Although they are extensive within the GRB (Supplementary Table S2), we did not explore converting pasture or haylands within the GRB to bioenergy land uses. Including these lands in the analysis would likely change the flow of ecosystem services across the basin and offer different opportunities for conservation.
Economic valuation
Private and public economic benefits quantified in this analysis revealed opportunities for enhancement. We demonstrate that the Productivity-based scenario has the capacity to generate more revenue privately than the Buffered scenario, as well as generate more watershed level ecosystem services. While markets for grassland biomass and for ecosystem services are not yet robust, our results indicate that there is potential for both in the GRB. It should be noted, however, that similar land uses such as hay land and land enrolled in CRP may be in competition with bioenergy grasslands in the GRB. Thus, the interests of stakeholders of various land use options should be considered by partnerships working toward creating bioeconomic opportunities. Current data suggest that, in 2016, much of the existing grassland/shrubland in the GRB was likely enrolled in CRP, and a significant portion (44.1%; Supplementary Table S2) of the watershed was devoted to hay and pasture land. Within row-crop plantings of bioenergy grassland may be able to merge well into these existing markets, and as CRP contracts expire or become limited new opportunities for bioenergy grassland could emerge.
Private economic benefits related to the production and sale of bioenergy grassland biomass on low-yielding row-cropped lands in the GRB exist in certain market contexts. We determined that the costs of producing a hectare of low-input bioenergy grassland on low-yielding row-cropped land in the study region ranged from $588 to $712 annually (depending on expected yield and scenario), and could create a positive net revenue depending on yield and biomass price. For example, in the productivity scenario a positive net revenue occurs at a yield of 6.7 Mg ha−1 and selling prices at or above $88 Mg−1. For higher expected yields, lower biomass prices will result in a positive net revenue (Table 2). Based on a sensitivity analysis relative to discount rates, the findings did not vary substantially across higher rate of return expectations (e.g., 7 and 9% real rate of return; Supplementary Tables S12, S13). In this analysis we defined bioenergy grassland to be a mix of perennial native grasses and forbs suitable for conservation outcomes but also annual harvest. Tilman et al. (2006) reported yields of multi-species grassland biomass on degraded lands with low fertility to be 3.7 Mg ha−1, which is significantly lower than yields of mixed species that we suggest could create revenue. However, some studies have found higher yields of mixed perennial species with the use of fertilizer. For example, Daigh et al. (2015) found biomass yields of prairie planted in experimental plots in central Iowa to be 5 Mg ha−1 without fertilizer and 7.6 Mg ha−1 with fertilizer. Nichols et al. (2014) similarly measured biomass of a 31-species tallgrass prairie planted in experimental plots on high quality Midwestern agricultural land and found yields of 7.4 Mg ha−1 without fertilizer and 10.4 Mg ha−1 with fertilizer. Other studies have reported higher yields of single perennial grasses on marginal lands. Schmer et al. (2008) reported switchgrass yields as high as 11 Mg ha−1 on low-yielding Midwest cropland, and Brandes et al. (2018) use a maximum switchgrass yield of 10 Mg ha−1 within Iowa agricultural fields. Furthermore, yield variability across time at any given site due to weather and changes in management add considerable uncertainty to any multi-year biomass assessment (Sharma et al., 2020). This suggests that even with fertilizer boosting biomass yields to maximum levels noted in the literature, relatively high biomass prices (e.g., somewhere above $71 Mg−1) will likely be necessary to generate positive net revenue against variable biomass yield.
Our analysis indicates that, depending on the scenario, at yields of 6.7 Mg ha−1, prices will need to be at least $88 Mg−1 to generate positive revenue. Recent research points to potentially high break-even farmgate prices. James et al. (2010) found the break-even selling price for mixed perennial grasses grown in southern Michigan and southcentral Wisconsin to be $130 Mg−1 and others have reported similar selling prices needed for perennial biomass to be profitable (Khanna et al., 2008; Manatt et al., 2013). In our analysis, higher yields would allow for positive revenue at much lower selling prices (i.e., $55 Mg−1 at 13.5 Mg ha−1 and $44 Mg−1 at 20.2 Mg ha−1); however, it may not be possible to attain those yields on cropland with relatively low productivity ratings as represented in our study (e.g., <=0.5 NCCPI rating).
Beyond questions about yield capacity and consistency across time and space, there are critical unanswered questions regarding institutional, market, infrastructural, and social-phycological barriers to farmer and/or landowner adoption of grass-based cropping systems in and around their farm systems. The financial viability of a biomass crop depends upon robust and sustainable bioenergy markets capable of paying unit prices needed to generate consistent net-revenues for landowners while remaining a cost-competitive fuel stock. Historically, broad-scale biofuel biomass markets in the United States have failed to emerge despite legislative mandates (e.g., the 2007 Renewable Fuel Standard; RSF2) and government subsidy programs with regard to research and development (e.g., Ebadian et al., 2020) and local to regional market development (e.g., Miao and Khanna, 2017). There are multiple, interacting factors that have impeded the emergence of regional renewable energy systems centered on biomass fuel. These factors include techno-economic limitations of biofuel industrial processes (Padella et al., 2019), costly supply chain management particularly high handling and transportation costs (Yang et al., 2022), inadequate national and state policy linkages (Miao and Khanna, 2017; McCarty and Sesmero, 2021), and limited landowner and farmer buy-in. Landowners struggle with the legacy of failure regarding bioenergy emergence and continue to question the lack of market development and infrastructure in their regions (Hart et al., 2018). There are additional pragmatic questions regarding the availability of on-farm equipment, compatibility of biomass production to primary cropping systems, land tenure constraints, and available technical support (Khanna et al., 2021). There is however evidence that some landowners would be interested in biomass systems that serve simultaneous production and conservation goals similar to those demonstrated in this study (Hand and Tyndall, 2018).
Along with private economic benefits, converting commodity crops to perennial vegetation can enhance ecosystem services that translate into public economic benefits. We show that in each scenario social benefits are generated from the reduction of water and air pollutants. Water quality values are based on the per unit costs of nitrogen, phosphorus, and sediment related impairments to recreational areas, real estate, and other amenities such as drinking water (more detailed information can be found in the Supplementary material). We valued the reduction of these pollutants to be approximately $2 million per year in the Buffered scenario and $22 million per year in the Productivity-based scenario. Others have valued the enhancement of water quality in similar ways and reported high economic benefit as well (Meehan et al., 2013; e.g., Mishra et al. (2019). Meehan et al. (2013) valued a 29% reduction in phosphorus loading from replacing 16% of corn rotations with perennial-grasses in a 400,000-ha watershed in southern Wisconsin at almost $30 million using a combination of ongoing state-level water quality program payments, estimated avoided phosphorus treatment costs of pollution, and data from a survey that quantified household willingness to pay for reductions in phosphorus loading in surface water.
When calculated per hectare, the Buffered scenario generated more public economic benefits in terms of enhancing water quality (nitrogen and sediment reductions). Therefore, given our data and methods, riparian buffers might be considered more effective at enhancing water quality for public use than our simulated within-field practice. Zhou et al. (2009) tested the effectiveness and economic benefits (including social costs of sediment erosion) of three conservation practices and tillage systems for sediment reduction in the Major Land Resource Areas (MLRA) of Iowa. Although Zhou et al. (2009) did not specifically test riparian buffers against in-field prairie blocks; they did find that when the costs of sediment erosion were considered, conservation practices could out perform each other depending on MLRA and tillage system. We did not compare results in relation to areas of greater erosion or runoff potential. Doing so could provide further insight into where within the GRB within-field practices are more effective than riparian buffers. In addition, a closer look at social cost implications of the two scenarios together might provide further insight.
Carbon sequestration also produced considerable watershed-level public economic benefit at over $1.3 million per year in the Buffered scenario and over $14 million per year in the Productivity-based scenario. These estimates were based on the social cost of carbon given a market discount rate of 7% over a 10-year period (Tol, 2009; Polasky et al., 2011; Sharp et al., 2018). Other studies have calculated potential benefits generated from sequestering carbon using the same method and produced comparable results (Polasky et al., 2011; Johnson et al., 2012; Mishra et al., 2019). For example, Johnson et al. (2012) determined that using perennial vegetation in different amounts within agricultural riparian areas in the Minnesota River Basin generated millions of dollars' worth of climate regulation benefits that varied proportionally with the amount of land converted.
Many scientists have explored the possibility of using perennial vegetation to jointly improve ecosystem services and enhance economic benefits (Meehan et al., 2013; e.g. Blanco-Canqui, 2016; Woodbury et al., 2018). For example, Woodbury et al. (2018) determined that replacing corn with switchgrass in Maryland reduced nitrogen loading and created revenue for growers through ecosystem service enhancement and biomass sales. Conversely, Meehan et al. (2013) determined that although buffering streams with perennial grasses led to higher energy production and ecosystem service enhancement than corn rotations, it did not generate as much income for growers. Meehan et al. (2013) did find that incorporating the societal value of ecosystem service enhancement that is generated from replacing corn with switchgrass outweighs the decrease in grower income; however, markets would need to exist to generate private opportunities associated with biomass production, as well as connect societal benefits to those growers. For example, Mishra et al. (2019) found that planting bioenergy feedstock such as switchgrass on marginal cropland in the Midwest could be better incentivized through both biomass sales and ecosystem service payments. While markets that facilitate the transfer of these economic benefits back to growers are quickly developing (Salzman et al., 2018), we did not include ecosystem service payments into this analysis. Doing so might alleviate the need for high biomass yields or selling prices. Future analyses should incorporate this financial tradeoff. We did explore the potential multifunctionality of bioenergy grassland to provide income to growers and generate public economic benefits through enhanced ecosystem services. Our findings suggest that incorporating perennial grasses and forbs within agricultural fields will create societal value through reductions in water and air pollutants. These perennial plantings may also be able to provide income to farmers if more robust markets were to develop, given certain biomass yields.
Conclusions
This study was the first to quantify potential changes in revenue and the value of multiple ecosystem services associated with grassland restoration in the GRB. We quantify how replacing annual row crops with perennial grasslands in riparian areas and on lower-yielding portions of the agricultural landscape has the ability to jointly enhance water quality, pollinator abundance, and carbon storage in the GRB. Grassland restoration provides a suite of public economic benefits through the reduction of pollutant-related costs, and could provide private economic benefits through the sale of harvested perennial biomass if robust markets were to develop. Our work informs discussion among watershed stakeholders by quantifying potential tradeoffs among alternative land use decisions at varying spatial scales. Future analyses could test other land use scenarios (e.g., cover crops, pastureland) and more ecosystem services (e.g., habitat quality, recreation) to better understand a fuller suite of ecosystem services associated with grassland cover and the potential for layering economic enhancement in the GRB and similar watersheds.
Data availability statement
The original contributions presented in the study are included in the article/Supplementary material, further inquiries can be directed to the corresponding author/s.
Author contributions
EA, LS, and JT contributed to conception and design of the study. EA collected all the data, performed the spatial modeling and statistical analysis, and wrote the first draft of the manuscript. LS and JT helped write and edit sections of the manuscript. All authors contributed to manuscript revision, read, and approved the submitted version.
Acknowledgments
This project was funded by a grant from the Iowa State University Presidential Research Initiative to C-CHANGE, the Consortium for Cultivating Human And Naturally reGenerative Enterprises, and also supported by the USDA-NIFA McIntire-Stennis Program (IOW05534).
Conflict of interest
The authors declare that the research was conducted in the absence of any commercial or financial relationships that could be construed as a potential conflict of interest.
Publisher's note
All claims expressed in this article are solely those of the authors and do not necessarily represent those of their affiliated organizations, or those of the publisher, the editors and the reviewers. Any product that may be evaluated in this article, or claim that may be made by its manufacturer, is not guaranteed or endorsed by the publisher.
Supplementary material
The Supplementary Material for this article can be found online at: https://www.frontiersin.org/articles/10.3389/fsufs.2022.959617/full#supplementary-material
References
Alexander, R. B., Smith, R. A., Schwarz, G. E., Boyer, E. W., Nolan, J. V., and Brakebill, J. W. (2008). Differences in phosphorus and nitrogen delivery to the Gulf of Mexico from the Mississippi River Basin. Environ. Sci. Technol. 42, 822–830. doi: 10.1021/es0716103
Asbjornsen, H., Hernandez-Santana, V., Liebman, M., Bayala, J., Chen, J., Helmers, M., et al. (2014). Targeting perennial vegetation in agricultural landscapes for enhancing ecosystem services. Renew. Agric. Food Syst. 29, 101–125. doi: 10.1017/S1742170512000385
Austin, A. (2011). Show Me Energy Gets Grant for Bioenergy Plant Study. Available online at: http://biomassmagazine.com/articles/5935/show-me-energy-gets-grant-for-bioenergy-plant-study (accessed March 12, 2022).
Benez-Secanho, F. J., and Dwivedi, P. (2019). Does quantification of ecosystem services depend upon scale (Resolution and Extent)? A case study using the invest nutrient delivery ratio model in Georgia, United States. Environments 6, 52. doi: 10.3390/environments6050052
Bennett, A. B., Meehan, T. D., Gratton, C., and Isaacs, R. (2014). Modeling pollinator community response to contrasting bioenergy scenarios. PLoS ONE 9, e110676. doi: 10.1371/journal.pone.0110676
Blanco-Canqui, H. (2016). Growing dedicated energy crops on marginal lands and ecosystem services. Soil Sci Soc Am J. 80, 845–858. doi: 10.2136/sssaj2016.03.0080
Bonham, J. G., Bosch, D. J., and Pease, J. W. (2006). Cost-effectiveness of nutrient management and buffers: comparisons of two spatial scenarios. J. Agric. Appl. Econ. 38, 17–32. doi: 10.1017/S1074070800022045
Bonner, I. J., Cafferty, K. G., Muth, D. J., Tomer, M. D., James, D. E., Porter, S. A., et al. (2014). Opportunities for energy crop production based on subfield scale distribution of profitability. Energies 7, 6509–6526. doi: 10.3390/en7106509
Brandes, E., McNunn, G. S., Schulte, L. A., Bonner, I. J., Muth, D. J., Babcock, B. A., et al. (2016). Subfield profitability analysis reveals an economic case for cropland diversification. Environ. Res. Lett. 11, 014009. doi: 10.1088/1748-9326/11/1/014009
Brandes, E., Plastina, A., and Heaton, E. A. (2018). Where can switchgrass production be more profitable than corn and soybean? An integrated subfield assessment in Iowa, USA. GCB Bioenerg 10, 473–488. doi: 10.1111/gcbb.12516
Bravard, E. E., Zimmerman, E., Tyndall, J. C., and James, D. (2022). The agricultural conservation planning framework financial and nutrient reduction tool: A planning tool for cost effective conservation. J. Environ. Qual. 51, 670–682. doi: 10.1002/jeq2.20345
Butler (2019). Prairie Power: Roeslein Alternative Energy moves toward Horizon 2. Available online at: https://roesleinalternativeenergy.com/prairie-power-roeslein-alternative-energy-moves-toward-horizon-2/ (accessed March 12, 2022).
Cunningham, C., Tyedmers, P., and Sherren, K. (2018). Primary data in pollination services mapping: potential service provision by honey bees (Apis mellifera) in Cumberland and Colchester, Nova Scotia. Int. J. Biodivers. Sci. Ecosyst. Serv. Manag. 14, 60–69. doi: 10.1080/21513732.2017.1417331
Dabney, S. M., Delgado, J. A., and Reeves, D. W. (2001). Using winter cover crops to improve soil and water quality. Commun. Soil. Sci. Plant Anal. 32, 1221–1250. doi: 10.1081/CSS-100104110
Dabney, S. M., Moore, M. T., and Locke, M. A. (2006). Integrated management of in-field, edge-of-field, and after-field buffers. J. Am. Water Resour. Assoc. 42, 15–24. doi: 10.1111/j.1752-1688.2006.tb03819.x
Daigh, A. L., Zhou, X., Helmers, M. J., Pederson, C. H., Horton, R., Jarchow, M., et al. (2015). Subsurface drainage nitrate and total reactive phosphorus losses in bioenergy-based prairies and corn systems. J. Environ. Qual. 44, 1638–1646. doi: 10.2134/jeq2015.02.0080
DeLuca, T. H., and Zabinski, C. A. (2011). Prairie ecosystems and the carbon problem. Front. Ecol. Environ. 9, 407–413. doi: 10.1890/100063
Dobos, R., Sinclair, H. Jr, and Robotham, M. (2012). User Guide for the National Commodity Crop Productivity Index. Washington, DC: US Department of Agriculture–National Resources Conservation Service.
Dobos, R., Sinclair, R., and Hipple, K. (2008). NCCPI National Crop Productivity Index. Nebraska: USDA-NRCS National Soil Survey Center Lincoln.
Dosskey, M. G., Eisenhauer, D. E., and Helmers, M. J. (2005). Establishing conservation buffers using precision information. J. Soil Water Conserv. 60, 349–354. Available online at: https://www.jswconline.org/content/57/6/336.short
Dosskey, M. G., Helmers, M. J., Eisenhauer, D. E., Franti, T. G., and Hoagland, K. D. (2002). Assessment of concentrated flow through riparian buffers. J. Soil Water Conserv. 57, 336–343. Available online at: https://www.jswconline.org/content/60/6/349.short
Ebadian, M., van Dyk, S., McMillan, J. D., and Saddler, J. (2020). Biofuels policies that have encouraged their production and use: An international perspective. Ener. Policy. 147, 111906. doi: 10.1016/j.enpol.2020.111906
Erdozain, M., Emilson, C. E., Kreutzweiser, D. P., Kidd, K. A., Mykytczuk, N., and Sibley, P. K. (2020). Forest management influences the effects of streamside wet areas on stream ecosystems. Ecol. Appl. 30, e02077. doi: 10.1002/eap.2077
Ferrarini, A., Serra, P., Almagro, M., Trevisan, M., and Amaducci, S. (2017). Multiple ecosystem services provision and biomass logistics management in bioenergy buffers: a state-of-the-art review. Renew. Sustain. Energy Rev. 73, 277–290. doi: 10.1016/j.rser.2017.01.052
Fleming, D. A. (2014). Slippage effects of land-based policies: Evaluating the Conservation Reserve Program using satellite imagery. Pap. Reg. Sci. 93, S167–S178. doi: 10.1111/pirs.12049
Foley, J. A., DeFries, R., Asner, G. P., Barford, C., Bonan, G., Carpenter, S. R., et al. (2005). Global consequences of land use. Science 309, 570–574. doi: 10.1126/science.1111772
Gelfand, I., Sahajpal, R., Zhang, X., Izaurralde, R. C., Gross, K. L., and Robertson, G. P. (2013). Sustainable bioenergy production from marginal lands in the US Midwest. Nature 493, 514–517. doi: 10.1038/nature11811
Glover, J. D., Culman, S. W., DuPont, S. T., Broussard, W., Young, L., Mangan, M. E., et al. (2010). Harvested perennial grasslands provide ecological benchmarks for agricultural sustainability. Agric. Ecosyst. Environ. 137, 3–12. doi: 10.1016/j.agee.2009.11.001
gSSURGO Database (2020). Soil Survey Staff. Gridded Soil Survey Geographic (gSSURGO) Database for Iowa and Missouri. United States Department of Agriculture, Natural Resources Conservation Service. Available online at: https://gdg.sc.egov.usda.gov/ (accessed September 21, 2020).
Gulf Hypoxia Action Plan (2008). Gulf Hypoxia Action Plan2008. Available online at: https://www.epa.gov/sites/production/files/2015-03/documents/2008_8_28_msbasin_ghap2008_update082608.pdf (accessed May 25, 2022).
Gutierrez-Lopez, J., Asbjornsen, H., Helmers, M., and Isenhart, T. (2014). Regulation of soil moisture dynamics in agricultural fields using strips of native prairie vegetation. Geoderma. 226, 238–249. doi: 10.1016/j.geoderma.2014.02.013
Guzman, J. G., and Al-Kaisi, M. M. (2010). Soil carbon dynamics and carbon budget of newly reconstructed tall-grass prairies in south central Iowa. J. Environ. Qual. 39, 136–146. doi: 10.2134/jeq2009.0063
Ha, M., and Wu, M. (2022). Environmental and cost benefits of multi-purpose buffers in an agricultural watershed for biomass production. Biofuel Bioprod. Biorefin. 16, 228–243. doi: 10.1002/bbb.2311
Hamel, P. (2014). Uncertainty Analysis of the InVEST 3.0 Nutrient Model: Case Study of the Cape Fear Catchment, NC. Available online at: https://naturalcapitalproject.stanford.edu/sites/g/files/sbiybj9321/f/publications/uncertainty_analysis_of_the_invest_3.0_nutrient_model.pdf (accessed May 25, 2022).
Hand, A. M., and Tyndall, J. C. (2018). A qualitative investigation of farmer and rancher perceptions of trees and woody biomass production on marginal agricultural land. Forests 9, 724. doi: 10.3390/f9110724
Hart, N. M., Townsend, P. A., Chowyuk, A., and Gustafson, R. (2018). Stakeholder assessment of the feasibility of poplar as a biomass feedstock and ecosystem services provider in Southwestern Washington, USA. Forests 9, 655. doi: 10.3390/f9100655
Hellerstein, D., Hitaj, C., Smith, D., and Davis, A. (2017). Land use, Land Cover, and Pollinator Health: A Review and Trend Analysis. Available online at: https://www.ers.usda.gov/publications/pub-details/?pubid=84034 (accessed May 25. 2022).
Helmers, M., Zhou, X., Asbjornsen, H., Kolka, R., and Tomer, M. (2011). “Water quality benefits of perennial filter strips in row-cropped watersheds,” in Proceedings of the 23rd Annual Integrated Crop Management Conference (Ames, IA: Iowa State University), 139–144. doi: 10.31274/icm-180809-270
Helmers, M. J., Zhou, X., Asbjornsen, H., Kolka, R., Tomer, M. D., and Cruse, R. M. (2012). Sediment removal by prairie filter strips in row-cropped ephemeral watersheds. J. Environ. Qual. 41, 1531–1539. doi: 10.2134/jeq2011.0473
Hernandez-Santana, V., Zhou, X., Helmers, M. J., Asbjornsen, H., Kolka, R., and Tomer, M. (2013). Native prairie filter strips reduce runoff from hillslopes under annual row-crop systems in Iowa, USA. J. Hydrol. 477, 94–103. doi: 10.1016/j.jhydrol.2012.11.013
Hirsh, S. M., Mabry, C. M., Schulte, L. A., and Liebman, M. (2013). Diversifying agricultural catchments by incorporating tallgrass prairie buffer strips. Ecol. Restor. 31, 201–211. doi: 10.3368/er.31.2.201
Hoekstra, J. M., Boucher, T. M., Ricketts, T. H., and Roberts, C. (2005). Confronting a biome crisis: global disparities of habitat loss and protection. Ecol. Lett. 8, 23–29. doi: 10.1111/j.1461-0248.2004.00686.x
Iowa Department of Natural Resources (2015). Iowa's Wildlife Action Plan: Securing a Future for Fish and Wildlife. Available online at: https://www.iowadnr.gov/Portals/idnr/uploads/Wildlife%20Stewardship/iwap/iwap_summary.pdf (accessed May 25, 2022).
Iowa Department of Natural Resources (2020). 2020 Assessment Summary 303(d) List of Impaired Waters. Available online at: https://programs.iowadnr.gov/adbnet/Assessments/Summary/2020 (accessed August 24, 2022).
Iowa Monarch Conservation Consortium (IMCC) (2018). Conservation Strategy for the Eastern Monarch Butterfly (Danaus plexippus) in Iowa. Iowa Monarch Conservation Consortium, Iowa State University, IA, USA. Available online at: https://monarch.ent.iastate.edu/files/file/iowa-monarch-conservation-strategy.pdf (accessed May 25, 2022).
Iowa Nutrient Reduction Strategy (INRS) (2017). Prepared by the Iowa Department of Agriculture and Land Stewardship, Iowa Department of Natural Resources and Iowa State University College of Agriculture and Life Sciences, Iowa. Available online at: https://www.nutrientstrategy.iastate.edu/ (accessed May 25, 2022).
Iowa State University Extension Outreach (ISUEO) (2022). Ag Decision Maker. Available online at: https://www.extension.iastate.edu/agdm/ (accessed July 27, 2022).
James, L. K., Swinton, S. M., and Thelen, K. D. (2010). Profitability analysis of cellulosic energy crops compared with corn. J. Agron. 102, 675–687. doi: 10.2134/agronj2009.0289
John, S., and McIsaac, G. (2017). Multifunctional agriculture: a new paradigm of mixed cropping. Solut. J. 8, 66–76. Available online at: https://thesolutionsjournal.com/2017/01/16/multifunctional-agriculture-new-paradigm-mixed-cropping/
Johnson, K. A., Polasky, S., Nelson, E., and Pennington, D. (2012). Uncertainty in ecosystem services valuation and implications for assessing land use tradeoffs: an agricultural case study in the Minnesota River Basin. Ecol Econ. 79, 71–79. doi: 10.1016/j.ecolecon.2012.04.020
Kennedy, C. M., Lonsdorf, E., Neel, M. C., Williams, N. M., Ricketts, T. H., Winfree, R., et al. (2013). A global quantitative synthesis of local and landscape effects on wild bee pollinators in agroecosystems. Ecol. Lett. 16, 584–599. doi: 10.1111/ele.12082
Khanna, M., Chen, L., Basso, B., Cai, X., Field, J. L., Guan, K., et al. (2021). Redefining marginal land for bioenergy crop production. GCB Bioenerg. 13, 1590–1609. doi: 10.1111/gcbb.12877
Khanna, M., Dhungana, B., and Clifton-Brown, J. (2008). Costs of producing miscanthus and switchgrass for bioenergy in Illinois. Biomass Bioenerg. 32, 482–493. doi: 10.1016/j.biombioe.2007.11.003
Li, X., Tack, J. B., Coble, K. H., and Barnett, B. J. (2016). Can crop productivity indices improve crop insurance rates? 333-2016-14429. doi: 10.22004/ag.econ.235750
Liebman, M. Z., Jarchow, M. E., Dietzel, R. N., and Sundberg, D. N. (2014). Above-and Below-Ground Biomass Production in Corn and Prairie Bioenergy Cropping Systems. Available online at: https://dr.lib.iastate.edu/handle/20.500.12876/35932 (accessed May 25, 2022).
Liebman, M. Z., and Schulte, L. A. (2015). Enhancing agroecosystem performance and resilience through increased diversification of landscapes and cropping systems. Elementa 3, 41. doi: 10.12952/journal.elementa.000041
Liu, T. T., McConkey, B. G., Ma, Z. Y., Liu, Z. G., Li, X., and Cheng, L. L. (2011). Strengths, weaknessness, opportunities and threats analysis of bioenergy production on marginal land. Energy Procedia. 5, 2378–2386. doi: 10.1016/j.egypro.2011.03.409
Manatt, R. K., Hallam, A., Schulte, L. A., Heaton, E. A., Gunther, T., Hall, R. B., et al. (2013). Farm-scale costs and returns for second generation bioenergy cropping systems in the US Corn Belt. Environ. Res. Lett. 8, 035037. doi: 10.1088/1748-9326/8/3/035037
Martinez-Feria, R. A., Basso, B., and Kim, S. (2022). Boosting climate change mitigation potential of perennial lignocellulosic crops grown on marginal lands. Environ. Res. Lett. 17, 044004. doi: 10.1088/1748-9326/ac541b
Massey, R., and Brown, B. (2021). Cash rental rates in Missouri. G427. University of Missouri Extension. Available online at: https://extension.missouri.edu/publications/g427 (accessed May 25, 2022).
McCarty, T., and Sesmero, J. (2021). Contracting for perennial energy crops and the cost-effectiveness of the biomass crop assistance program. Energy Policy. 149, 112018. doi: 10.1016/j.enpol.2020.112018
MEA (2005). Millenium Ecosystem Assessment: Ecosystems and Human Well-Being. World Resources Institute.
Meals, D. W., Dressing, S. A., and Davenport, T. E. (2010). Lag time in water quality response to best management practices: a review. J. Environ. Qual. 39, 85–96. doi: 10.2134/jeq2009.0108
Meehan, T. D., Gratton, C., Diehl, E., Hunt, N. D., Mooney, D. F., Ventura, S. J., et al. (2013). Ecosystem-service tradeoffs associated with switching from annual to perennial energy crops in riparian zones of the US Midwest. PloS ONE 8, e80093. doi: 10.1371/journal.pone.0080093
Miao, R., and Khanna, M. (2017). Costs of meeting a cellulosic biofuel mandate with perennial energy crops: Implications for policy. Ener. Econom. 64, 321–334. doi: 10.1016/j.eneco.2017.03.018
Mishra, S. K., Negri, M. C., Kozak, J., Cacho, J. F., Quinn, J., Secchi, S., et al. (2019). Valuation of ecosystem services in alternative bioenergy landscape scenarios. GCB Bioenerg.11, 748–762. doi: 10.1111/gcbb.12602
Missouri Department of Conservation (2015). Missouri State Wildlife Action Plan: conserving healthy fish, forests, and wildlife. Missouri Department of Conservation, Missouri, USA. Available online at: https://mdc.mo.gov/sites/default/files/2020-04/SWAP.pdf (accessed May 25, 2022).
MoDNR (2014). Missouri Nutrient Loss Reduction Strategy. Missouri Department of Natural Resources, Jefferson City, Missouri. Available online at: https://dnr.mo.gov/document-search/missouri-nutrient-loss-reduction-strategy (accessed May 25, 2022).
MoDNR (2020). 2020 EPA Approved Section 303(d) Listed Waters. Available online at: https://dnr.mo.gov/document/2020-epa-approved-section-303d-listed-waters (accessed March 12, 2022).
Multi-Resolution Land Characteristic Consortium (MRLCC) (2018). National Land Cover Database 2016 (NLCD 2016). Available online at: https://www.mrlc.gov/data/nlcd-2016-land-cover-conus (accessed May 1, 2019).
Nair, S. K., Griffel, L. M., Hartley, D. S., McNunn, G. S., and Kunz, M. R. (2018). Investigating the efficacy of integrating energy crops into non-profitable subfields in Iowa. Bioenergy Res. 11, 623–637. doi: 10.1007/s12155-018-9925-0
Nair, S. K., Hartley, D. S., Gardner, T. A., McNunn, G., and Searcy, E. M. (2017). An integrated landscape management approach to sustainable bioenergy production. BioEnergy Res. 10, 929–948. doi: 10.1007/s12155-017-9854-3
Natural Capital, Project. (2019). InVEST. Available online at: https://naturalcapitalproject.stanford.edu/invest/#what-is-invest (accessed May 25, 2022).
Nichols, V. A., Miguez, F. E., Jarchow, M. E., Liebman, M. Z., and Dien, B. S. (2014). Comparison of cellulosic ethanol yields from midwestern maize and reconstructed tallgrass prairie systems managed for bioenergy. Bioenergy Res. 7, 1550–1560. doi: 10.1007/s12155-014-9494-9
NRCS (2006). Land resource regions and major land resource areas of the United States, the Caribbean, and the Pacific Basin. Available online at: https://efotg.sc.egov.usda.gov/references/public/IL/Land_Resource_Regions_and_Major_Land_Resource_Areas_of_the_United_States_USDA_NRCS_1996.pdf (accessed May 25, 2022).
Padella, M., O'Connell, A., and Prussi, M. (2019). What is still limiting the deployment of cellulosic ethanol? Analysis of the current status of the sector. Appl. Sci. 9, 4523. doi: 10.3390/app9214523
Paustian, K. H., and Cole, C. V. (1998). CO2 mitigation by agriculture – an overview. Clim. Change 40, 135–162. doi: 10.1023/A:1005347017157
Pitchford, G., and Kerns, H. (1999). Grand River Watershed Inventory And Assessment. Missouri Department of Conservation, St. Joseph, Missouri. Available online at: https://mdc.mo.gov/sites/default/files/2021-12/140_2021_GrandRiver.pdf (accessed May 25, 2022).
Plastina, A., Johanns, A., and Welter, C. (2022). Cash Rental Rates for Iowa 2022 Survey. Available online at: https://www.extension.iastate.edu/agdm/wholefarm/html/c2-10.html (accessed June 21, 2022).
Polasky, S., Nelson, E., Pennington, D., and Johnson, K. A. (2011). The impact of land-use change on ecosystem services, biodiversity and returns to landowners: a case study in the state of Minnesota. Environ Resour. Econ. 48, 219–242. doi: 10.1007/s10640-010-9407-0
Potts, S. G., Biesmeijer, J. C., Kremen, C., Neumann, P., Schweiger, O., and Kunin, W. E. (2010). Global pollinator declines: trends, impacts and drivers. Trends Ecol. Evol. 25, 345–353. doi: 10.1016/j.tree.2010.01.007
Powell, L. A., Edwards, R., Powell, K. D., and Nieland, K. (2018). Geography of ecotourism potential in the Great Plains: incentives for conservation. Great Plains Res. 28, 15–24. doi: 10.1353/gpr.2018.0001
Power, A. G. (2010). Ecosystem services and agriculture: tradeoffs and synergies. Philos. Trans. Royal Soc. B.: Biol. Sci. 365, 2959–2971. doi: 10.1098/rstb.2010.0143
Prairie Lands (2022). Prairie Lands Bio-Products Purchases Biomass Project Assets. Available online at: https://www.iowaswitchgrass.com/ (accessed March 12, 2022).
Rao, N. S., Easton, Z. M., Schneiderman, E. M., Zion, M. S., Lee, D. R., and Steenhuis, T. S. (2009). Modeling watershed-scale effectiveness of agricultural best management practices to reduce phosphorus loading. J. Environ. Manage. 90, 1385–1395. doi: 10.1016/j.jenvman.2008.08.011
Redhead, J. W., May, L., Oliver, T. H., Hamel, P., Sharp, R., and Bullock, J. M. (2018). National scale evaluation of the InVEST nutrient retention model in the United Kingdom. Sci. Total Environ. 610, 666–677. doi: 10.1016/j.scitotenv.2017.08.092
Reed, D. (2020). Ecosystem Services Markets Conceived and Designed for US Agriculture. Soil and Water Conservation: A Celebration of, 75. Available online at: https://www.swcs.org/static/media/cms/75th_Book__Chapter_6_9EED1D79CE996.pdf (accessed July 27, 2022).
Ritchie, H., and Roser, M. (2019). Crop Yields. Available online at: https://ourworldindata.org/crop-yields#the-trade-off-between-higher-yields-and-land-use (accessed May 25, 2022).
Roberts, D. C., Clark, C. D., English, B. C., Park, W. M., and Roberts, R. K. (2009). Estimating annualized riparian buffer costs for the Harpeth River watershed. Appl. Econom. Perspect. Policy. 31, 894–913. Available online at: https://www.jstor.org/stable/40588534
Salata, S., Garnero, G., Barbieri, C. A., and Giaimo, C. (2017). The integration of ecosystem services in planning: An evaluation of the nutrient retention model using InVEST software. Land 6, 48. doi: 10.3390/land6030048
Salzman, J., Bennett, G., Carroll, N., Goldstein, A., and Jenkins, M. (2018). The global status and trends of payments for ecosystem services. Nature Sustain. 1, 136–144. doi: 10.1038/s41893-018-0033-0
Schmer, M. R., Vogel, K. P., Mitchell, R. B., and Perrin, R. K. (2008). Net energy of cellulosic ethanol from switchgrass. PNAS. 105, 464–469. doi: 10.1073/pnas.0704767105
Schulte, L. A. (2014). Prairie strips: bringing biodiversity, improved water quality, and soil protection to agriculture. Missouri Prairie J. 35, 12. Available online at: https://www.nrem.iastate.edu/research/STRIPS/files/publication/Schulte%202014%20MoPrairieJournal%20–%20Prairie%20Strips.pdf
Schulte, L. A., Asbjornsen, H., Liebman, M., and Crow, T. R. (2006). Agroecosystem restoration through strategic integration of perennials. J. Soil Water Conserv. 61, 164A−169A. Available online at: https://www.jswconline.org/content/61/6/164A.short
Schulte, L. A., Niemi, J., Helmers, M. J., Liebman, M., Arbuckle, J. G., James, D. E., et al. (2017). Prairie strips improve biodiversity and the delivery of multiple ecosystem services from corn–soybean croplands. PNAS. 114, 11247–11252. doi: 10.1073/pnas.1620229114
Schulze, J., Frank, K., Priess, J. A., and Meyer, M. A. (2016). Assessing regional-scale impacts of short rotation coppices on ecosystem services by modeling land-use decisions. PloS ONE 11, e0153862. doi: 10.1371/journal.pone.0153862
Sharma, B. P., Yu, T. E., English, B. C., Boyer, C. N., and Larson, J. A. (2020). Impact of government subsidies on a cellulosic biofuel sector with diverse risk preferences toward feedstock uncertainty. Energy Policy 146, 111737. doi: 10.1016/j.enpol.2020.111737
Sharp, R., Tallis, H. T., Ricketts, T., Guerry, A. D., Wood, S. A., Chaplin-Kramer, R., et al. (2018). InVEST user's guide. The Natural Capital Project: Stanford, CA, USA. Available online at: https://invest-userguide.readthedocs.io/en/latest/ (accessed May 25, 2022).
Shepherd, P. (2000). Pioneering energy crops in the Midwest, project update: Chariton Valley. National Renewable Energy Lab. (NREL), Golden, CO (United States). https://www.nrel.gov/docs/fy00osti/28112.pdf (accessed May 25, 2022).
Tilman, D., Hill, J., and Lehman, C. (2006). Carbon-negative biofuels from low-input high-diversity grassland biomass. Science 314, 1598–1600. doi: 10.1126/science.1133306
Tomer, M. D., Porter, S. A., James, D. E., Boomer, K. M. B., Kostel, J. A., and McLellan, E. (2013). Combining precision conservation technologies into a flexible framework to facilitate agricultural watershed planning. J. Soil Water Conserv. 68, 113A−120A. doi: 10.2489/jswc.68.5.113A
Tyndall, J., and Roesch, G. E. (2014). Agricultural water quality BMPs: a standardized approach to financial analysis. J. Ext. 52, 1.
Tyndall, J. C., Schulte, L. A., Liebman, M., and Helmers, M. (2013). Field-level financial assessment of contour prairie strips for enhancement of environmental quality. Environ. Manag. 52, 736–747. doi: 10.1007/s00267-013-0106-9
Tyndall, J. C., Valcu-Lisman, A., Bogert, M., and Zobrodsky, A. (2021). The cover crop seed industry: an Indiana case study. J. Appl. Farm Econ. 4, 4. doi: 10.7771/2331-9151.1056
USDA FSA (2020). Conservation Reserve Program Statistics. Available online at: https://www.fsa.usda.gov/programs-and-services/conservation-programs/reports-and-statistics/conservation-reserve-program-statistics/index (accessed March 12, 2022).
Vaché, K. B., Eilers, J. M., and Santelmann, M. V. (2002). Water quality modeling of alternative agricultural scenarios in the us cornbelt. J. Am. Water Resour. Assoc.38, 773–787. doi: 10.1111/j.1752-1688.2002.tb00996.x
Whitmore, A. P., Kirk, G. J. D., and Rawlins, B. G. (2015). Technologies for increasing carbon storage in soil to mitigate climate change. Soil Use Manag. 31, 62–71. doi: 10.1111/sum.12115
Winfree, R., Aguilar, R., Vázquez, D. P., LeBuhn, G., and Aizen, M. A. (2009). A meta-analysis of bees' responses to anthropogenic disturbance. Ecology 90, 2068–2076. doi: 10.1890/08-1245.1
Woodbury, P. B., Kemanian, A. R., Jacobson, M., and Langholtz, M. (2018). Improving water quality in the Chesapeake Bay using payments for ecosystem services for perennial biomass for bioenergy and biofuel production. Biomass Bioenerg. 114, 132–142. doi: 10.1016/j.biombioe.2017.01.024
Yang, P., Cai, X., Hu, X., Zhao, Q., Lee, Y., Khanna, M., et al. (2022). An agent-based modeling tool supporting bioenergy and bio-product community communication regarding cellulosic bioeconomy development. Renew. Sustain. Energy Rev. 167, 112745. doi: 10.1016/j.rser.2022.112745
Zhou, X., Al-Kaisi, M., and Helmers, M. J. (2009). Cost effectiveness of conservation practices in controlling water erosion in Iowa. Soil Tillage Res.106, 71–78. doi: 10.1016/j.still.2009.09.015
Zhou, X., Helmers, M. J., Asbjornsen, H., Kolka, R., Tomer, M. D., and Cruse, R. M. (2014). Nutrient removal by prairie filter strips in agricultural landscapes. J. Soil Water Conserv. 69, 54–64. doi: 10.2489/jswc.69.1.54
Zilverberg, C. J., Johnson, W. C., Owens, V., Boe, A., Schumacher, T., Reitsma, K., et al. (2014). Biomass yield from planted mixtures and monocultures of native prairie vegetation across a heterogeneous farm landscape. Agric. Ecosyst. Environ. 186, 148–159. doi: 10.1016/j.agee.2014.01.027
Zimmerman, E., James, D., Jordahl, J., Magala, R., Schulte Moore, L. A., and Tyndall, J. C. (2022). “Chapter 8. agricultural carbon planning,” in Carbon Science for Carbon Markets: Emerging Opportunities in Iowa. CROP 3175, eds L. Schulte Moore and J Jordahl. (Iowa: Iowa State University Extension and Outreach).
Keywords: continuous living cover, perennial agriculture, bioenergy, environmental benefits, InVEST, natural resource economics, water quality
Citation: Audia E, Schulte LA and Tyndall J (2022) Measuring changes in financial and ecosystems service outcomes with simulated grassland restoration in a Corn Belt watershed. Front. Sustain. Food Syst. 6:959617. doi: 10.3389/fsufs.2022.959617
Received: 01 June 2022; Accepted: 18 August 2022;
Published: 13 September 2022.
Edited by:
Jose G. Franco, Agricultural Research Service (USDA), United StatesReviewed by:
May M. Wu, Argonne National Laboratory (DOE), United StatesDavid Archer, Agricultural Research Service (USDA), United States
Copyright © 2022 Audia, Schulte and Tyndall. This is an open-access article distributed under the terms of the Creative Commons Attribution License (CC BY). The use, distribution or reproduction in other forums is permitted, provided the original author(s) and the copyright owner(s) are credited and that the original publication in this journal is cited, in accordance with accepted academic practice. No use, distribution or reproduction is permitted which does not comply with these terms.
*Correspondence: Ellen Audia, ZWxsZW4uYXVkaWFAc2l1LmVkdQ==
†These authors share last authorship
‡ORCID: Ellen Audia orcid.org/0000-0003-4168-8705
Lisa A. Schulte orcid.org/0000-0003-4433-5008