 Jesús Castillo1,2,3*
 Guy J. D. Kirk3
 M. Jordana Rivero4
 Guillermo Fabini1
 José A. Terra1
 Walter Ayala5
 Alvaro Roel1Pilar Irisarri6
 Stephan M. Haefele2
- 1Programa Nacional de Investigación en Arroz, Instituto Nacional de Investigación Agropecuaria (INIA), Treinta y Tres, Uruguay
- 2Sustainable Soils and Crops, Rothamsted Research, Harpenden, United Kingdom
- 3School of Water, Energy and Environment, Cranfield University, Cranfield, United Kingdom
- 4Net Zero and Resilient Farming, Rothamsted Research, North Wyke, Okehampton, United Kingdom
- 5Programa Nacional de Pasturas, Instituto Nacional de Investigación Agropecuaria (INIA), Treinta y Tres, Uruguay
- 6Laboratorio de Microbiología, Departamento de Biología Vegetal, Universidad de la República, Montevideo, Uruguay
Rotational rice systems, involving pastures, other crops and/or livestock, are common in temperate South America, exemplified by the rice-pasture-livestock system of Uruguay which combines very high rice yields with tight nitrogen (N) balances. The generally good nutrient use efficiency in these systems provides a template for nutrient management in other mixed farming systems, if the underlying processes can be sufficiently well quantified and understood. Here, we studied N balances in rice–non-rice rotations in a long-term experiment in Uruguay, with the aim of parameterizing and testing the DNDC model of N dynamics for such systems for use in future work. The experiment includes three rotations: continuous rice (RI-CONT), rice-soybean (RI-SOY) and rice-pasture (RI-PAST). We considered 9 years of data on N balances (NBAL), defined as all N inputs minus all N outputs; N surplus (NSURP), defined as all N inputs minus only N outputs in food products; and N use efficiency (NUE), defined as the fraction of N inputs removed in food products. We parameterized DNDC against measured yield and input and output data, with missing data on N losses inferred from the N balance and compared with literature values. The model performance was assessed using standard indices of mean error, agreement and efficiency. The model simulated crop yields and rice cumulative N uptake very well, and soil N reasonably well. The values of NBAL were +45 and−20 kg N ha−1 yr−1 in RI-CONT and RI-SOY, respectively, and close to zero in RI-PAST (−6 kg N ha−1 yr−1). Values of NSURP decreased in the order RI-CONT >> RI-SOY > RI-PAST (+115, +25 and +13 kg N ha−1 yr−1, respectively). Values of NUE (84, 54, and 48% for RI-SOY, RI-PAST, and RI-CONT, respectively) decreased as NBAL increased. The sensitivity of DNDC's predictions to the agronomic characteristics of the different crops, rotations and water regimes agreed with expectations. We conclude that the DNDC model as parameterized here is suitable for exploring how to optimize N management in these systems.
Introduction
Increased global trade of crops and livestock as well as the separation of crop and livestock production has led to large imbalances in nutrient budgets across the globe (Grote et al., 2008; Uwizeye et al., 2020). To improve local and global nutrient balances, future food systems should include a return to mixed farming systems with integrated crop and livestock production (Asai et al., 2018; Garrett et al., 2020; Peterson et al., 2020). Such systems have a greater potential for efficient nutrient use and cycling than the intensive single commodity systems that have become dominant globally over the last decades (Martin et al., 2016; Ghimire et al., 2021). For example, until recently rice production in Argentina, Paraguay and southern Brazil was predominantly a monoculture, shifting in the last decade to more complex systems with the inclusion of soybeans or short pastures with livestock (Denardin et al., 2020; Ribas et al., 2021; Macedo et al., 2022). This diversification has helped improve soil conditions, weed control, and farm income, though nutrient management still needs to be improved (De Faccio Carvalho et al., 2021).
An example of a well-integrated system is the national rice-livestock system in Uruguay. This has been practiced for over 50 years, attaining a high level of production for rice (mean grain yields > 8 Mg ha−1 y−1) and an average level for livestock (120 kg liveweight gain ha−1 y−1) (Castillo et al., 2021) for the prevailing production conditions (e.g. climate, pasture management). Analysis of country-level statistics over the last 16 years showed tight positive nitrogen (N) balances of +2–3 kg N ha−1 yr−1 for both the rice and livestock components as well as the whole system (Castillo et al., 2021). This is remarkable given that N inputs to agricultural systems globally range from greatly excessive to inadequate, generating imbalances from environmental pollution to soil N mining (Ladha et al., 2020).
To understand how to optimize nutrient management in such systems, a detailed understanding of local and regional variation in system properties and processes is needed. A good assessment requires detailed data on nutrient inputs and outputs, as well as on loss processes. Regional and national datasets on nutrient balances are inevitably incomplete, especially for gaseous emissions, which are expensive and hard to quantify in detail (Katayanagi et al., 2012). Despite having good data on rice, pasture and livestock production and N budgets (Kanter et al., 2016; Pittelkow et al., 2016), data on gaseous N losses and process modeling of such losses are scarce for the Uruguayan rice-pasture system. Irisarri et al. (2012) and Tarlera et al. (2016) reported very low nitrous oxide (N2O) emissions (< 2 kg N-N2O ha−1 season) from rice across the country. However, the main gaseous N loss process in rice systems is generally volatilization of ammonia (NH3), which can reach up to 50–60% of the applied N (Chowdary et al., 2004; Xu et al., 2013; Chen et al., 2015; Wang et al., 2018). Reliable modeling of NH3 volatilization is therefore needed to fill-in missing data, and to interpret and extrapolate results. Models for this purpose need to capture all the relevant processes equally well.
There are particular challenges in modeling N dynamics in rice-pasture systems, because very different processes operate in the flooded rice phase compared with the non-flooded pasture phase. Under flooded conditions, high rates of loss can occur by (1) NH3 volatilization from the floodwater layer due to daytime increases in floodwater pH (by up to 2 units) as dissolved CO2 is removed in photosynthesis of floodwater algae; and (2) nitrification-denitrification processes in adjacent oxic and anoxic regions in the soil-floodwater system (Kirk, 2004; Buresh et al., 2008). In the alternating pasture phase, N dynamics depend particularly on (1) biological N fixation (BNF) associated with legume species; (2) the effects of grazing animals; and (3) the retention of fixed N in crop residues and soil organic matter for following crops (Peoples and Craswell, 1992; Ledgard, 2001).
Potential models of rice field N dynamics include DayCent, but it does not calculate NH3 volatilization (Del Grosso et al., 2015; Necpálová et al., 2015; Gurung et al., 2021), and CERES-Rice, which does calculate NH3 volatilization but its application to N balances in Uruguayan rice-pasture systems was not promising (Pravia, 2009). The DeNitrification-DeComposition (DNDC) model (Li, 2000) is a widely used process-oriented simulation model of soil C and N biogeochemistry with a focus on agro-ecosystems. Originally developed for simulating GHG emissions from agricultural systems in the USA, the DNDC model has been calibrated and used worldwide (Kesik et al., 2005; Abdalla et al., 2022). The model is dynamic and can capture complex agro-ecosystem interactions for simulating GHG emissions from croplands and other ecosystems. The DNDC model has also been used to simulate crop grain yield and N uptake in lowland rice systems (Babu et al., 2006; Katayanagi et al., 2013; Zhao et al., 2020) as well as in aerobic “upland” crops (Zhang et al., 2018; Jiang et al., 2021; Abdalla et al., 2022).
Our objectives were to parametrize and test the DNDC model for characterizing N dynamics in rice-pasture rotations in Uruguay, and to use the model to examine the components of the N balance in these rotations. We parameterized and tested the model against data from a no-till long-term experiment on direct seeded rice-pasture rotations in Uruguay, with nine years of measurements of yields and the components of the N balance. To the best of our knowledge, this is the first time the DNDC model has been used in multi-cropping systems including perennial pastures and livestock, alternating between dry and flooded soil conditions. If a good fit between predicted and observed data can be achieved, the model will allow us to predict the trajectory of the existing systems and the effects of altering the current management, such as by the intensification of rice cultivation and introduction of non-traditional crops such as soybeans. The results should apply to rice production across temperate South America (Argentina, Brazil, Paraguay, Uruguay) where 1.5 M ha of land is currently used for rice and potentially could shift to more complex systems. The results could help define optimal N fertilization management strategies for such systems.
Materials and methods
The long-term experiment
The experiment is located at the Instituto Nacional de Investigación Agropecuaria (INIA) Treinta y Tres, Paso de la Laguna Experimental Station in the East of Uruguay (33°16′22.2"S; 54°10′23.1W). The climate is mesothermic and humid. Daily mean temperatures is 22.6 ± 0.54°C in summer and 12.0 ± 0.82°C in winter. Annual mean rainfall is 1,354 ± 283 mm and total potential evapotranspiration 1,048 ± 196 mm. The dominant soil type is an Argialboll (main properties in Supplementary Table S1). In the 30 years before the experiment, the area was under a rice-pasture rotation with 2 years of rice followed by 3 years of improved legume pasture. The experiment occupies an area of 7.2 ha, comprising 60 plots, each 60 m long and 20 m wide. There are six rotations in a randomized complete block design with three replications (full details in Supplementary Text S1, Supplementary Table S2). For this study, we selected the three most contrasting rotations in terms of the frequency of rice cultivation and N additions: (a) continuous rice-legume pasture cover crop each year (RI-CONT), (b) rice-pasture cover crop-soybean-legume pasture cover crop every two years (RI-SOY) and (c) rice-pasture cover crop-rice-grazed pasture for 3.5 years every 5 years (RI-PAST) (Table 1).
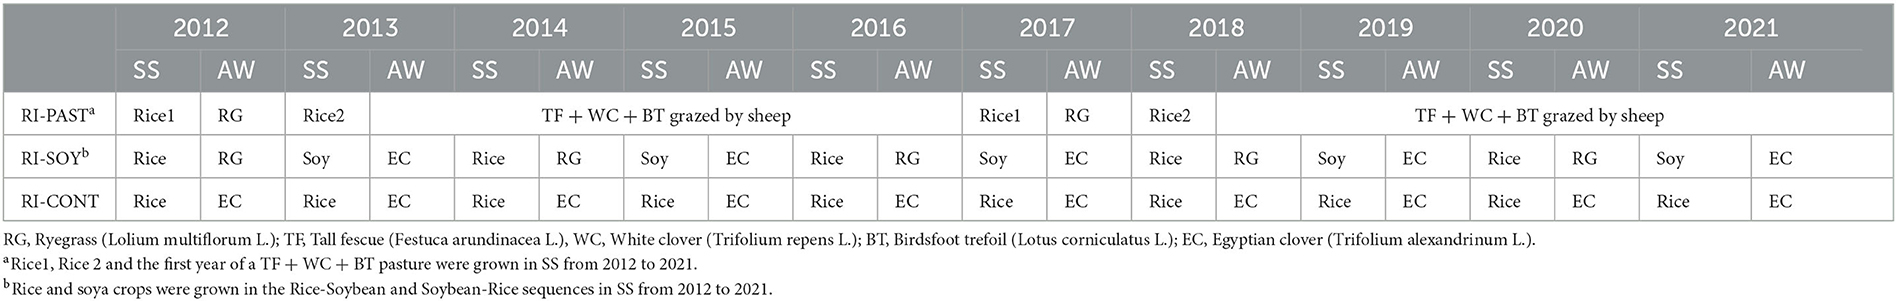
Table 1. Components of the three selected rotations in the long-term experiment in spring-summer (SS) and autumn-winter (AW) seasons from 2012 to 2021.
Field measurements
Data on all management variables for crops and pastures were recorded annually. Rice and soybean yields, nutrient removals with the grain and seasonal pasture production and botanical composition were measured each season. Biological N fixation by the pasture and soybean was estimated based on crop and pasture measurements and literature data. Similarly, N removal in animal tissue were estimated from animal production and literature data (Supplementary Table S3). Climate data (daily maximum and minimum air temperature, precipitation, solar radiation, wind speed and air humidity) were obtained from a weather station at the site.
Aboveground rice N uptake and KCl-extractable NH4-N in the soil during flooding were measured in sub-plots in 2019–2020 and 2020–2021. For rice N uptake, above-ground plant tissue was sampled seven times during the growing season each year, from 15 d after flooding about every 15 d up to harvest. The plant samples were dried at 60°C for 48 h and N concentrations measured by the Dumas method. The soil was sampled seven times from immediately after flooding to 15 d before harvest by inserting a 30-mm diameter scaled tube to 15 cm depth. Six soil samples were taken per plot and bulked. Extractable NH4-N was measured by shaking the wet soil in 2 M KCl for 2 h and analyzing colorimetrically (Nelson, 1983), and allowing for the soil water content. Emissions of N2O were measured in the main plots by the closed chamber technique (Rochette and Eriksen-Hamel, 2008; Minamikawa et al., 2012) every 15 d on average, starting after flooding in the rice crop and 1 week after establishment in pasture and soybean crops and up to the day of the rice drainage, in both crops.
Parameterizing DNDC
DNDC is a process-based model representing C and N biogeochemical cycles in agricultural systems on daily time steps, with four ecological drivers: climate, soil, vegetation and cultural practices (Li, 2000; Simmonds et al., 2015). One component calculates crop growth and soil temperature, moisture, pH, redox potential and substrate (dissolved organic C, hereinafter expressed as DOC, , , CO2, and H2) concentration profiles. A second component calculates nitrification, denitrification and fermentation, simulating CO2, CH4, NH3, NO, N2O, and N2 emissions from the plant-soil system.
For the climate driver, we used on-site data of temperature (maximum and minimum), solar radiation, wind speed, air humidity and precipitation over the study period. The default atmospheric CO2 value was adjusted to 390 ppm for 2012, increasing by 2.5 ppm each year thereafter (NOAA, 2022). Nitrogen concentration in rainfall was set at 0.35 mg l−1 (Zunckel et al., 2003). Soil clay content, pH and organic carbon content were as measured at the start of the experiment (Supplementary Table S1). The depth of the water retention layer (0.6 m) and the drainage efficiency (50%) were estimated based on the site conditions. Bulk density, porosity, soil hydraulic conductivity and available water potential values were calculated by the model from the Input soil property variables.
Annual crop and cultural practices were included in the cropping management sub-model. Grazing by sheep was allowed for in the RI-PAST rotation with grazing frequency (rotational grazing averaging 8 d occupancy and 20 d of regrowth) and stocking rate (28 animals ha−1 on average) as managed in the experiment. To simulate the start of a chemical fallow period in pasture cover crops and pastures in the final productive year, we selected the “crop termination tillage” option, which does not alter the soil surface.
The model was calibrated by adjusting the crop parameters listed in Table 2 to obtain best fits between measured and simulated crop and pasture yields and N balances (total N uptake, grain and straw N partitioning, and soil NH4-N concentrations) in the different rotations over the nine growing seasons. All other parameter values were either as determined above or the DNDC default values.
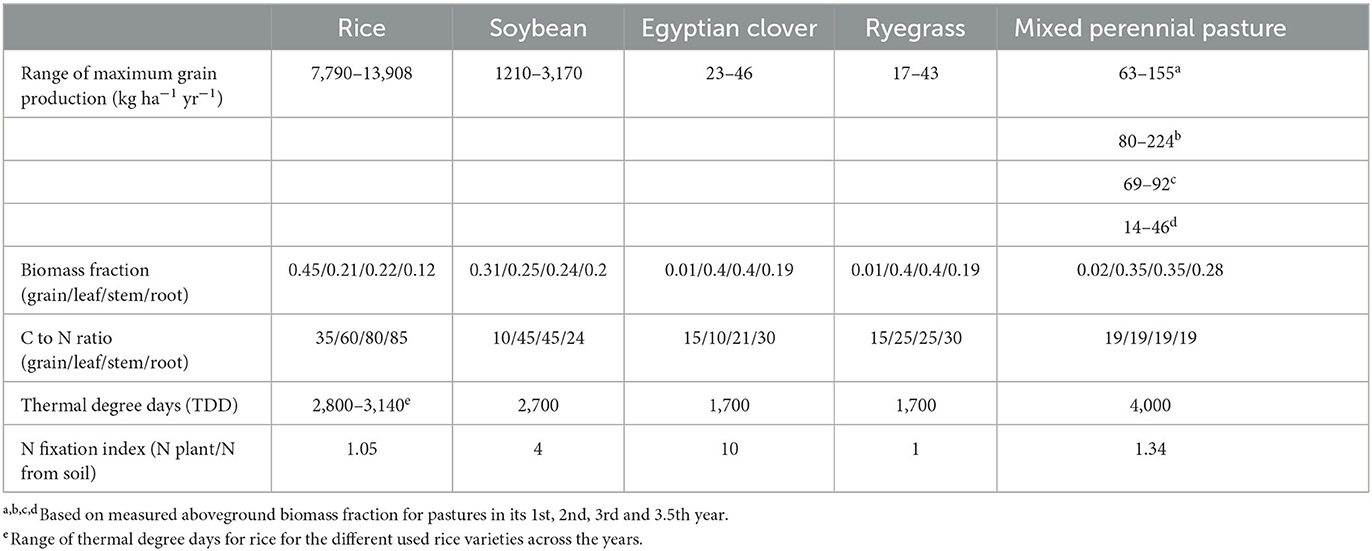
Table 2. DNDC cropping parameter settings used for calibration.
We lacked measurements of NH3 volatilization, but it is an important part of the N budget (Results). We therefore assessed the sensitivity of simulated NH3 volatilization and grain yields to the main soil parameters affecting volatilization (carbon and clay contents and pH) and N fertilization rate. We varied each parameter by −30 to +30 % of the standard value with an increment of 10%, consistent with variability across the main rice regions in Uruguay. We also checked the sensitivity of NH3 volatilization and grain yield to the main crop development parameters (Table 2) by varying values by −15 and +15%. That range covers the expected variability in biomass fraction and C to N ratio in all rice plant components, and thermal degree days accumulation.
Model performance
Model accuracy during calibration and validation stages was tested through three indices following (Yang et al., 2014): mean error (ME), index of agreement (IA) and modeling efficiency (MEF):
where Pi and Oi are the predicted and observed values respectively in season i, and are the respective mean values, and n is the number of seasons. If ME is above or below 0, the model underestimates or overestimates the observed data, respectively. The dimensionless IA index (0 ≤ IA ≤ 1) is used to represent the degree of deviation from zero. The MEF values (–∞ to 1), also dimensionless, assess the goodness-of-fit of the model, with MEF = 1 indicating a perfect fit and 0–1 denoting acceptable fit. For MEF < 0, goodness of fit must be assessed with a t-test.
The good agreement (see results) when comparing simulated and measured field data during the two parametrization stages gave us confidence to use other N parameters simulated by the DNDC model but not measured, to conduct a more complete N budget analysis in the different crop rotation systems.
Nitrogen balance, surplus and use-efficiency
The N balance (NBAL) was calculated as:
where Ninputs = N in fertilizers, BNF, atmospheric N deposition, and Noutputs = N in food products, N gas losses (NH3, N2O, NO2, and NO), and N leached.
All N inputs not retained in food products were considered as potential N loss to the environment and was defined as surplus (NSURP):
Components of Ninputs = as in Equation 1 and Nfoodproducts = amount of N in grain or meat or both.
The N use efficiency was calculated as the fraction of N retained in food products considering all inputs:
where NUE% = N use efficiency expressed in percentage while N in food products and N inputs are the same items as in Equation 5.
Analyses of variance for NBAL, NSURP and NUE% were conducted with a general linear model. In the model, rotation was considered a fixed effect while the block effect nested in year was considered random. A significance level of P ≤ 0.05 was defined and all data was tested for normality and variance homogeneity. Comparisons of the assessed soil parameters during the sensitivity analysis were conducted using multiple t-tests (P ≤ 0.05). All the statistical analyses were performed in the Infostat software (Di Rienzo et al., 2008).
Results
Rice yield
Yields were highest in the RI-SOY and in the first rice of the RI-PAST rotations and lowest in the second rice of the RI-PAST and RI-CONT rotations (Figure 1A). Supplementary Table S4 gives the results of the model assessment using Equations 4–6. The model simulated rice yields well for all rotations over the entire period, with a small average underestimation of −409 kg ha−1 yr−1 (Figure 1A). Analysis within rotations also showed a high association between simulated and observed yields for the first rice of the RI-PAST rotation, the RI-CONT rotation, and the RI-SOY Rotation depending on the RI-SOY rotation sequence (rice-soybean or soybean-rice, respectively). In both cases, the model under or overestimated rice yield on average by −397 and 558 kg ha−1 yr−1, respectively. In contrast, the simulation for the second rice of the RI-PAST rotation was poor with an average yield underestimation of−2,937 kg ha−1 yr−1. This was associated with an average difference in total N uptake of around 25 kg N ha−1 compared with the average N uptake of the first rice in the RI-PAST rotation. Based on that N uptake difference we added the mentioned amount as fertilizer and assuming 50% of fertilizer recovery and repeated the model run.
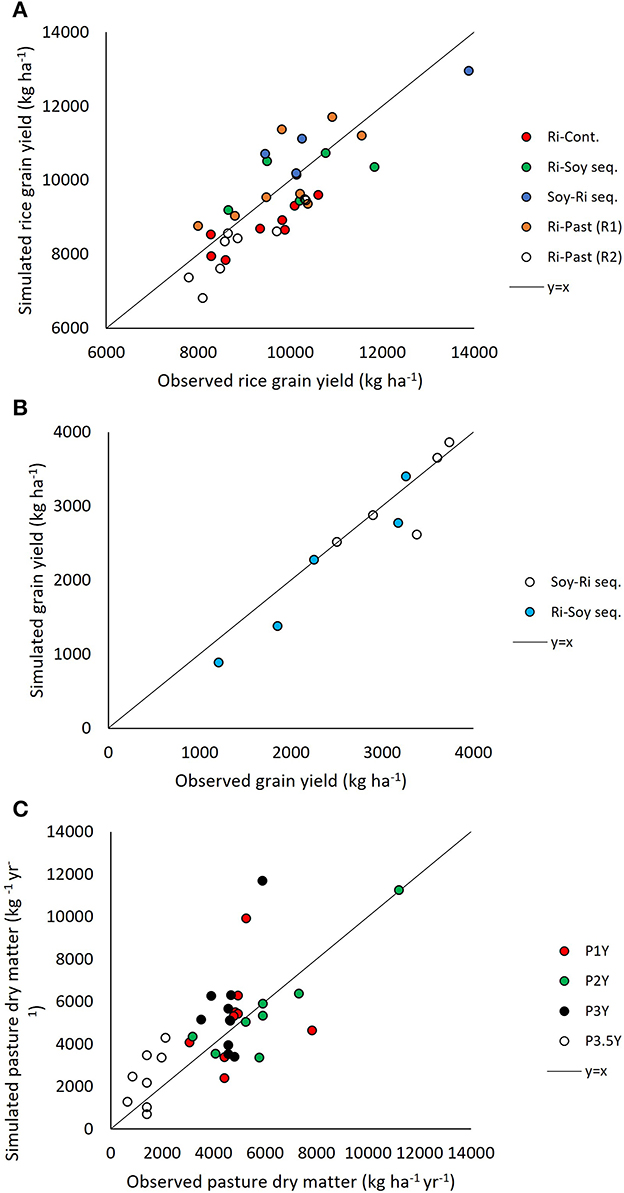
Figure 1. Comparison of simulated and observed (A) rice grain yield, (B) soybean yield, and (C) pasture dry matter from 2012 to 2021.
Soybean yield
Yields tended to be lower and more variable during the first years of the experiment because of dry summers and lack of supplementary irrigation, which started in 2015. As with the rice, soybean yield was predicted well by the DNDC model (Figure 1B). On average, predicted values slightly underestimated yield (−195 kg ha−1 yr−1) but efficiency indices values indicated good agreement. Within the RI-SOY rotation, soybean yield predictions were off by−290 and 118 kg ha−1 yr−1 for the rice-soybean and soybean-rice sequences, respectively, with indices values confirming a good simulation (Supplementary Table S4).
Pasture yield
The greatest pasture production was during the second year and the least during the last cycle which considered only half a year. Dry matter production during the first and third year were similar. Pasture dry matter production in the RI-PAST rotation was well predicted by the model for the yearly average and the pasture growing season. However, this changed when analyzing each growing season separately (Figure 1C). Except for model prediction of second-year pastures, the simulations showed only intermediate values for the goodness of fit index values (Supplementary Table S4). t-tests did not detect differences between predicted vs. observed values except for the third-year pastures (P = 0.04).
Nitrogen uptake and soil N concentration
In both 2019–20 and 2020–21 growing seasons, total rice N uptake was greater in the first rice of the RI-PAST (172 and 177 kg N ha−1) and the RI-SOY (160 and 157 kg N ha−1) systems compared with the second rice of RI-PAST (146 and 120 kg N ha−1) and RI-CONT rotations (146 and 130 kg N ha−1), following the same trends as observed for rice yield. The results of the evaluation index values for cumulative N uptake are shown in Supplementary Table S4. These values indicate that the DNDC model simulated the cumulative rice N uptake in the different rotation systems very well (Figure 2), with a low deviation between predicted and simulated N uptake values. The model could also satisfactorily simulate the amount of N kept in straw and rice grain in the different rotations and years (Figure 3).
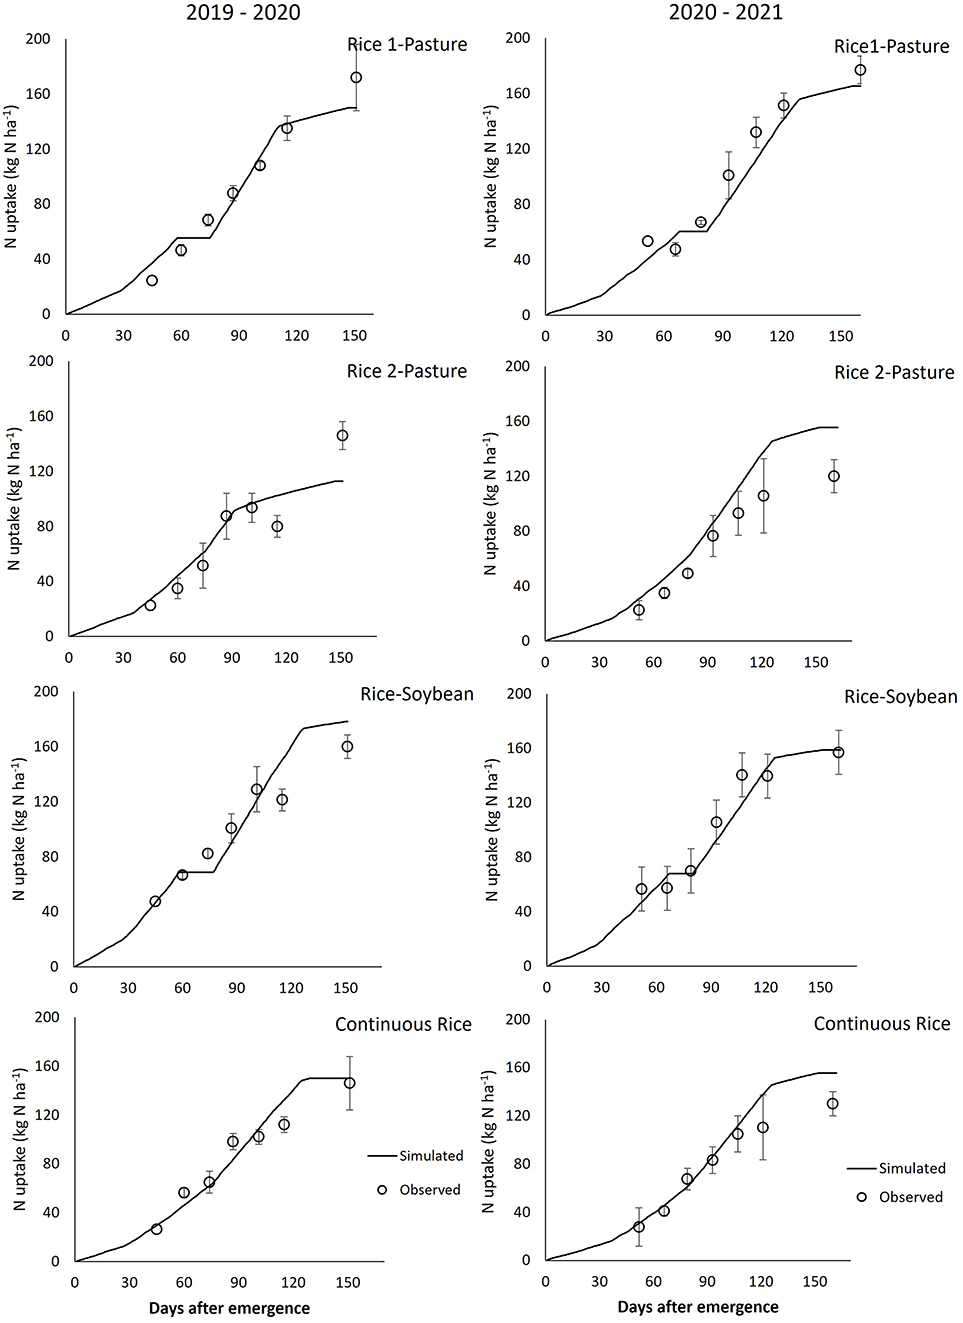
Figure 2. Comparison of simulated and observed rice N uptake (kg N ha−1) in rice-pasture (first and second rice), rice-soybean and continuous rice in the 2019–2020 and 2020–2021 growing seasons. Observed data are means ± standard errors (n = 3).
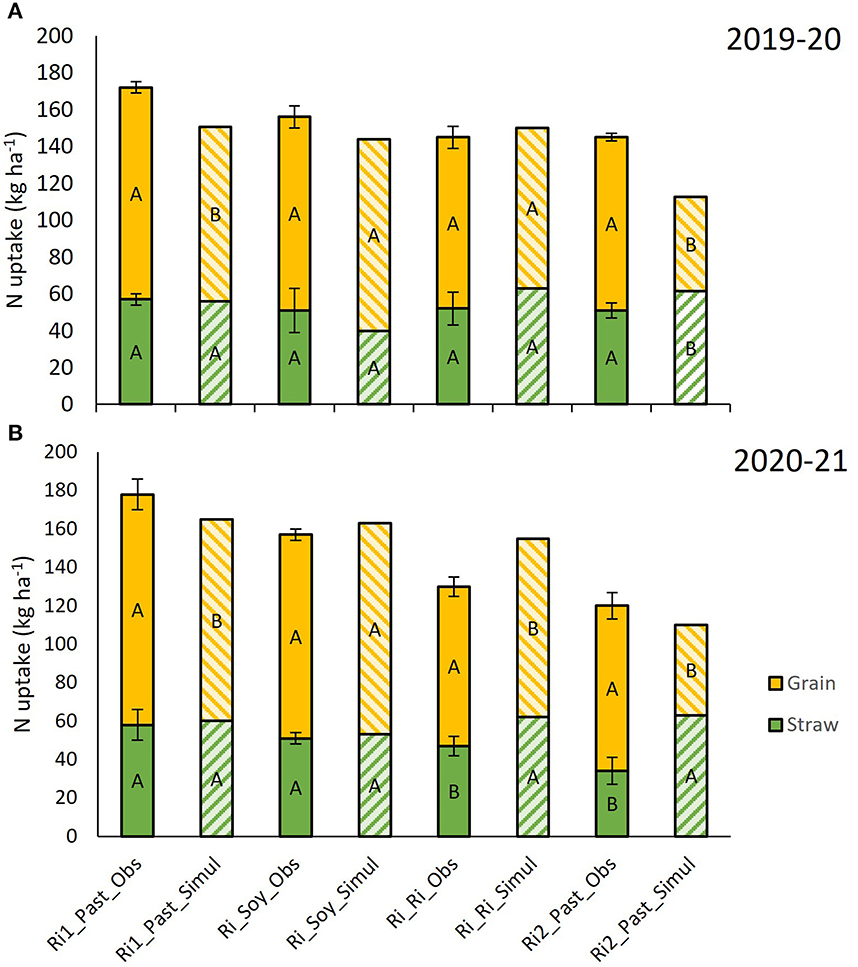
Figure 3. Comparison of simulated and observed rice grain and straw N uptake (kg N ha−1) at physiological maturity in the rice-pasture (first and second rice), rice-soybean and continuous rice in (A) 2019–2020 and (B) 2020–2021 growing seasons. Observed data are means ± standard errors (n = 3). Letters next to bars indicate differences (Fisher 5%) between simulated and observed grain and straw N values for each rotation.
Soil NH4-N concentrations were small (6.3 ± 2.6 and 9.2 ± 5.4 kg N ha−1 during the rice flooded stage in 2019–20 and 2020–21, respectively) and decreased over time. There were no differences between rotations within a year. Index values for soil NH4-N concentration were ME = 1.38 and 0.68; IA = 0.48 and 0.54; MEF = −0.27 and 0.05, for the first and second rice growing season, respectively. Although observed and predicted NH4-N values were very close (10 vs. 6.8 kg ha−1 and 9.8 vs. 8 kg ha−1 in the predicted vs. observed for 2019–2020 and 2020–2021, respectively), index values of model accuracy showed intermediate results (Supplementary Table S4). A paired t-test did not show differences between the predicted and observed values for this variable in the RI-CONT and the first rice of the RI-PAST rotation in both years, but differences were detected for the RI-SOY rotation in 2019–2020 (P = 0.02) and 2020–2021 (P = 0.04). But the trend in simulated and observed soil NH4-N values was close, corresponding to the small range of observed values for this variable (Figure 4).
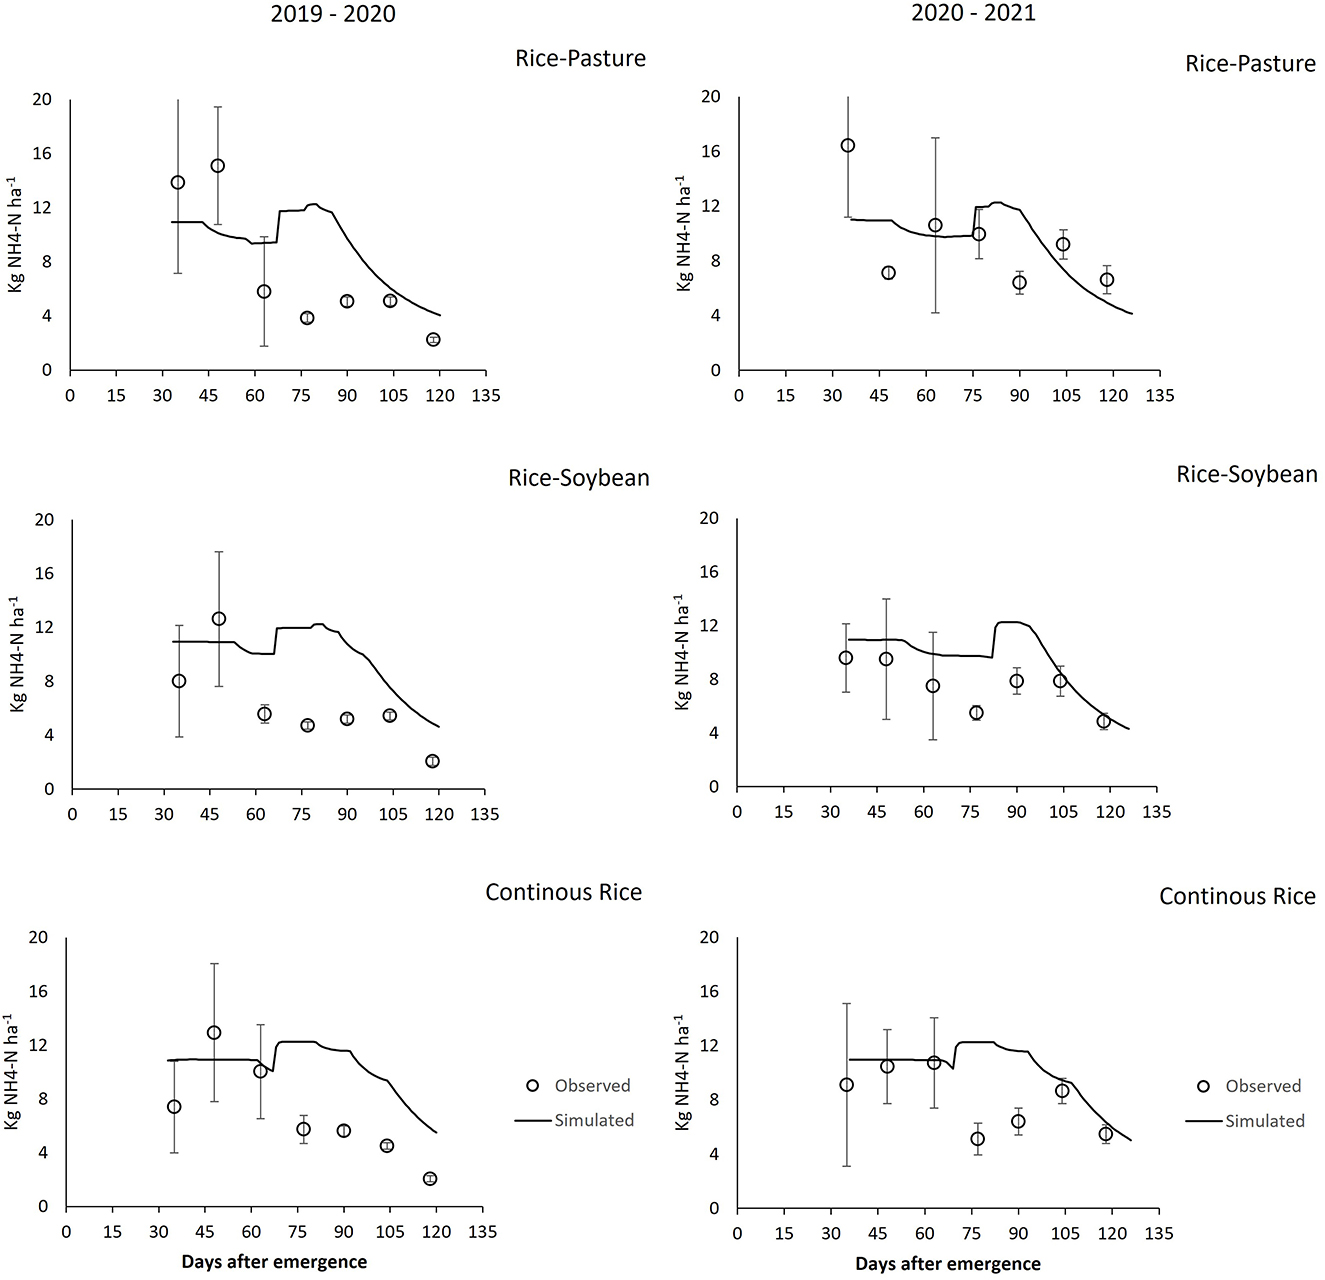
Figure 4. Comparison of simulated and observed NH4-N concentration in the soil during the flooded rice stage in rice-pasture, rice-soybean and continuous rice in 2019–2020 and 2020–2021 growing seasons. Observed data are means ± standard errors (n = 3).
Ammonia emission
Although we do not have measurements of NH3 volatilization against which to test the model predictions directly, the good agreement between measured and modeled N uptake and soil N concentrations suggests that NH3 volatilization is modeled satisfactorily, given that it is the main source of N losses from the soil. We assessed the sensitivity of simulated volatilization to the main model parameters affecting it varied by ±30% of the measured field values (Figure 5). Simulated volatilization and rice yield were moderately sensitive to all the soil parameters tested over this range, and the effects were consistent with expectations. Volatilization increased by 25% with N addition on average across the rotations, by 13% with soil organic C content and by 7% with soil pH. The effect of pH was greater during periods when the soil was drained (around 35 days from rice seeding to the soil being flooded), increasing by 29% with higher soil pH values. Conversely, volatilization decreased by 10% with a 30% increase in soil clay content. The effects of crop parameters on NH3 volatilization ranged from−6 to +8%. In all rotations, rice yields increased slightly with N addition and soil organic C content and decreased with soil clay content and pH. Crop parameters also had small effects on rice yield. In summary, the sensitivity of NH3 volatilization to variations in soil parameters was greater than for crop parameters, and rice yield was little affected by any of the tested parameters. We conclude that the model is well corroborated by the observed crop and pasture growth and N dynamics, and therefore suitable for predicting unmeasured N loss components.
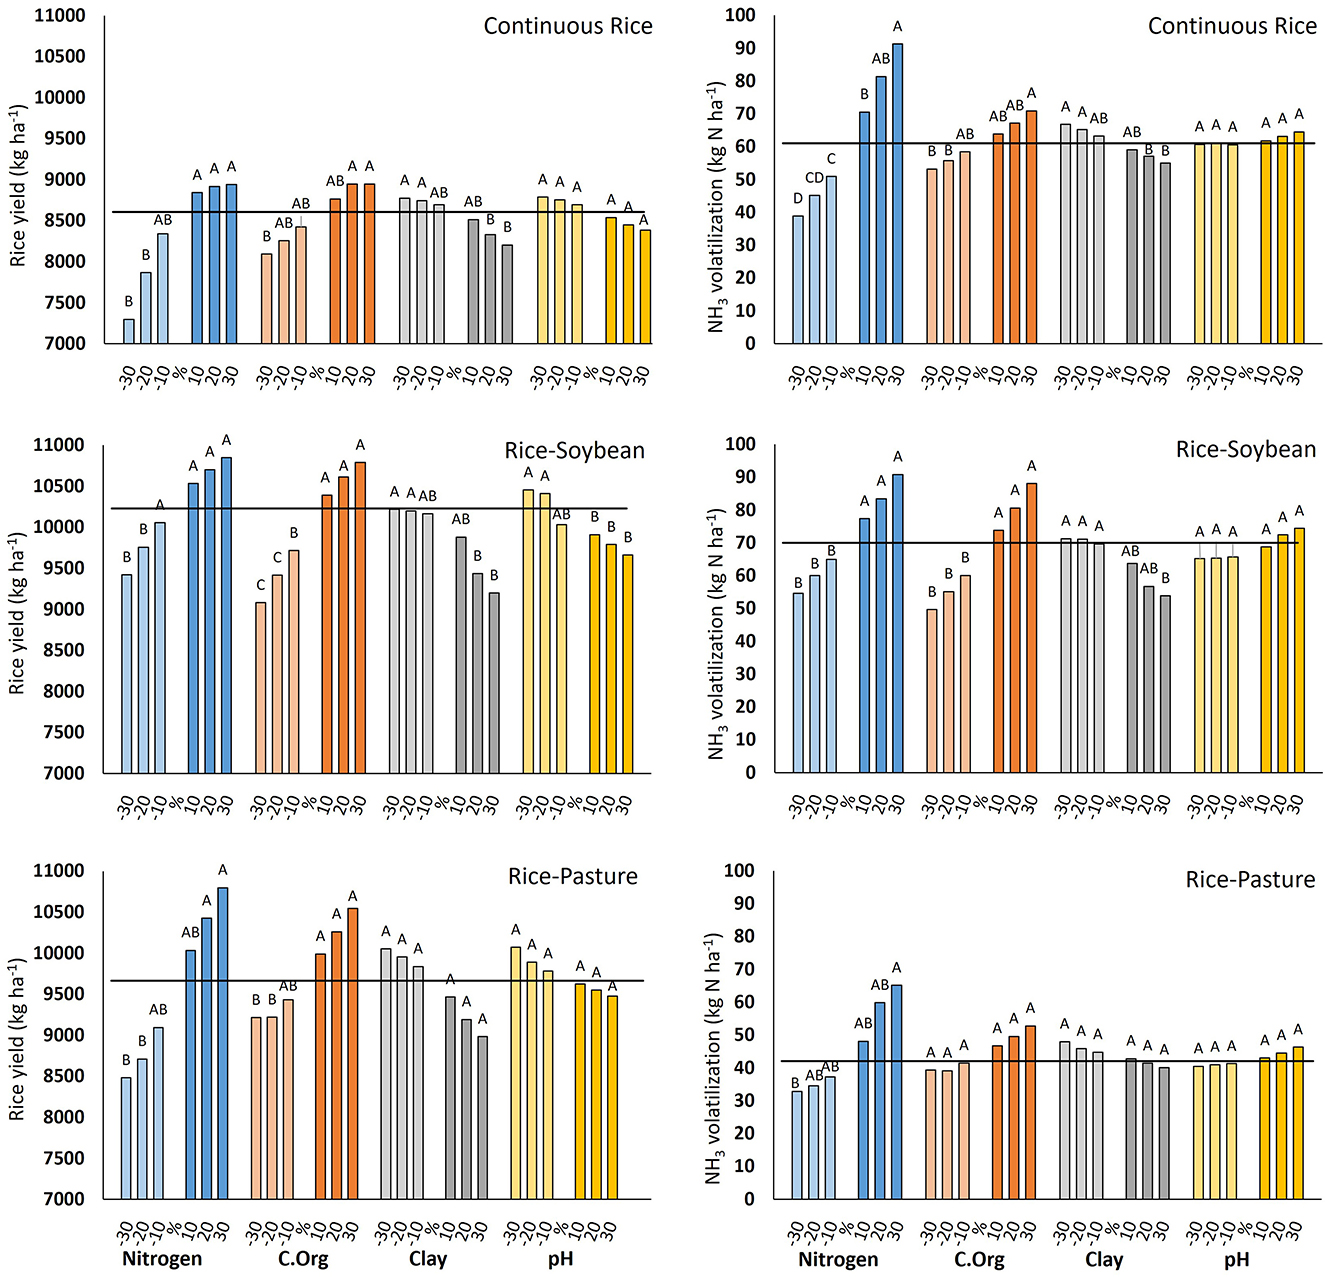
Figure 5. Sensitivity of modeled NH3 volatilization and rice grain yield to variations in the N fertilization rate and soil organic C content, clay content, and pH. The parameter values were varied individually by the indicated values. The horizontal lines are the results with the standard parameter values. Letters next to bars indicate differences (Fisher 5%) associated with percentage variation of each indicated soil parameter.
Nitrous oxide emission
Measured N2O-N emissions were small in the flooded and dry soil stages (0.54 ± 2.6 and 0.37 ± 2.8 g N2O-N ha−1 day−1, respectively). During the pasture phase of the RI-PAST and for rice in RI-CONT rotation, measured and simulated N2O-N values were zero in both growing seasons. Simulated N2O emissions underestimated measured records during the first rice of the RI-PAST rotation (0.54 and 0.13 g N2O-N ha−1 day−1 for 2019–2020 and 2020–2021 respectively) and overestimated for soybean in the RI-SOY rotation (0.5 g N2O-N ha−1 day−1). According to the calculated model accuracy indices values, predicted N2O emissions showed low to intermediate similarity to the observed values (Supplementary Table S4). On average, the range of predicted and measured N2O-N emission values was very narrow, and the values were low (0.45 and 0.48 g ha−1 day−1, respectively). There were no significant differences between predicted and observed values assessed by t-tests in all rotations.
Nitrogen balance, surplus and use-efficiency
Total N inputs accounted for 209, 139 and 51 kg N ha−1 yr−1 in RI-CONT, RI-SOY and RI-PAST respectively. The main N source was fertilizer for RI-CONT (70%) but biological N fixation (BNF) for RI-SOY (66%). In RI-CONT BNF (57 kg N ha−1 yr−1) was due to the Egyptian clover used as cover pasture crop, and in RI-SOY it was due to soybean (136 kg N ha−1 yr−1) and Egyptian clover (47 kg N ha−1 yr−1). The RI-PAST rotation had both the smallest inputs of N fertilizer (26 kg N ha−1 yr−1) and the least BNF (17 kg N ha−1 yr−1). Although N fertilizer rates for RI-SOY (42 kg N ha−1 yr−1) and RI-PAST were small, the average amounts applied to the rice per season over the study period were 84 kg N ha−1 in RI-SOY (4.5 rice crops) and 71 kg N ha−1 in RI-PAST (3.3 rice crops).
The RI-PAST rotation had the smallest N outputs (Figure 6). Nitrogen retained in grain crops accounted for 72, 58 and 51% of total N outputs for RI-SOY, RI-CONT and RI-PAST, respectively, while gaseous N losses represented 30, 42 and 34% of N outputs, respectively. For the three rotations, NH3 volatilization was the main N loss process (39 kg NH3-N ha−1 yr−1). Both N2O emission (4 kg N ha−1 yr−1) and N leaching (2 kg N ha−1 yr−1) were negligible by comparison. Volatilization of NH3 was mainly associated with the rice phase of each rotation (93% on average). Cumulative NH3 volatilization losses were different among rotations being 62, 41 and 17 kg NH3-N ha−1 yr−1 for RI-CONT, RI-SOY and RI-PAST, respectively. The greatest amount of N volatilized was found during the rice phase in the RI-SOY rotation (74 kg NH3-N ha−1) followed by RI-CONT and RI-PAST (61 and 44 kg NH3-N ha−1, respectively), all statistically different. In the absence of N fertilizer addition, simulated volatilization was on average 18, 9 and 15 kg N-NH3 ha−1 for the same rotations.
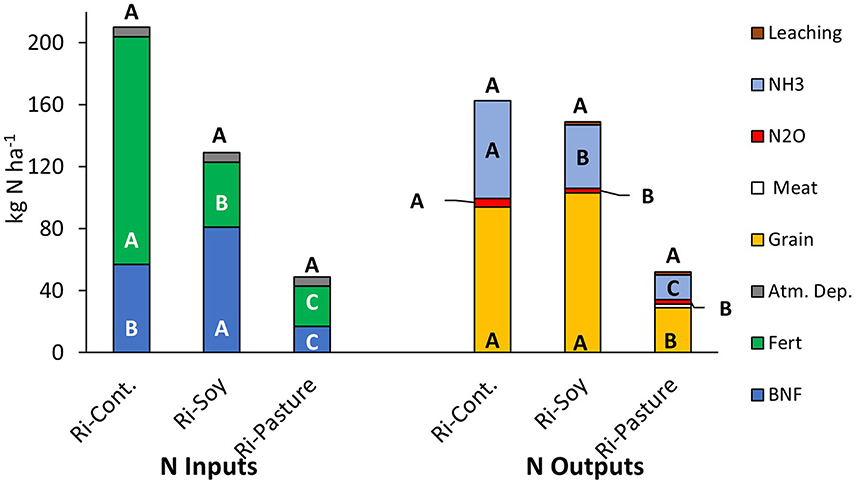
Figure 6. Composition of N inputs and outputs and average N amounts for rice-pasture, rice-soybean and continuous rice in 2019–2020 and 2020–2021 growing seasons. Letters next to bars indicate differences (Fisher 5%) between the rotations for each indicated component.
Differences between N inputs and outputs generated differences in N balances, N surpluses and NUE (Table 3). NBAL ranged from +45 kg N ha−1 yr−1 in RI-CONT to−23 kg N ha−1 yr−1 in RI-SOY, with RI-PAST having an intermediate value (−6 kg N ha−1 yr−1). Because of the high fertilizer N input in RI-CONT, which is similar to the total output of this rotation, the positive NBAL values are close to the BNF and atmospheric deposition inputs (Table 3). In contrast, NBAL was negative in RI-SOY even though one of the rotation components fixed N. The amount of N derived from the atmosphere to the soybean was defined in 75% of the total N uptake, explaining partly that negative N balance. The RI-PAST rotation reached a very tight N balance of −6 kg N ha−1 yr−1. In the RI-CONT rotation, the amount of N not retained in grain from all the N inputs (NSURP) was 115 kg N ha−1 yr−1. This value represented around 79% of the N added as fertilizer. Both, RI-SOY and RI-PAST showed low NSURP values (Table 3). The NUE % was higher in RI-SOY (84%) compared with RI-CONT (48%). The NUE % in RI-PAST was 53%, similar to RI-SOY. Higher NUE% values were associated with less positive NBAL.
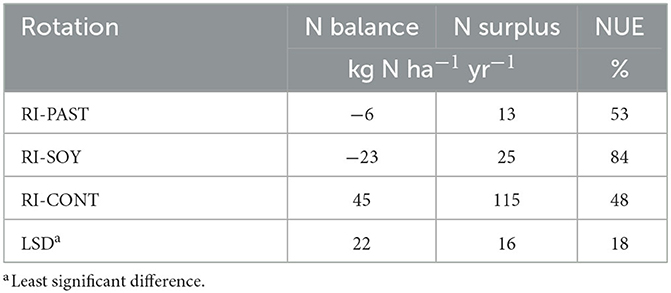
Table 3. Calculated N balance, N surplus and % N use efficiency (defined in Equations 4–6) for the three rotations from 2012 to 2020.
Discussion
Simulation of crop yields and N dynamics
In general, the agreement between observed and simulated rice yield, N uptake and soil N concentration in the different rotations was very good. Given the complexity of the model and the diverse processes simulated, this is good evidence that the important processes are satisfactorily simulated and that the model gives a reliable description of the system.
Yields were somewhat under-predicted (by 9%) in the second rice of the RI-PAST rotation. This was evidently linked to over-prediction of N immobilization in the decomposition of crop residues at the start of the rice season, leading to under-prediction of N uptake. This was reflected in the simulated dissolved organic carbon (DOC) production, heterotrophic respiration and N assimilation by microbes (data not presented). The use of herbicides in the “chemical” fallow of the RI-PAST rotation improves N availability for the subsequent crop through mineralization of residues. Our simulation of this was evidently effective for a legume pasture cover crop or mixed pastures (legume + graminea), but not for Ryegrass, especially when the window between the cover crop and the rice crop was narrow.
Yield of the non-rice crops were slightly underestimated, and pasture production overestimated. This could be explained by the selective grazing of more palatable forage by lambs, tending to degrade the pasture, which is not accounted for in the model (Rutter, 2006; Cuchillo-Hilario et al., 2017).
Observed and predicted N uptake data followed the same trend as the yields. Thus, when observed rice yields showed some degree of deviation from the predicted values, the same occurred for N uptake. However, only the N uptake in the RI-SOY rotation showed a slight underestimation in the predicted N uptake values, and in all cases predicted values followed the observed trend.
Gaseous N losses
The main gaseous N loss was via NH3 volatilization. The DNDC model was mainly developed to estimate GHG emissions, and has been widely used to simulated N2O and CH4 emissions from rice systems but less so for NH3 (Li, 2000; Zhao et al., 2020). In our study, the average rate of volatilization simulated during the rice phase was comparable to measured rates in well-fertilized high-yielding rice systems (Liu et al., 2015). Simulated volatilization in the RI-PAST rotation was comparable to that measured by Shang et al. (2014) in a rice-legume pasture system with a similar N fertilizer dose. On average, the simulated volatilization rate for all the rotations in the absence of N fertilizer addition was 15 kg N ha−1, which is in the range of several studies (Shang et al., 2014; Liu et al., 2015, 2018). The good match between our predicted and published gaseous N losses, and the good agreement between observed and simulated N uptake and soil NH4-N concentrations, gives us confidence that the model satisfactorily describes volatilization.
We found that NH3 volatilization was sensitive to N fertilizer additions and the soil organic C content and, to lesser extents, to soil clay content and pH. Volatilization losses increased in the order RI-SOY > RI-CONT > RI-PAST, matching the increase in soil NH4-N concentration at the beginning of each rice crop with N fertilizer additions and legume BNF. Likewise simulated losses increased with soil organic C content and associated organic N mineralization.
The observed decrease in volatilization with soil clay content is explained by greater retention on soil surfaces, lowering the concentrations in the soil solution and gaseous NH3 in equilibrium with it (Sommer et al., 2001).
The relatively modest effect of the initial soil pH on NH3 volatilization is explained as follows. The main NH3 losses occur when the soil is flooded. The effects of the initial soil pH are small then because of (a) the moderating effect of the biogeochemical changes following soil flooding, which cause the pH of acid and alkali soils to converge on near neutral, and (b) the dominant effect of the alkalinity released in urea hydrolysis in the floodwater [CO(NH2)2 + 3H2O = 2 + + OH−], the floodwater pH being only weakly buffered, independent of the soil pH. Hence the floodwater pH increased from near neutral to pH 9.5 immediately after the third N fertilization.
We found no or only small N2O emissions. There was no significant emission during the pasture phases, but there were small emissions in the first rice of the RI-PAST rotation and in the soybean crop of the RI-SOY rotation with a reasonable match between observed and simulated values given the low rates. Other studies in rice in Uruguay have found similarly low N2O emissions (Tarlera et al., 2006; Irisarri et al., 2012; Illarze et al., 2018). Greater N2O losses are expected in dry-seeded rice at the beginning of the flooding period, at field drainage (around harvest), and after heavy rains during the dry crop phase. Recent report of very high N2O emissions from flooded rice (Kritee et al., 2018) cannot be generalized for all forms of water management (Wassmann et al., 2019).
Nitrogen balance, surplus and use-efficiency
The RI-PAST system had near neutral N balance (−6 kg N ha−1 yr−1), as it did in our earlier evaluation of the rice-livestock system in Uruguay at the national level (+2 kg N ha−1 yr−1; Castillo et al., 2021). The slightly negative balance was explained by greater N removal in animal tissues with higher stocking rates than at the national scale. The forage base of the experiment was sown pastures whereas at the national scale it is almost 100% natural pastures. Although there were differences in N inputs and outputs between the studies, the relations between the main inputs and outputs were similar. Comparing the two studies, ratios of rice grain N/fertilizer N were 1.19 vs. 1.23 and gaseous N losses/total N inputs were 0.30 vs. 0.21.
Nitrogen balance in the RI-CONT system was strongly positive (+45 kg N ha yr−1), despite the high rice yield and high cropping frequency, and was associated with large N surpluses. This was due both to more N fertilizer use and more BNF in the legume cover crop. More positive N balances with smaller N surpluses could be achieved by using improved legume species in the cover crop to increase BNF and reduce N fertilizer use. The model sensitivity analysis showed that less fertilizer N use would reduce NH3 volatilization losses without reducing rice yield. In the last two years of the RI-CONT rotation in the experiment, blooms of the floating macrophyte Lemna minor L. have been observed during rice phase at high N inputs (Supplementary Image S1). Although this phenomenon is not common in the Uruguayan rice system, it is in aquatic environments worldwide with high nutrient load (Goopy and Murray, 2003; Kiage and Walker, 2009). By sequestering N in rice field floodwater, it may reduce NH3 volatilization losses (Li et al., 2009; Sun et al., 2019).
By contrast, N balance in the RI-SOY rotation was negative. This was despite inputs from BNF in both the pasture cover crop and soybean. The N balance of the soybean itself was slightly positive, so the negative balance of the whole rotation was due to soil N mining during the rice phase. This is important because soybean is increasingly important in rice-pasture rotation in temperate South America (Oficina de Estadísticas Agropecuarias, 2018; Ribas et al., 2021) due to higher economic margins and rice yields. The latter is associated by farmers with a contribution of soybean N to the rice. But, as in maize-soybean rotations in the US, the positive effect on rice yield seems to be more related to less N immobilization when rice is grown after soybean than after rice or another crop with high C to N ratio, such as maize (Green and Blackmer, 1995). Therefore, the negative N balance in our results is concerning for this rotation type in the long term.
These results agree with previous results obtained from this experimental platform (Macedo et al., 2021), where 19 % less N was found in the particulate soil organic matter in RI-SOY compared with RI-PAST, even at early stages of the long-term experiment. Soil N depletion due to negative balances has been reported in pure rice-soybean rotations (Benintende et al., 2008; Nishida et al., 2013; Hall et al., 2019). In our study, NBAL in RI-SOY was negative even when the rotation included Egyptian clover as a cover-crop. If that cover crop was not considered in the rotation, the NBAL would be even more negative. To avoid this, a better N nutrition from BNF has to be ensured, particularly by maintaining N fixing pasture species in the rotation. Results from a 6 year study (Landriscini et al., 2019) showed that positive NBAL was achieved in almost all the years and soybean-cover crops treatments. The explanation for the difference compared with our results was the N yields of the used cover crops (118 kg N ha−1), which at least doubled our results. If increasing the rice yields rely only in the addition of more N fertilizer, our model sensitivity analysis suggests there would be no improvement in the negative NBAL. An increase of around 30 kg N fertilizer ha−1 which apparently turns the NBAL of this rotation slightly positive (from −23 to +7 kg ha−1 yr−1), will generate an extra N output of around 7 and 19 kg ha−1 in grain yield and N volatilization, maintaining the negative NBAL.
A clear trend in our results was that, in all three rotations, the higher the NBAL and NSURP values were, the lower was the resulting NUE. A well-managed system should have NUE between 50 and 90% (Oenema et al., 2014). As in Castillo et al. (2021), NUE of the RI-PAST rotation was in this range. However, the higher N inputs in RI-CONT caused a lower NUE of 48%. The opposite was observed in the RI-SOY which reached the highest NUE value, close to the upper threshold. Efficiency values around or above this threshold potentially indicate soil N mining and the negative NBAL values observed for this rotation.
Conclusions
1. The DNDC model successfully simulated crop responses and system N dynamics over the nine years of the rice rotational systems studied. Given the complexity of the model, this is good evidence that the important processes are satisfactorily simulated and that the model gives a reliable description of the system.
2. Though we lacked measurements of NH3 volatilization, which was the main N loss process, our modeled values agreed with literature values for equivalent systems and were sensitive to relevant variables in expected ways, giving us confidence that the modeled volatilization was realistic.
3. Nitrogen management must be carefully optimized if rice rotations are intensified, as exemplified by the RI-CONT rotation where there were large N surpluses and RI-SOY where there were negative N balances, compared with the RI-PAST rotation which had only small N surpluses, neutral N balances and good N use efficiencies.
4. The DNDC model as parameterized here is suitable for exploring how to optimize N management in rice-pasture-livestock systems at regional scales, which is the subject of the companion paper: Castillo et al. (2023).
Data availability statement
The original contributions presented in the study are included in the article/Supplementary material, further inquiries can be directed to the corresponding author.
Author contributions
JC, GF, AR, PI, WA, and JT: data acquisition and curation. JT and AR: LTE project managers and funding acquisition. JC: conceptualization, visualization, interpretation, analysis, modeling, and drafting of the manuscript. GK, SH, MR, and JC: critical thinking and discussion, writing—review, and editing. GF, AR, PI, WA, and JT: manuscript review. All authors listed contributed directly to the manuscript. All authors approved this work for publication.
Funding
JC was funded by a Ph.D. studentship from the National Institute for Agricultural Research (INIA) of Uruguay. Rothamsted Research receives grant-aided support from the Biotechnology and Biological Sciences Research Council (BBSRC) of the United Kingdom. Support in writing up this work was funded by the Institute Strategic Programme (ISP) grant “Soil to Nutrition” (BBS/E/C/000I0310 and BBS/E/C/000I0320) at Rothamsted Research. The contributions by MR were also funded by the Natural Environment Research Council (NERC) under research program NE/W005050/1 AgZero+: Toward sustainable, climate-neutral farming. AgZero+ was an initiative jointly supported by NERC and BBSRC. GK was funded through BBSRC Research Grant BB/P02274X/1. We thank the National Institute of Agricultural Research of Uruguay and the National Research and Innovation Agency (ANII-Uy, FSA_PI_2018_1_148442) for partly supporting this research.
Acknowledgments
The authors are grateful for the help provided by Néstor Serron, Alexander Bordagorri, Irma Furtado and Beto Sosa in the laboratory, field work and database management.
Conflict of interest
The authors declare that the research was conducted in the absence of any commercial or financial relationships that could be construed as a potential conflict of interest.
Publisher's note
All claims expressed in this article are solely those of the authors and do not necessarily represent those of their affiliated organizations, or those of the publisher, the editors and the reviewers. Any product that may be evaluated in this article, or claim that may be made by its manufacturer, is not guaranteed or endorsed by the publisher.
Supplementary material
The Supplementary Material for this article can be found online at: https://www.frontiersin.org/articles/10.3389/fsufs.2023.1103118/full#supplementary-material
References
Abdalla, M., Song, X., Ju, X., and Smith, P. (2022). Evaluation of the DNDC model to estimate soil parameters, crop yield and nitrous oxide emissions for alternative long-term multi-cropping systems in the North China plain. Agronomy 12, 1–16. doi: 10.3390/agronomy12010109
Asai, M., Moraine, M., Ryschawy, J., de Wit, J., Hoshide, A. K., and Martin, G. (2018). Critical factors for crop-livestock integration beyond the farm level: a cross-analysis of worldwide case studies. Land Use Policy 73, 184–194. doi: 10.1016/j.landusepol.2017.12.010
Babu, Y. J., Li, C., Frolking, S., Nayak, D. R., and Adhya, T. K. (2006). Field validation of DNDC model for methane and nitrous oxide emissions from rice-based production systems of India. Nutr. Cycl. Agroecosyst. 74, 157–174. doi: 10.1007/s10705-005-6111-5
Benintende, S. M., Benintende, M. C., Sterren, M. A., and De Battista, J. J. (2008). Soil microbiological indicators of soil quality in four rice rotations systems. Ecol. Indic. 8, 704–708. doi: 10.1016/j.ecolind.2007.12.004
Buresh, R. J., Reddy, K. R., and Kessel, C. V. (2008). “Nitrogen transforamtions in submerged soils,” in Nitrogen in Agricultural Systems, eds J. Schepers and W. Raun (Asa-CSSA-Sssa), 401–436.
Castillo, J., Kirk, G. J. D., Rivero, M. J., Dobermann, A., and Haefele, S. M. (2021). The nitrogen economy of rice-livestock systems in Uruguay. Global Food Security, 30, 100566. doi: 10.1016/j.gfs.2021.100566
Castillo, J., Kirk, G. J. D., Rivero, M. J., and Haefele, S. M. (2023). Regional diferences in nitrogen balance and nitrogen use efficiency in the rice–livestock system of Uruguay. Front. Sustain. Food Syst. 7, 1104229. doi: 10.3389/fsufs.2023.1104229
Chen, A., Lei, B., Hu, W., Lu, Y., Mao, Y., Duan, Z., et al. (2015). Characteristics of ammonia volatilization on rice grown under different nitrogen application rates and its quantitative predictions in Erhai Lake Watershed, China. Nutr. Cycl. Agroecosyst. 101, 139–152. doi: 10.1007/s10705-014-9660-7
Chowdary, V. M., Rao, N. H., and Sarma, P. B. S. (2004). A coupled soil water and nitrogen balance model for flooded rice fields in India. Agric. Ecosyst. Environ. 103, 425–441. doi: 10.1016/j.agee.2003.12.001
Cuchillo-Hilario, M., Wrage-Monnig, N., and Isselstein, J. (2017). Forage selectivity by cattle and sheep co-grazing swards differing in plant species diversity. Grass Forage Sci. 73, 320–329. doi: 10.1111/gfs.12339
De Faccio Carvalho, P. C., Savian, J. V., Chiesa, T., Della, De Souza Filho, W., Terra, J. A., Pinto, P., et al. (2021). Land-use intensification trends in the Rio de la Plata region of south america: toward specialization or recoupling crop and livestock production. Front. Agric. Sci. Eng. 8, 97–110. doi: 10.15302/J-FASE-2020380
Del Grosso, S. J., Parton, W. J., Keough, C. A., and Reyes-Fox, M. (2015). Special features of the DayCent modeling package and additional procedures for parameterization, calibration, validation, and applications. Methods Introd. Syst. Models Agric. Res. 2, 155–176. doi: 10.2134/advagricsystmodel2.c5
Denardin, L. G. D. O., Martins, A. P., Carmona, F. D. C., Veloso, M. G., Carmona, G. I., Carvalho, P. C. D. F., et al. (2020). Integrated crop–livestock systems in paddy fields: new strategies for flooded rice nutrition. Agron. J. 112, 2219–2229. doi: 10.1002/agj2.20148
Di Rienzo, J. A., Casanoves, F., Balzarini, M. G., Gonzalez, L., Tablada, M., and Robledo, C. W. (2008). InfoStat, Versión 2017, Grupo InfoStat, FCA. Argentina: Universidad Nacional de Córdoba.
Garrett, R. D., Ryschawy, J., Bell, L. W., Cortner, O., Ferreira, J., Garik, A. V. N., et al. (2020). Drivers of decoupling and recoupling of crop and livestock systems at farm and territorial scales. Ecol. Soc. 25, 24. doi: 10.5751/ES-11412-250124
Ghimire, S., Wang, J., and Fleck, J. R. (2021). Integrated crop-livestock systems for nitrogen management: a multi-scale spatial analysis. Animals 11, 1–21. doi: 10.3390/ani11010100
Goopy, J. P., and Murray, P. J. (2003). A review on the role of duckweed in nutrient reclamation and as a source of animal feed. Asian-australas. J. Anim. Sci., 16, 297–305. doi: 10.5713/ajas.2003.297
Green, D., and Blackmer, A. (1995). Residue decomposition effects on nitrogen availability to corn following corn or soybean. Soil Sci. Soc. Am. J. 59, 1065–1070. doi: 10.2136/sssaj1995.03615995005900040016x
Grote, U., Craswell, E. T., and Vlek, P. L. G. (2008). “Nutrient and virtual water flows in traded agricultural commodities,” in Land Use and Soil Resources, eds K. Ademola, P. Braimoh, and L. G. Vlek (Dordrecht: Springer), 121–143
Gurung, R. B., Ogle, S. M., Breidt, F. J., Williams, S., Zhang, Y., Del Grosso, S. J., et al. (2021). Modeling ammonia volatilization from urea application to agricultural soils in the DayCent model. Nutr. Cycl. Agroecosyst. 119, 259–273. doi: 10.1007/s10705-021-10122-z
Hall, S. J., Russell, A. E., and Moore, A. R. (2019). Do corn-soybean rotations enhance decomposition of soil organic matter? Plant Soil 444, 427–442. doi: 10.1007/s11104-019-04292-7
Illarze, G., del Pino, A., Riccetto, S., and Irisarri, P. (2018). Emisión de óxido nitroso, nitrificación, desnitrificación y mineralización de nitrógeno durante el cultivo de arroz en 2 suelos de Uruguay. Rev. Argent. Microbiol. 50, 97–104. doi: 10.1016/j.ram.2017.05.004
Irisarri, P., Pereyra, V., Fernández, A., Terra, J., and Tarlera, S. (2012). Emisiones de CH4 y N2O en un arrozal : primeras medidas en el sistema productivo uruguayo. Agrociencia Uruguay 16, 1–10.
Jiang, Z., Yang, S., Ding, J., Sun, X., Chen, X., Liu, X., et al. (2021). Modeling climate change effects on rice yield and soil carbon under variable water and nutrient management. Sustainability 13, su13020568. doi: 10.3390/su13020568
Kanter, D. R., Schwoob, M. H., Baethgen, W. E., Bervejillo, J. E., Carriquiry, M., Dobermann, A., et al. (2016). Translating the sustainable development goals into action: a participatory backcasting approach for developing national agricultural transformation pathways. Glob. Food Secur. 10, 71–79. doi: 10.1016/j.gfs.2016.08.002
Katayanagi, N., Furukawa, Y., Fumoto, T., and Hosen, Y. (2012). Validation of the DNDC-rice model by using CH4 and N2O flux data from rice cultivated in pots under alternate wetting and drying irrigation management. Soil Sci. Plant Nutr. 58, 360–372. doi: 10.1080/00380768.2012.682955
Katayanagi, N., Ono, K., Fumoto, T., Mano, M., Miyata, A., and Hayashi, K. (2013). Validation of the DNDC-Rice model to discover problems in evaluating the nitrogen balance at a paddy-field scale for single-cropping of rice. Nutr. Cycl. Agroecosyst. 95, 255–268. doi: 10.1007/s10705-013-9561-1
Kesik, M., Ambus, P., Baritz, R., Brüggemann, N., Butterbach-Bahl, K., Damm, M., et al. (2005). Inventories of N2O and NO emissions from European forest soils. Biogeosciences 2, 353–375. doi: 10.5194/bg-2-353-2005
Kiage, L. M., and Walker, N. D. (2009). Using NDVI from MODIS to monitor duckweed bloom in Lake Maracaibo, Venezuela. Water Resour. Manage. 23, 1125–1135. doi: 10.1007/s11269-008-9318-9
Kirk, G. J. D. (2004). The Biogeochemistry of Submerged Soils. Chichester: John Wiley. doi: 10.1002/047086303x
Kritee, K., Nair, D., Zavala-Araiza, D., Proville, J., Rudek, J., Adhya, T. K., et al. (2018). High nitrous oxide fluxes from rice indicate the need to manage water for both long- and short-term climate impacts. Proc. Natl. Acad. Sci. USA 115, 9720–9725. doi: 10.1073/pnas.1809276115
Ladha, J. K., Jat, M. L., Stirling, C. M., Chakraborty, D., Pradhan, P., Krupnik, T. J., et al. (2020). Achieving the sustainable development goals in agriculture: the crucial role of nitrogen in cereal-based systems. Adv. Agron. 163, 39–116. doi: 10.1016/bs.agron.2020.05.006
Landriscini, M. R., Galantini, J. A., Duval, M. E., and Capurro, J. E. (2019). Nitrogen balance in a plant-soil system under different cover crop-soybean cropping in Argentina. Appl. Soil Ecol. 133, 124–131. doi: 10.1016/j.apsoil.2018.10.005
Ledgard, S. F. (2001). Nitrogen cycling in low input legume-based agriculture, with emphasis on legume/grass pastures. Plant Soil 228, 43–59. doi: 10.1023/A:1004810620983
Li, C. S. (2000). Modeling trace gas emissions from agricultural ecosystems. Nutr. Cycl. Agroecosyst. 58, 259–276. doi: 10.1023/A:1009859006242
Li, H., Liang, X., Lian, Y., Xu, L., and Chen, Y. (2009). Reduction of ammonia volatilization from urea by a floating duckweed in flooded rice fields. Soil Sci. Soc. Am. J. 73, 1890–1895. doi: 10.2136/sssaj2008.0230
Liu, T., Huang, J., Chai, K., Cao, C., and Li, C. (2018). Effects of N fertilizer sources and tillage practices on NH3 volatilization, grain yield, and N use efficiency of rice fields in central. Front. Plant Sci. 9, 1–10. doi: 10.3389/fpls.2018.00385
Liu, T. Q., Fan, D. J., Zhang, X. X., Chen, J., Li, C. F., and Cao, C. G. (2015). Deep placement of nitrogen fertilizers reduces ammonia volatilization and increases nitrogen utilization efficiency in no-tillage paddy fields in central China. Field Crops Res. 184, 80–90. doi: 10.1016/j.fcr.2015.09.011
Macedo, I., Pravia, M. V., Castillo, J., and Terra, A. (2021). Soil organic matter in physical fractions after intensification of irrigated rice-pasture rotation systems. Soil Till. Res. 213, 105160. doi: 10.1016/j.still.2021.105160
Macedo, I., Terra, J. A., Pittelkow, C. M., and Pravia, M. V. (2022). Irrigated rice rotations affect yield and soil organic carbon sequestration in temperate South America. Agron. J. 114, 1–15. doi: 10.1002/agj2.20964
Martin, G., Moraine, M., Ryschawy, J., Magne, M. A., Asai, M., Sarthou, J. P., et al. (2016). Crop–livestock integration beyond the farm level: a review. Agron. Sustain. Dev. 36, 53. doi: 10.1007/s13593-016-0390-x
Minamikawa, K., Yagi, K., Tokida, T., Sander, B. O., and Wassmann, R. (2012). Appropriate frequency and time of day to measure methane emissions from an irrigated rice paddy in Japan using the manual closed chamber method. Greenhouse Gas Measure. Manage. 2, 118–128. doi: 10.1080/20430779.2012.729988
Necpálová, M., Anex, R. P., Fienen, M. N., Del Grosso, S. J., Castellano, M. J., Sawyer, J. E., et al. (2015). Understanding the DayCent model: calibration, sensitivity, and identifiability through inverse modeling. Environ. Modell. Softw. 66, 110–130. doi: 10.1016/j.envsoft.2014.12.011
Nelson, D. W. (1983). Determination of ammonium in KC1 extracts of soils by the salicylate method. Commun. Soil Sci. Plant Anal. 14, 1051–1062. doi: 10.1080/00103628309367431
Nishida, M., Sekiya, H., and Yoshida, K. (2013). Status of paddy soils as affected by paddy rice and upland soybean rotation in northeast Japan, with special reference to nitrogen fertility. Soil Sci. Plant Nutr. 59, 208–217. doi: 10.1080/00380768.2012.762588
NOAA (2022). Trends in CO2. Global Monitoring Laboratory. Available online at: https://gml.noaa.gov/ccgg/trends/mlo.html (accessed December 11, 2021).
Oenema, O., Bittman, S., Dedina, M., Howard, C., Sutton, MHutchings, N. J., et al. (2014). “Nitrogen management, taking account of the whole nitrogen cycle,” in Options for Ammonia Mitigation Guidance from the UNECE Task Force on Reactive Nitrogen, eds. S. Bittman, M. Dedina, C. Howard, O. Oenema, and M. Sutton (Centre for Ecology and Hydrology (CEH)), 6–9.
Oficina de Estadísticas Agropecuarias (2018). Anuario Estadístico Agropecuario 2018. Ministerio de Ganaderia Agricultura y Pesca, Editorial Hemisferio Sur. Oficina de Estadísticas Agropecuarias. Available online at: https://descargas.mgap.gub.uy/DIEA/Anuarios/Anuario2018/Anuario_2018.pdf (accessed June 15, 2021).
Peoples, M. B., and Craswell, E. T. (1992). Biological nitrogen fixation: investments, expectations and actual contributions to agriculture. Plant Soil 141, 13–39. doi: 10.1007/BF00011308
Peterson, C. A., Deiss, L., and Gaudin, A. C. M. (2020). Commercial integrated crop-livestock systems achieve comparable crop yields to specialized production systems: a meta-analysis. PLoS ONE 15, 0–25. doi: 10.1371/journal.pone.0231840
Pittelkow, C. M., Zorrilla, G., Terra, J., Riccetto, S., Macedo, I., Bonilla, C., et al. (2016). Sustainability of rice intensification in Uruguay from 1993 to 2013. Glob. Food Secur. 9, 10–18. doi: 10.1016/j.gfs.2016.05.003
Pravia, M. V. (2009). Uso de los elementos de agricultura de precisiòn y modelos de simulación para la incorporación de la dimensión espacio temporal en la investigación de cultivos agrícolas: A Impacto de prácticas de manejo de suelos y atributos del terreno en la productivi. Master's Thesis, Universidad de la Reública. Available online at: https://www.colibri.udelar.edu.uy/jspui/bitstream/20.500.12008/1794/1/0029pra.pdf
Ribas, G. G., Zanon, A. J., Streck, N. A., Pilecco, I. B., de Souza, P. M., Heinemann, A. B., et al. (2021). Assessing yield and economic impact of introducing soybean to the lowland rice system in southern Brazil. Agric. Syst. 188, 103036. doi: 10.1016/j.agsy.2020.103036
Rochette, P., and Eriksen-Hamel, N. S. (2008). Chamber measurements of soil nitrous oxide flux: are absolute values reliable? Soil Sci. Soc. Am. J. 72, 331–342. doi: 10.2136/sssaj2007.0215
Rutter, S. M. (2006). Diet preference for grass and legumes in free-ranging domestic sheep and cattle: current theory and future application. Appl. Anim. Behav. Sci. 97, 17–35. doi: 10.1016/j.applanim.2005.11.016
Shang, Q., Gao, C., Yang, X., Wu, P., Ling, N., Shen, Q., et al. (2014). Ammonia volatilization in Chinese double rice-cropping systems: a 3-year field measurement in long-term fertilizer experiments. Biol. Fertil. Soils 50, 715–725. doi: 10.1007/s00374-013-0891-6
Simmonds, M., Changsheng, L., Lee, J., Six, J., van Kessel, C., and Linquist, B. A. (2015). Modeling methane and nitrous oxide emissions from direct-seeded rice systems. J. Geophys. Res. Biogeosci. 120, 2011–2035. doi: 10.1002/2015JG002915.Received
Sommer, S. G., Schjoerring, J. K., and Denmead, O. T. (2001). Ammonia emission from mineral fertilizers and fertilized crops. Adv. Agron. 82, 557–622. doi: 10.1016/s0065-2113(03)82008-4
Sun, H., Dan, A., Feng, Y., Vithanage, M., Mandal, S., Shaheen, S. M., et al. (2019). Floating duckweed mitigated ammonia volatilization and increased grain yield and nitrogen use efficiency of rice in biochar amended paddy soils. Chemosphere 237, 124532. doi: 10.1016/j.chemosphere.2019.124532
Tarlera, S., Capurro, M. C., Irisarri, P., Scavino, A. F., Cantou, G., and Roel, A. (2016). Yield-scaled global warming potential of two irrigation management systems in a highly productive rice system. Sci. Agric. 73, 43–50. doi: 10.1590/0103-9016-2015-0050
Tarlera, S., Gonnet, S., Irisarri, P., Menes, J., Fernández, A., Paolino, G., et al. (2006). “Nitrification and denitrification associated with N2O production in a temperate N-fertilized irrigated Uruguayan rice field,” in Modern Multidisciplinary Applied Microbiology, eds A. Mendez-Vilas, 416–420. doi: 10.1002/9783527611904.ch74
Uwizeye, A., de Boer, I. J. M., Opio, C. I., Schulte, R. P. O., Falcucci, A., Tempio, G., et al. (2020). Nitrogen emissions along global livestock supply chains. Nat. Food 1, 437–446. doi: 10.1038/s43016-020-0113-y
Wang, H., Zhang, D., Zhang, Y., Zhai, L., Yin, B., Zhou, F., et al. (2018). Ammonia emissions from paddy fields are underestimated in China. Environ. Pollut. 235, 482–488. doi: 10.1016/j.envpol.2017.12.103
Wassmann, R., Sander, B. O., Yadav, S., Bouman, B., Singleton, G., Stuart, A., et al. (2019). New records of very high nitrous oxide fluxes from rice cannot be generalized for water management and climate impacts. Proc. Natl. Acad. Sci. USA 116, 1464–1465. doi: 10.1073/pnas.1817694116
Xu, J., Liao, L., Tan, J., and Shao, X. (2013). Ammonia volatilization in gemmiparous and early seedling stages from direct seeding rice fields with different nitrogen management strategies: a pots experiment. Soil Till. Res. 126, 169–176. doi: 10.1016/j.still.2012.07.005
Yang, J. M., Yang, J. Y., Liu, S., and Hoogenboom, G. (2014). An evaluation of the statistical methods for testing the performance of crop models with observed data. Agric. Syst. 127, 81–89. doi: 10.1016/j.agsy.2014.01.008
Zhang, Y., Liu, J., Wang, H., Lei, Q., Liu, H., and Zhai, L. (2018). Suitability of the DNDC model to simulate yield production and nitrogen uptake for maize and soybean intercropping in the North China Plain. J. Integr. Agric. 17, 2790–2801. doi: 10.1016/S2095-3119(18)61945-8
Zhao, Z., Cao, L., Sha, Z., Deng, J., Chu, C., and Zhou, D. (2020). Impacts of fertilization optimization on N loss from paddy fi elds: observations and DNDC modeling case study in Shanghai, China. Soil Till. Res. 199, 1–9. doi: 10.1016/j.still.2020.104587
Keywords: nitrogen use efficiency, DNDC model, nitrogen budgets, nutrient balances, long-term experiment
Citation: Castillo J, Kirk GJD, Rivero MJ, Fabini G, Terra JA, Ayala W, Roel A, Irisarri P and Haefele SM (2023) Measured and modeled nitrogen balances in lowland rice-pasture rotations in temperate South America. Front. Sustain. Food Syst. 7:1103118. doi: 10.3389/fsufs.2023.1103118
Received: 20 November 2022; Accepted: 13 March 2023;
Published: 03 April 2023.
Edited by:
Sudhakar Srivastava, Banaras Hindu University, IndiaReviewed by:
Arvind Kumar Dubey, University of Nebraska, United StatesAbhinav Yadav, Banaras Hindu University, India
Copyright © 2023 Castillo, Kirk, Rivero, Fabini, Terra, Ayala, Roel, Irisarri and Haefele. This is an open-access article distributed under the terms of the Creative Commons Attribution License (CC BY). The use, distribution or reproduction in other forums is permitted, provided the original author(s) and the copyright owner(s) are credited and that the original publication in this journal is cited, in accordance with accepted academic practice. No use, distribution or reproduction is permitted which does not comply with these terms.
*Correspondence: Jesús Castillo, amNhc3RpbGxvQGluaWEub3JnLnV5