 Samuel Rousseau1
 Jonathan Steinke
 Méloé Vincent
- 1Inter Aide, Farafangana, Madagascar
- 2Albrecht Daniel Thaer Institute of Agricultural and Horticultural Sciences, Humboldt University Berlin, Berlin, Germany
- 3Working Group SusLAND, Leibniz Institute for Agricultural Landscape Research, Müncheberg, Germany
- 4Inter Aide, Versailles, France
Rural areas of Madagascar face a tense food and nutrition security situation. The country reports some of the highest rates of undernourishment and malnutrition worldwide. Evidence is scant, however, about how the rural people’s diets vary over the course of the agricultural year, and how different household types deal with fluctuating food availability. This lack of detailed understanding of the food and nutrition security situation across time and social strata currently limits development stakeholders’ ability to tailor interventions to local needs. Using randomly sampled survey data from Farafangana District in south-eastern Madagascar, this study analyzes rural households’ diets across three time points within one year (minor lean period, major lean period, main post-harvest period). In addition, anthropometric data on children aged 6–59 months were collected during the major lean period to determine levels of chronic and acute child malnutrition. Overall, food insecurity stood at high levels at all times, but with substantial variation across the year. Shortly before the main rice harvest, the prevalence of moderate and severe food insecurity was 78%, twice as high as shortly after harvest. With 57% of children stunted and a 17% prevalence of wasting, the observed levels of chronic and acute child malnutrition exceed levels reported previously. By studying what households eat and how they source it (own production vs. purchases), we found distinct patterns of food acquisition between the three periods. Diminishing food security is reflected by substituting rice by cassava, unripe jackfruit (minor lean period), and local tuber tavolo (major lean period), as well as by lower diversity of side dishes. Our results underline the need for long-term agricultural development strategies that contribute to greater household food self-sufficiency especially during the lean periods. But the alarming level of acute child malnutrition also calls for more immediate humanitarian aid and public health interventions.
1. Introduction
Food and nutrition insecurity threaten the health and wellbeing of 2.3 billion people worldwide, especially in low- and middle-income countries (LMICs, FAO et al., 2022). Although there has been significant progress in reducing food and nutrition insecurity over the last decades, the global situation has deteriorated since 2018, in part due to the disruptions caused by the COVID pandemic (Beal et al., 2017; Béné et al., 2021). Many countries are unlikely to meet the goal of eradicating hunger and malnutrition by 2030, as defined by the United Nation’s Sustainable Development Goal 2 (United Nations, 2015). Low farm productivity and poverty, but also natural disasters, weak infrastructure, inefficient food system governance and lack of opportunities for income generation, among other factors, impede the ability of poor people in LMICs to access healthy diets (Siddiqui et al., 2020; Allee et al., 2021; Bjornlund et al., 2022; Hendriks et al., 2022). Average diets in many LMICs tend to be deficient in pulses, vegetables, fruit, and animal-source foods (Micha et al., 2015; Beal et al., 2017; Global Diet Quality Project, 2022; Headey et al., 2023). As a result, almost one in five children worldwide is stunted (FAO et al., 2022), 29% of women of reproductive age suffer from anemia (Stevens et al., 2013), and 69% are affected by micronutrient deficiencies (Stevens et al., 2022).
Madagascar, a low-income country and island state in the Indian Ocean, has some of the worst scores worldwide for key indicators of food and nutrition security (FAO et al., 2022). At population level, the prevalence of undernourishment has grown from 27% in 2010–2012 to 49% in 2019–2021 (FAOSTAT, n.d.). The predominantly rural, smallholder population faces challenges in securing adequate food supply and diets, in part due to the negative effects of recent climate warming, recurrent droughts, and frequent tropical cyclone damage, but also due to small land holdings and low productivity (Harvey et al., 2014; Noromiarilanto et al., 2016; Hänke et al., 2017; Weiskopf et al., 2021).
Cross-sectional, population-level insights on food and nutrition security status are key for identifying regions that should be priority targets of food system interventions, such as food aid distribution or food-for-work programs. Snapshot statistics may, however, also mask the complex realities of food and nutrition insecurity, which can vary between locations, socio-economic strata and livelihoods, or agricultural seasons (Dostie et al., 2002; Fraval et al., 2019a; Herrera et al., 2021; Moore et al., 2022). Analyses of rural households’ diets and their strategies for food acquisition can point to different challenges, needs, and thus intervention priorities, depending on the level of social, temporal, and spatial disaggregation, as well as the choice of indicators (Wichern et al., 2018; Matavel et al., 2022). To design well-targeted policies and sustainable development interventions, a more fine-tuned understanding is needed of how food (in)security is experienced locally by different types of households and at different points in time. Recently, the ‘Great South’ region of Madagascar has received increased attention in the media and academia due to an extreme hunger crisis triggered by prolonged drought (Ahmed and Razafison, 2021; Makoni, 2021; Ralaingita et al., 2022). Less has been documented, however, about the state of food and nutrition security and what it means for people in similarly stressed regions in Madagascar, including the south-eastern Atsimo-Atsinanana region (but see Randrianarison et al., 2020; Moore et al., 2022).
This study intends to inform context-adapted policy and interventions by advancing the understanding of the food and nutrition security situation in the Atsimo-Atsinanana region. To assess this situation, we present survey data from Farafangana District on the food security and diets of 492 rural households. In addition, we explore differences between (i) three seasons within one year, (ii) six household types with different levels of vulnerability, and (iii) different food crops and how they are sourced (own production vs. purchases). We complement these household-level insights with anthropometric data on children’s physical development to analyze the prevalence of child malnutrition among studied households. On the basis of this analysis, we suggest potential interventions for improving food and nutrition security in the Atsimo-Atsinanana region.
2. Methods
2.1. Research context
Research took place in Farafangana District, one of five districts of the Atsimo-Atsinanana region in south-eastern Madagascar (Figure 1). The region is characterized by a humid tropical climate (Köppen climate: Af), receiving roughly 2.000 mm of annual rainfall mostly during the rainy season stretching from November to April. The majority of the population relies on smallholder agriculture, with limited use of inputs and mechanization (CREAM, 2013). The major food security crop, rice, is harvested in May and June. For rice under irrigation, a second, minor harvest takes place in December (FEWS NET, 2013). Many households also cultivate cash crops, including coffee, cloves, cinnamon, and pepper, often in agroforestry systems together with perennial food crops, such as jackfruit, breadfruit, litchi, or banana (FEWS NET, 2013). 95% of the region’s population are considered to live in poverty (INSTAT, 2020), and of the children aged 0–5 years, 49% are stunted and 12% are wasted (INSTAT, 2021). Levels of formal education are below the national average, with an adult literacy rate under 50% (INSTAT, 2020).
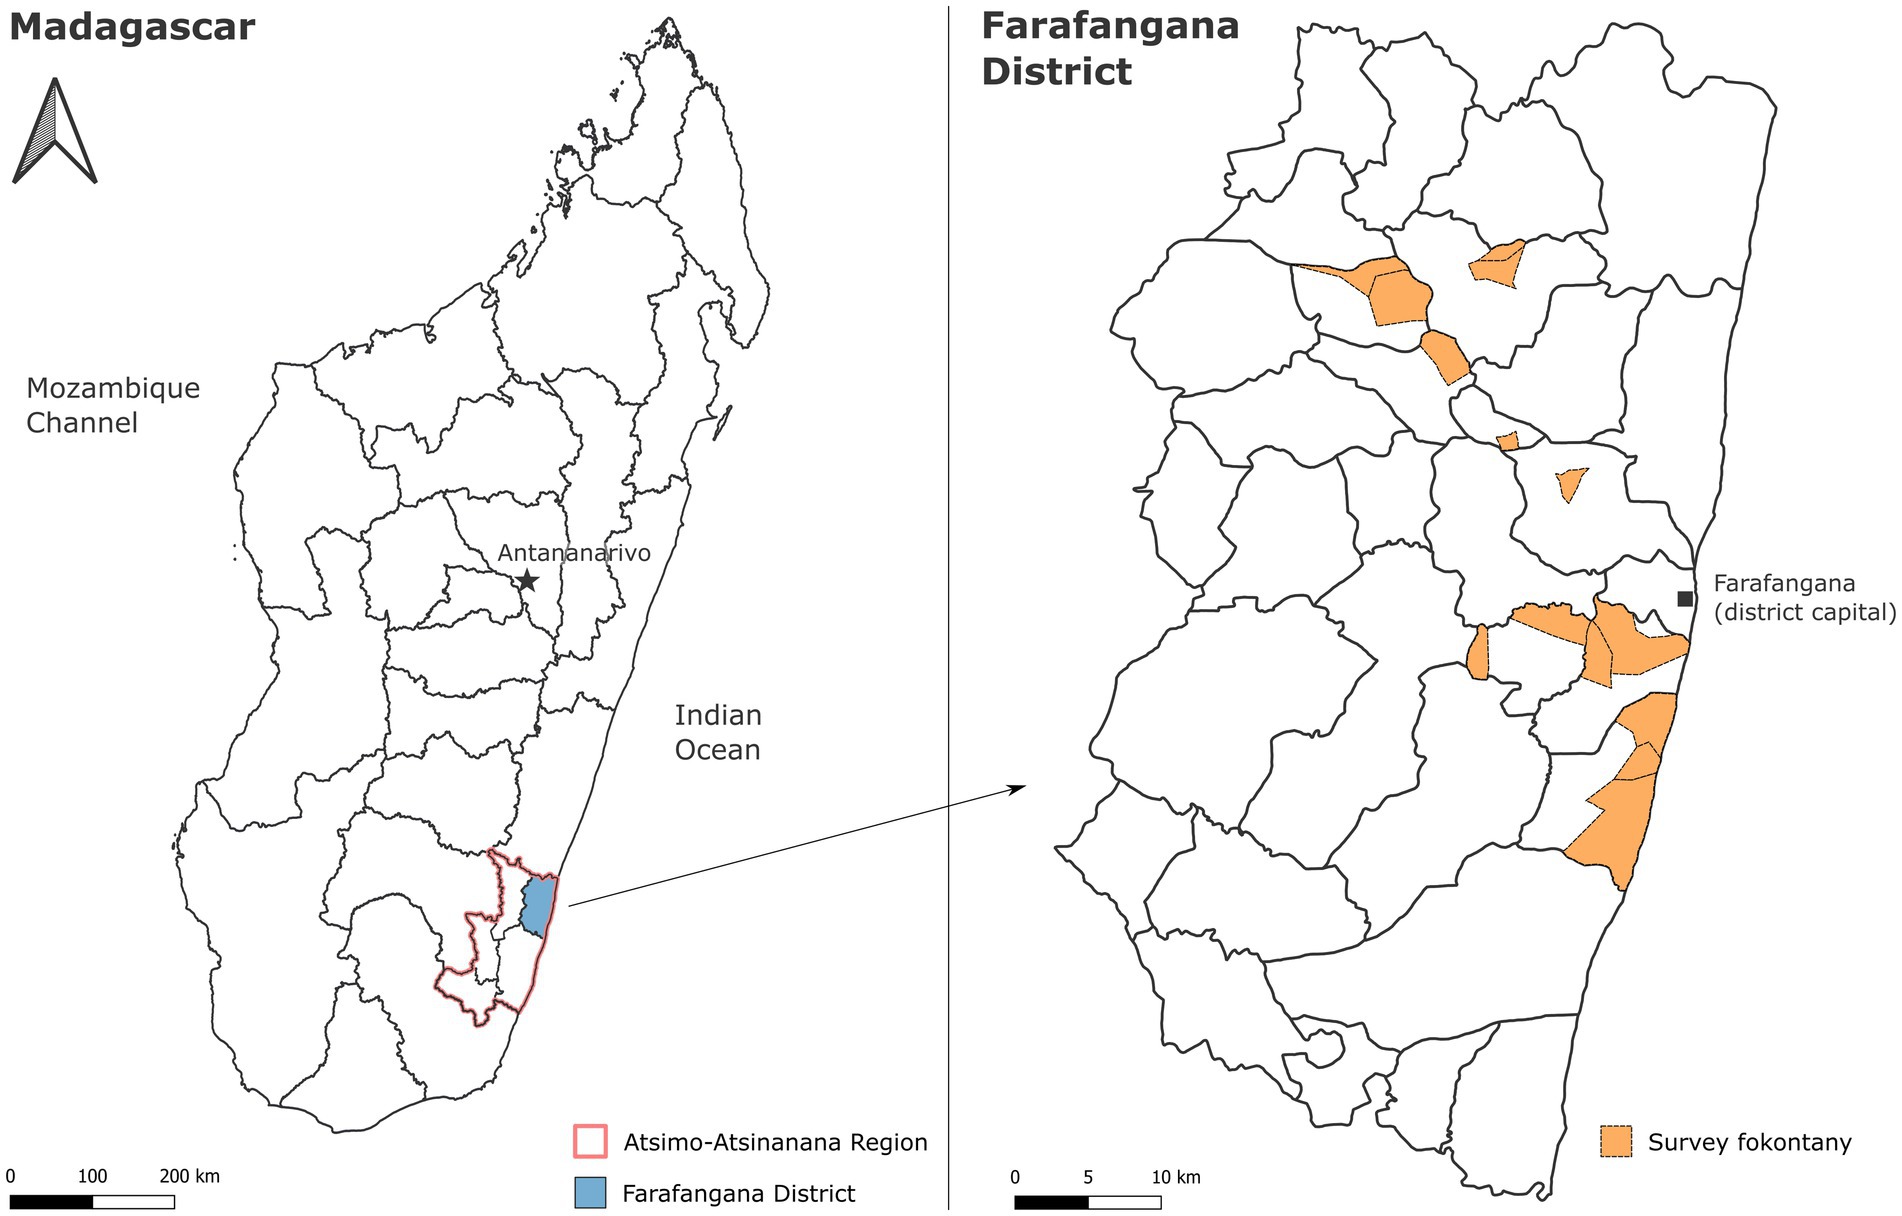
Figure 1. Map of research region.
The data reported in this article were collected by the French NGO ‘Inter Aide’, which implemented a development project in rural areas of Farafangana District. This project, called ProSAR (Projet de renforcement de la Sécurité Alimentaire et nutritionnelle et de la Résilience1) is funded by the German Ministry of development cooperation and managed by the German development agency Deutsche Gesellschaft für Internationale Zusammenarbeit (GIZ). In Farafangana District, ProSAR aims at improving the food and nutrition security of approximately 5,100 women and their families, for example, by providing trainings on nutrition-sensitive agriculture and by distributing seeds.
This article presents data that were collected both before and after the onset of development interventions, which began in October 2021. We do not aim to provide an impact evaluation, however. Our analysis aims at documenting the varying levels of food security at different time points across a year and how they affect household diets. Potential bias may arise from the fact that, at the second and third wave of data collection, diets and food security levels could already have been influenced by project interventions. In the article, we disclose and critically discuss these potential effects.
2.2. Ethical research statement
This study was designed in accordance with the principles of the 1964 WMA declaration of Helsinki. All steps of data collection and analysis were discussed in advance (and in retrospect) with representatives of regional administrative bodies (regional offices for agriculture, health, and nutrition), local official authorities (at commune and fokontany2 level), and traditional community leaders (local chiefs), to obtain permission for data collection. In accordance with local regulations, official research approval was obtained from the regional representation of the Office National de Nutrition (ONN) in the Atsimo-Atsinanana region, represented by regional coordinator Mr. Olivier Marcel Hanitriniaina. All survey respondents were informed about the purpose, contents, and expected duration of the interview. All respondents provided oral consent for the interview and, in April 2022, for anthropometric measurements of their children. For survey respondents below the age of 18, parental consent was also obtained. Oral consent was chosen over written consent forms due to limited literacy levels among the target population. Data were processed and analyzed in anonymized form exclusively. During anthropometric data collection, all children identified as moderately or severely wasted were oriented to the local health facility for immediate care, and two extreme cases were transferred to the hospital at Farafangana.
2.3. Household surveys
We collected data from rural households at three moments along the course of one year: the minor lean period, major lean period, and post-harvest period (see Table 1). Households were randomly sampled from all 102 target villages of the ProSAR project, located in 14 fokontany of 8 rural communes of Farafangana District in the Atsimo-Atsinanana region of Madagascar. These 8 communes and 14 fokontany had been purposively selected by GIZ and Inter Aide for the ProSAR project on the basis of comparatively weak humanitarian presence in these locations. In each village, individual households were randomly sampled using the following procedure. First, the enumerator gets a general overview of the location of all households belonging to the village. Second, a number between one and ten is randomly drawn. Third, as the enumerator walks down the village main road and counts houses, the household corresponding to the randomly drawn number is interviewed. Fourth, if the end of the village is reached, the enumerator turns around and keeps counting. Fifth, in case a village is spread across multiple hamlets, the procedure is repeated in every hamlet.
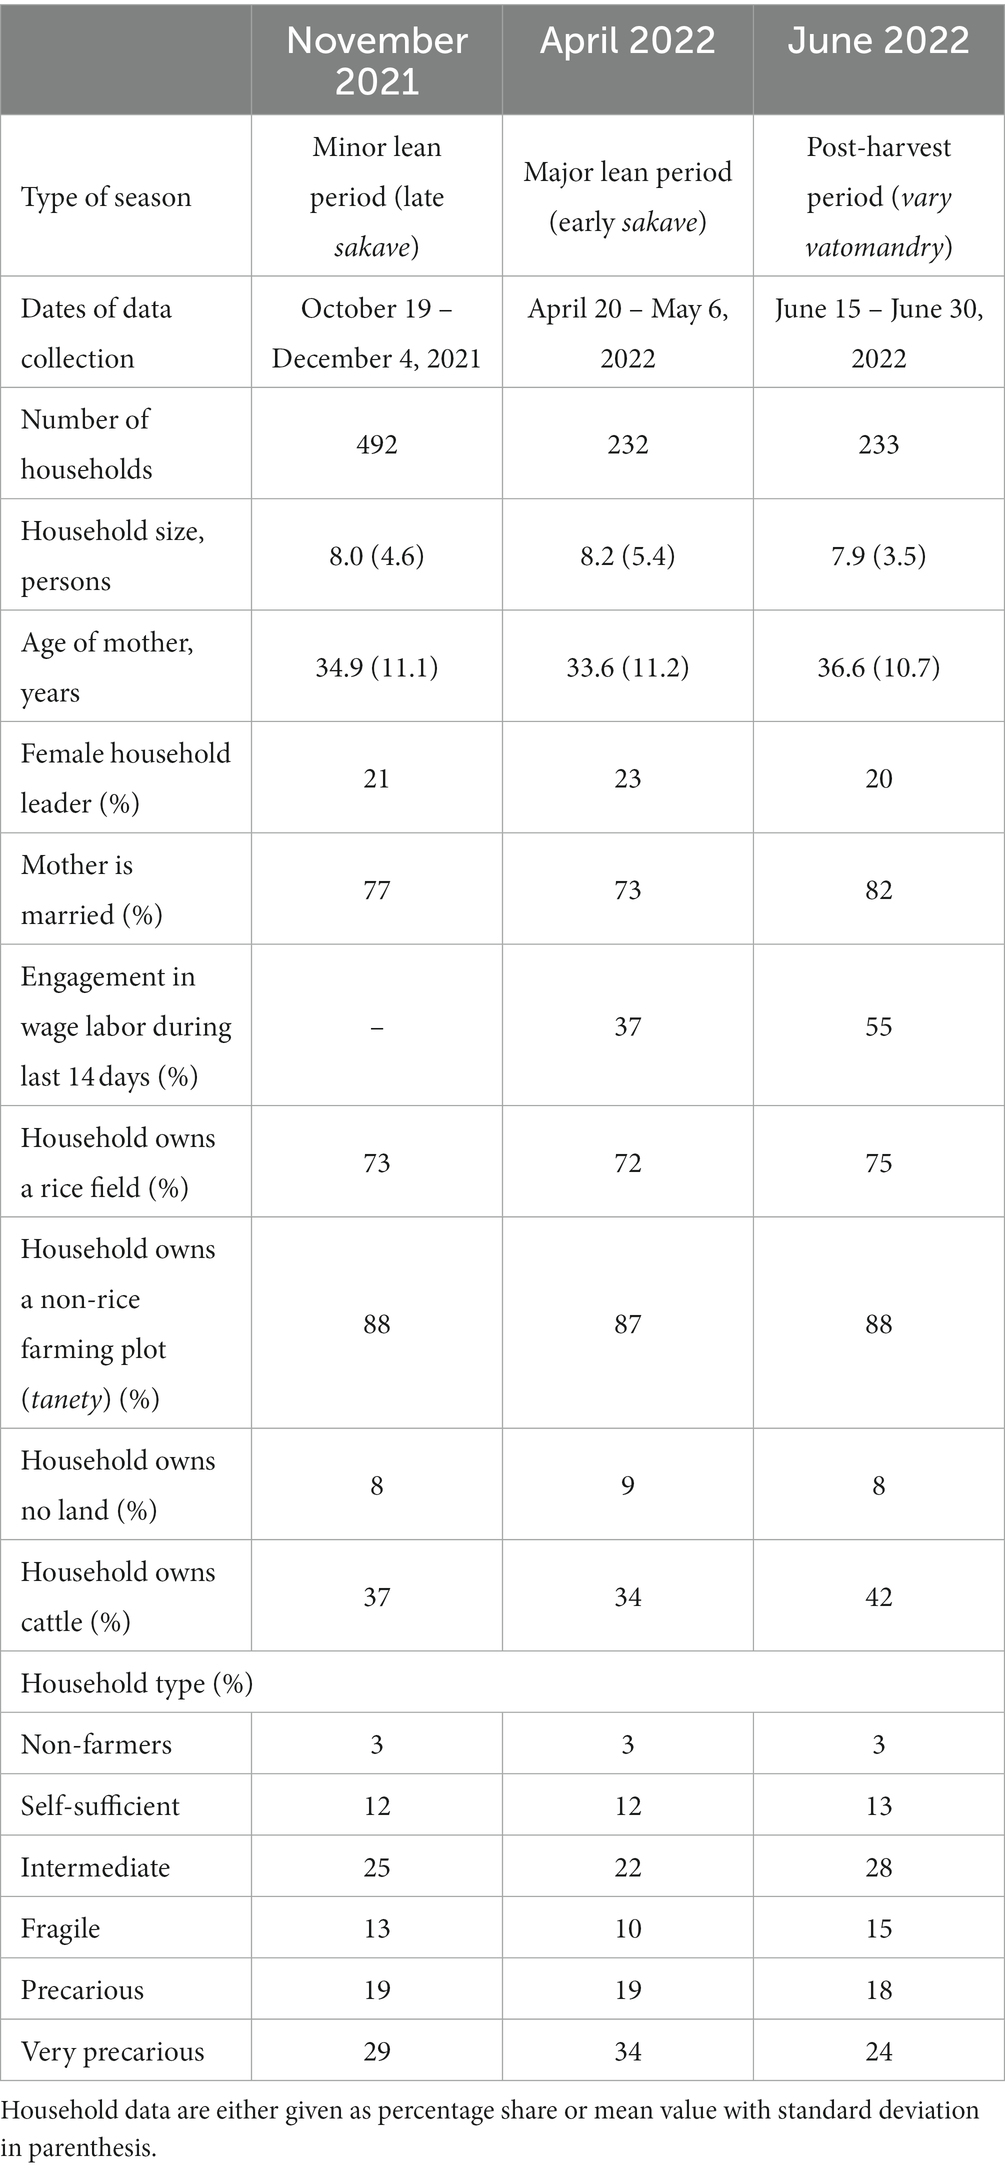
Table 1. Overview of household surveys and descriptive statistics.
Our goal was to survey 10% of all households in the 102 villages, with their overall number estimated to be around 3,900. Enumerators occasionally exceeded the 10% target. To avoid disproportionate coverage of certain villages or fokontany, which could affect the regional representativeness of our dataset, we reduced the number of households from villages that exceeded 30% coverage. For these specific villages, we excluded households at random, bringing coverage down to 10%. Eventually, 492 households were included in the dataset, which represents about 13% of all households in the target villages.
The full sample of 492 households was interviewed only in November 2021. To minimize time burden for survey respondents, and to use limited research resources effectively, we split this sample into two sub-samples. By randomly assigning half of the respondents in each of the 102 villages to one group, we created two equally sized sub-samples of 246 households. The first sub-sample was surveyed in April 2022 (where 232 interviews were carried out), and the other in June 2022 (233 interviews, see Figure 2). All interviews were conducted using a standard questionnaire implemented in the ODK Collect Android app (Hartung et al., 2010) in local malagasy dialect by female enumerators. In all cases, the interviewee was a woman, as women are traditionally in charge of family diets. Age was not an inclusion criterion, and women interviewed were aged 15–71 years. Interviews lasted about 45–60 min each.
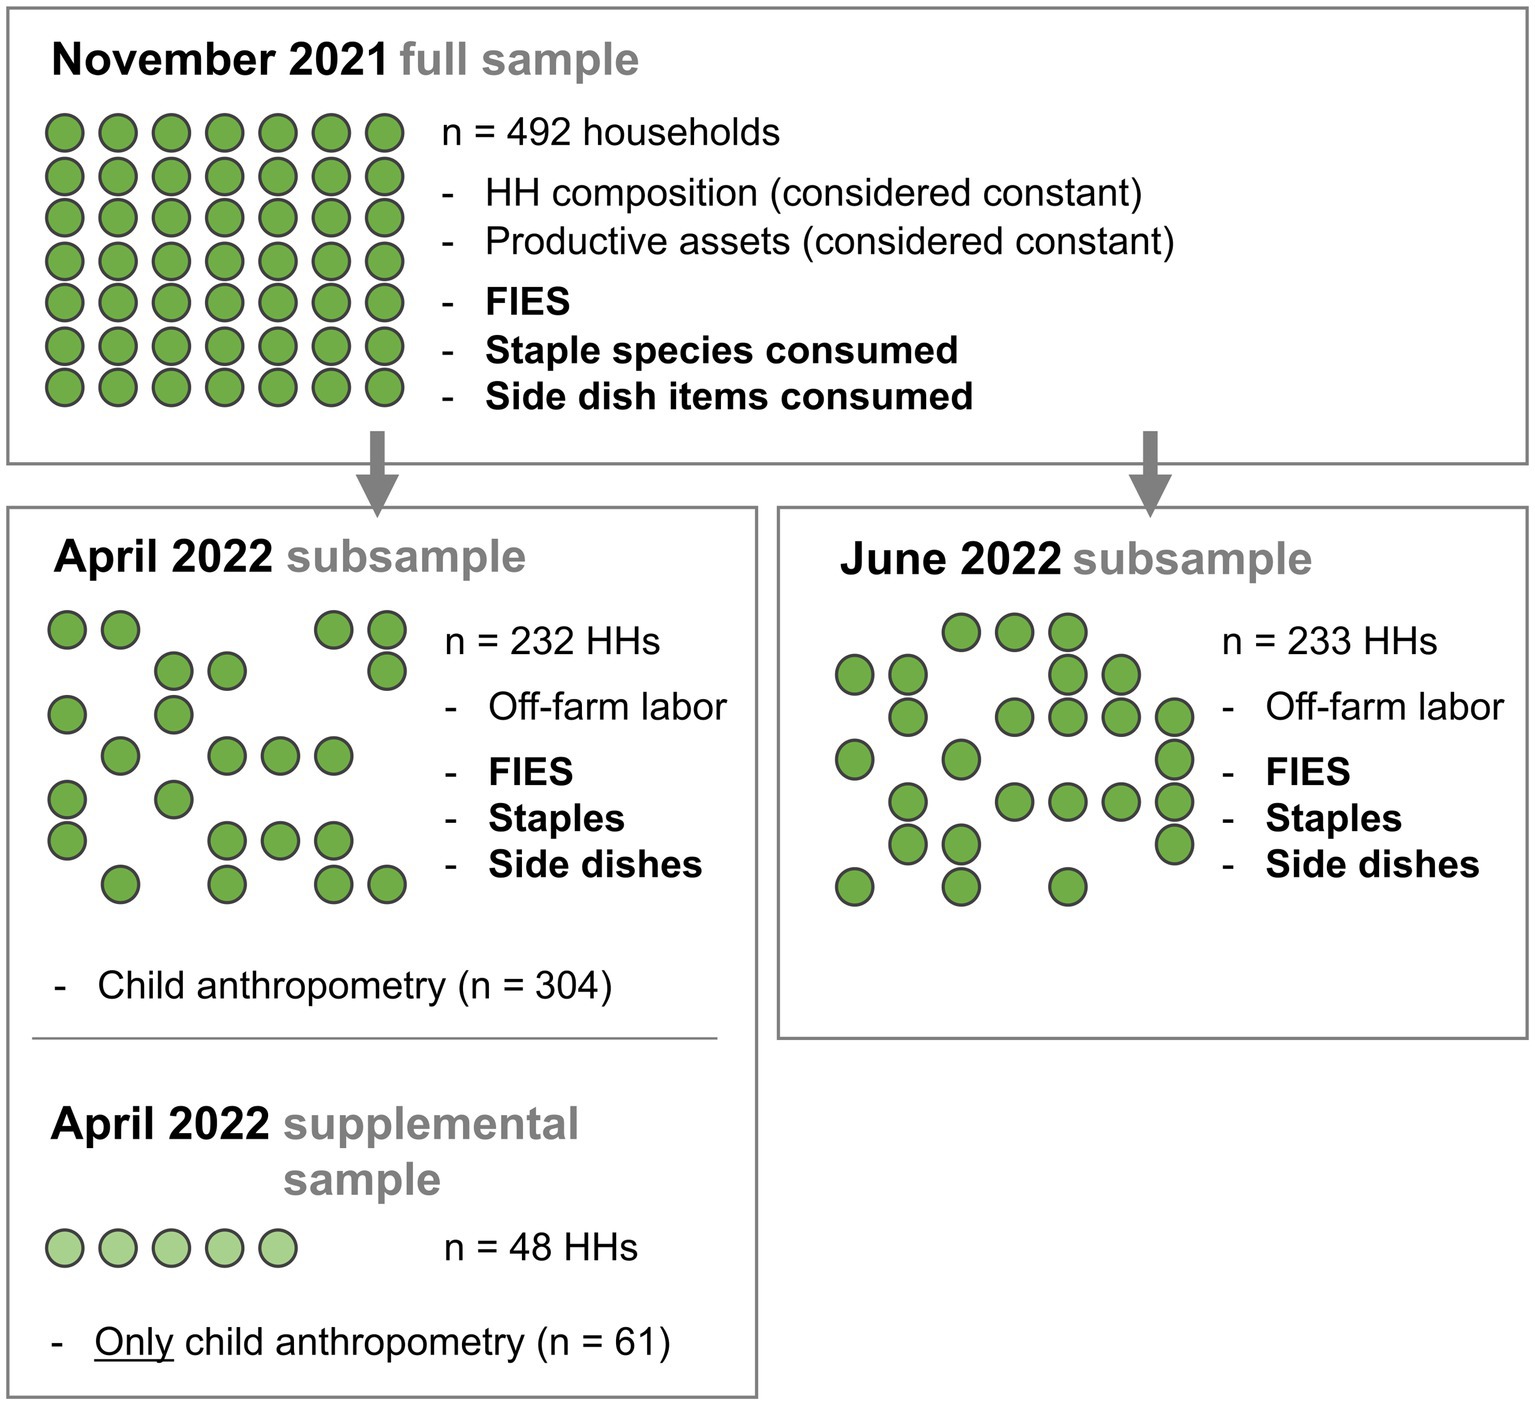
Figure 2. Sampling strategy: the full sample (survey in November 2021) was split into two sub-samples for follow-up surveys (in April and June 2022). In April, moreover, anthropometric data were collected from the sub-sample households as well as 48 additional households. Indicators in bold face were collected in all three surveys. HHs, households.
The first survey (November) enumerated data on household composition (number of household members, age, gender, marital status) and household ownership of productive assets, including rice fields and zebu cattle (see Table 1). The second and third survey (April and June) also enumerated how often the respondent engaged in off-farm wage labor in the 14 days preceding the survey. In addition, in all three surveys, we collected data on the household-level food security situation via the food insecurity experience scale (FIES), following the eight-question protocol established by Cafiero et al. (2018) and translated into local malagasy dialect. We chose a 30-day recall period, rather than 12 months, to be able to assess fluctuations in food security levels between seasons (see Fraval et al., 2019a). We considered households as food secure if the respondent did not answer affirmatively to any question (FIES score = 0). A FIES score of 1–3 corresponded to mild food insecurity, a FIES score of 4–6 was considered moderate food insecurity, and a FIES score of 7–8 indicated severe food insecurity (see Smith et al., 2017; Wambogo et al., 2018).
Respondents also provided data on family diets. Meals in rural Madagascar are typically composed of one staple ingredient and one or multiple laoka items (non-staple side dishes). To analyze laoka diversity, we enumerated whether, within the seven days preceding the survey, household meals included any of the following food items: leafy vegetables, other vegetables, pulses, oilseeds, fish or poultry or meat, and eggs. After discussing with local experts, we purposively customized existing lists of food groups used for assessing household dietary diversity scores (HDDS), for example, by disaggregating green leafy vegetables and other vegetables, merging red meat, poultry, and fish, and omitting dairy products (see Swindale and Bilinsky, 2006; FAO, 2010). For staples, we additionally enumerated which species were consumed, including rice, sweet potato, cassava, yams, jackfruit, bananas, maize, breadfruit, and tavolo or other non-cultivated staples. Lastly, for all consumed food items, we also enumerated whether they were self-produced, purchased, or obtained any other way. Here, multiple affirmative answers were possible.
2.4. Household typology
To analyze existing heterogeneity among the sample population, we intended to characterize the main types of local livelihoods. To this end, we stratified the 492 households by a typology of household vulnerability. Following deliberation with local experts, we constructed this typology on the basis of three indicators: (i) whether the household owns any cattle, (ii) whether the household owns rice fields, and (iii) how frequently the household generally engages in off-farm wage labor. In our study region, wage labor (on other people’s farms) is typically associated with poverty and lack of sufficient own productive resources. The following six household types were defined, and each household was assigned one type, based on data collected in November. We collected these data once, during the minor lean period (November) and assumed that households remained in their respective type for the two following surveys.
• Self-sufficient: owns cattle, owns rice fields, never engages in wage labor.
• Intermediate: owns cattle, owns rice fields, engages in wage labor.
• Fragile: no cattle, owns rice fields, occasional wage labor (1–3 times per month, averaged across the year).
• Precarious: no cattle, owns rice fields, frequent wage labor (1–3 times per week).
• Very precarious: no cattle, owns limited or no rice fields, frequent wage labor (1–3 times per week or more).
• Non-farmer: while these households may maintain farming plots, their livelihoods rely predominantly on salaries, pensions, or self-employment. Examples include teachers, the village mayor’s family, or households engaged in agricultural trade.
2.5. Child anthropometry
To estimate the prevalence of chronic and acute child malnutrition in the study population, we also collected child anthropometric data once. This data collection was added to the survey enumeration in April, at a time of the year that is considered the harshest in terms of food and nutrition security. We thus expected to observe the annual peak of acute malnutrition. We collected data from all 304 children within the age range of 6–59 months that were present in the 232 sample households that could be reached. To increase regional representativity, however, we randomly sampled another 48 households, adding data on 61 children. This was done to meet our goal of including 7% of the estimated total number of children in this age range in the 14 study fokontany, a coverage suggested by the Emergency Nutrition Assessment (ENA) software, version 2020 (Erhardt et al., 2020). The 48 additional households were randomly sampled in four fokontany (out of 14 overall). In these fokontany, the number of children that were part of the households surveyed in November was below the 7% threshold, which is why we sampled additional households there.
Overall, we collected data on 365 children. For each child, the following data were collected: age, gender, height, weight, mid-upper arm circumference (MUAC), and presence of bilateral lower extremity edema (BLEE). We then calculated the following indicators of child malnutrition:
• Weight-for-height z-score (WHZ): low scores indicate wasting, a marker of acute malnutrition.
• Height-for-age z-score (HAZ): low scores indicate stunting, a marker of chronic malnutrition.
• Weight-for-age z-score (WAZ): low scores indicate underweight, a marker of acute or chronic malnutrition.
The scores were compared to a standardized reference population (WHO, 2006). For each indicator, children beyond 2 standard deviations below the reference mean were considered moderately wasted, stunted, or underweight. Children more than 3 standard deviations below the reference mean were considered severely wasted, stunted, or underweight. As a plausibility check, scores outside the range of ±3 standard deviations around the sample’s mean WHZ, HAZ, and WAZ were excluded (SMART flags, see Crowe et al., 2014).
As another indicator of acute malnutrition, we assessed whether children had a MUAC <125 mm (moderate wasting), or a MUAC < 115 mm and/or presence of BLEE (severe wasting, WHO and UNICEF, 2009). Some field staff tended to note down rounded MUAC measurements, leading to a higher share of measurements ending in 0 or 5 (e.g., 130 mm, 135 mm) than would be expected. We assume that there was more rounding up (by incompletely tightening the MUAC measuring tape on the child’s arm) than rounding down. Because this may also have occurred in cases close to the 125 mm threshold, our results might underestimate the prevalence of wasting based on the MUAC/BLEE indicator.
We tested whether the prevalence of any form of child malnutrition was associated with household food insecurity by employing three logistic regressions, using data from the April survey. These models’ dependent variables were dichotomous variables of wasting (based on WHZ), stunting, and underweight. The independent variable was the FIES-based food security level of the child’s household in April, an ordinal variable.
Data analysis was performed with the ENA software following the methodology described by WHO (2006). Data visualization was done in R software (R Core Team, 2020) using packages reshape2 (Wickham, 2007), rColorBrewer (Neuwirth, 2014), and ggplot2 (Wickham, 2016).
3. Results
3.1. Socio-demographic overview of the sample population
Table 1 shows key demographic variables characterizing the sample households. Most households rely on smallholder agriculture, managing both rice fields and farming plots devoted to other crops (plots called tanety). 8% of all households, however, own no land at all. Less than half of all households own zebu cattle, despite their importance as draft animals for rice field tillage and source of organic fertilizer. Our data suggest that many households also rely on supplementary income from external farm labor: in November, 76% of all interviewed women indicated they had engaged in agricultural wage labor at least once within the year preceding the survey.
The random sub-samples selected for the April and June surveys turned out somewhat imbalanced: access to productive resources (rice fields, cattle) was better among the households sampled in June than the ones in April. As a consequence, the June sample included less very precarious households, and more intermediate and self-sufficient households. A Chi-square test on the distributions of household types in the April and June samples revealed p = 0.08, suggesting the compositions were significantly different at the 10% significance level.
3.2. Household food security
Across all three surveys, we observe high rates of household food insecurity, measured by FIES. Generally, the food insecurity situation was worst in April and best in June (Figure 3). In November and April, 66% and 78% of all households were moderately or severely food insecure, and 2% and 0% were food secure, respectively. During the post-harvest period in June, the rate of moderate or severe food insecurity decreased to 39%, and 16% were food secure.
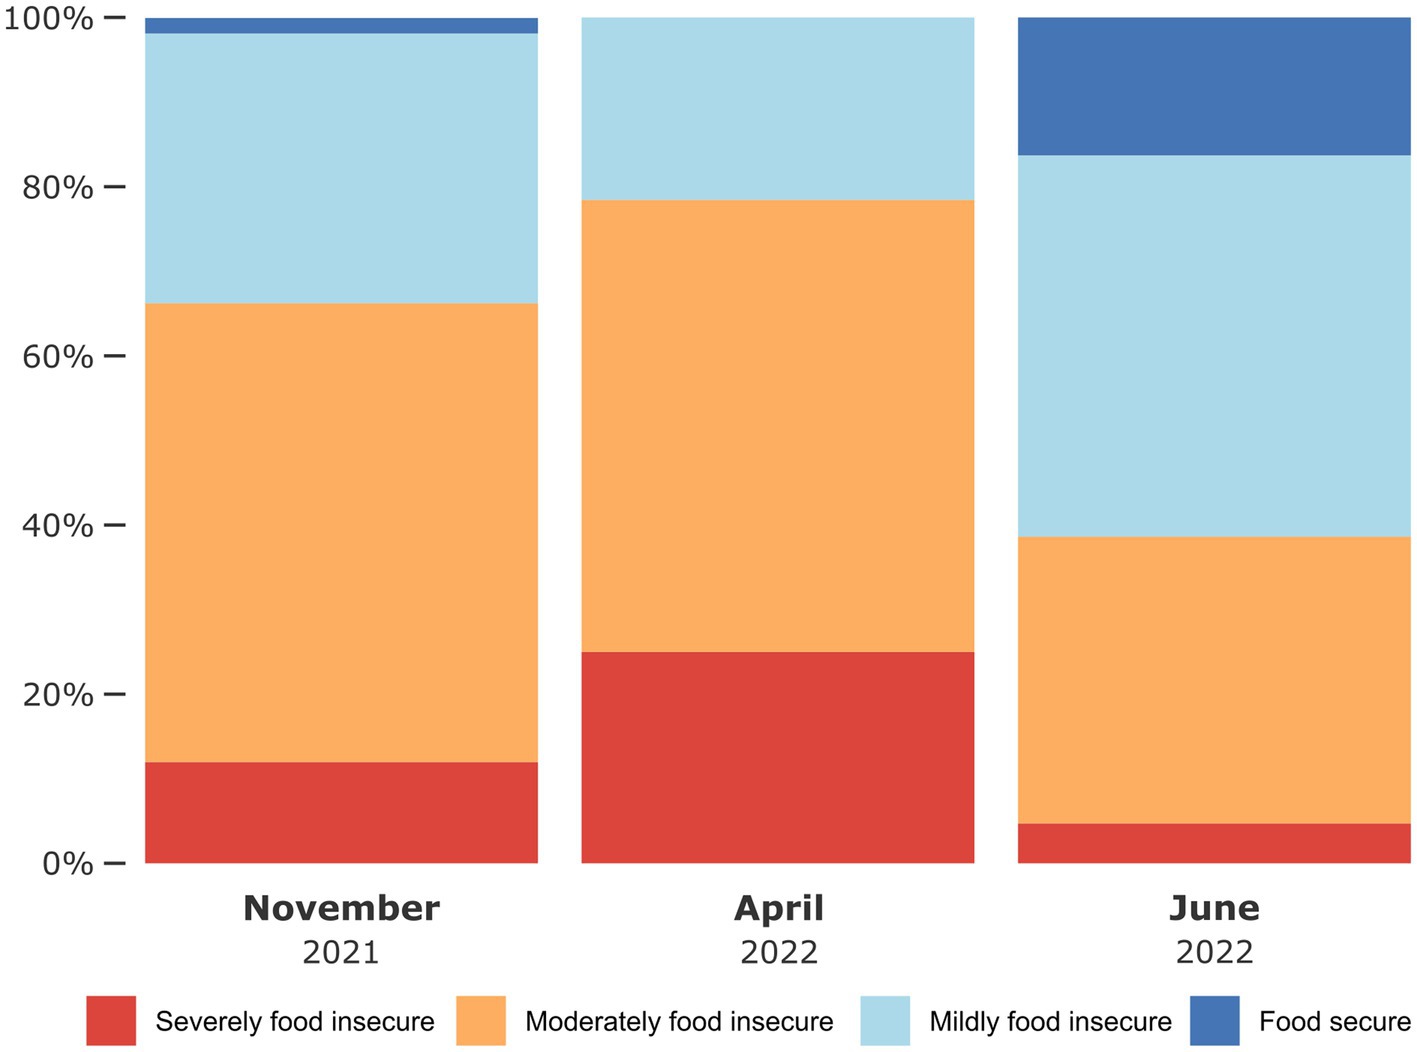
Figure 3. Distribution of FIES-based food security categories among survey respondents of the three surveys. Samples sizes are 492, 232, and 233, for November, April, and June, respectively.
Part of these differences could be due to different sub-sample compositions, as overall, sampled households were least resource-endowed in April and most resource-endowed in June, according to the typology established in November. Therefore, we also looked at seasonal differences within individual household types (Table 2). We find that the household types are affected by seasonality in different ways. All household types experience least food insecurity (moderate + severe) in June, but the season of peak food insecurity seems to differ by the type of livelihood vulnerability: the three poorer categories (fragile, precarious, and very precarious), comprising 61% of the overall sample and thus dominating the overall picture, reached highest food insecurity levels in April. The three less vulnerable types (intermediate, self-sufficient, and non-farmers), however, were most food insecure in November. Surprisingly, we do not observe clear trends linking the level of household vulnerability and food security.
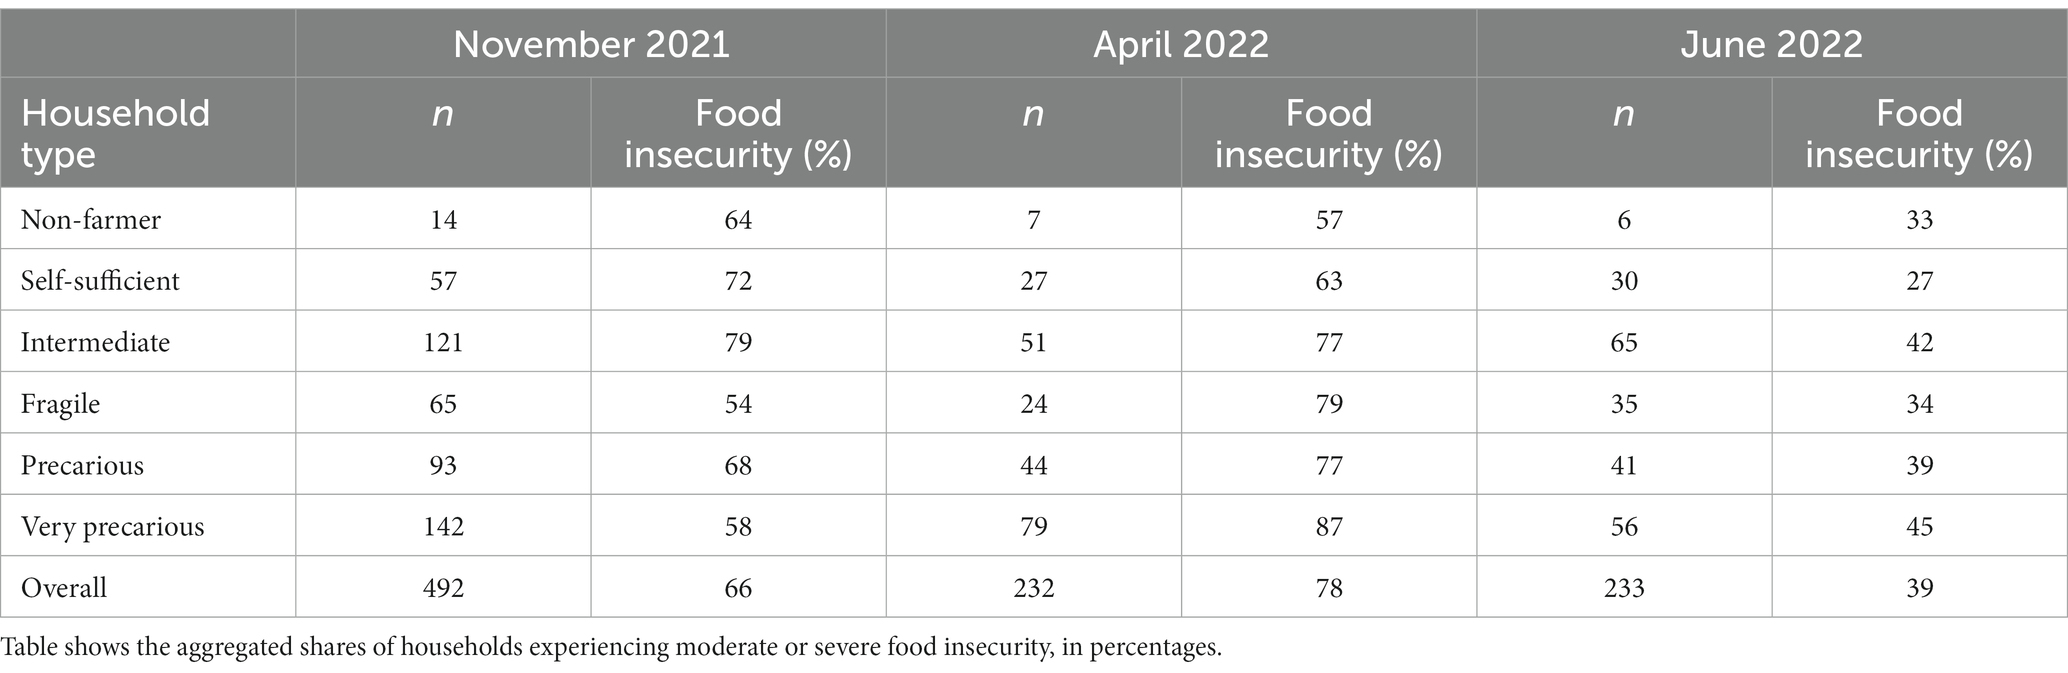
Table 2. Rates of food insecurity by season and household type.
3.3. Composition of family diets
3.3.1. Staple food
The observed patterns in households’ sourcing and consumption of different staple food items suggest that at all three points in time, substantial shares of households struggled to access sufficient calories. Access to staples seemed particularly challenging in April, however. In June and November, most households consumed at least one staple crop from their own farm production (83% and 89%, respectively). In April, however, this was true for only 32% of households.
Rice, the preferred staple, was virtually omnipresent in diets at all three points in time, consumed by at least 95% of all households (see Figure 4). Surprisingly, although most households owned rice fields, rice was consistently more frequently purchased than self-consumed. This was true even in June, shortly after rice harvest. Our data suggest that self-produced rice is rapidly depleted, through consumption or sales, after harvest: while 63% of all households reported consuming self-produced rice in June, less than one-fifth of all households consumed self-produced rice in November and April. To compensate decreasing availability of rice, households seem to have more options for consuming alternative self-produced staples in November, the minor lean period, than in April, the major lean period. Notably, predominantly self-produced sweet potato and unripe jackfruit were consumed by 75% and 74% of all households in November, in part substituting for rice. In April, however, no single staple crop from own production was consumed by any more than 12% of the households, i.e., staples were mainly purchased overall.
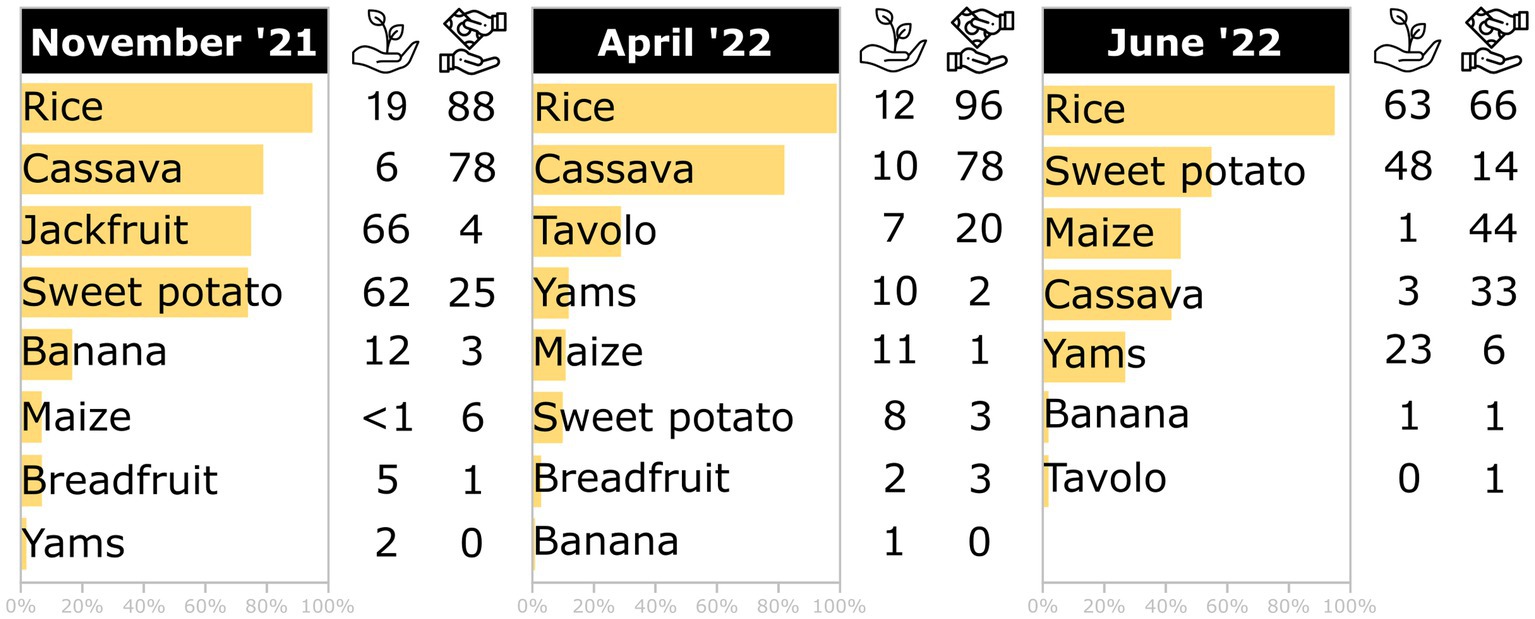
Figure 4. Overview of staple food consumption and sourcing. Colored bars reflect the overall shares of households that consumed the crop in the seven days preceding the survey. Numbers indicate the percentages of households that consumed the crop based on own production (hand with plant) or purchases (hands exchanging money), respectively. Tavolo refers to Tacca leontopetaloides. Data underlying color bars are provided in the Supplementary material. Icon credit: flaticon.com.
Compared to the post-harvest period, the two lean periods were characterized by more frequent consumption of less preferred staples, including cassava flour and tavolo. These staples of lower nutritional quality are locally considered ‘hunger foods’ because they tend to be consumed when the preferred staple, rice, becomes unavailable. Cassava was produced by some households, but was more commonly purchased. With few exceptions, it was generally purchased in powdered form (data not shown). While dried cassava is a relatively affordable source of calories, our local observations indicate that the cheap flour traded on local markets is, in many cases, low-grade animal feed not originally intended for human consumption. Tavolo, the local name for tubers of Tacca leontopetaloides, was consumed by 29% of all households in April, when experienced food insecurity was highest. Tavolo is rarely cultivated and more commonly foraged in forests or coffee plantations for home consumption and sale. Foraging tavolo can require long walks to far forest patches, and significant processing effort is needed to render the tubers edible, contributing to its relatively unpopularity. Yams, which is ideally harvested around August in our study region, was consumed by 12% of households in April, and 27% in June, and predominantly from own production. This corroborates the observation made by survey enumerators that some households coped with food insecurity by harvesting under-sized, early tubers.
3.3.2. Side dishes
In all three surveys, some households (1–2%) reported having consumed no side dish at all during the seven days preceding the survey (Figure 5, data in Supplementary material). The diversity of side dishes seemed to be influenced by seasonality: nutritional diversity was worst in April (median number of side dishes = 1), but better in November and June, to a similar extent (median number of side dishes = 2). The April drop in dietary diversity was mostly due to reduced laoka purchases. Consumption of self-produced side dish items was only slightly lower in April than in November and June (Table 3).
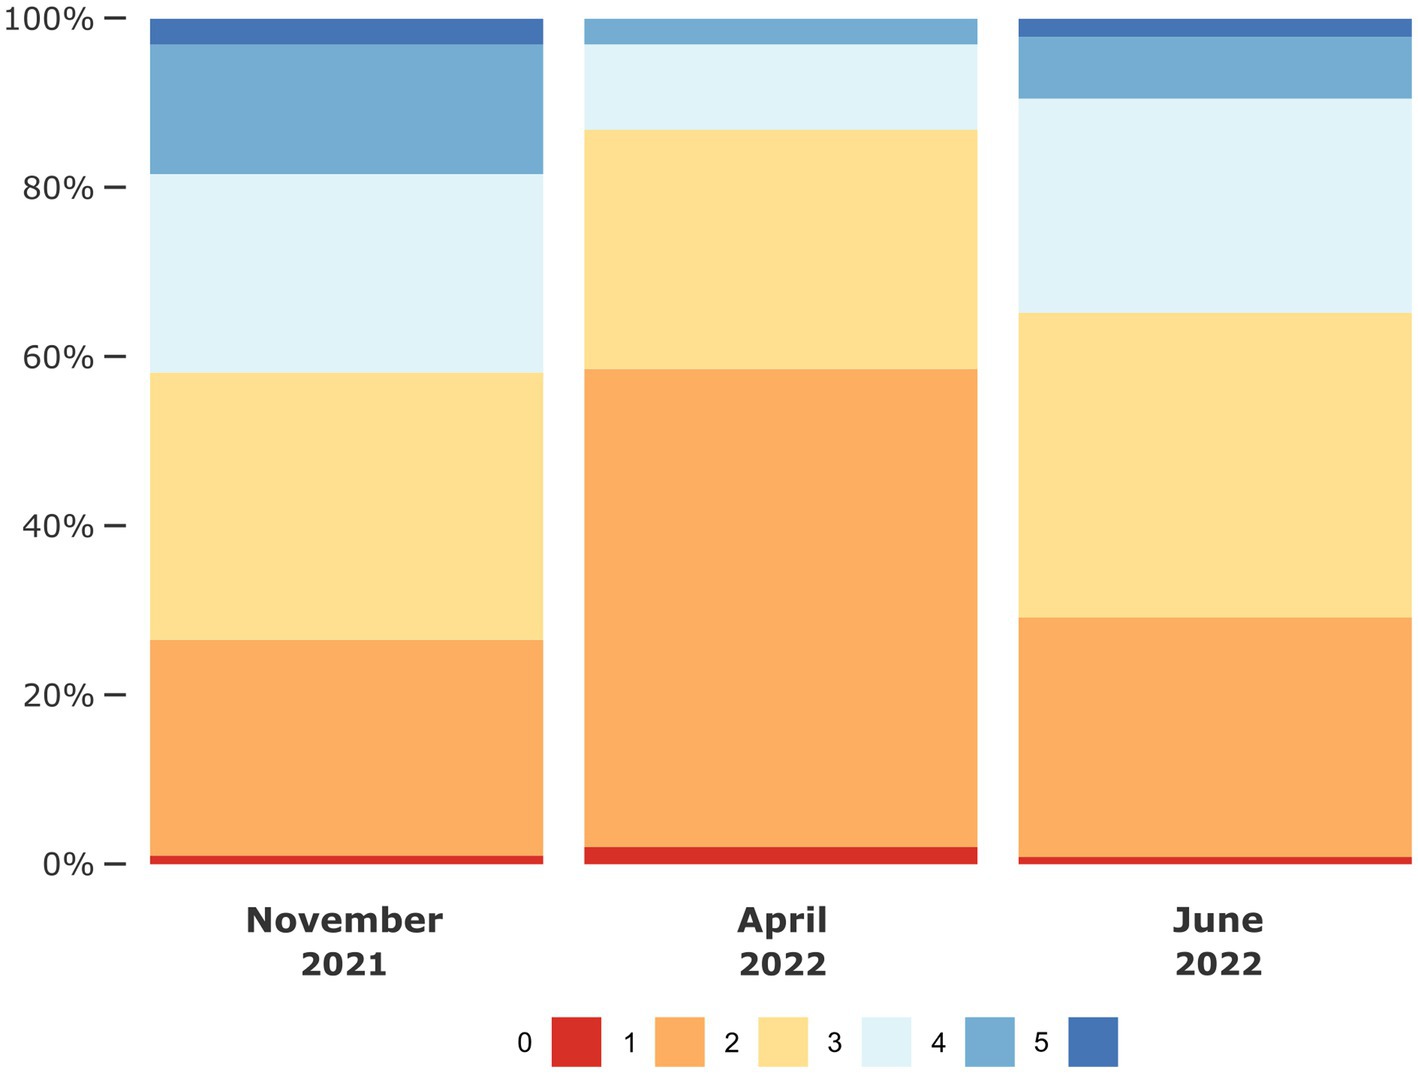
Figure 5. Shares of households by the diversity of side dish (laoka) food items consumed during the seven days preceding the survey. Samples sizes are 492, 232, and 233, for November, April, and June, respectively.
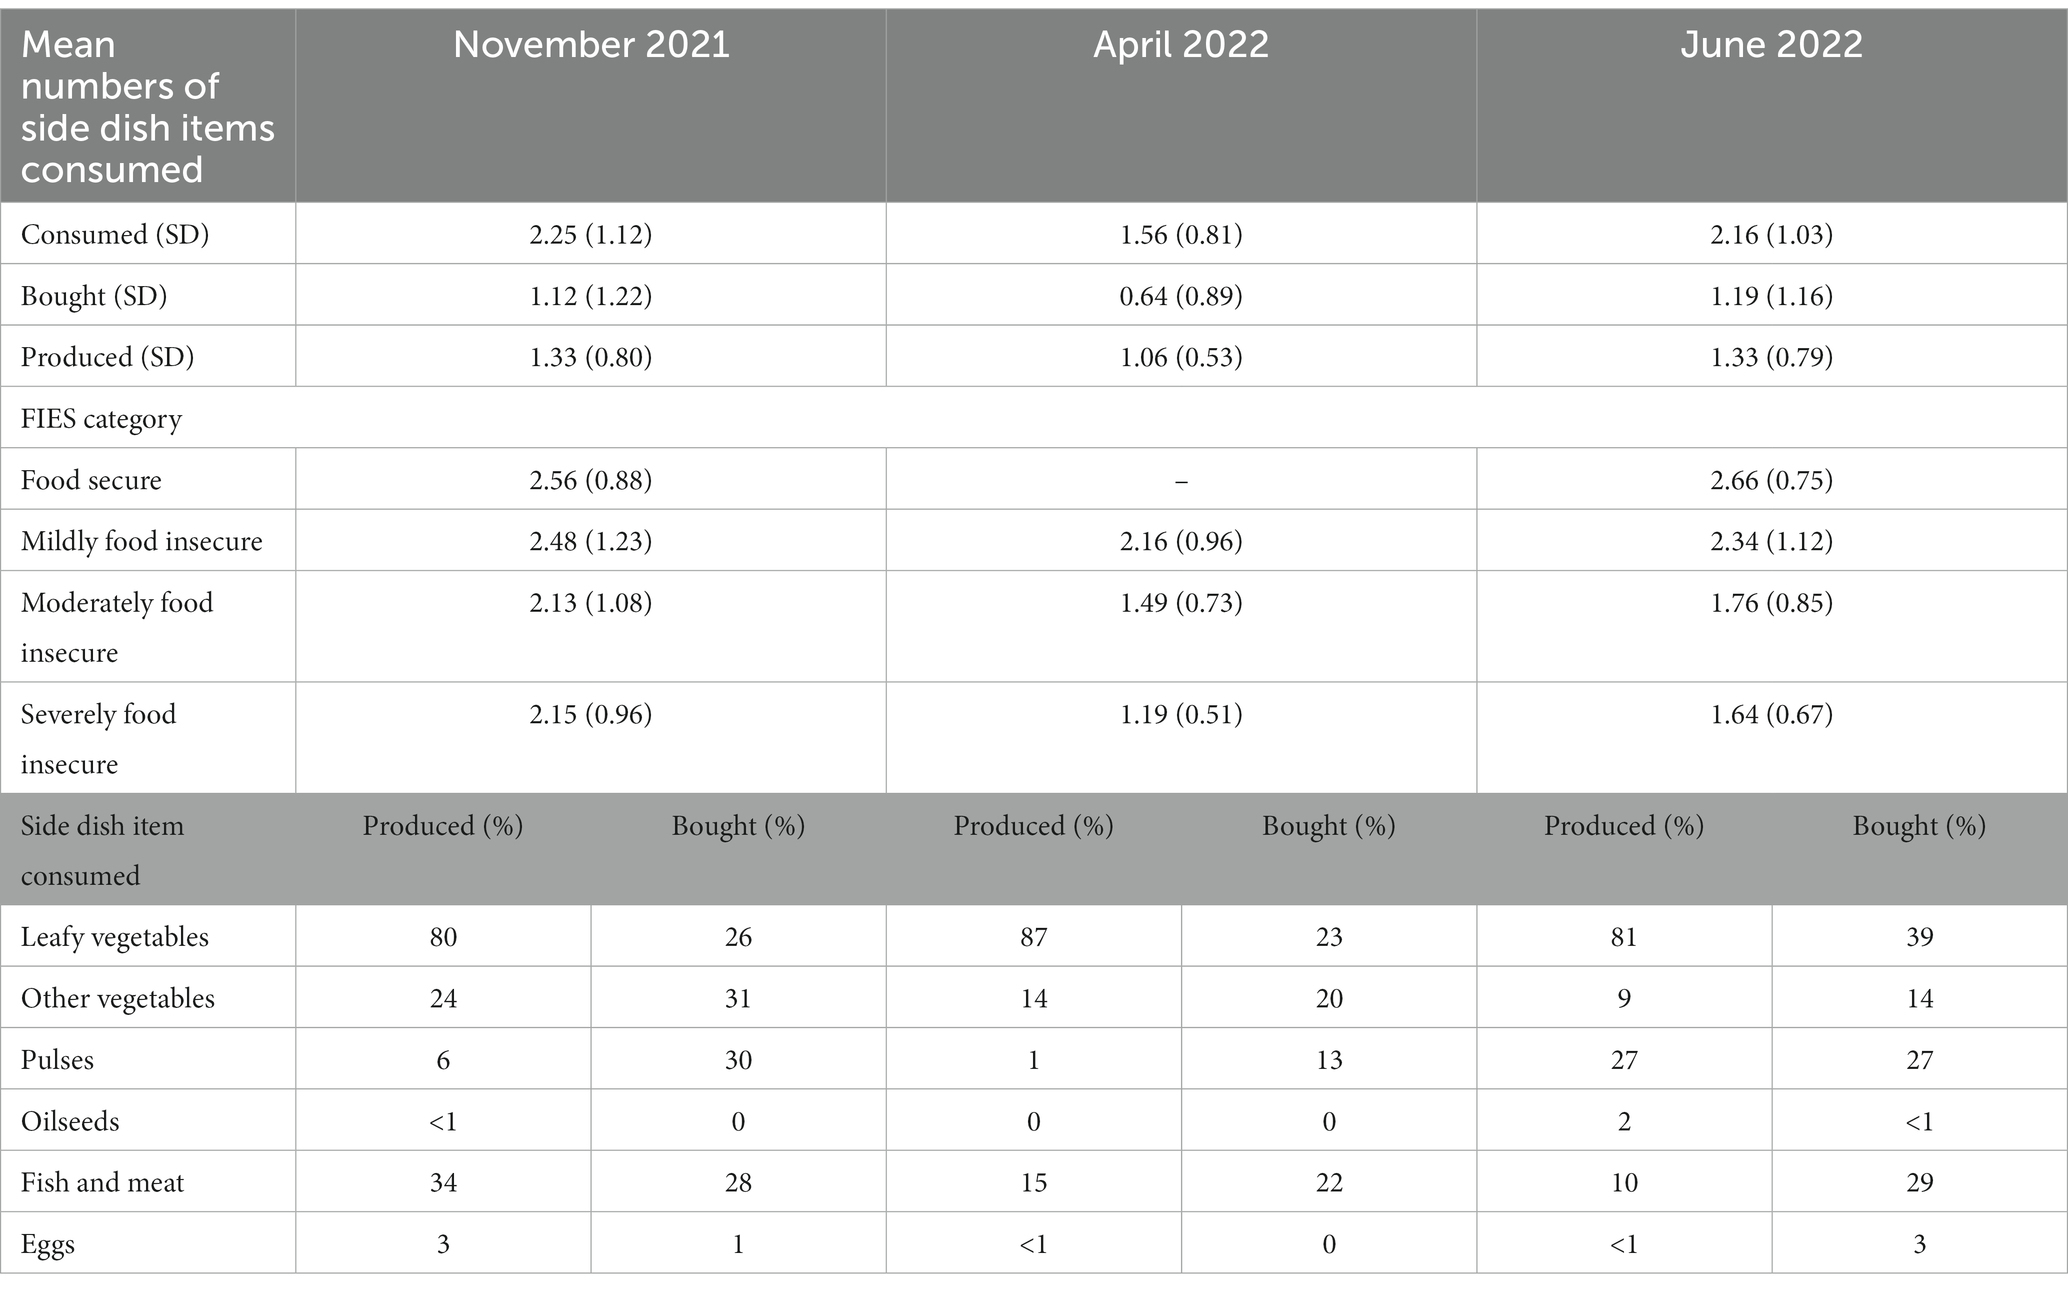
Table 3. Side dish (laoka) food items consumed during the seven days preceding the survey.
Lower diversity in laoka consumption corresponded with greater food insecurity at all three points in time. On average, households in each FIES-based food security category consumed 0.3 side dish items more than households in the next-lower food security category (Table 3). We did not find clear evidence for a link between the level of household vulnerability and dietary diversity. Consistently, though, non-farming households reported most diverse diets, and very precarious households reported least diverse diets, on average (data in Supplementary material).
Across all survey moments, green leafy vegetables from own production were the predominant side dish (Table 3). Examples include cassava leaves, sweet potato leaves, and paracress (Acmella oleracea), as well as wild, foraged plants. Other vegetables and pulses, such as Bambara groundnuts (Vigna subterranea), were consumed by moderate shares of all households and were overall more likely to be bought than produced. Similarly, fish or meat was consumed by moderate shares of households. The share of households purchasing fish or meat remained relatively constant between survey moments (ranging from 22% to 29%), while the share of households consuming self-produced fish or meat varied from 10% in June to 34% in November. Eggs and oilseeds were near absent in local diets.
3.4. State of child malnutrition
In April, in addition to household food security and diet data, we collected anthropometric data from children aged 6–59 months. Our results highlight elevated levels of chronic and acute malnutrition. We found high levels of stunting (57%) and underweight (45%). Acute malnutrition, indicated by the rate of wasted children, stood at 16–17% (Table 4).
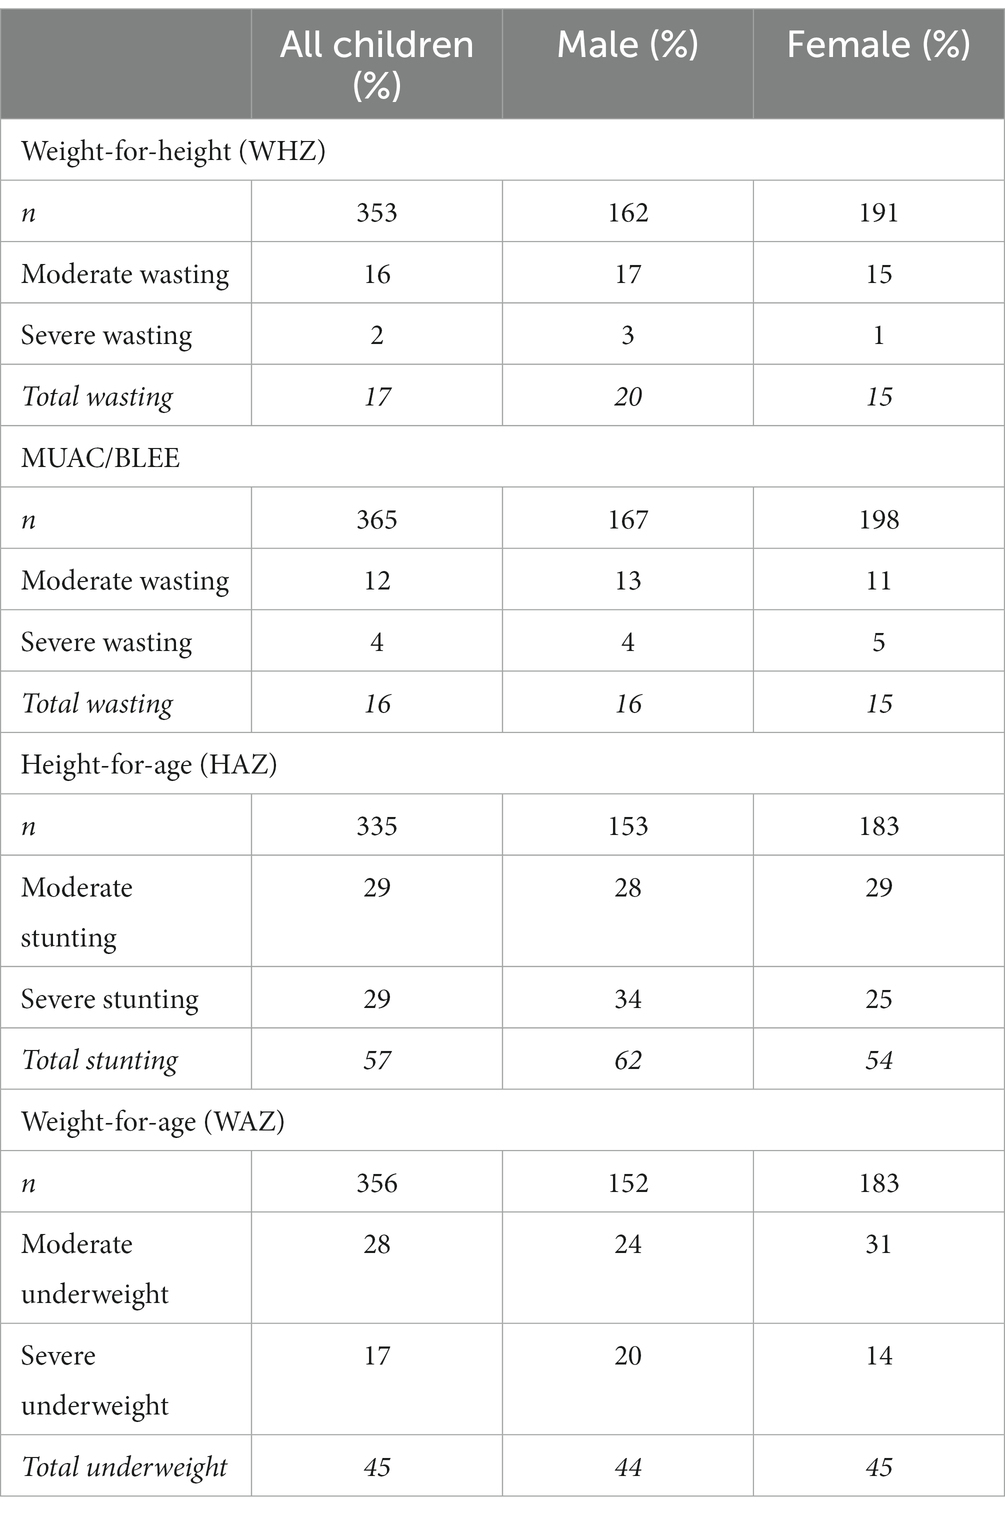
Table 4. Indicators of malnutrition among children aged 6–59 months and measured in April.
On average, children in households facing more severe food insecurity were also more likely to be malnourished (Table 5). The logistic regressions confirmed associations between FIES and all three malnutrition indicators, at the significance levels of 0.1% (underweight), 1% (wasting), and 10% (stunting; model coefficients provided in the Supplementary material). Two-proportion z-tests on gender-disaggregated data showed that boys were more likely to be stunted than girls, at the 10% significance level. Gender differences were not significant for wasting and underweight. Prevalence of malnutrition did not covary with child age (Table 5). Lastly, elevated levels of malnutrition affected children from all household types, and we did not find a clear association between the level of household vulnerability and malnutrition (data in Supplementary material). While non-farming households showed the lowest prevalence rates for all three malnutrition indicators, the highest rates were found in fragile (25% wasting and 68% stunting) and intermediate households (61% underweight).
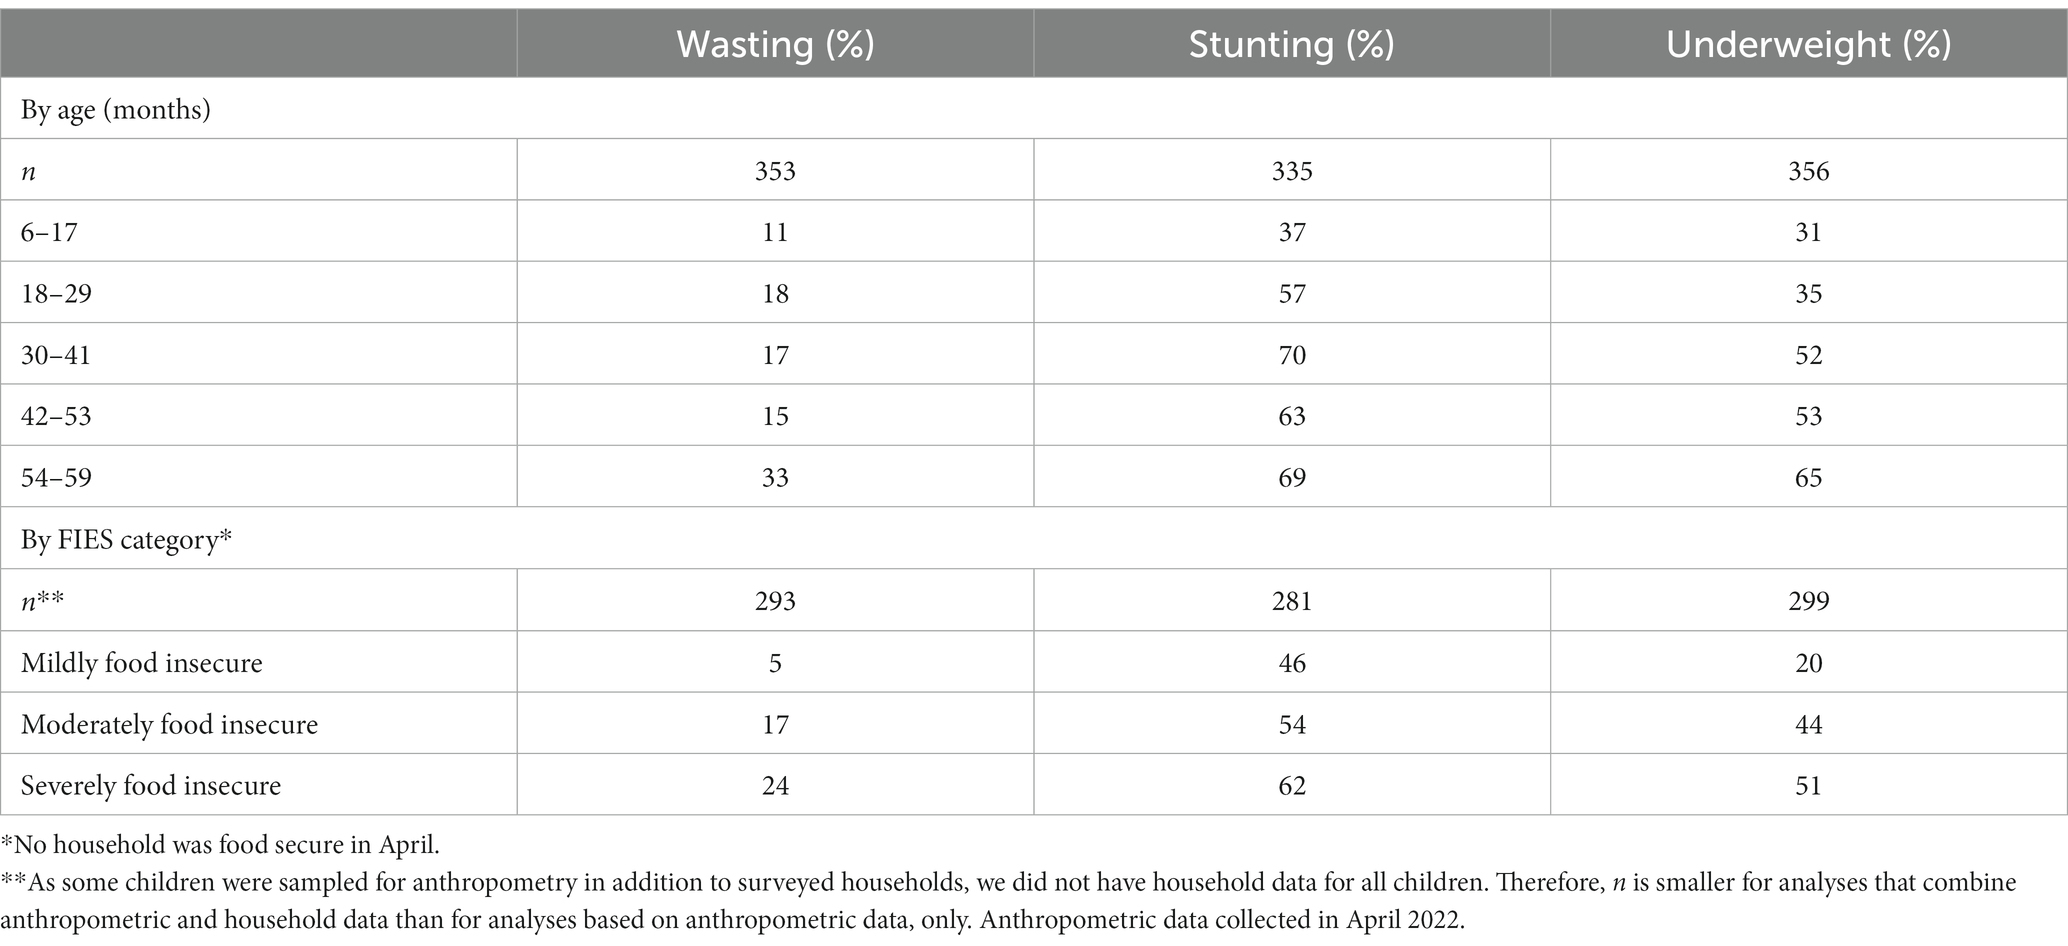
Table 5. Prevalence of wasting (by WHZ), stunting (by HAZ), and underweight (by WAZ), disaggregated by child age strata and household food security categories.
The 61 children belonging to the 48 additional households had significantly higher rates of underweight and stunting than the 304 children from original survey households (Chi-square tests, p < 0.05). This is surprising because the additional households – added to improve our study’s regional representativeness – were selected following the same random sampling procedure as the survey households. In part, these differences are explained by the fact that the additional households were sampled in four fokontany with relatively high rates of child malnutrition, compared to the other ten fokontany.
4. Discussion
4.1. High prevalence of food insecurity and acute child malnutrition calls for quick action
In Farafangana District, observed levels of food insecurity and child malnutrition exceed levels reported for Madagascar overall, which are already among the worst in sub-Saharan Africa (FAO et al., 2022). They also exceed data at regional level available to date (INSTAT, 2021). Our findings are in line with recent reports characterizing acute food insecurity in Farafangana District as ‘serious’ (IPC Phase 3 of 5) and estimates that above 30% of the population of the ‘Greater South-East’ (including coastal parts of Atsimo-Atsinanana and its neighboring Vatovavy-Fitovinany region) are in need of urgent action (IPC, 2022). Since the region is not typically considered a crisis region due to low levels of conflict and displacement, and damage from tropical cyclones being a recurrent part of life here, this situation risks receiving inadequate attention and response by policy makers and humanitarian organizations. With the ‘Great South’ of Madagascar, just south of Atsimo-Atsinanana, facing famine triggered by a multi-year drought, aid resources seem concentrated there.
Our results demonstrate that many households experienced food insecurity all around the year, rather than seasonally, with 39% food insecure households even in the post-harvest season. During the peak lean season, acute malnutrition affected about one in six children in the study region. While long-ranging food system interventions seem indispensable, these findings also underscore that significant parts of the population of Atsimo-Atsinanana need quick aid in the form of food or cash transfers to mitigate the adverse health effects of acute food insecurity and malnutrition (Barrett, 2001; Dostie et al., 2002; Awokuse, 2011). In addition, ensuring that acutely malnourished children are diagnosed and have access to adequately equipped health services should be a priority for preventing the worst consequences of malnutrition, including mortality (Collins et al., 2006). Local health authorities and their partners, including humanitarian organizations, can strengthen the health system’s capacity for malnutrition case management. Interventions should focus on providing adequate training and equipment to frontline health staff, and increasing the availability of ready-to-use therapeutic food.
4.2. Most rural households are not food self-sufficient
While cash crop farming and off-farm wage labor are common contributors to local livelihoods, the food security of most households in the study region continues to rely on small-scale subsistence farming. Notwithstanding, our results suggest that at all times – including during the main rice post-harvest period – substantial portions of the population purchase staple food and thus, most households are not food self-sufficient. During the major lean period, no household in our random sample was food secure, including the relatively better-off non-farming households. This virtually ubiquitous food deficit becomes manifest in the high prevalence of chronic child malnutrition, assessed through stunting, which is almost twice the sub-Saharan average (FAO et al., 2022). In rural Atsimo-Atsinanana, addressing chronic child malnutrition likely requires long-ranging food system interventions aiming to increase agricultural productivity and cyclone resilience.
In part, the difficulty of food self-sufficiency may be explained by relatively small farm sizes, even by smallholder standards: average farm size in Farafangana District is 1.03 ha (CREAM, 2013). Small farm sizes, along with low staple yields due to limited use of modern agricultural technology and inputs, make it challenging for the farming population to achieve food security for themselves and contribute to local food availability (Randrianarison et al., 2020). Increasing productivity thus likely remains a priority for development stakeholders, especially for rice, where Madagascar reaches relatively low yields even in its high-productivity highland regions (Arouna et al., 2021). In our sample, however, 27% of all households did not own rice fields, suggesting that an emphasis on rice might exclude the most vulnerable households. Cassava yields have also been reported to be low in Malagasy smallholder systems, leaving ample potential for improvements (Noromiarilanto et al., 2016). Focusing on root and tuber crops, such as cassava, yams, or sweet potatoes, might lead to more inclusive agricultural development. Long-term agricultural development strategies should avoid a narrow focus on cash crops and need to improve access to agricultural technologies relevant to food security crops, including locally suitable high-yielding germplasm and organic fertilizer (e.g., compost), but also demand-driven extension services (Minten and Barrett, 2008; Norton and Alwang, 2020; Stewart et al., 2020).
To feed the growing rural population of Atsimo-Atsinanana from currently available farmland, production intensification is important, but likely insufficient (Pradhan et al., 2015, Ritzema et al., 2017). Evidence from other countries suggests that, to improve the food and nutrition security of the most resource-poor and food-insecure households, policy makers should foster off-farm income opportunities through investments into education and infrastructure (e.g., roads, electricity) (Haggblade et al., 2010; Frelat et al., 2016). Also, increasingly frequent and intense natural disasters, including droughts and cyclones, increase the risk of crop loss (Weiskopf et al., 2021). Public, private, or humanitarian investments into farmer-oriented early warning systems and agricultural insurance schemes could help improve the disaster resilience of rural households (Nshakira-Rukundo et al., 2021).
4.3. Diets vary in quantity, diversity, and composition across the year
There is considerable intra-annual variation in what households eat and how they acquire it. In the following, we summarize major patterns characterizing food and nutrition security outcomes across the agricultural year. We first describe the post-harvest period (June), followed by the minor lean period (November), and the major lean period (April).
In June, food insecurity is moderate overall. Many households have recently harvested rice, which also increases local availability and lowers the market price for those households relying on purchases (see Dostie et al., 2002; Minten and Barrett, 2008; Moore et al., 2022). Overall, staples are predominantly sourced from own production, notably rice and sweet potatoes. Interestingly though, about two-thirds of all households also purchase rice, and almost half purchase maize. It is known that many households, especially the poorer ones, tend to sell part of their rice harvest immediately, driven by liquidity constraints or the lack of adequate storage capacity (Minten and Barrett, 2008; Neudert et al., 2021). In turn, wealthier households, including the non-farmers, may benefit from relatively low staple prices after harvest to stock up on rice. Along with staples, households consume a moderate diversity of side dish items: leafy vegetables from own production dominate, but are supplemented by other vegetables, pulses, and fish (either produced or purchased). Although in June, the population enjoys better access to staple food and thus improved food security, the diversity of side dishes, overall, resembles the situation in the minor lean period of November. This may reflect the relatively low priority assigned to dietary diversity by the rural population in south-eastern Madagascar (Tojo-Mandaharisoa et al., 2022). Also, despite similar diversity, portion sizes of side dishes may be larger in June than in November.
In November, there is a high overall level of food insecurity. For more resource-endowed households, this is the time of peak food insecurity. Rice supplies from own production are largely depleted, but many households have access to self-produced sweet potato (especially the more resource-endowed households) and unripe jackfruit (often cultivated as shade tree in coffee plantations). In addition to these, cassava is a key substitute for rice. Cassava has been shown before to be an important substitute when rice becomes unavailable to rural Malagasy, but is sometimes considered unhealthy by the local population (Dostie et al., 2002; Ramaroson Rakotosamimanana et al., 2015). Staple food is sourced both from market purchases (rice, cassava flour) and from own farm production (jackfruit, sweet potato). Consumption of side dishes resembles the situation in June.
In April, shortly before the main harvest period, food insecurity is severe overall, as reserves of rice and other self-produced staples are largely depleted. For less resource-endowed households (i.e., for most households), this is the worst time in terms of food insecurity. Staples are predominantly sourced through purchases (rice, cassava flour, tavolo), likely using cash from off-farm wage labor or livestock sales (Hänke et al., 2017; Moore et al., 2022). As tavolo is less satiating than rice or cassava, eating tavolo is typically seen as a coping strategy under acute food insecurity (Moore et al., 2022). In April, the diversity of side dishes is lower than in November, primarily due to reduced expenditures. Given the overall challenging food security situation, many households seem to prioritize expenditures on staple food over laoka items.
The observed inter-annual changes in food security and diets are consistent with other studies performed in south-eastern Madagascar (Randrianarison et al., 2020; Moore et al., 2022). The pattern of annual fluctuation in food security seems typical of the Malagasy smallholder population, which essentially relies on one rain-fed rice harvest in May or June: food security is highest around harvest time (June), when farmers have access to self-produced rice and generate income from selling part of their harvest. Population-level food security then gradually decreases until reaching bottom level shortly before harvest (April), and November represents an intermediate situation (Harvey et al., 2014; Hänke et al., 2017; Moore et al., 2022). For policy makers and other development stakeholders, this implies that interventions should focus on increasing food availability and diversity especially during the lean periods. Compared to earlier studies, however, the observed situation could have been additionally affected by unusually strong natural disasters: category-3 cyclone Batsirai and category-1 cyclone Emnati hit the Atsimo-Atsinanana region in February 2022, contributing to substantial crop losses caused by heavy wind and flooding (FAO, 2022). These events, which were especially detrimental to breadfruit trees and cassava plots, may have worsened food and nutrition security observed in April and June relative to other years. This interpretation seems supported by the observed decrease in banana consumption: while bananas are usually harvested all around the year, the sharp decrease suggests banana trees were affected by the cyclones. Due to climate change, however, comparably strong cyclones are expected to occur with increasing frequency, possibly suggesting our findings reflect a ‘new normal’ (Hasegawa et al., 2021; Weiskopf et al., 2021).
4.4. Potential study limitations
This study was embedded in a humanitarian intervention project. Effects of recent project interventions on respondents’ food and nutrition security situation may thus have influenced our findings. Within the period covered by this study, many households had been targeted by agricultural training sessions and had received planting materials for production of Yams, sweet potato, Bambara groundnut, and some laoka-type vegetables. For all these activities, quantities produced per household were relatively low, as the project aimed at building beneficiaries’ capacity, to enable autonomous scaling after the project. We thus do not expect the project-managed small farming plots to have had substantial effects on experienced food security and child malnutrition, yet. However, even small quantities of crops that were otherwise not accessible to the beneficiary households could have influenced our detailed assessments of staple species and side dish items consumed. In particular, increases in production and/or consumption of Yams (see Figure 4) and pulses (see Supplementary Table A4) are likely to be, in large part, driven by project activities and should not be assumed to represent the situation in neighboring, non-targeted communities. The same may be true for sweet potato consumption (from own production) in the June sample, which had been promoted by the project.
Survey data from smallholder context can be prone to bias, as respondents may unconsciously or willingly provide inaccurate data (Fraval et al., 2019b). The recall periods were between seven and 30 days, and interviewees partly responded on behalf of other household members. Both extended recall periods and potentially limited insight into other household members’ food consumption may have caused respondents to underestimate the presence of certain food items in family diets. These biases, however, should have affected our data in similar ways as other, comparable studies, meaning our findings can be compared with the levels of food and nutrition insecurity reported in the recent literature. The fact that data collection was embedded in an intervention project may have introduced expectation bias at the first (November) survey: some respondents might have reported a worse situation than reality in the hope of attracting stronger project benefits (see van Asten et al., 2009). At the following two surveys, in turn, some respondents might have reported a relatively better situation, overstating certain project impacts to please the enumerators. Since our results on annual fluctuations in food and nutrition security are generally in line with existing studies from other regions of Madagascar, we assume these biases were small.
Data availability statement
The datasets presented in this study can be found in online repositories. The names of the repository/repositories and accession number(s) can be found at: doi: 10.6084/m9.figshare.21743741.
Ethics statement
The studies involving human participants were reviewed and approved by the regional representation of the National Bureau for Nutrition (ONN) in the Atsimo-Atsinanana region. The participants provided their oral informed consent to participate in this study. Parents gave consent to studies involving under-age participants.
Author contributions
SR and MV designed the study, oversaw data collection, and analyzed and interpreted the data. JS interpreted the data and wrote the initial manuscript draft. SR and JS created the figures. SR, MV, HA, and JP critically revised the manuscript and provided comments. All authors read and approved the submitted manuscript version.
Funding
This study was funded by Deutsche Gesellschaft für Internationale Zusammenarbeit (GIZ) via a grant to Inter Aide and another grant to Humboldt University Berlin. The funder had no role in study design, data collection and analysis, decision to publish, or manuscript preparation.
Acknowledgments
The authors thank the Inter Aide teams at Farafangana (Madagascar) and Versailles (France), notably Damien du Portal and Francois Bourgois, for consistent support and constructive feedback. We also thank all survey enumerators and interview respondents who participated in this study, as well as Marc Giordan for editorial support. We thank the editor and two reviewers for their comments on an earlier draft. All remaining errors are the authors’.
Conflict of interest
The authors declare that the research was conducted in the absence of any commercial or financial relationships that could be construed as a potential conflict of interest.
Publisher’s note
All claims expressed in this article are solely those of the authors and do not necessarily represent those of their affiliated organizations, or those of the publisher, the editors and the reviewers. Any product that may be evaluated in this article, or claim that may be made by its manufacturer, is not guaranteed or endorsed by the publisher.
Supplementary material
The Supplementary material for this article can be found online at: https://www.frontiersin.org/articles/10.3389/fsufs.2023.1126053/full#supplementary-material
Footnotes
1. ^French for "Project for enhanced food and nutrition security and resilience".
2. ^Fokontany are the smallest administrative unit in Madagascar, roughly corresponding to the concept of municipality, and often comprising multiple villages.
References
Ahmed, K., and Razafison, R. (2021). At least 1M people facing starvation as Madagascar’s drought worsens. The Guardian Available at: https://www.theguardian.com/global-development/2021/may/10/at-least-1m-people-facing-starvation-madagascar-drought-worsens (Accessed on November 4, 2022).
Allee, A., Lynd, L. R., and Vaze, V. (2021). Cross-national analysis of food security drivers: comparing results based on the food insecurity experience scale and global food security index. Food Secur. 13, 1245–1261. doi: 10.1007/s12571-021-01156-w
Arouna, A., Devkota, K. P., Yergo, W. G., Saito, K., Frimpong, B. N., Adegbola, P. Y., et al. (2021). Assessing rice production sustainability performance indicators and their gaps in twelve sub-Saharan African countries. Field Crop Res. 271:108263. doi: 10.1016/j.fcr.2021.108263
Awokuse, T. O. (2011). Food aid impacts on recipient developing countries: a review of empirical methods and evidence. J. Int. Dev. 23, 493–514. doi: 10.1002/jid.1680
Barrett, C. B. (2001). Does food aid stabilize food availability? Econ. Dev. Cult. Chang. 49, 335–349. doi: 10.1086/452505
Beal, T., Massiot, E., Arsenault, J. E., Smith, M. R., and Hijmans, R. J. (2017). Global trends in dietary micronutrient supplies and estimated prevalence of inadequate intakes. PLoS One 12:e0175554. doi: 10.1371/journal.pone.0175554
Béné, C., Bakker, D., Chavarro, M. J., Even, B., Melo, J., and Sonneveld, A. (2021). Global assessment of the impacts of COVID-19 on food security. Glob. Food Sec. 31:100575. doi: 10.1016/j.gfs.2021.100575
Bjornlund, V., Bjornlund, H., and van Rooyen, A. (2022). Why food insecurity persists in sub-Saharan Africa: a review of existing evidence. Food Secur. 14, 845–864. doi: 10.1007/s12571-022-01256-1
Cafiero, C., Viviani, S., and Nord, M. (2018). Food security measurement in a global context: the food insecurity experience scale. Measurement 116, 146–152. doi: 10.1016/j.measurement.2017.10.065
Collins, S., Dent, N., Binns, P., Bahwere, P., Sadler, K., and Hallam, A. (2006). Management of severe acute malnutrition in children. Lancet 368, 1992–2000. doi: 10.1016/S0140-6736(06)69443-9
CREAM. (2013). Monographie Région Atsimo Atsinanana. Centre de Recherches, d’Études, de l’Appui à l’Analyse Économique de Madagascar, Antanarivo, Madagascar.
Crowe, S., Seal, A., Grijalva-Eternod, C., and Kerac, M. (2014). Effect of nutrition survey ‘cleaning criteria’ on estimates of malnutrition prevalence and disease burden: secondary data analysis. PeerJ 2:e380. doi: 10.7717/peerj.380
Dostie, D., Haggblade, S., and Randriamamonjy, J. (2002). Seasonal poverty in Madagascar: magnitude and solutions. Food Policy 27, 493–518. doi: 10.1016/S0306-9192(02)00063-5
Erhardt, J., Seaman, J., and Golden, M. (2020). Software for emergency nutrition assessment (ENA for SMART). SMART 2011. Available at: https://smartmethodology.org/survey-planning-tools/smart-emergency-nutrition-assessment/ (Accessed October 27, 2022).
FAO. (2010). Guidelines for measuring household and individual dietary diversity. Food and Agriculture Organization of the United Nations, Rome.
FAO. (2022). Madagascar: Évaluation des dommages et des pertes causés par les cyclones Batsirai et Emnati sur le secteur agricole dans le Grand Sud-Est de Madagascar. DIEM-impact report, June 2022. Food and Agriculture Organization of the United Nations, Rome.
FAO, IFAD, UNICEF, WFP, and WHO. (2022). The state of food security and nutrition in the world 2022. Repurposing food and agricultural policies to make healthy diets more affordable. Food and Agriculture Organization of the United Nations, Rome.
FAOSTAT. (n.d.). Madagascar country profile. https://www.fao.org/faostat/en/#country/129 (Accessed on November 4, 2022).
FEWS NET. (2013). Madagascar. Zones et descriptions de moyens d’existence. Famine Early Warning System Network, Washington, DC.
Fraval, S., Hammond, J., Bogard, J. R., Ngendo, M., van Etten, J., Herrero, M., et al. (2019a). Food access deficiencies in sub-Saharan Africa: prevalence and implications for agricultural interventions. Front. Sustain. Food Syst. 3:104. doi: 10.3389/fsufs.2019.00104
Fraval, S., Hammond, J., Wichern, J., Oosting, S. J., De Boer, I. J., Teufel, N., et al. (2019b). Making the most of imperfect data: a critical evaluation of standard information collected in farm household surveys. Exp. Agric. 55, 230–250. doi: 10.1017/S0014479718000388
Frelat, R., Lopez-Ridaura, S., Giller, K. E., Herrero, M., Douxchamps, S., Andersson Djurfeldt, A., et al. (2016). Drivers of household food availability in sub-Saharan Africa based on big data from small farms. Proc. Natl. Acad. Sci. U. S. A. 113, 458–463. doi: 10.1073/pnas.1518384112
Global Diet Quality Project. (2022). Measuring what the world eats: insights from a new approach. Geneva: Global Alliance for Improved Nutrition (GAIN) and Boston: Harvard T.H. Chan School of Public Health.
Haggblade, S., Hazell, P., and Reardon, T. (2010). The rural non-farm economy: prospects for growth and poverty reduction. World Dev. 38, 1429–1441. doi: 10.1016/j.worlddev.2009.06.008
Hänke, H., Barkmann, J., Coral, C., Enfors Kaustky, E., and Marggraf, R. (2017). Social-ecological traps hinder rural development in southwestern Madagascar. Ecol. Soc. 22:42. doi: 10.5751/ES-09130-220142
Hartung, C., Anokwa, Y., Brunette, W., Lerer, A., Tseng, C., and Borriello, G. (2010). Open Data Kit: tools to build information services for developing regions. Proceedings of the 4th ACM/IEEE International Conference on Information and Communication Technologies and Development London, UK, December 13–16.
Harvey, C. A., Rakotobe, Z. L., Rao, N. S., Dave, R., Razafimahatratra, H., Rabarijohn, R., et al. (2014). Extreme vulnerability of smallholder farmers to agricultural risks and climate change in Madagascar. Philos. Trans. R. Soc. B. 369:20130089. doi: 10.1098/rstb.2013.0089
Hasegawa, T., Sakurai, G., Fujimori, S., Takahashi, K., Hijioka, Y., and Masui, T. (2021). Extreme climate events increase risk of global food insecurity and adaptation needs. Nat. Food 2, 587–595. doi: 10.1038/s43016-021-00335-4
Headey, D. D., Ecker, O., Comstock, A. R., and Ruel, M. T. (2023). Poverty, price and preference barriers to improving diets in sub-Saharan Africa. Glob. Food Sec. 36:100664. doi: 10.1016/j.gfs.2022.100664
Hendriks, S. L., Montgomery, H., Benton, T., Badiane, O., Castro de la Mata, G., Fanzo, J., et al. (2022). Global environmental climate change, covid-19, and conflicto threaten food security and nutrition. BMJ 378:e071534. doi: 10.1136/bmj-2022-071534
Herrera, J. P., Rabezara, J. Y., Ravelomanantsoa, N. A. F., Metz, M., France, C., Owens, A., et al. (2021). Food insecurity related to agricultural practices and household characteristics in rural communities of Northeast Madagascar. Food Secur. 13, 1393–1405. doi: 10.1007/s12571-021-01179-3
INSTAT. (2020). Résultats globaux du Troisième recensement général de la population et de l’habitation (RGPH-3). Résultats globaux de recensement général de la population et de l’habitation de 2018 de Madagascar (RGPH-3). Institut National de la Statistique, Antananarivo.
INSTAT. (2021). Enquête démographique et de santé à Madagascar, 2021. Institut National de la Statistique, Antananarivo.
IPC. (2022). Madagascar (Grand South & Grand South-East): IPC acute food insecurity snapshot. Integrated Food Security Phase Classification, IPC Global Partners.
Makoni, M. (2021). Southern Madagascar faces “shocking” lack of food. Lancet 397:2239. doi: 10.1016/S0140-6736(21)01296-4
Matavel, C., Hoffmann, H., Rybak, C., Steinke, J., Sieber, S., and Müller, K. (2022). Understanding the drivers of food security among agriculture-based household in Gurué District, Central Mozambique. Agric. Food Secur. 11:7. doi: 10.1186/s40066-021-00344-3
Micha, R., Khatibzadeh, S., Shi, P., Andrews, K. G., Engeli, R. E., and Mozaffarian, D. (2015). Global, regional and national consumption of major food groups in 1990 and 2010: a systematic analysis including 266 country-specific nutrition surveys worldwide. BMJ Open 5:e008705. doi: 10.1136/bmjopen-2015-008705
Minten, B., and Barrett, C. B. (2008). Agricultural technology, productivity, and poverty in Madagascar. World Dev. 36, 797–822. doi: 10.1016/j.worlddev.2007.05.004
Moore, M., Alpaugh, M., Razafindrina, K., Trubek, A. B., and Niles, M. T. (2022). Finding food in the hunger season: a mixed methods approach to understanding wild plant foods in relation to food security and dietary diversity in southeastern Madagascar. Front. Sustain. Food Syst. 6:929308. doi: 10.3389/fsufs.2022.929308
Neudert, R., Hecker, L. P., Randrianarison, H., and Kobbe, S. (2021). Are smallholders disadvantaged by ‘double sell low, buy high’ dynamics on rural markets in Madagascar?. Dev. South. Afr. 38, 208–229. doi: 10.1080/0376835X.2020.1818550
Neuwirth, E. (2014). RColorBrewer: ColorBrewer palettes. R package version 1, 1–2 Available at: https://CRAN.R-project.org/package=RColorBrewer.
Noromiarilanto, F., Brinkmann, K., Faramalala, M. H., and Buerkert, A. (2016). Assessment of food self-sufficiency in smallholder farming systems of South-Western Madagascar using survey and remote sensing data. Agric. Syst. 149, 139–149. doi: 10.1016/j.agsy.2016.09.005
Norton, G. W., and Alwang, J. (2020). Changes in agricultural extension and implications for farmer adoption of new practices. Appl. Econ. Perspect. Policy 42, 8–20. doi: 10.1002/aepp.13008
Nshakira-Rukundo, E., Kamau, K. W., and Baumüller, H. (2021). Determinants of uptake and strategies to improve agricultural insurance in Africa: a review. Environ. Dev. Econ. 26, 605–631. doi: 10.1017/S1355770X21000085
Pradhan, P., Fischer, G., Van Velthuizen, H., Reusser, D. E., and Kropp, J. P. (2015). Closing yield gaps: how sustainable can we be? PLoS One 10, 1–18. doi: 10.1371/journal.pone.0129487
R Core Team (2020). R: a language and environment for statistical computing. R Foundation for Statistical Computing, Vienna, Austria
Ralaingita, M. I., Ennis, G., Russell-Smith, J., Sangha, K., and Razanakoto, T. (2022). The Kere of Madagascar: a qualitative exploration of community experiences and perspectives. Ecol. Soc. 27:42. doi: 10.5751/ES-12975-270142
Ramaroson Rakotosamimanana, V., Valentin, D., and Arvisenet, G. (2015). How to use local resources to fight malnutrition in Madagascar? A study combining a survey and a consumer test. Appetite 95, 533–543. doi: 10.1016/j.appet.2015.08.011
Randrianarison, N., Nischalke, S., and Andriamazaoro, H. (2020). The role of biodiversity and natural resource management in food security in south-eastern Madagascar. Acta Hort. 1267, 267–274. doi: 10.17660/ActaHortic.2020.1267.40
Ritzema, R., Frelat, R., Douxchamps, S., Silvestri, S., Rufino, M., Herrero, M., et al. (2017). Is production intensification likely to make farm households food-adequate? A simple food availability analysis across smallholder farming systems from East and West Africa. Food Secur. 9, 115–131. doi: 10.1007/s12571-016-0638-y
Siddiqui, F., Salam, R. A., Lassi, Z. S., and Das, J. K. (2020). The intertwined relationship between malnutrition and poverty. Front. Public Health 8:453. doi: 10.3389/fpubh.2020.00453
Smith, M. D., Rabbitt, M. P., and Coleman-Jensen, A. (2017). Who are the world’s food insecure? New evidence from the food and agriculture organization’s food insecurity experience scale. World Dev. 93, 402–412. doi: 10.1016/j.worlddev.2017.01.006
Stevens, G. A., Beal, T., Mbuya, M. N. N., Luo, H., and Neufeld, L. M. (2022). Micronutrient deficiencies among preschool-aged children and women of reproductive age worldwide: a pooled analysis of individual-level data from population-representative surveys. Lancet Global Health 10, e1590–e1599. doi: 10.1016/S2214-109X(22)00367-9
Stevens, G. A., Finucane, M. M., De-Regil, L. M., Paciorek, C. J., Flaxman, S. R., Branca, F., et al. (2013). Global, regional, and national trends in haemoglobin concentration and prevalence of total and severe anaemia in children and pregnant and non-pregnant women for 1995–2011: a systematic analysis of population-representative data. Lancet Global Health 1, e16–e25. doi: 10.1016/S2214-109X(13)70001-9
Stewart, Z. P., Pierzynski, G. M., Middendorf, B. J., and Vara Prasad, P. V. (2020). Approaches to improve soil fertility in sub-Saharan Africa. J. Exp. Bot. 71, 632–641. doi: 10.1093/jxb/erz446
Swindale, A., and Bilinsky, P. (2006). Household Dietary Diversity Score for measurement of household food access: Indicator guide. FHI 360/FANTA, Washington, DC.
Tojo-Mandaharisoa, S., Steinke, J., Randrianarison, N., Kubitza, C., Konzack, A., Rafanomezantsoa, A. S., et al. (2022). Assessing farmers’ diverse preferences and expectations for tailoring food and nutrition security interventions in southeastern Madagascar. Curr. Develop. Nutr. 6:nzac142. doi: 10.1093/cdn/nzac142
United Nations. (2015). Transforming our world: The 2030 agenda for sustainable development. United Nations, New York.
van Asten, P. J. A., Kaaria, S., Fermont, A. M., and Delve, R. J. (2009). Challenges and lessons when using farmer knowledge in agricultural research and development projects in Africa. Exp. Agric. 45, 1–14. doi: 10.1017/S0014479708006984
Wambogo, E. A., Ghattas, H., Leonard, K. L., and Sahyoun, N. R. (2018). Validity of the food insecurity experience scale for use in sub-Saharan Africa and characteristics of food-insecure individuals. Curr. Develop. Nutr. 2, nzy062–nzy068. doi: 10.1093/cdn/nzy062
Weiskopf, S. R., Cushing, J. A., Morelli, T., and Myers, B. J. E. (2021). Climate change risks and adaptation options for Madagascar. Ecol. Soc. 26:36. doi: 10.5751/ES-12816-260436
WHO. (2006). WHO child growth standards. Length/height-for-age, weight-for-age, weight-for-length, weight-for-height and body mass index-for-age. Methods and development. World Health Organization, Geneva.
WHO and UNICEF. (2009). WHO child growth standards and the identification of severe acute malnutrition in infants and children. A joint statement by the World Health Organization and the United Nations Children’s fund. World Health Organization, Geneva, and United Nations Children’s Fund, New York.
Wichern, J., van Heerwaarden, J., de Bruin, S., Descheemaeker, K., van Asten, P. J. A., Giller, K. E., et al. (2018). Using household survey data to identify large-scale food security patterns across Uganda. PLoS One 13:e0208714. doi: 10.1371/journal.pone.0208714
Wickham, H. (2007). Reshaping data with the reshape package. J. Stat. Softw. 21, 1–20. doi: 10.18637/jss.v021.i12
Keywords: dietary diversity, nutrition, vulnerability, rural livelihoods, stunting, wasting, lean period, self-sufficiency
Citation: Rousseau S, Steinke J, Vincent M, Andriatseheno H and Pontarollo J (2023) Strong seasonality in diets and alarming levels of food insecurity and child malnutrition in south-eastern Madagascar. Front. Sustain. Food Syst. 7:1126053. doi: 10.3389/fsufs.2023.1126053
Edited by:
Kathryn J. Fiorella, Cornell University, United StatesReviewed by:
Julius B. Adewopo, International Institute of Tropical Agriculture (IITA), NigeriaRamya Ambikapathi, Cornell University, United States
Copyright © 2023 Rousseau, Steinke, Vincent, Andriatseheno and Pontarollo. This is an open-access article distributed under the terms of the Creative Commons Attribution License (CC BY). The use, distribution or reproduction in other forums is permitted, provided the original author(s) and the copyright owner(s) are credited and that the original publication in this journal is cited, in accordance with accepted academic practice. No use, distribution or reproduction is permitted which does not comply with these terms.
*Correspondence: Jonathan Steinke, am9uYXRoYW4uc3RlaW5rZUBodS1iZXJsaW4uZGU=