- 1Department of Food Science and Human Nutrition, Iowa State University, Ames, IA, United States
- 2Department of Agricultural and Biosystems Engineering, Iowa State University, Ames, IA, United States
- 3Department of Kinesiology, Iowa State University, Ames, IA, United States
Introduction: The average American diet is high in red and processed meats which increases one's risk for chronic diseases and requires more land and water to produce and yields greater greenhouse gases (GHG) compared to other protein foods. Reduction of red and processed meat intake, such as seen with the Dietary Approaches to Stop Hypertension (DASH diet), could benefit human and environmental health.
Objective: The objective of this study is to predict the environmental sustainability of the DASH diet by evaluating the GHG, land use, and water withdrawals from protein foods within the self-selected diets of people who were encouraged to follow the DASH diet.
Methods: Dietary data was collected from 380 Midwesterners aged 35-70 years old with hypertension using the Automated Self-Administered 24-Hour (ASA 24) Recall System. DASH diet adherence was measured using a nutrient-based DASH score. GHG, land use, and water withdrawals were obtained using Carnegie Mellon University's Economic Input-Output Life Cycle Assessment (eiolca.net) using the Purchaser model (cradle-to-consumer). Multiple linear regressions were used to view associations between individual DASH nutrient scores and environmental impacts of total, animal, and plant protein foods.
Results: Diets that met DASH diet guidelines, as indicated by higher individual DASH nutrient scores, were associated with less GHG and land use from total and animal protein foods but more GHG and land use from plant-protein foods, with a few exceptions. The pattern was not clear for water withdrawals. Diets with the greatest adherence had around 25–50% lower GHG and land use from total protein foods than diets with the lowest adherence. Changes may be due to decreased consumption of total and animal protein foods, selection of animal protein foods with lower environmental impacts, and increased consumption of plant protein foods.
Conclusion: Adhering to the DASH diet can promote the consumption of less environmentally demanding protein foods resulting in lower GHG and land use from protein foods. However, claims regarding the sustainability of the entire dietary pattern cannot be determined based off the current study. Regardless, it is evident that environmental impacts should be considered alongside health impacts when selecting, promoting, or recommending a dietary pattern.
1. Introduction
The world is amidst a simultaneous human health and climate crisis, termed the Global Syndemic by the Lancet Commission (Swinburn et al., 2019). Globally, food systems are contributing to overnutrition, undernutrition and climate change. It is no different in the United States. The average American diet is characterized by being high in processed meat and grain and low in fruits and vegetables, resulting in a dietary pattern that is high in saturated fat, sodium, and added sugar (U.S. Department of Agriculture U.S. Department of Health Human Services, 2020). Not only is this dietary pattern harmful for human health, production of the current dietary pattern demands significant environmental resources further driving climate change (Reinhardt et al., 2020). Fortunately, changes in dietary patterns have the potential to mediate both issues.
Recent research has shown that dietary patterns from around the world can be optimized to simultaneously benefit human health and environmental health (Wilson et al., 2019); however, it is less certain whether dietary guidelines in the United States have the same environmental benefits (Reinhardt et al., 2020). Despite the aforementioned complexities, protein food consumption is of particular interest due to its potential to negatively impact human and environmental health. Protein foods include meat, poultry, seafood, eggs, nuts and seeds, legumes, and soy (Bowman et al., 2020). Of these protein foods, meat, poultry, seafood, and eggs are considered animal protein foods and the remaining are plant protein foods. Despite the variety of protein foods available, Americans' diets lack diversity, containing large amounts of red meat and poultry and small amounts of other protein foods (Fehrenbach et al., 2016). Overconsumption of red meat, especially processed forms, can increase risk for chronic diseases, particularly cardiovascular disease, and mortality (Pan et al., 2012; Rohrmann et al., 2013). Animal protein foods generally yield more GHG and require more land and water than plant protein foods (Sabaté et al., 2015; Clune et al., 2017) and diets with less animal protein foods are generally associated with lower environmental impacts (Reinhardt et al., 2020). Therefore, limiting the consumption of animal protein foods, especially red meat, could have beneficial effects on human and environmental health (Aleksandrowicz et al., 2016; Wilson et al., 2019; Willits-Smith et al., 2020).
The Dietary Approaches to Stop Hypertension (DASH diet) could be recommended to promote both human and environmental health. The DASH diet has been clinically proven to reduce blood pressure with and without sodium reduction (Appel et al., 1997; Sacks et al., 2001), which is relevant as half of Americans have hypertension (Whelton et al., 2018). For protein foods, this dietary pattern limits red and processed meats while promoting lean animal protein foods, such as seafood and poultry, and plant protein foods (NIH National Heart, 2021). To the authors' knowledge, only one study to date has evaluated the environmental sustainability of the DASH diet. The study conducted by Monsivais and colleagues found that diets with higher adherence to the DASH diet recommendations were associated with lower dietary GHG and contained less red and processed meats than diets with lower adherence (Monsivais et al., 2015). These results are promising, as GHG are a primary driver of climate change and extensive knowledge exists about GHG production related to the food system; however, the environmental sustainability of a dietary pattern cannot be determined by only one indicator.
When evaluating the environmental impacts of dietary patterns, GHG are most commonly evaluated (Reinhardt et al., 2020). GHG are the atmospheric gases that trap the sun's heat and warm Earth's surface. Generally speaking, the more GHG there are in the atmosphere, the warmer Earth is (United States Environmental Protection Agency, 2021). While there are multiple types of GHG, such as carbon dioxide and methane, with varying global warming potentials, it is common to evaluate GHG using carbon dioxide equivalents (CO2e), a standardized measure of the various GHG and their global warming potentials (Hausfather, 2009). Other important and common environmental impact indicators include land use and water use (Reinhardt et al., 2020). Land use refers to land being used by humans. Usage of land by humans can negatively impact atmospheric GHG levels, ecosystems, and water quality (United States Environmental Protection Agency, 2018). Water use is more complicated. The term “water use” includes water withdrawals and water consumption, while water consumption is actually a subsect of water withdrawals. Water withdrawals refers to water that has been taken from, or withdrawn, from the source. Water consumption is water that is not readily available for reuse after it has been withdrawn (Vickers, 2001). Both irrigation for agriculture and consumption for livestock have high water withdrawals and consumption; therefore, limiting the amount of water that could be used for other purposes (Water Footprint Calculator, 2020).
Food production affects the environment in many ways, so it is important to assess the environmental impacts of dietary patterns using a variety of indicators. The current study aimed to target this gap by evaluating the land use and water withdrawals, along with GHG, associated with the protein foods within the DASH diet. By evaluating a few environmental impact indicators, we were able to better predict the environmental sustainability of the DASH diet.
2. Methods
2.1. Participants
We analyzed dietary intake data that was collected previously from the Comparison of the Cardiovascular Benefits of Resistance, Aerobic, and Combined Exercise (CardioRACE) study conducted at a large Midwestern university (Brellenthin et al., 2019). Participants (n = 406) were 35- to 70- years-old and had at least three risk factors for cardiovascular disease: (1) had elevated blood pressure or Stage 1 hypertension, (2) were overweight or obese, and (3) were physically inactive. They were recruited from the university campus using flyers and emails. CardioRACE was a yearlong, randomized controlled trial evaluating the effects of various types of exercise on cardiovascular disease risk. Besides receiving an exercise treatment, all participants received dietary counseling for the DASH diet to help control for diet. Participants attended a group DASH diet education class and individual meetings at 3, 6, 9, and 12 months of the intervention. All dietary counseling was conducted by registered dietitians. For further details regarding the CardioRACE study, refer to the previously published study protocol (Brellenthin et al., 2019).
2.2. Dietary intake data
Throughout the yearlong study, participants completed 36 24-hour dietary recalls (3 recalls per month) using the Automated Self-Administered 24-Hour Recall (ASA24) Dietary Assessment Tool, as described previously (Brellenthin et al., 2019). ASA24 is a web-based 24-hour dietary recall system that was developed by the National Cancer Institute (NIH National Cancer Institute, 2023). As a web-based program, it can be challenging and time intensive for new users (Ettienne-Gittens et al., 2013). Therefore, participants were required to attend an introduction to ASA24 class, in which participants viewed a 10-minute presentation on how to use the website and received time to complete a practice recall with help as needed. Participants who did not complete any dietary recalls were excluded from the study; however, participants who completed anywhere from 1 to 36 dietary recalls were included.
ASA24 automatically performs nutrient analysis for each dietary recall based on the Food and Nutrient Database for Dietary Studies and Food Pattern Equivalent Database (NIH National Cancer Institute, 2022). Using the automatically calculated food and nutrient data from ASA24, we were able to determine the overall nutrient and food group composition of participants' diets, which were used for evaluating adherence to the DASH diet and determining the environmental impacts of protein foods consumed by participants.
2.3. Adherence to DASH diet (DASH diet score)
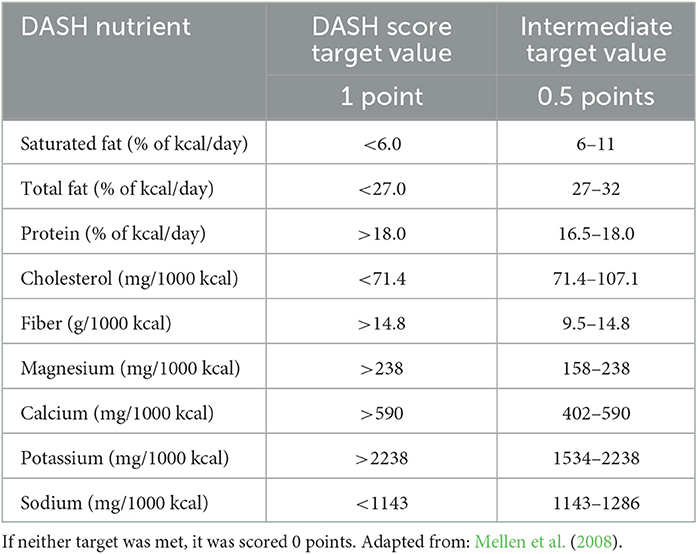
To quantify adherence to the DASH diet, we utilized a DASH diet specific diet quality score (DASH score) developed by Mellen and colleagues (Mellen et al., 2008). Specific guidelines of the DASH score can be found in Table 1. Mellen's DASH score ranges from 0 to 9, with 9 representing the most adherent DASH diets. The score includes targets for 9 nutrients, including sodium, cholesterol, saturated fat, total fat, protein, calcium, magnesium, potassium, and fiber. Each nutrient target is scored 0 to 1, which we term the individual nutrient score. Diets that meet the DASH nutrient targets are assigned 1 point. Diets that meet the intermediate DASH nutrient targets are assigned half a point, and diets that meet neither nutrient targets are assigned 0 points. For discouraged nutrients, such as sodium or saturated fat, lower consumption is assigned a higher individual nutrient score. For encouraged nutrients, such as protein and calcium, higher consumption is assigned a higher score. The individual nutrient scores are then summed together to form the final DASH score (Mellen et al., 2008).
The DASH score was calculated for each participants' dietary recalls (36 total). For the final analysis, an average DASH score was determined. The average DASH score included DASH scores from recalls completed during month 1 to 12 but excluded DASH scores from recalls completed during the baseline month. DASH scores from the baseline recalls were excluded as these recalls were completed prior to participants starting the DASH diet.
2.4. Estimation of environmental impacts
Estimation of greenhouse gases, land use, and water withdrawals requires four databases: Carnegie Mellon University's Economic Input-Output Life Cycle Assessment (eiolca.net), USDA Economic Research Service's Quarterly Food at Home Price Database (QFAHPD), ASA24, and USDA's Food Pattern Equivalent Database. Figures 1–5 are visual representations of the methodology for each type of protein food. To align all four databases, we used meat, poultry and eggs, seafood, nuts and seeds, and soy and legumes as the common protein food groups. Details of how each database was used to estimate the environmental impacts of five protein foods groups are provided in the following subsections.
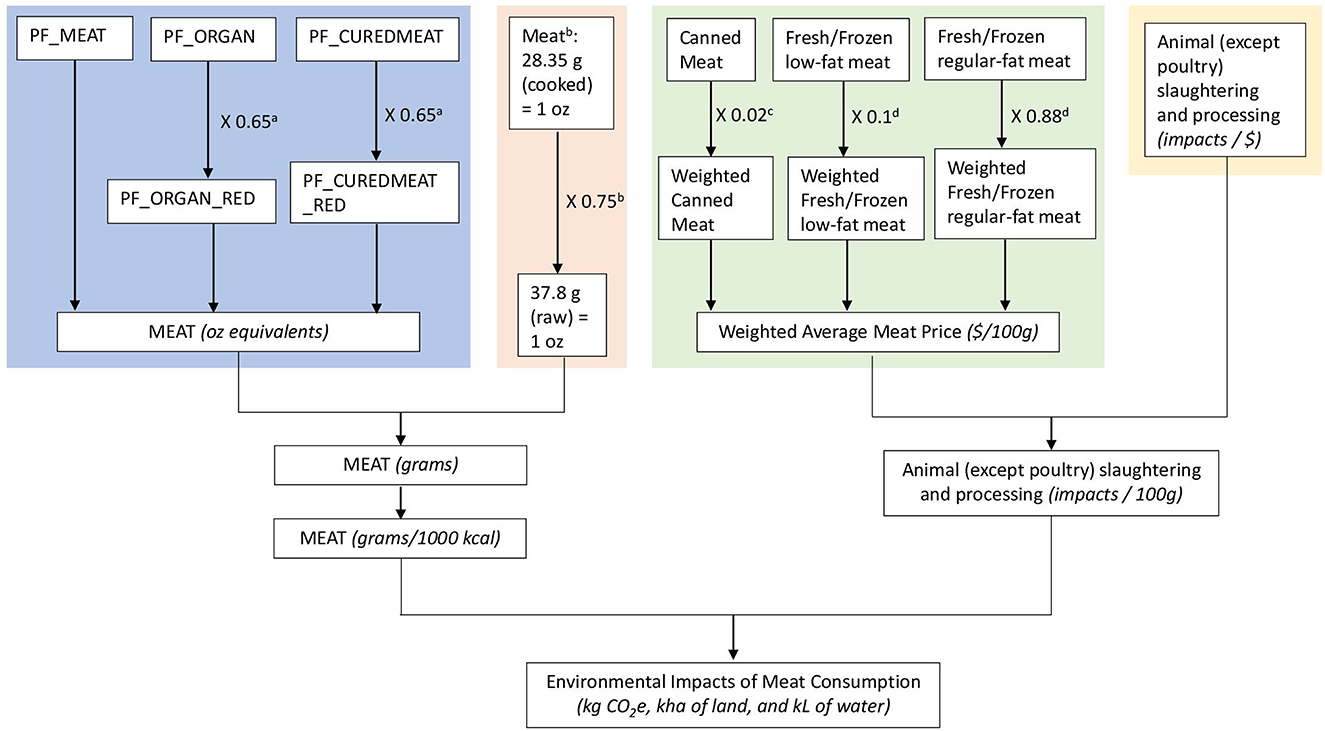
Figure 1. Methodology for estimating environmental impacts of meat: a(Daniel et al., 2011), b(Bowman et al., 2020), c(Hartle et al., 2016), d(Nicklas et al., 2012). Each color block represents a different data source (blue: ASA24, orange: FPED, green: QFAHPD, yellow: eiolca.net). Assumptions (i.e., average American consumption of protein food, forms of protein food, conversion factors) are represented in decimals.
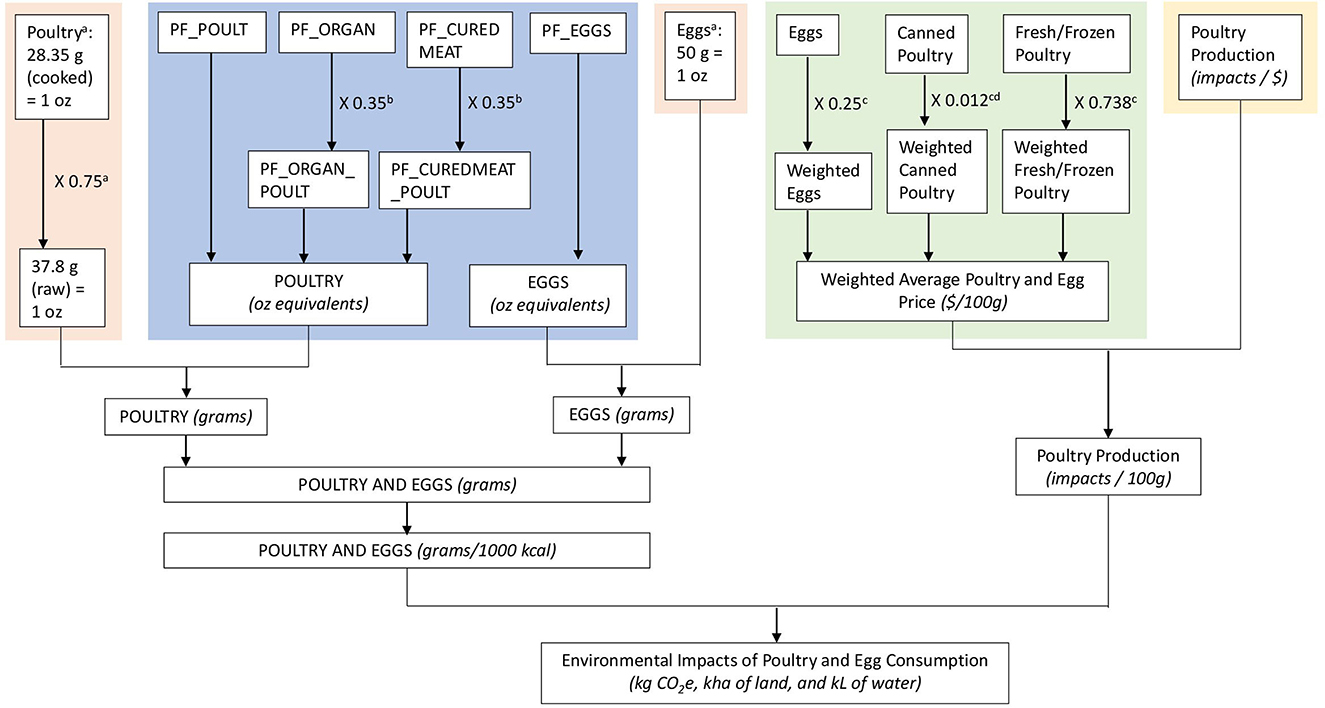
Figure 2. Methodology for estimating environmental impacts of poultry and eggs: a(Bowman et al., 2020), b(Daniel et al., 2011), c(Fehrenbach et al., 2016), d(Hartle et al., 2016). Each color block represents a different data source (blue: ASA24, orange: FPED, green: QFAHPD, yellow: eiolca.net). Assumptions (i.e., average American consumption of protein food, forms of protein food, conversion factors) are represented in decimals.
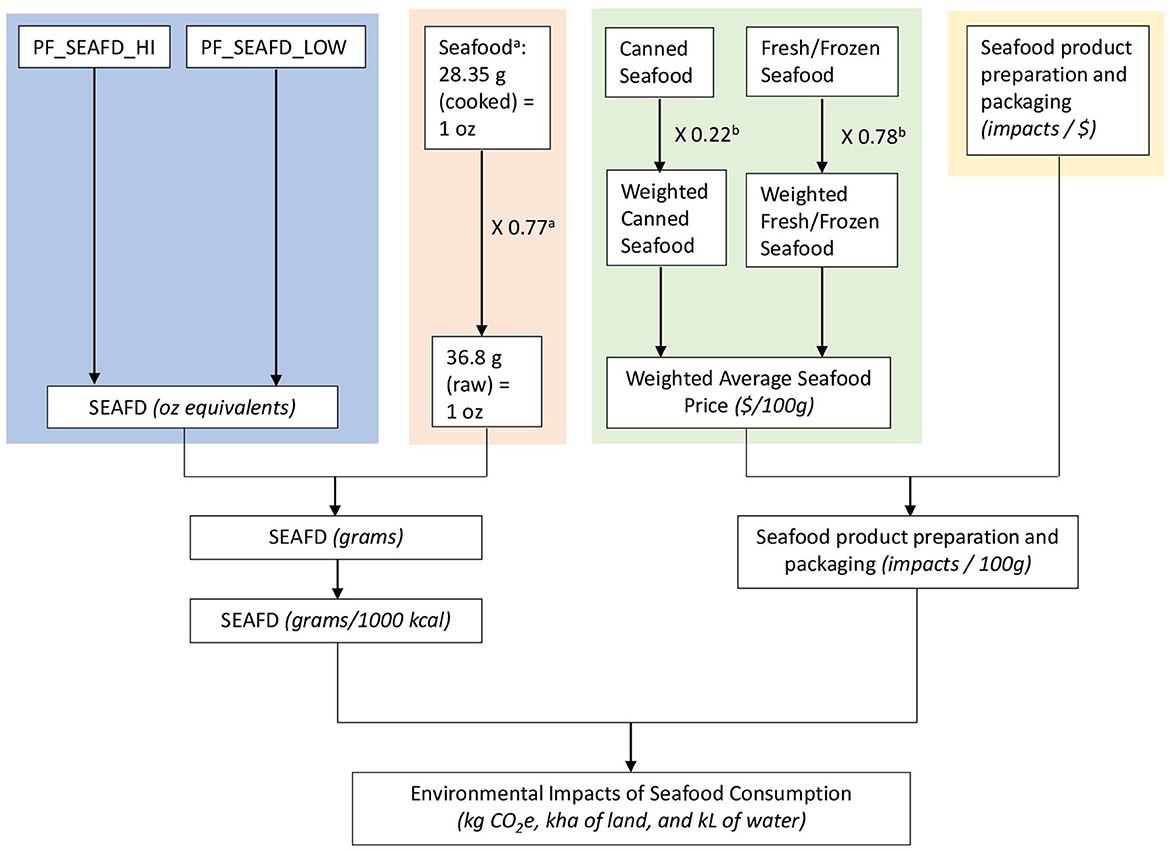
Figure 3. Methodology for estimating environmental impacts of seafood: a(Bowman et al., 2020), b(National Oceanic Atmospheric Administration., 2020). Each color block represents a different data source (blue: ASA24, orange: FPED, green: QFAHPD, yellow: eiolca.net). Assumptions (i.e., average American consumption of protein food, forms of protein food, conversion factors) are represented in decimals.
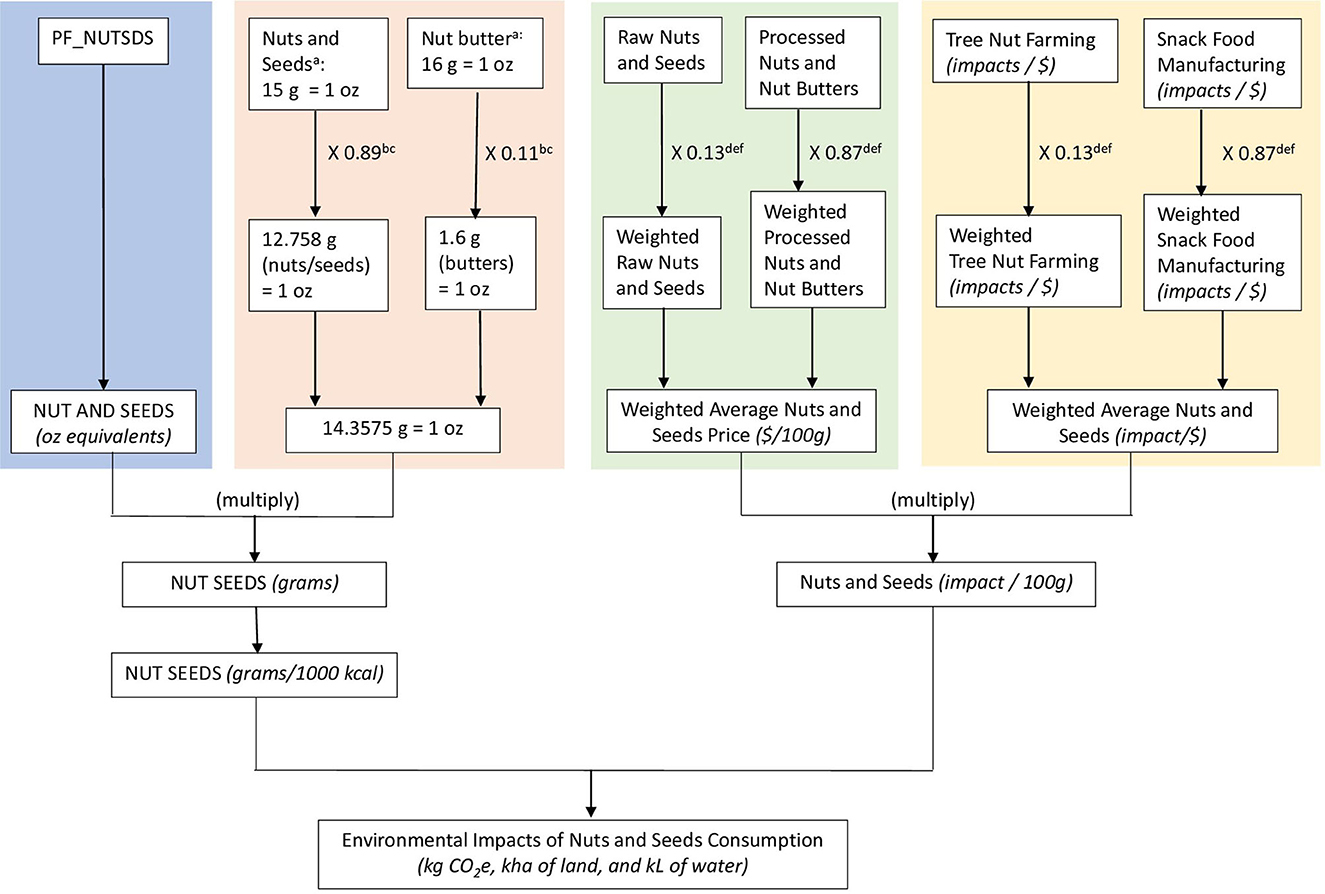
Figure 4. Methodology for estimating environmental impacts of nuts and seeds: a(Bowman et al., 2020), b(King et al., 2008), c(Jenab et al., 2006), d(Almond Board of California, 2017), e(USDA Economic Research Service, 2016), f(USDA National Agricultural Statistics Service, 2020). Each color block represents a different data source (blue: ASA24, orange: FPED, green: QFAHPD, yellow: eiolca.net). Assumptions (i.e., average American consumption of protein food, forms of protein food, conversion factors) are represented in decimals.
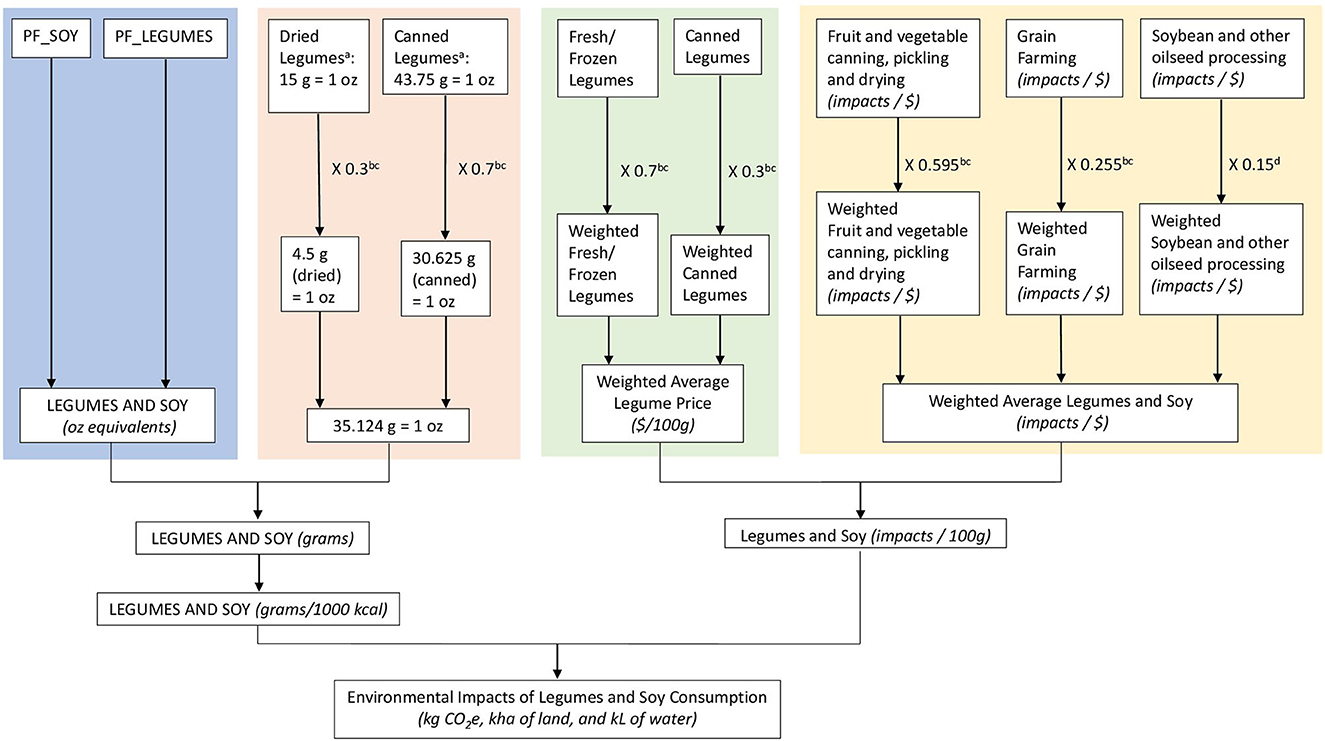
Figure 5. Methodology for estimating environmental impacts of legumes and soy: a(Bowman et al., 2020), b(Winham et al., 2019), c(Heer and Winham, 2020), d(Fehrenbach et al., 2016). Each color block represents a different data source (blue: ASA24, orange: FPED, green: QFAHPD, yellow: eiolca.net). Assumptions (i.e., average American consumption of protein food, forms of protein food, conversion factors) are represented in decimals.
2.4.1. Environmental impacts
We used Carnegie Mellon University's Economic Input-Output Life Cycle Assessment (eiolca.net) to determine the GHG, water withdrawals, and land use associated with each type of protein food (Carnegie Mellon University, 2018). Specifically, we used the 2002 Purchaser model, which is a cradle-to-consumer model based on the 2002 U.S. economy. For all analyses, we used a control economic activity of 1 million 2002 U.S. dollars.
Within the 2002 Purchaser model, we found 8 detailed sectors for protein foods within the Agriculture, Livestock, Forestry, and Fisheries broad sector and the Food, Beverage, and Tobacco broad sector. For each protein food detailed sector, we obtained total economic activity in million dollars, global warming potential for the 100-year time horizon in kg CO2 equivalents (CO2e) (referred to as GHG in current study), water withdrawals in kGal, and land use in kha. Economic activity was then converted to dollars and water withdrawals were converted to kL. Finally, the environmental impacts (GHG, land use, and water withdrawals) were divided by economic activity per dollar to calculate environmental impacts per dollar of economic activity.
For our purposes, we needed environmental impacts to be provided per grams of protein foods consumed rather than per dollar of economic activity. To make this conversion, we used the QFAHPD that provides regional food prices per 100 grams. QFAHPD provides prices for 12 protein foods (ERS food group codes 14, 15, 28–27) (USDA Economic Research Service, 2020). QFAHPD prices are regional, so we used Market groups 6 and 94 as they represented prices for cities and rural parts of the Midwest, where our participants are from. Since the eiolca.net is based on the 2002 U.S. economy, prices from 2002 were also used if available within the QFAHPD. If the 2002 price wasn't available, we used to the QFAHPD price from the closest year and adjusted the price for inflation using the Consumer Price Index (U.S. Bureau of Labor Statistics, 2021).
To combine the eight detailed sectors from eiolca.net with the 12 food groups from QFAHPD into 5 protein food groups, multiple assumptions were made. Both QFAHPD and eiolca.net provides different prices for foods within the same food group but with different packaging (e.g., fresh vs. frozen beef) or forms (e.g., raw nuts vs nut butters). Therefore, we had to calculate a weighted average for each protein food group using published food consumption data. For example, QFAHPD provided two prices for nuts and seeds: (1) raw nuts and seeds and (2) processed nuts and nut butters. We found that 13% of consumed nuts and seeds were raw nuts and seeds, while 87% of consumed nuts were processed nuts and nut butters (USDA Economic Research Service, 2016; Almond Board of California, 2017; USDA National Agricultural Statistics Service, 2020). These percents were multiplied by the respective price, and then the prices were summed to provide a weighted average for nuts and seeds. A similar process was performed when eiolca.net provided multiple detailed sectors for one protein food. Specific details and assumptions used can be food in Figures 1–5.
2.4.2. Intake of protein food
Two databases were used to for the dietary intake of protein foods: ASA24 and Food Pattern Equivalent Database (FPED). As previously described, participants recorded their dietary intake using the ASA24 system. ASA24 provides the ounce equivalents of 12 protein food groups. The average intake of each protein food type was calculated using recalls from month 1 to 12, excluding baseline dietary recalls.
For our purposes, ounce equivalents of protein food groups needed to be converted to grams. This was achieved using the FPED conversion factors (Bowman et al., 2020). For meat, poultry, and seafood, conversions were provided for cooked forms. However, we assumed that meats were purchased in raw or uncooked forms, so we used the cooking yields from the FPED methodology to convert cooked mass to raw (uncooked) mass.
To ensure that all ASA24 groups aligned with eiolca.net sectors, various calculations and assumptions had to be made. First, sometimes multiple ASA24 food groups fit into one eiolca.net sector. In this case, certain ASA24 protein food groups had to be consolidated. For example, the eiolca.net sector Poultry Production considers both poultry and egg production, so the ASA24 poultry and egg food groups were summed together. Another issue that occurred was that ASA24 cured and organ meat categories contained both meat and poultry. Therefore, we used data from Daniel and colleagues assuming that 65% of all organ and cured meat was meat while 35% was poultry (Daniel et al., 2011). Similarly, sometimes multiple FPED conversion factors were provided for one protein food group. In this case, we would then use consumption data to create a weighted average. For example, FPED has different conversion factors for raw vs. nut butters, so we assumed that 11% of nuts and seeds are consumed as butters (Jenab et al., 2006; King et al., 2008). Specific details can be found in Figures 1–5.
2.4.3. Combining intake of protein foods and environmental impact data
Once the ASA24 food data were converted to grams and the eiolca.net environmental impact data were reported as impact per gram (i.e., GHG per gram, water withdrawals per gram, land use per gram), we could combine the data and determine the environmental impacts of the consumed protein foods. To do so, we simply multiply the amount each type of protein food by the corresponding environmental impact per grams.
2.5. Statistical analyses
The statistics software R (version 4.0.4) was used to conduct all descriptive statistics and statistical tests. Descriptive statistics included means and standard deviations for the demographic data, DASH score, and individual nutrient scores.
Prior to statistical tests, the environmental impacts from protein foods were grouped into three categories: total, animal, and plant. Environmental impacts from total protein foods were a sum of the environmental impacts of all protein foods groups, including meat, poultry and eggs, seafood, nuts and seeds, and soy and legumes. Environmental impacts from animal protein foods included environmental impacts from meat, poultry and eggs, and seafood. Environmental impacts from plant protein foods included environmental impacts from nuts and seeds and soy and legumes. The categorization of protein foods into 3 groups served two purposes. First, it normalized the distribution of animal and plant protein food consumption, which when separated, seafood consumption and legumes and soy consumption were very low and not normally distributed. Second, it simplified the analysis, which helped improve interpretability of results. After categorization, there were nine environmental impact variables: (1) GHG from total protein foods, (2) land use from total protein foods, (3) water withdrawals from total protein foods, (4) GHG from animal protein foods, (5) land use from animal protein foods, (6) water withdrawals from animal protein foods, (7) GHG from plant protein foods, (8) land use from plant protein foods, and (9) water withdrawals from plant protein foods.
Multiple linear regression was used to determine the relationship between environmental impacts of protein foods and DASH diet adherence. Environmental impacts were the dependent variables and individual nutrient scores (components of the DASH score) were the independent variables. The full multiple linear regression model used all 9 individual nutrient scores to describe the relationship with the environmental impact factor. Reduced models were developed by only including the individual nutrient scores if they significantly (p-value <0.05) explained the relationship with the environmental impact variable. In the situation where an individual nutrient score was significant in the full model but insignificant in the reduced model, another reduced model was made without the individual nutrient score in question. To select which model (full vs. reduced or reduced vs. reduced) best predicted the relationship, we utilized the Goodness of Fit test and Akaike information criterion. With Goodness of Fit, a non-significant result indicates that neither model explains the relationship significantly better, so either model could be used. In this case, we selected the original reduced model. If the Goodness of Fit test yields a significant result, this indicates that one model does describe the relationship better; however, it does not indicate which model is better. Therefore, in the case of a significant Goodness of Fit test, the Akaike information criterion was used to select the preferred model, which would be with model with the lowest Akaike information criterion.
After performing multiple linear regressions, percent change calculations were conducted to help quantify the relationships between nutrient scores and environmental impacts. Percent change was calculated by subtracting the environmental impact associated with the lowest nutrient score, 0, from the environmental impact associated with the highest nutrient score, 0.75 or 1. This value was then divided by the environmental impact associated with the lowest nutrient score, 0, and multiplied by 100 to convert from a decimal to a percentage. The following calculation was only performed for the environmental impacts of total protein foods.
3. Results
3.1. Demographics
The original CardioRACE study had 406 participants; however, 26 participants didn't complete any dietary recalls. Thus, 380 participants were included in the analysis. Demographic characteristics of the 380 participants are presented in the Supplementary material. The mean (±SD) age is 50.31 (±9.74) years, and the mean (±SD) body mass index is 31.17 (±4.88) kg/m2.
3.2. Dietary analysis
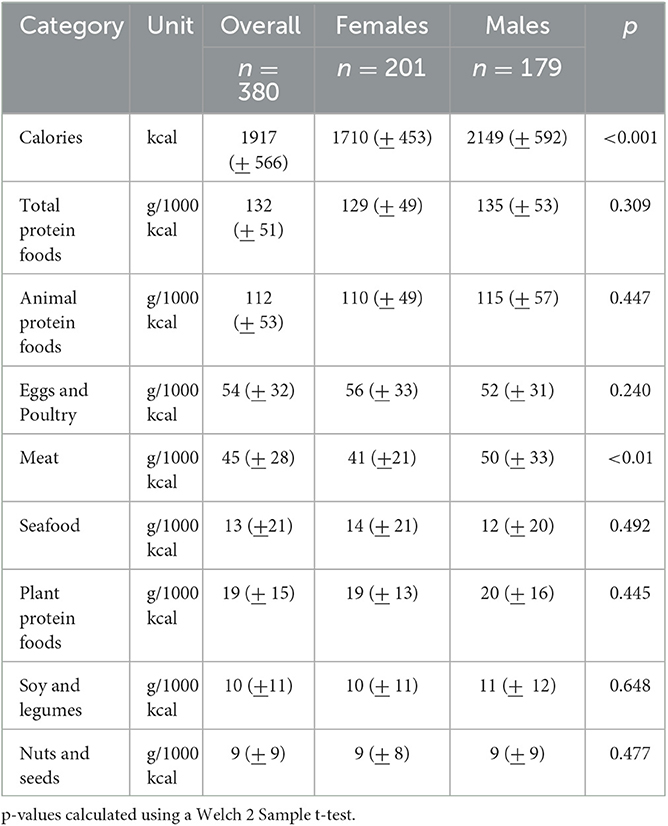
On average, participants consumed around 1917 kcal, with men (2149 ± 592 kcal) consuming more than women (1710 ± 453 kcal). Participants consumed 132 (± 51) grams of total protein foods per 1000 kcal, with animal protein foods (112 ± 53 g/1000 kcal) accounting for the majority (85%). It is important to note that seafood consumption and soy and legumes consumption were highly skewed to the right suggesting generally low consumption, which is one reason why protein foods were group into either animal or plant protein foods for analysis. More specific details about protein food composition can be found in Table 2.
3.3. DASH diet adherence
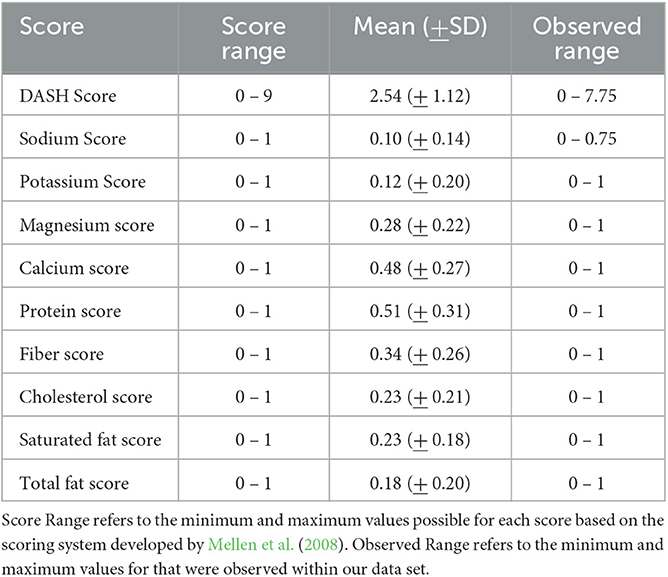
DASH diet scores were slightly skewed to the right and ranged from 0 to 7.75. The mean DASH diet score was 2.54 (± 1.12). Participants were less likely to meet sodium, potassium, total fat recommendations (0.10 ± 0.14, 0.12 ± 0.20, and 0.18 ± 0.20, respectively) and were more likely to meet protein, calcium, and fiber recommendations (0.51 ± 0.31, 0.48 ± 0.27, 0.34 ± 0.26, respectively). All scores are displayed in Table 3.
3.4. Environmental impacts of protein foods
GHG, water withdrawals, and land use were evaluated for total protein foods, animal protein foods, and plant protein foods. Total protein food is the sum of the respective environmental impacts associated with each category of protein foods (meat, poultry and eggs, seafood, nuts and seeds, and soy and legumes). Animal protein foods include the environmental impacts from meat, poultry and eggs, and seafood. Plant protein foods include the environmental impacts form nuts, seeds, soy, and legumes.
3.4.1. Total protein foods
3.4.1.1. Greenhouse gases
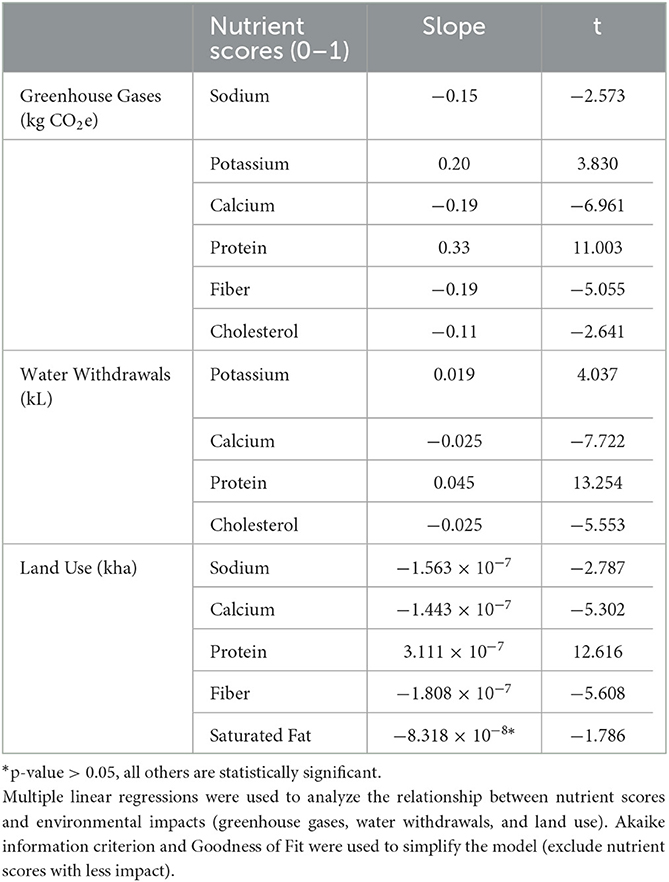
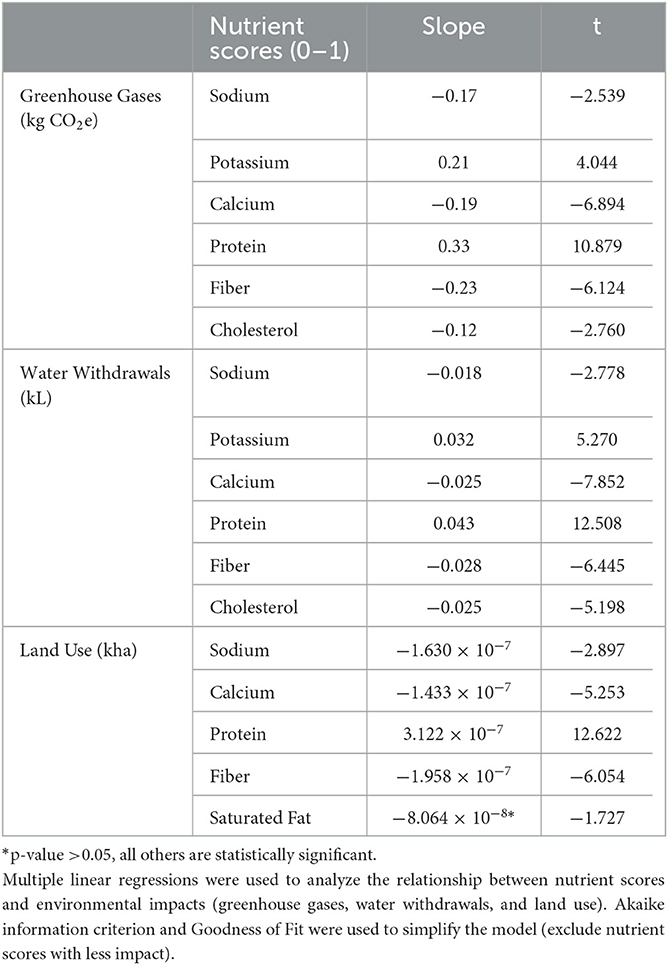
The mean (±SD) GHG for total protein foods was 0.43 (± 0.20) kg CO2e per 1000 kcal (Table 4), with a range of 0.05 to 1.77 kg CO2e per 1000 kcal. Accordance to sodium, potassium, calcium, protein, fiber, and cholesterol nutrient scores significantly predict GHG for total protein foods. This model described 54.85% of variance between the included individual nutrient scores and total protein food GHG [Adjusted R2 = 0.5485, p-value <0.0001, F(6, 373) = 77.72]. Sodium, cholesterol, fiber, and calcium scores were negatively associated total protein food GHG. In other words, lower sodium and cholesterol consumption (high sodium and cholesterol scores) was associated with lower total protein food GHG, while higher fiber and calcium consumption (high fiber and calcium scores) was associated with lower total protein food GHG. Specifically, diets with the highest sodium, cholesterol, fiber, and calcium scores had 26–45% lower GHG from total protein foods compared to diets with the lowest scores (Figures 6A–D). On the other hand, protein and potassium scores were positively associated with total protein food GHG, meaning diets with more potassium and protein (high potassium and protein scores) tend to have higher total protein food GHG. When comparing diets with the highest potassium and protein scores to diets with the lowest scores, GHG from total protein foods are 48% and 79% higher, respectively (Figures 6E, F). Slopes are provided in Table 5. Percent change for GHG from total protein foods are provided on Figures 6A–F.

Table 4. Mean (+SD) GHG, water withdrawals, and land use for total, animal, and plant protein foods.
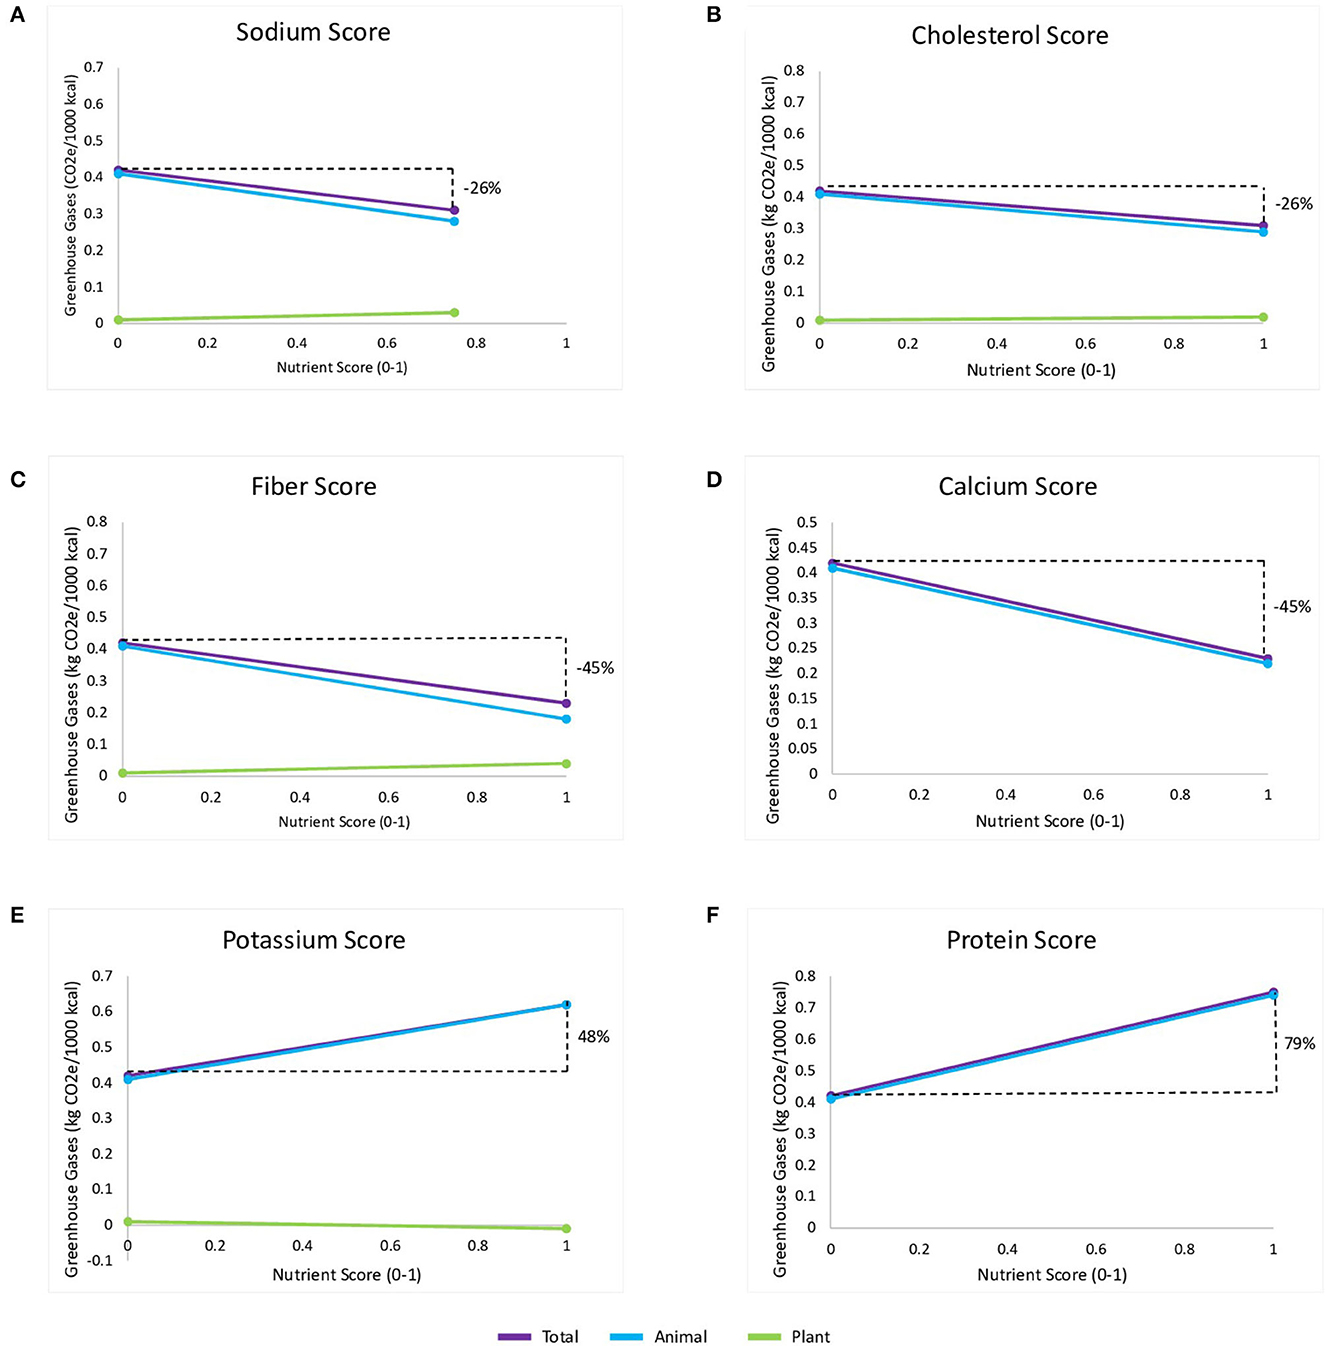
Figure 6. Comparison of GHG from total, animal, and plant protein foods. Individual nutrient scores range from 0 to 1, with 1 representing better adherence to DASH nutrient target. (A–C, E) include total, animal, and plant protein foods. (D, F) include total and animal protein foods. Percent change is shown in black and was calculated using the normal percent change equation: [(final value – initial value)/initial value] * 100.
3.4.1.2. Water withdrawals
The mean (+SD) water withdrawals for total protein foods was 0.068 (+ 0.025) kL per 1000 kcal (Table 4), with a range of 0.002 to 0.227 kL per 1000 kcal. Potassium, calcium, protein, and cholesterol scores described 58.73% of variance of water withdrawals from total protein foods [Adjusted R2 = 0.5873, p-value <0.0001, F(2, 375) = 135.8]. Cholesterol and calcium scores were negatively associated with water withdrawals for total protein foods, and the diets with the highest cholesterol and calcium scores had 42% lower water withdrawals than diets with the lowest scores (Figures 7A, B). Similar to GHG, potassium and protein scores were positively associated with total protein food water withdrawals, and diets with the highest protein and potassium scores had 32 and 76% higher water withdrawals compared to diets with the lowest scores (Figures 7D, E). This means that diets with more calcium (high calcium score) were associated with lower water withdrawals for total protein foods, while diets higher in cholesterol, protein, and potassium (low cholesterol score; high protein and potassium scores) were associated with greater water withdrawals for total protein foods. Slopes are provided in Table 5. Percent change for water withdrawals from total protein foods are provided on Figures 7A, B, E, F.
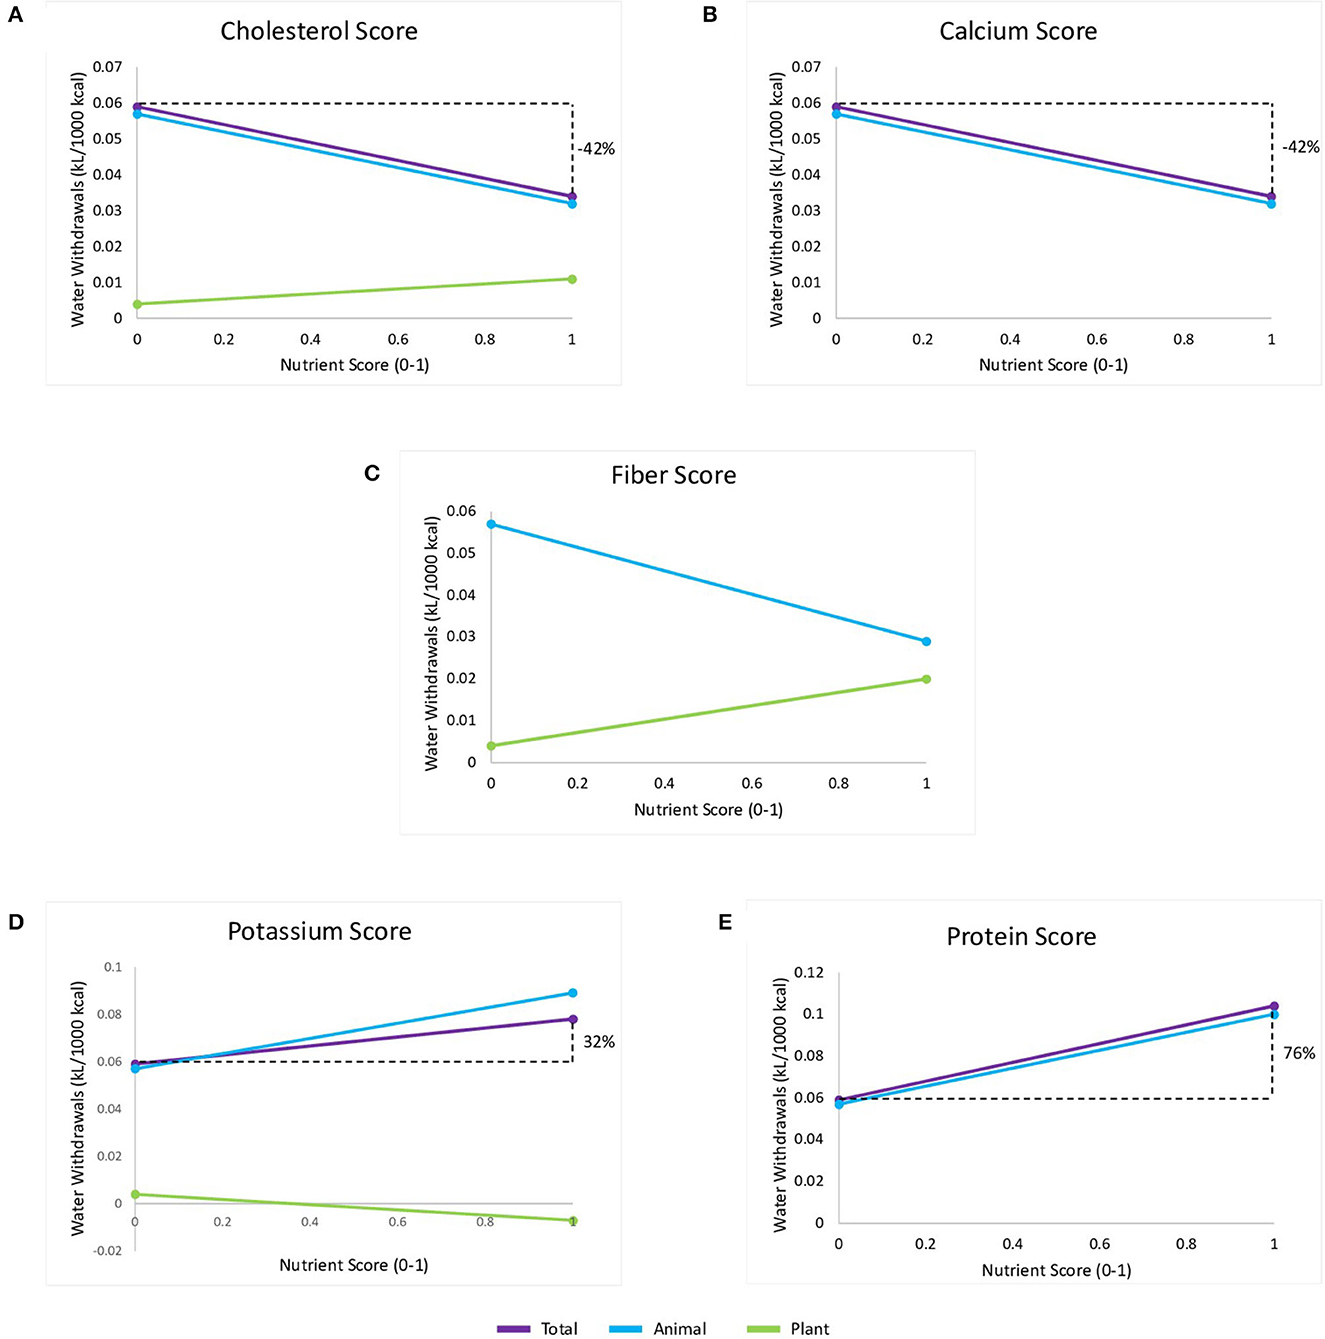
Figure 7. Comparison of water withdrawals for total, animal, and plant protein foods. Individual nutrient scores range from 0 to 1, with 1 representing better adherence to DASH nutrient target. (A, D) include total, animal, and plant protein foods. (C) includes animal and plant protein foods. (B, E) include total and animal protein foods. Percent change is shown in black and was calculated using the normal percent change equation: [(final value – initial value)/initial value] * 100.
3.4.1.3. Land use
The mean (+SD) land use for total protein foods was 3.376 x10⁻⁷ (+ 1.835 x10⁻⁷) kha per 1000 kcal (Table 4), with a range of 1.711 x10⁻⁸ to 1.750 x10⁻⁶ kha per 1000 kcal. Sodium, calcium, protein, fiber, and saturated fat scores described 45.17% of variance in land use from total protein foods [Adjusted R2 = 0.4517, p-value < 0.0001, F(5, 374)]. Fiber, sodium, calcium, and saturated fat scores are negatively associated with land use for total protein foods, and only protein was positively associated. Although, the saturated fat slope was not statistically significant. Thus, diets with the highest fiber, sodium, calcium, and saturated fat scores had 24–52% lower land use from total protein foods compared to the lowest scores, but diets with the highest protein scores had 90% higher land use compared to diets with the lowest (Figures 8A–E). Slopes are provided in Table 5. Percent change for land use from total protein foods are provided on Figures 8A–E.

Figure 8. Comparison of land use for total, animal, and plant protein foods. Individual nutrient scores range from 0 to 1, with 1 representing better adherence to DASH nutrient target. (A) include total, animal, and plant protein foods. (B–E) includes total and animal protein foods. Percent change is shown in black and was calculated using the normal percent change equation: [(final value – initial value)/initial value] * 100.
3.4.2. Animal protein foods
3.4.2.1. Greenhouse gases
The mean (+SD) GHG for animal protein foods was 0.41 (+ 0.20) kg CO2e per 1000 kcals, with a range of 0.007 to 1.77 kg CO2e per 1000 kcal (Table 4). Sodium, potassium, calcium, protein, fiber, and cholesterol scores described 56.6% of variance in GHG for animal protein foods [Adjusted R2 = 0.566, p-value <0.0001, F(6, 373) = 83.37]. Greater adherence to sodium, calcium, fiber, and cholesterol scores were negatively associated with GHG for animal protein foods, while greater adherence to potassium and protein scores were positively associated. This is identical to the model describing GHG for total protein food. Generally, greater consumption of sodium, cholesterol, potassium, and protein (low sodium and cholesterol scores; high potassium and protein scores) were associated with higher GHG compared to diets low in these nutrients. Greater consumption of calcium and fiber (high calcium and fiber scores) were associated with lower GHG compared to diets high in these nutrients. Slopes are provided in Table 6.
3.4.2.2. Water withdrawals
The mean (+SD) kL of water withdrawals per 1000 kcal was 0.056 (+ 0.026) (Table 4), with a range of 0.002 to 0.227 kL per 1000 kcal. Adherence to sodium, potassium, calcium, protein, fiber, and cholesterol scores significantly predict water withdrawals for animal protein foods. This model explained 65.95% of the variance in water withdrawals for animal protein foods [Adjusted R2 = 0.6595, p-value <0.0001, F(6, 373) = 123.3]. Sodium, calcium, fiber, and cholesterol scores were negatively associated with water withdrawals for animal protein foods, while protein and potassium scores were positively associated. Greater consumption of sodium, cholesterol, potassium, and protein (low sodium and cholesterol scores; high potassium and protein scores) were associated with more water withdrawals for animal protein foods, while greater consumption of fiber and calcium (high fiber and calcium scores) were associated with less water withdrawals from animal protein foods. This model was different from the water withdrawals from total protein food as it included sodium and fiber, which were excluded in the total protein food's water withdrawals model. Slopes are provided in Table 6.
3.4.2.3. Land use
The mean (+SD) land use was 3.294 × 10⁻⁷ (+1.856 × 10⁻⁷) kha per 1000 kcal (Table 4), ranging from 1.711 × 10⁻⁸ to 1.750 × 10⁻⁶ kha per 1000 kcal. Sodium, calcium, protein, fiber, and saturated fat scores were significant predictors of land use for animal protein foods, describing 45.17% of the variance in land use [Adjusted R2 = 0.4517, p-value <0.0001, F(5, 374) = 63.44]. Sodium, calcium, fiber, and saturated fat scores were negatively associated with land use for animal protein foods, meaning diets with lower land use from animal protein foods were typically higher in calcium and fiber or lower in sodium and saturated fat. Although, the saturated fat slope was not statistically significant. Protein score was positively associated with land use for animal protein foods, meaning diets with lower land use from animal protein foods were typically lower in protein. Slopes are provided in Table 6.
3.4.3. Plant protein foods
3.4.3.1. Greenhouse gases
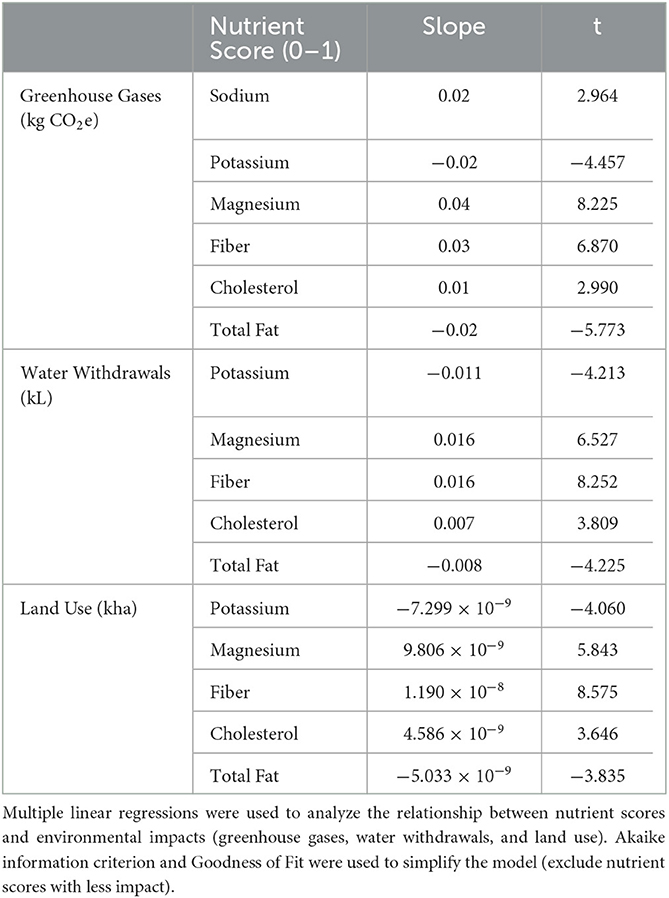
The mean (+SD) GHG for plant protein foods was 0.02 (+ 0.02) kg CO2e per 1000 kcal (Table 4), with values ranging from 0.000 to 0.11 kg CO2e per 1000 kcal. Sodium, potassium, magnesium, fiber, cholesterol, and total fat described 51.89% of the variance in GHG for plant protein foods [Adjusted R2 = 0.5189, p-value <0.0001, F(6, 373)]. Sodium, magnesium, fiber, and cholesterol were positively associated with GHG for plant protein foods, while total fat and potassium was negatively associated, which are opposite to the associations for total and animal protein foods. Slopes are provided in Table 7.
3.4.3.2. Water withdrawals
The mean (+SD) water withdrawals for plant protein foods was 0.012 (+ 0.009) kL per 1000 kcal (Table 4), with values ranging from 0.000 to 0.048 kL per 1000 kcal. Potassium, magnesium, fiber, cholesterol, and total fat scores predicted water withdrawals for plant protein foods and described 48.29% of variance [Adjusted R2 = 0.4829, p < 0.0001, F(5, 374) = 71.8]. Magnesium, fiber, and cholesterol were positively associated with water withdrawals from plant protein foods. Potassium and total fat were negatively associated. Slopes are provided in Table 7.
3.4.3.3. Land use
The mean (+SD) land use for plant protein foods was 8.182 × 10⁻⁹ (+ 6.197 × 10⁻⁹) kha per 1000 kcal (Table 4), with values ranging from 0.000 to 3.46 × 10⁻⁸ kha per 1000 kcal. Potassium, magnesium, fiber, cholesterol, and total fat scores described 47.28% of the variation in land use [Adjusted R2 = 0.4728, p-value = <0.0001, F(5, 374) = 68.99]. Magnesium, fiber, and cholesterol score were positively associated with land use for plant protein foods, while total fat and potassium were negatively associated. Slopes are provided in Table 7.
3.4.4. Comparing total, animal, and plant protein foods
Figures 6A, C, E represent the comparison of GHG from total, animal, and plant protein foods in relation to sodium, cholesterol, fiber, and potassium scores. Generally, diets that were more adherent with sodium, cholesterol, and fiber recommendations were associated with lower GHG from total and animal protein foods but higher GHG from plant protein foods. Meanwhile, diets that were more adherent with potassium recommendations were associated with higher GHG from total and animal protein foods but lower GHG from plant protein foods. The calcium and protein models did not include plant protein foods; however, we see that for calcium, higher scores are associated with lower GHG from total and animal protein foods (Figure 6D). For protein, higher scores are associated with higher GHG from total and animal protein foods (Figure 6F).
For water withdrawals, only cholesterol and potassium scores were included in all 3 models (Figures 7A, D). Fiber scores were included in both the plant and animal protein food models (Figure 7C). Calcium and protein scores were included in the total and animal protein food models (Figures 7B, E). Higher cholesterol scores were associated with lower water withdrawals from total and animal protein foods but higher water withdrawals from plant protein foods. The opposite was true for potassium, in which higher scores were associated with higher water withdrawals for total and animal protein foods but lower water withdrawals for plant protein foods. Similar to cholesterol, greater adherence to fiber recommendations were negatively associated with water withdrawals from animal protein foods but positively associated with water withdrawals from plant protein foods. Lastly, calcium scores were negatively associated with water withdrawals for total and animal protein foods, while the opposite was seen for protein scores.
Land use models are shown in Figures 8A–E. Only the fiber score was included in all three protein food models; however, sodium, saturated fats, calcium, and protein were shared by total and animal protein foods. Greater adherence to fiber scores was associated with lower land use for total and animal protein foods but higher land use from plant protein foods. Higher sodium, calcium, and saturated fat scores were associated with reduced land use from total and animal protein foods, but higher protein scores were associated with increased land use from total and animal protein foods.
4. Discussion
Based on protein foods alone, we can predict that adherence to the DASH diet is more environmentally sustainable, in terms of GHG and land use, compared to the average American diet. This is a fair prediction as protein foods account for a majority of GHG and land use in the average American diet (Behrens et al., 2017; Heller et al., 2018); however, further claims shouldn't be made until the entire diet is evaluated. Despite this limitation, this study tests the feasibility of using eiolca.net with dietary data collected with the popular software, ASA24, which could lead to further life cycle assessment studies on self-selected diets and expand our understanding of the environmental sustainability of food choices. It is also the first evaluation the environmental sustainability of self-selected diets of Midwesterners with hypertension who were encouraged to follow the DASH diet, illustrating the environmental impacts of this dietary pattern if promoted by healthcare professionals. Further, it highlights the significant impacts that dietary composition has on the environment. Now, more than ever, health professionals need to consider the environmental impacts of recommended dietary patterns, in additional to health, to help mitigate climate change and the deleterious effects climate change has on human health (Atwoli et al., 2021).
Our results show that greater adherence to most individual nutrient scores were associated with less GHG and land use from animal protein foods, and more GHG and land use from plant protein foods. However, the increases in GHG and land use from plant protein foods are less than the decreases in GHG and land use from animal protein foods. Thus, our results also show that greater adherence to most individual nutrient scores were associated with less GHG and land use from total protein foods. These results may suggest that diets that better adhere with DASH diet guidelines contain more protein foods that are less environmentally demanding to produce, such as chicken, pork, or plant-based options rather than beef (Sabaté et al., 2015; Clune et al., 2017). This aligns with other research showing that DASH adherent diets contain less red and processed meats and slightly more nuts and seeds (Monsivais et al., 2015) and that diets with lower GHG generally contain more poultry, less meat, and less animal protein foods (van de Kamp et al., 2018; Rose et al., 2019). Similarly, modeling studies evaluating the environmental impacts of the U.S. Dietary Guidelines have shown that land requirements decrease as the amount of animal products decrease (Peters et al., 2016; Behrens et al., 2017; Birney et al., 2017).
The pattern is less clear for water withdrawals. It is obvious that better adherence to some individual nutrient scores were associated with lower water withdrawals from animal protein foods and greater water withdrawals from plant protein foods. However, there was no common pattern for total protein foods as there was an equal number of individual nutrient scores that are positively and negatively associated with water withdrawals from total protein foods. In other words, it appears that the reduction in water withdrawals from animal protein foods may be counteracted by the increase in water withdrawals from plant protein foods, which makes sense as not all plant protein foods have lower water withdrawals compared to animal protein foods. For example, nuts and beef have similar water footprints per gram of protein (Mekonnen and Hoekstra, 2012), meaning swapping nuts for beef, when matching protein content, wouldn't reduce the water footprint for total protein foods. Even so, there are plenty of substitutions for beef that are associated with reduced water requirements which should be encouraged, such as poultry, eggs, pork, and legumes (Sabaté et al., 2015). Regardless, further increases in water withdrawals would likely occur with adoption of the DASH diet due to increases in fruits, vegetables, and dairy, as seen with the adoption of the U.S. Dietary Guidelines, Mediterranean diet, vegan diet, and vegetarian diet (Birney et al., 2017; Mekonnen and Fulton, 2018).
When considering the specific nutrient scores and environmental impact recommendations, the relationships make sense when we consider the origins of the DASH diet, nutrient composition of certain protein foods, and results of similar studies. The DASH diet emphasizes the consumption of non-meat foods, including fruits, vegetables, and low-fat dairy, while simultaneously reducing the consumption of red meat, maintaining the consumption of poultry, and increasing the consumption of fish, nuts, seeds, and legumes consumption. These dietary changes optimize the intakes of minerals, fiber, and protein while reducing the intake of saturated fat, total fat, and cholesterol, resulting in blood pressure reductions similar to that of certain hypertensive medications at the time (Appel et al., 1997). Although the current study didn't evaluate the environmental impacts of fruits, vegetables, and low-fat dairy, it makes sense that a majority of the nutrient scores were associated with lower environmental impacts as the diet originally reduced consumption of more environmentally demanding protein foods and increased or maintained consumption of less environmentally demanding protein foods to meet their nutrient targets. Further, we are able to explain these relationships by considering the nutrient composition of protein foods. For example, we saw that higher fiber scores, suggesting higher fiber intake, were associated with lower GHG, land use, and water withdrawals (animal only) for total and animal protein food but higher GHG, land use, and water withdrawals from plant protein foods. This makes sense as animal protein foods aren't a source of fiber while plant protein foods are (O'Neil et al., 2012). Conversely, higher cholesterol scores, suggesting lower cholesterol intake, were associated with lower GHG and water withdrawals from total and animal protein foods but higher GHG and water withdrawals for plant protein foods. This again makes sense as cholesterol is found exclusively in animal products (Cotton et al., 2004). A similar trend was observed with saturated fat scores and land use for total and animal protein foods, although the slope for saturated fat was not statistically significant (Huth et al., 2013). In addition to aligning with the DASH diet goals and nutritional content of foods, these results also align with other studies' findings. Specifically, diets with lower GHG typically contain more fiber, less sodium, and less potassium (Rose et al., 2019).
There are potential downsides to adopting a healthier diet, especially a plant-based diet. In some cases, more healthful diets, including the DASH diet, cost more (Darmon and Drewnowski, 2015; Monsivais et al., 2015). While there are cost effective ways to improve DASH diet quality, such as reducing red and processed meats and increasing nuts and legumes (Monsivais et al., 2015), adopting a more plant-based diet can be challenging for some due to social norms, personal preference, and availability, amongst other factors (Lea and Worsley, 2003; Pohjolainen et al., 2015; Fresán et al., 2020). In addition to these barriers, there are potential environmental downsides when adopting a healthier diet. For example, higher quality diets are associated with higher food waste (Conrad et al., 2018), meaning reductions in GHG and land use from certain dietary changes could be counteracted. For these reasons, it may be strategic to recommend gradual changes to the diet rather than adopting a new dietary pattern, as recommended by Climatarians. The idea behind the Climatarian diet is to make simple diet swaps that are beneficial for the environment, such as swapping beef or lamb for pork or poultry or selecting locally grown, seasonal fruits and vegetables over food grown in a heated greenhouse (Climatarian, 2022). Simply swapping beef with plant-based proteins or poultry can significantly reduce dietary GHG (9–50% depending on type and degree of substitution), while also reducing dietary costs and improving diet quality (Willits-Smith et al., 2020). It may also be more attainable for most people. Focusing on smaller swaps may actually be better for the environment, as research has shown that perfect adoption of the U.S. Dietary Guidelines sometimes increases GHG and water use, generally due to increased dairy, fruit, and vegetable consumption (Tom et al., 2016; Birney et al., 2017; Mekonnen and Fulton, 2018; Hitaj et al., 2019). As such, the DASH diet may be a good option as it is not entirely a plant-based diet, rather it encourages diverse protein food consumption.
Conclusions drawn from this research should be done with caution due to various methodological limitations. First, only the environmental impacts of protein food were evaluated while the individual nutrient scores were based on the entire diet. This is a significant limitation as protein foods are not the only source of nutrients in our diet. Second, our life cycle assessment has a few limitations. Specifically, the scope of eiolca.net is cradle-to-retail gate, meaning impacts acquired from consumer use (i.e., storage, cooking) and food waste are not included. The specificity of the life cycle assessment can be limiting as well, as we cannot distinguish between processing types (e.g., fresh, frozen, or canned), organic and non-organic products, and even certain protein foods. For example, poultry and eggs, and fresh and processed meat options were grouped together. Additionally, while there are many environmental impacts, even beyond GHG, land use, and withdrawals, that can be measured using eiolca.net, they cannot be adjusted to account for updated methodologies. Despite these limitations, eiolca.net provides a free and computationally quick way to roughly estimate a broad range of environmental impacts, making this tool adequate for most research applications, such studies similar to this one. Lastly, the CardioRACE study population was likely more motivated as they signed up for a yearlong exercise intervention, were of higher socioeconomic status, and had access to registered dietitians throughout the year, meaning their adoption of the DASH diet may not be comparable to other populations.
Despite limitations, this study further emphasizes the need to consider environmental sustainability when choosing and promoting dietary patterns. The DASH diet may be a suitable option as it encourages the consumption of protein foods that are diverse and less environmentally demanding, in terms of GHG and land use. Further exploration of the DASH diet should be conducted, including evaluation of cost and other environmental impact factors, besides GHG, land use, and water withdrawals. Additionally, to further test the feasibility and reliability of eiolca.net for evaluating dietary patterns, it would be beneficial to compare the use of eiolca.net for different U.S. regions and compare it to other life cycle assessment databases.
Data availability statement
The raw data supporting the conclusions of this article will be made available by the authors, without undue reservation.
Ethics statement
The studies involving human participants were reviewed and approved by the Institutional Review Board at Iowa State University. The patients/participants provided their written informed consent to participate in this study.
Author contributions
NK, KR, and LL-F: conceptualization and methodology. NK: formal analysis (life cycle assessment and statistics), writing – original draft, and data visualization. KR and LL-F: supervision and writing – reviewing and editing. DCL and AB: writing - reviewing and editing. All authors contributed to the article and approved the submitted version.
Funding
Research reported in this publication was supported by the National Heart, Lung, and Blood Institute of the National Institutes of Health under award number R01HL133069. The content is solely the responsibility of the authors and does not necessarily represent the official views of the National Institutes of Health.
Acknowledgments
Thanks to Randall Foster and Amin Shirazi for providing statistical advice. Thanks to Dr. Ruth Litchfield for serving on the first author's Plan of Study Committee and providing research advice. The content of this paper was published prior in the form of a master's thesis (Kling, 2021).
Conflict of interest
The authors declare that the research was conducted in the absence of any commercial or financial relationships that could be construed as a potential conflict of interest.
Publisher's note
All claims expressed in this article are solely those of the authors and do not necessarily represent those of their affiliated organizations, or those of the publisher, the editors and the reviewers. Any product that may be evaluated in this article, or claim that may be made by its manufacturer, is not guaranteed or endorsed by the publisher.
Author disclaimer
The content is solely the responsibility of the authors and does not necessarily represent the official views of the National Institutes of Health.
Supplementary material
The Supplementary Material for this article can be found online at: https://www.frontiersin.org/articles/10.3389/fsufs.2023.1145272/full#supplementary-material
References
Aleksandrowicz, L., Green, R., Joy, E. J. M., Smith, P., and Haines, A. (2016). The impacts of dietary change on greenhouse gas emissions, land use, water use, and health: a systematic review. PLoS One 11, e0165797. doi: 10.1371/journal.pone.0165797
Almond Board of California Almond Almanac 2017 Annual Report. (2017) Available online at: https://www.almonds.com/sites/default/files/2017%20Almanac%20Final%20-%20updated%207.5.18.pdf (accessed December 18 2020).
Appel, L. J., Moore, T. J., Obarzanek, E., Vollmer, W. M., Svetkey, L. P., Sacks, F. M., et al. (1997). A clinical trial of the effects of dietary patterns on blood pressure. N. Engl. J. Med. 336, 1117–1124. doi: 10.1056/NEJM199704173361601
Atwoli, L., Baqui, A. H., Benfield, T., Bosurgi, R., Godlee, F., Hancocks, S., et al. (2021). Call for emergency action to limit global temperature increases, restore biodiversity, and protect health. Nutr. Rev. 7983–1185. doi: 10.9775/2021.UNGA.editorial
Behrens, P., Kiefte-De Jong, J. C., Bosker, T., Rodrigues, J. F. D., Koning, D., Tukker, A., et al. (2017). Evaluating the environmental impacts of dietary recommendations. Proc. Natl. Acad. Sci. U. S. A. 114, 13412–13417. doi: 10.1073/pnas.1711889114
Birney, C. I., Franklin, K. F., Davidson, F. T., and Webber, M. E. (2017). An assessment of individual foodprints attributed to diets and food waste in the United States. Environ. Res. Lett. 12, 494. doi: 10.1088/1748-9326/aa8494
Bowman, S. A., Clemens, J. C., Friday, J. E., and Moshfegh, A. J. (2020). Food Patterns Equivalents Database 2017-2018: Methodology and User Guide. Available online at: https://www.ars.usda.gov/ARSUserFiles/80400530/pdf/fped/FPED_1718.pdf (accessed February 5, 2021).
Brellenthin, A. G., Lanningham-Foster, L. M., Kohut, M. L., Li, Y., Church, T. S., Blair, S. N., et al. (2019). Comparison of the Cardiovascular Benefits of Resistance, Aerobic, and Combined Exercise (CardioRACE): Rationale, design, and methods. Am. Heart. J. 217, 101–111. doi: 10.1016/j.ahj.2019.08.008
Carnegie Mellon University (2018). Economic Input-Output Life Cycle Assessment. Available online at: http://www.eiolca.net/(accessed June 12, 2020).
Climatarian (2022). Eating Climatarian. Available online at: https://climatarian.com/eating-climatarian/ (accessed September 9, 2022).
Clune, S., Crossin, E., and Verghese, K. (2017). Systematic review of greenhouse gas emissions for different fresh food categories. J. Clean. Prod. 140, 766–783. doi: 10.1016/j.jclepro.2016.04.082
Conrad, Z., Niles, M. T., Neher, D. A., Roy, E. D., Tichenor, N. E., Jahns, L., et al. (2018). Relationship between food waste, diet quality, and environmental sustainability. PLoS ONE 13, e0195405. doi: 10.1371/journal.pone.0195405
Cotton, P. A., Subar, A. F., Friday, J. E., and Cook, A. (2004). (2004). Dietary sources of nutrients amount US adults, 1994 to 1996. J. Am. Diet. Assoc. 104, 921-930., 019. doi: 10.1016/j.jada.2004.03.019
Daniel, C. R., Cross, A. J., Koebnick, C., and Sinha, R. (2011). Trends in meat consumption in the USA. Public Health Nutr. 14, 575–583. doi: 10.1017/S1368980010002077
Darmon, N., and Drewnowski, A. (2015). Contribution of food prices and diet cost to socioeconomic disparities in diet quality and health: a systematic review and analysis. Nutr. Rev. 73, 643–660. doi: 10.1093/nutrit/nuv027
Ettienne-Gittens, R., Boushey, C. J., Au, D., Murphy, S. P., Lim, U., Wilkens, L., et al. (2013). Evaluating the feasibility of utilizing the Automated Self-Administered 24-hour (ASA24) dietary recall in a sample of multiethnic older adults. Procedia Food Sci. 2, 134–144. doi: 10.1016/j.profoo.2013.04.021
Fehrenbach, K. S., Righter, A. C., and Santo, R. E. (2016). A critical examination of the available data sources for estimating meat and protein consumption in the USA. Public Health Nutr. 19, 1358–1367. doi: 10.1017/S1368980015003055
Fresán, U., Errendal, S., and Craig, W. J. (2020). Influence of the socio-cultural environment and external factors in following plant-based diets. Sustainability 12, 9093. doi: 10.3390/su12219093
Hartle, J. C., Navas-Acien, A., and Lawrence, R. S. (2016). (2016). The consumption of canned food and beverages and urinary Bisphenol A concentrations in NHANES 2003-2008. Environ. Res. 150, 375-382., 008. doi: 10.1016/j.envres.2016.06.008
Hausfather, Z. (2009). Understanding Carbon Dioxide Equivalence. Available online at: https://yaleclimateconnections.org/2009/01/common-climate-misconceptions-co-equivalence/ (accessed April 19, 2021).
Heer, M. M., and Winham, D. M. (2020). Bean preferences vary by acculturation level amoung Latinas and by ethnicity with non-Hispanic white women. Int. J. Environ. Res. Public Health 17, 2100. doi: 10.3390/ijerph17062100
Heller, M. C., Willits-Smith, A., Meyer, R., Keoleian, G. A., and Rose, D. (2018). Greenhouse gas emissions and energy use associated with production of individual self-selected US diets. Environ. Res. Lett. 13, 044004. doi: 10.1088/1748-9326/aab0ac
Hitaj, C., Rehkamp, S., Canning, P., and Peters, C. J. (2019). Greenhouse gas emissions in the United States food system: Current and healthy diet scenarios. Environ. Sci. Technol. 53, 5493–5503. doi: 10.1021/acs.est.8b06828
Huth, P. J., Fulgoni, V. L., Keast, D. R., Park, K., and Auestad, N. (2013). Major food sources of calories, added sugars, and saturated fat and their contribution to essential nutrient intakes in the U.S. diet: Data from the National Health and Nutrition Examination Survey (2003-2006). Nutr. J. 12, 1–10. doi: 10.1186/1475-2891-12-116
Jenab, M., Sabaté, J., Slimani, N., Ferrari, P., Mazuir, M., Casagrande, C., et al. (2006). Consumption and portion sizes of tree nuts, peanuts and seeds in the European Prospective Investigation into Cancer and Nutrition (EPIC) cohorts from 10 European countries. Br. J. Nutr. 96, S12–S23. doi: 10.1017/BJN20061859
King, J. C., Blumberg, J., Ingwersen, L., Jenab, M., and Tucker, K. L. (2008). Tree nuts and peanuts as components of a healthy diet. J. Nutr. 138, 1736–1740. doi: 10.1093/jn/138.9.1736S
Kling, N. R. (2021). Greenhouse gases, land use, and water withdrawals associated with protein foods within the Dietary Approaches to Stop Hypertension. [master's thesis] [Ames (IA)]: Iowa State University
Lea, E., and Worsley, A. (2003). Benefits and barriers to the consumption of a vegetarian diet in Australia. Public Health Nutr. 6, 505–511. doi: 10.1079/PHN2002452
Mekonnen, M. M., and Fulton, J. (2018). The effect of diet changes and food loss reduction in reducing the water footprint of an average American. Water Int. 43, 860–870. doi: 10.1080/02508060.2018.1515571
Mekonnen, M. M., and Hoekstra, A. Y. (2012). A global assessment of the water footprint of farm animal products. Ecosystems 15, 401–415. doi: 10.1007/s10021-011-9517-8
Mellen, P. B., Gao, S. K., Vitolins, M. Z., and Goff, D. C. (2008). Deteriorating dietary habits among adults with hypertension: DASH dietary accordance, NHANES 1988-1994 and 1999-2004. Arch. Intern. Med. 168, 308–314. doi: 10.1001/archinternmed.2007.119
Monsivais, P., Scarborough, P., Lloyd, T., Mizdrak, A., Luben, R., Mulligan, A. A., et al. (2015). Greater accordance with the Dietary Approaches to Stop Hypertension dietary pattern is associated with lower diet-related greenhouse gas production but higher dietary costs in the United Kingdom. Am. J. Clin. Nutr. 102, 138–145. doi: 10.3945/ajcn.114.090639
National Oceanic Atmospheric Administration. (2020). Fisheries of the United States 2018. Available online at: https://www.fisheries.noaa.gov/national/commercial-fishing/fisheries-united-states-2018 (accessed February 16, 2021.).
Nicklas, T. A., O'Neil, C. E., Zanovec, M., Keast, D. R., and Fulgoni, I. I. I. (2012). Contribution of beef consumption to nutrient intake, diet quality, and food patterns in the diets of the US population. Meat Sci. 90, 152–8. doi: 10.1016/j.meatsci.2011.06.021
NIH National Cancer Institute (2022). Comparison of ASA24 Versions. https://epi.grants.cancer.gov/asa24/comparison.html
NIH National Cancer Institute (2023). Automated Self-Administered 24-Hour (ASA24) Dietary Assessment Tool. Available online at: https://epi.grants.cancer.gov/asa24/
NIH National Heart Lung Blood Institute. (2021). DASH Eating Plan. https://www.nhlbi.nih.gov/health-topics/dash-eating-plan (accessed October 18, 2020.).
O'Neil, C. E., Keast, D. R., Fulgoni, V. L., and Nicklas, T. A. (2012). Food sources of energy and nutrients among adults in the US: NHANES 2003-2006. Nutrients 4, 2097–2120. doi: 10.3390/nu4122097
Pan, A., Sun, Q., Bernstein, A. M., Schulze, M. B., Manson, J. A. E., Stampfer, M. J., et al. (2012). Red meat consumption and mortality: Results from 2 prospective cohort studies. Arch. Intern Med. 172, 555–563. doi: 10.1001/archinternmed.2011.2287
Peters, C. J., Picardy, J., Darrouzet-Nardi, A. F., Wilkins, J. L., Griffin, T. S., Fick, G. W., et al. (2016). Carrying capacity of U.S. agricultural land: Ten diet scenarios. Elementa 4, 116 doi: 10.12952/journal.elementa.000116
Pohjolainen, P., Vinnari, M., and Jokinen, P. (2015). Consumers' perceived barriers to following a plant-based diet. Br. Food. J. 117, 1150–1167. doi: 10.1108/BFJ-09-2013-0252
Reinhardt, S. L., Boehm, R., Blackstone, N. T., El-Abbadi, N. H., McNally Brandow, J. S., Taylor, S. F., et al. (2020). Systematic review of dietary patterns and sustainability in the United States. Adv. Nutr. 11, 1016–1031. doi: 10.1093/advances/nmaa026
Rohrmann, S., Overvad, K., Bueno-de-Mesquita, H. B., Jakobsen, M. U., Egeberg, R., Tjønneland, A., et al. (2013). Meat consumption and mortality - Results from the European Prospective Investigation into Cancer and Nutrition. BMC Med. 11, 1–12. doi: 10.1186/1741-7015-11-63
Rose, D., Heller, M. C., Willits-Smith, A. M., and Meyer, R. J. (2019). Carbon footprint of self-selected US diets: Nutritional, demographic, and behavioral correlates. Am. J. Clin. Nutr. 109, 526–534. doi: 10.1093/ajcn/nqy327
Sabaté, J., Sranacharoenpong, K., Harwatt, H., Wien, M., and Soret, S. (2015). The environmental cost of protein food choices. Public Health Nutr. 18, 2067–2073. doi: 10.1017/S1368980014002377
Sacks, F. M., Svetkey, L. P., Vollmer, W. M., Appel, L. J., Bray, G. A., Harsha, D., et al. (2001). Effects on blood pressure of reduced dietary sodium and the dietary approaches to stop hypertension (DASH) diet. N. Engl. J. Med. 344, 3–10. doi: 10.1056/NEJM200101043440101
Swinburn, B. A., Kraak, V. I., Allender, S., Atkins, V. J., Baker, P. I., Bogard, J. R., et al. (2019). The global syndemic of obesity, undernutrition, and climate change: the lancet commission report. Lancet 393173, 791–846. doi: 10.1016/S0140-6736(18)32822-8
Tom, M. S., Fischbeck, P. S., and Hendrickson, C. T. (2016). Energy use, blue water footprint, and greenhouse gas emissions for current food consumption patterns and dietary recommendations in the US. Environ. Syst. Decis. 36, 92–103. doi: 10.1007/s10669-015-9577-y
U.S. Bureau of Labor Statistics (2021). Consumer Price Index. Available online at: https://www.bls.gov/cpi/home.htm (accessed April 16, 2021.).
U.S. Department of Agriculture U.S. Department of Health Human Services (2020). Dietary Guidelines for Americans, 2020-2025, 9th. Edition. Available online at: DietaryGuidelines.gov (accessed September 9, 2022).
United States Environmental Protection Agency (2018). Land Use. Available online at: https://www.epa.gov/report-environment/land-use (accessed April 26, 2021).
United States Environmental Protection Agency (2021). Overview of Greenhouse Gases. Available online at: https://www.epa.gov/ghgemissions/overview-greenhouse-gases (accessed April 19, 2021).
USDA Economic Research Service (2016). Peanut butter accounts for 60% of U.S. peanut availability. Available online at: https://www.ers.usda.gov/data-products/chart-gallery/gallery/chart-detail/?chartId=78829 (accessed December 18, 2020).
USDA Economic Research Service (2020). Quarterly Food-at-Home Price Database. Available online at: https://www.ers.usda.gov/data-products/quarterly-food-at-home-price-database/ (accessed April 30, 2021).
USDA National Agricultural Statistics Service (2020). Noncitrus Fruits and Nuts 2019 Summary. Available online at: https://downloads.usda.library.cornell.edu/usda-esmis/files/zs25x846c/0g3551329/qj72pt50f/ncit0520.pdf (accessed January 1, 2021).
van de Kamp, M. E., van Dooren, C., Hollander, A., Geurts, M., Brink, E. J., van Rossum, C., et al. (2018). Healthy diets with reduced environmental impact? – The greenhouse gas emissions of various diets adhering to the Dutch food based dietary guidelines. Food Res. Int. 104, 14–24. doi: 10.1016/j.foodres.2017.06.006
Water Footprint Calculator (2020). Water Use, Withdrawal and Consumption. Available online at: https://www.watercalculator.org/footprint/water-use-withdrawal-consumption/ (accessed September 9, 2022).
Whelton, P. K., Carey, R. M., Aronow, W. S., Casey, D. E., Collins, K. J., and Himmelfarb, C. D. (2018), 2017. ACC/AHA/AAPA/ABC/ACPM/AGS/APhA/ASH/ASPC/NMA/PCNA guideline for the prevention, detection, evaluation, management of high blood pressure in adults: A report of the American College of Cardiology/American Heart Association Task Force on Clinical practice guidelines. Hypertension 71, e13–e115. doi: doi: 10.1161/HYP.00000000000000761.
Willits-Smith, A., Aranda, R., Heller, M. C., and Rose, D. (2020). Addressing the carbon footprint, healthfulness, and costs of self-selected diets in the USA: a population-based cross-sectional study. Lancet Planet. Heal. 4, e98–e106. doi: 10.1016/S2542-5196(20)30055-3
Wilson, N., Cleghorn, C. L., Cobiac, L. J., Mizdrak, A., and Nghiem, N. (2019). Achieving healthy and sustainable diets: A review of the results of recent mathematical optimization studies. Adv Nutr. 10, S389–S403. doi: 10.1093/advances/nmz037
Keywords: DASH diet, diet quality, sustainable diets, life cycle assessments, greenhouse gases, water withdrawals, water, land use
Citation: Kling NR, Rosentrater KA, Lee DC, Brellenthin AG and Lanningham-Foster L (2023) Higher adherence to the Dietary Approaches to Stop Hypertension (DASH Diet) is associated with lower greenhouse gases and land use from protein foods. Front. Sustain. Food Syst. 7:1145272. doi: 10.3389/fsufs.2023.1145272
Received: 15 January 2023; Accepted: 23 May 2023;
Published: 14 June 2023.
Edited by:
Alice Rosi, University of Parma, ItalyReviewed by:
Aida Turrini, Independent Researcher, Scansano, ItalyAnnalisa Giosuè, Federico II University Hospital, Italy
Copyright © 2023 Kling, Rosentrater, Lee, Brellenthin and Lanningham-Foster. This is an open-access article distributed under the terms of the Creative Commons Attribution License (CC BY). The use, distribution or reproduction in other forums is permitted, provided the original author(s) and the copyright owner(s) are credited and that the original publication in this journal is cited, in accordance with accepted academic practice. No use, distribution or reproduction is permitted which does not comply with these terms.
*Correspondence: Lorraine Lanningham-Foster, bG1sZkBpYXN0YXRlLmVkdQ==
 Nicole R. Kling
 Kurt A. Rosentrater
 Duck-Chul Lee3
 Angelique G. Brellenthin
 Lorraine Lanningham-Foster