 Ikhlas Ghiat
 Rajesh Govindan
 Tareq Al-Ansari
- College of Science and Engineering, Hamad Bin Khalifa University, Qatar Foundation, Doha, Qatar
Evapotranspiration is considered as one of the most crucial surface fluxes describing the water movement from the land to the atmosphere in the form of evaporation from the soil and transpiration from plants. Several evapotranspiration models exist, but their accuracy is subject to change because of the differences between the underlying assumptions used in their formulation and the conditions of the application at hand. The appropriate selection of an evapotranspiration model is necessary to ensure the accurate estimation of crop water requirements. This work compares between 20 different evapotranspiration models for the estimation of transpiration of cucumber crops grown in a cooling-based greenhouse with CO2 enrichment located in a high solar radiation region. The models are classified into temperature-based, radiation-based, mass transfer-based, and combination models. These models are assessed against direct gas exchange measurements in a greenhouse with cucumber crops. The performance of the models is evaluated using nine statistical indicators to determine the most suitable models for the application under study. Results demonstrate that among the temperature-based models, Schendel and Blaney and Criddle models resulted in the best transpiration prediction, contrary to Hargreaves and Samani which presented the worst performance. Transpiration estimates from Rohwer were the closest and that of Trabert were the furthest to the measured data amongst the other mass-transfer based models. The Abtew model was the best transpiration predicting model, while Priestley and Taylor exhibited the worst performance in the radiation-based model category. The combination-based FAO56 Penman Monteith entailed the best performance among all models and can be considered the best suitable method to estimate transpiration for cucumber crops grown in CO2 enriched and HVAC based greenhouses located in high solar radiation regions. Nonetheless, the parametrization of this model is still crucial and should be considered to achieve better estimates and accurately evaluate the effect of high solar radiation, CO2 enrichment and HVAC cooling for this agricultural greenhouse application.
1. Introduction
Limited water resources causes one of the most critical abiotic stresses on agricultural systems which renders their photosynthetic activity (Osakabe et al., 2014). Accurate irrigation water management is essential to avoid these stresses and optimize the water use efficiency (WUE). The insufficiency of water resources in regions of the world such as hyper-arid ones further entails accurate and reliable irrigation water management (Lahlou et al., 2022). Agricultural greenhouse systems have been widely used in regions where climate conditions are unfavorable. These systems allow close control of the microclimate which protect the crops from external climatic threats, optimize their growing conditions, and improve the systems' yields and performance. The optimal growing conditions in greenhouses allow to achieve higher water use efficiencies (WUE) with magnitudes of 3–10 times higher than open fields (Katsoulas and Stanghellini, 2019). Particularly in hyper-arid regions with high solar radiation, greenhouse systems with cooling technologies have proved their applicability in facing the high air temperature and humidity conditions. The simplest and most affordable cooling technique in greenhouses is natural ventilation. However, this latter is not always sufficient to eliminate the necessary surplus heat for healthy plant growth in very hot regions and during hot periods of the year. Evaporative cooling can counteract this problem and offer better temperature control than natural ventilation. The mechanism of evaporative cooling lies in the conversion of the sensible heat to the latent heat necessary to evaporate the supplied water (Villarreal-Guerrero et al., 2012). However, this cooling system has limitations in humid climates. The occurrence of high humidity levels can lead to the risk of water condensation at the leaf level which can cause fungal and bacterial diseases (Soussi et al., 2022). Moreover, with high temperature and humidity levels, the wet-bulb temperature increases which reduces the evaporative cooling process (Mahmood and Al-Ansari, 2022). For example, Sabeh et al. (2011) found that the use of evaporative cooling systems in a semi-arid climate-based greenhouse leads to water use efficiency (WUE) reductions as low as those achieved in open field applications. Heating, ventilation and air conditioning (HVAC) are temperature control systems with higher efficiencies than the other mentioned cooling systems; however, they hold large energy requirements and hence high operating costs (Mahmood et al., 2021). Additional agricultural practices have been adopted for these regions to further enhance the systems' performance including hydroponics which can eliminate the evaporation from the soil and the CO2 enrichment practice which can reduce transpiration from the plants and increase yields (Jensen Merle, 1997; Ghiat et al., 2021b).
Evapotranspiration is a key parameter in irrigation water management as it determines the proper water input required by the plants (Cruz-Blanco et al., 2014). Evapotranspiration from agricultural systems is considered as the second largest component of the hydrological cycle and it combines evaporation from the soil and transpiration from the plants (Łabedzki et al., 2011; Mondal et al., 2022). Evapotranspiration can be estimated using different techniques including weighing lysimeters, eddy covariance, and gas exchange systems. However, limitations remain for these systems due their complexity, extensive labor work and high acquisition costs. Therefore, physical-based mathematical models are widely used for estimating ET rates based on climatological data (Ghiat et al., 2021a). The quantification of crop evapotranspiration (ETc) requires prior determination of reference evapotranspiration (ET0) which represents the evapotranspiration rate of a uniform grass under well-watered conditions (Allen et al., 1998; Tabari and Talaee, 2011). These models involve multiplying ET0 by specific crop coefficients (Kc) that represent crop characteristics to distinguish different crops from the grass reference and estimate the crop evapotranspiration (Akhavan et al., 2019). Allen et al. (1998) proposed two different approaches for determining crop coefficients; the single and the dual crop coefficients. The single crop coefficient approach involves the combination of the effects of both transpiration and evaporation into one coefficient while the dual-crop coefficient method represents these effects in two separate coefficients; the basal crop coefficient (Kcb) for transpiration and the soil water evaporation coefficient (Ke). The basal crop coefficient provides better estimates as it can involve the effects of wetting by precipitation or irrigation; however, the single crop coefficient approach is widely used owing to its simplicity. The crop coefficients are tabulated by crop type and growing stage. These coefficients involved four main crop characteristics in their formulation including crop height, albedo of the crop surface, canopy resistance and soil evaporation (Allen et al., 1998). Several models have been proposed for ET0 estimation which can be classified into temperature-based, radiation-based, mass transfer-based and combination models (Vishwakarma et al., 2022). The FAO56 Penman Monteith (PM) model is considered as the most common approach which uses widely available meteorological data such as air temperature, humidity and solar radiation to estimate ET0. The Penman Monteith model has been reported to deliver good estimates for ET rates for many applications. However, the involvement of several input data to the model may introduce inaccuracies due to possible cumulative measurement errors (Rahimikhoob et al., 2012). The Penman Monteith model served as the theoretical basis for the development of other ET models with formulation changes and the addition of model or sub-model parametrizations for specific growing environments and crop types (Ershadi et al., 2015). Moreover, the FAO56-PM method can involve large amount of data which can be difficult to acquire for certain regions or applications. Thus, other ET models are available which require less input data such as temperature-based models which only involve temperature measurements, mass-transfer based models which include temperature, relative humidity and wind speed data, and radiation-based models which incorporate radiation measurements (Vishwakarma et al., 2022). However, the accuracy of these models is subject to change because of the differences between the underlying assumptions used in their formulation and the conditions of the application at hand (Muniandy et al., 2016). The aerodynamic and surface resistances represent critical parameters in the PM model which describe the resistance to vapor flow through the stomata. There are several stomatal resistance models such as the Jarvis-Stewart, Ball-Berry, and Stannard. However, their accuracy differs from one application to another (Bao et al., 2022). Moreover, crop resistance models pertaining to greenhouse conditions are lacking (Wang et al., 2021). Stanghellini (1987) proposed a modified PM model by describing the effect of different microclimate conditions on the internal resistance of greenhouse grown plants. The Stanghellini model is based on an empirical relation of the internal resistance under naturally ventilated greenhouse conditions. Hence, further investigation of ET models is needed for controlled microclimate agricultural settings with high technology systems such as HVAC.
Several studies evaluated various ET models and tested their performance for different plant types and climatic conditions. Trajkovic and Kolakovic (2009) compared five ET models including Hargreaves, Thornthwaite, Turc, Priestley Taylor, and Jensen Haise against the FAO56 Penman Monteith model in humid regions. This study concluded that the Turc model was the most reliable as compared to the other models and provided the closest ET estimate to that of the FAO56 PM model for humid regions. The Turc model was the best to adapt to the different humid region conditions and was considered as a suitable alternative to the FAO56 PM model when climatic data are lacking (Trajkovic and Kolakovic, 2009). Under similar climate environments (i.e., humid climate), Tabari et al. (2013) assessed 31 ET models against the FAO56 PM model and found that the temperature-based and radiation-based models had the best estimates while the mass-transfer models exhibited the worst performances. Wu et al. (2022) estimated the evapotranspiration of maize in semi-humid regions by calculating the canopy resistance using the PM model and using it to optimize the Jarvis model and improve the prediction accuracy of the PM model. Other studies have been incorporating stomatal resistance or conductance models into ET models not only to optimize the prediction of ET rates but also to evaluate the integrated ET and stomatal conductance models against other original ET models. For example, Bao et al. (2021) incorporated the Ball-Berry stomatal conductance model with the Shuttleworth-Wallace and PM models and compared their prediction performances in the semi-arid meadow wetland application. Vishwakarma et al. (2022) evaluated 30 various ET models for humid and subtropical climates. Results from this study demonstrated the higher performance of the FAO56 PM and Turc models and their suitability in humid and subtropical regions (Vishwakarma et al., 2022). Bourletsikas et al. (2018) compared 24 ET models against the FAO56 PM model for a forest application in a humid Mediterranean region with findings indicating the outperformance of the combination-based followed by the temperature-based and finally the radiation-based models. Contrary to other studies, Muniandy et al. (2016) revealed the low performance of the FAO56 PM model for two agricultural crops grown in a humid tropic region which was outperformed by the Penman and Rohwer models. Under different climate conditions, Djaman et al. (2019) compared between 35 ET models in semiarid and dry climates and under limited data availability and found that the FAO56 PM model had a good accuracy in predicting ET under only one missing data. However, the model underestimated ET rates in the case of two or more missing climatological data parameters, while other models such as Makkink and Jensen and Haise offered better estimates (Djaman et al., 2019). Akhavan et al. (2019) evaluated 28 ET models against lysimeter measurements to assess the actual ET of corn crops in semiarid environments. Results of this study prove that the FAO56 PM and temperature-based models had the best performances under the single crop coefficient method for estimating ETc from ET0 (Akhavan et al., 2019). López-Urrea et al. (2006) found the FAO56 PM model as the most accurate against lysimeter measurements followed by the Hargreaves model for semiarid climates.
Few studies evaluated ET models and studied their relevance under greenhouse conditions (Jolliet and Bailey, 1992; López-Cruz et al., 2008; Morille et al., 2013). Most studies proved the applicability of the Stanghellini model for estimating crop evapotranspiration in greenhouses under natural ventilation and with no heating systems (Acquah et al., 2018). Villarreal-Guerrero et al. (2012) compared between three ET models for two agricultural crops grown in a greenhouse with natural ventilation and variable high pressure fogging cooling system. This study suggested that any of the three evaluated models including Penman-Monteith, Stanghellini and Takura could be used for similar greenhouse applications (Villarreal-Guerrero et al., 2012). Yan et al. (2020) parametrized the Stanghellini model for cucumber crops and evaluated its performance. This work demonstrated that the Stanghellini model overestimated the transpiration from cucumber plants during the day when the microclimate data were measured at 1 m and 1.8 m, while the model underestimated transpiration when microclimate data was collected at 0.5 m above the ground.
The wide selection of evapotranspiration models and the different types of data needed makes it difficult to choose the appropriate model for a specific climate and growing environment. There is a lack of studies that evaluate the different ET0 models for the estimation of transpiration in agricultural greenhouse settings located in high solar radiation regions which are faced to high ambient temperatures and high solar radiation. Therefore, this study aims at filling this gap by comparing 20 ET0 models for the estimation of transpiration in a greenhouse located in a high solar radiation region and evaluating their performance against direct transpiration measurements using statistical indicators. The objective of this work is to conduct a comparative evaluation of ET0 models and test their accuracy for estimating transpiration in agricultural greenhouse systems with HVAC and CO2 enriched environments located in high solar radiation regions. This is important when physiological parameters such as stomatal and aerodynamic resistances are not available and only full or partial microclimatic parameters are present. The existing transpiration models such as the Ball-Berry, Jarvis, Penman Monteith, Shuttleworth-Wallace models require physiological parameters such as stomatal conductance, boundary layer conductance and leaf area index which cannot be easily acquired. Thus, this study aims at evaluating the use of ET0 empirical and mechanistic models for transpiration prediction in greenhouses under high solar radiation.
2. Materials and methods
2.1. Experimental site
This study takes place in a water-saving agricultural greenhouse with CO2 enrichment in the hyper-arid region of the State of Qatar. The glass-based greenhouse is characterized by a net growing area of 715 m2 and encompasses a microclimate management system with heating, ventilation and air conditioning (HVAC) for enhanced growing conditions of vegetable crops. The unfavorable Qatari climate conditions during most of the year imposes the implementation of a greenhouse-controlled microclimate system to lower the negative impacts of the external environment and reduce the consumption of resources. The microclimate of the greenhouse is controlled for optimal operations, based on established agricultural best practices. The desired temperature and humidity inside the greenhouse are set at ~26°C and 80% during the day and 18°C and 60–70% at night. For this, a semi-closed system was put in place involving a heating, ventilation, and air conditioning (HVAC) system. The air inside the greenhouse is recovered, cooled, and dehumidified, and recirculated back without exchange with outside air. The air is cooled in three air handling unit (AHU), with cooling supplied by a 600 kW capacity water chiller. The hot and humid air is extracted through three ducts at the top of the greenhouse each connected to an AHU, and the cooled and dehumidified air was sent back to the greenhouse through 15 flexible ducts. The conditioned air supplying ducts are positioned under each crop gutter line which provides a more uniform distribution of the air inside the greenhouse.
CO2 enrichment is supplied to the greenhouse by two LPG fed burners, each having a capacity of 11.5 kW and a flowrate up to 2.5 kg/h. With a total area of 800 m2 (net growing area of 715 m2), the two burners can enrich the greenhouse up to 800 ppm at daylight. The burners were located inside the greenhouse and at the same level of the extraction ducts. The CO2 rich and hot air produced from the burners was pulled out through the extraction ducts and supplied to the AHU to be cooled and recirculated back to the greenhouse uniformly via the 15 flexible ducts.
A hydroponic culture was adopted in the greenhouse which has been proven as a promising method that can improve yields and reduce water consumption. The crops were grown in a coco peat substrate to provide a better aeration to roots and water retention. As for the type of crop, cucumbers were chosen in this study because they are heat resistant which makes them an applicable subject of study in a high solar radiation and temperature region like Qatar.
The crop was irrigated using a drip irrigation system, with one dripper per growing bag, while allowing 20–30% of the total irrigation water for drainage. Plants were irrigated throughout the day, with maximum irrigation supply at midday when solar radiation is at its peak and was stopped before sunset to allow drainage at night. Irrigation was controlled through an automatized fertigation system. A nutrient solution was prepared with commercial nitrogen, phosphorus and potassium (NPK) fertilizers and fed to the plants with the objective to maintain the electric conductivity and pH levels of the irrigation water to ~2.7 mS/cm and 5.7, respectively. Nutrient proportions can be found in a study previously conducted by the authors (Ghiat et al., 2022). Moreover, the EC of drained water was continuously monitored not to exceed 1 mS/cm more than the EC of the drip irrigation water, to regulate the EC accordingly and ensure the right level in the drip irrigation water.
2.2. Data collection
Microclimate data including inside temperature, relative humidity, and CO2 concentration were measured via the Hoogendoorn aspirator box which consists of electronic sensors for each parameter. The aspirator box includes a built-in fan that pulls air toward the sensors inside the box. Solar radiation was measured via the Hoogendoorn weather station outside the greenhouse that consists of a pyranometer sensor. Figure 1 illustrates the collected microclimate measurements.
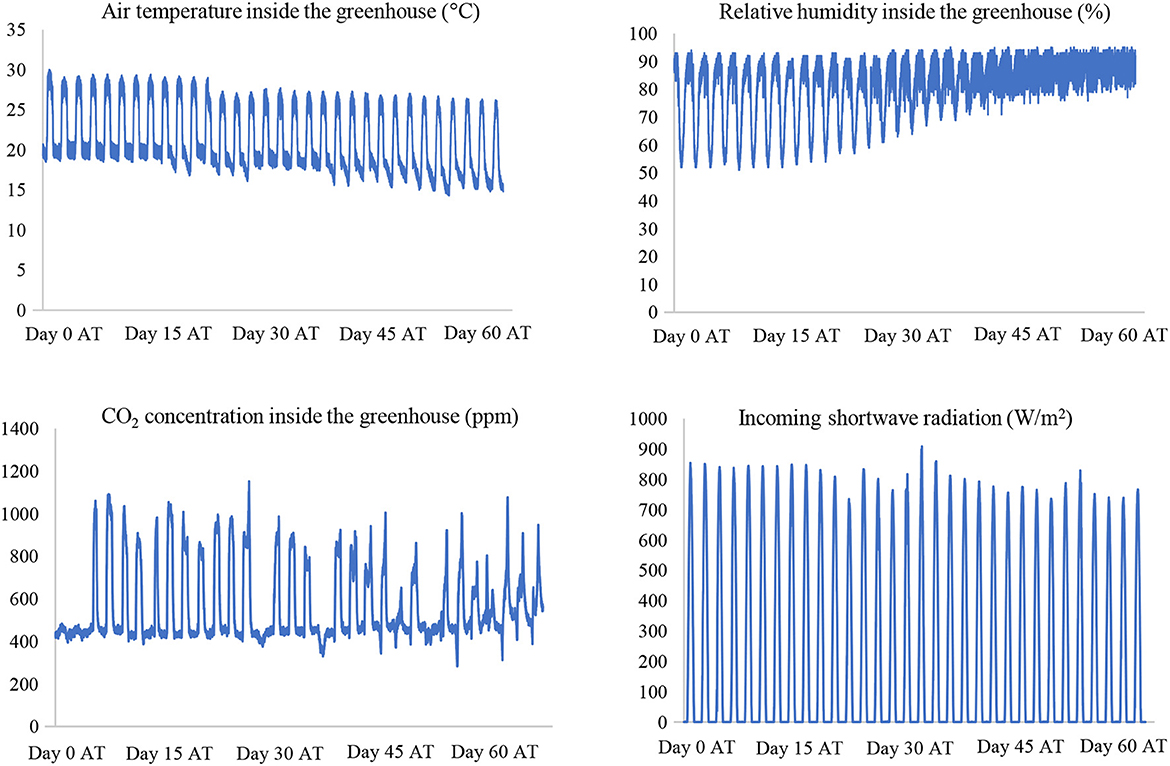
Figure 1. Microclimate data.
A gas exchange measurement system was used to directly measure transpiration at the leaf level. The CIRAS-3 portable photosynthesis system (PP systems) was used to simultaneously measure water vapor and CO2 gas exchanges within the leaf and accordingly calculates the transpiration rate and assimilation rates. The system consists of a true differential analyzer with four infrared gas analyzers (IRGA) that trace gases by evaluating the absorption of infrared sources through a sample gas. The PLC3 leaf cuvette with dimensions of 25 mm × 18 mm was mounted with the photosynthesis system. The cuvette was maintained at a continuous and constant flowrate of 300 cubic centimeter per min, a relative humidity of 75% and the gas exchange was measured on a leaf area of 4.5 cm2. The relative humidity inside the cuvette was controlled with desiccants that condition the air according to the reference specifications entered and the reference CO2 was set to ambient. The gas exchange measurements were conducted on fully developed and sun exposed leaves. Transpiration rates were measured every 2 s throughout the day to achieve a high level of accuracy. The short-term transpiration rates were then cumulated to estimate hourly transpiration. The gas exchange system estimates the transpiration rate by measuring the amount of water vapor in the cuvette as presented in Equation 1.
Where T is the transpiration rate, W is the mass flowrate of air entering the cuvette, ein and eout are respectively the partial pressures of water vapor entering and existing the cuvette and P is the atmospheric pressure.
The gas exchange measurement encompasses a zero-column assembly containing three desiccants which are used for the analyzer zero. The zero-column measurement establishes a baseline reading for the instrument which is used to ensure accurate measurements when the sample gas is flowing through the cuvette. This later corrects for changes that result in calibration drifts and ensures the accuracy of the gas analyzer. The system also involves a differential balance mode that measures the difference between the reference and analysis cells while diverting the reference air through all cells. The differential balance takes place when large changes in CO2 and H2O are detected. Both automatic zero and differential balance modes are set to ensure high accuracy.
The microclimate data was collected every 5 mins (Figure 1), and the gas exchange measurement data collected with a time step of 2 s throughout the day. These data were collected for one growing season of cucumber crops covering 1 month of crop growth and 1 month of production.
2.3. ET0 estimates from empirical and mechanistic models
This study examined 20 reference evapotranspiration (ET0) models for predicting crop transpiration in a cooling-based greenhouse subject to high solar radiation. The evaluated models were classified into four categories corresponding to the required input: temperature-based, radiation-based, mass transfer-based, and combination-based models (Figure 2). The ET0 models can also be classified based on the method of parametrization used in their formulation. The parametrization methods include percentage of net radiation, linear function of mean temperature, linear function of mean temperature and temperature difference, and linear function of wind speed (Acquah et al., 2018).
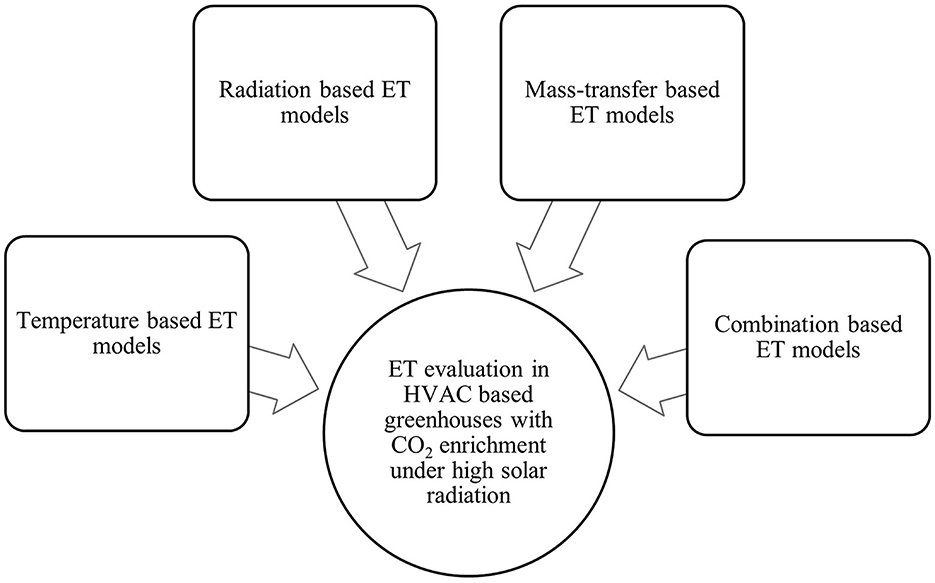
Figure 2. Methodology.
The Ivanov, Schendel, Blaney-Criddle, Kharrufa, Hargreaves and Samani, and Trajkovic were grouped as temperature-based models which all require temperature and a few of them involve relative humidity data as presented in Table 1. The Schendel model of evapotranspiration was formulated by building a relationship with mean temperature and relative humidity (Schendel, 1967). The Blaney-Criddle model was developed by building a correlation between measured evapotranspiration with temperature, daytime hours, the growing season, and precipitation. The model then only involves mean temperature and an empirical coefficient for the estimation of evapotranspiration (Blaney and Criddle, 1962). The Kharrufa model was derived by correlating between the ratio of evapotranspiration and pressure with temperature (Xu and Singh, 2001). The Hargreaves and Samani model was formulated to determine solar radiation (Rs) from extraterrestrial radiation (Ra) and the difference between maximum and minimum temperatures (Subedi and Chávez, 2015).
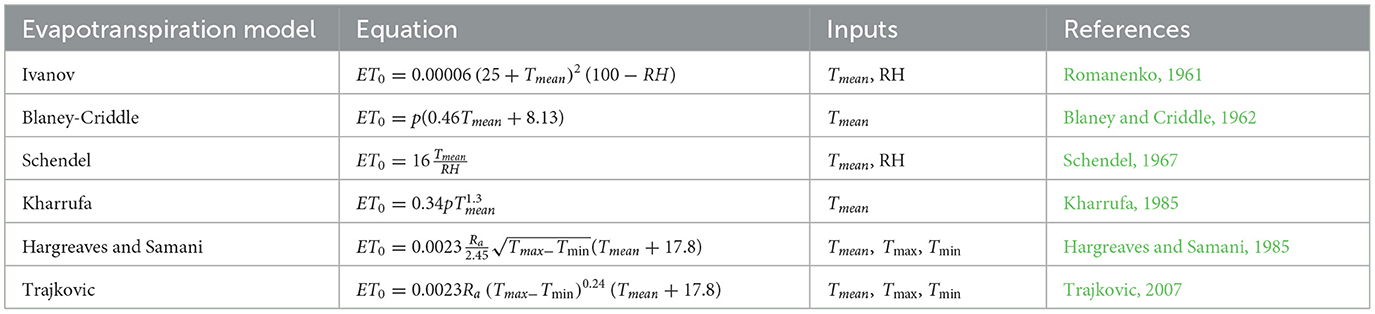
Table 1. Temperature-based ET0 models.
Radiation-based models including Makkink, Turc, Jensen and Haise, Priestley and Taylor, Abtew, and Irmak only require solar radiation or net radiation and mean temperature as input data as displayed in Table 2. The Makkink equation is a modified version of the Penman Monteith equation with reduced input parameters which was formulated using lysimeter measurements (Makkink, 1957). The Jensen and Haise model was built from measured evapotranspiration using soil sampling and has been developed for arid and semiarid regions (Zhang et al., 2017; Rawat et al., 2019). The Priestley Taylor model is a semi-empirical equation that involves a dimensionless coefficient α which replaces the aerodynamic resistance in the original Penman Monteith equation. The coefficient varies depending on the surface type, climatic conditions and growing season (Priestley and Taylor, 1972; Ghiat et al., 2021a). The Irmak model was derived from the FO56 Penman Monteith equation using multilinear regression to reduce the input parameters in the estimation of ET0 (Irmak et al., 2003).
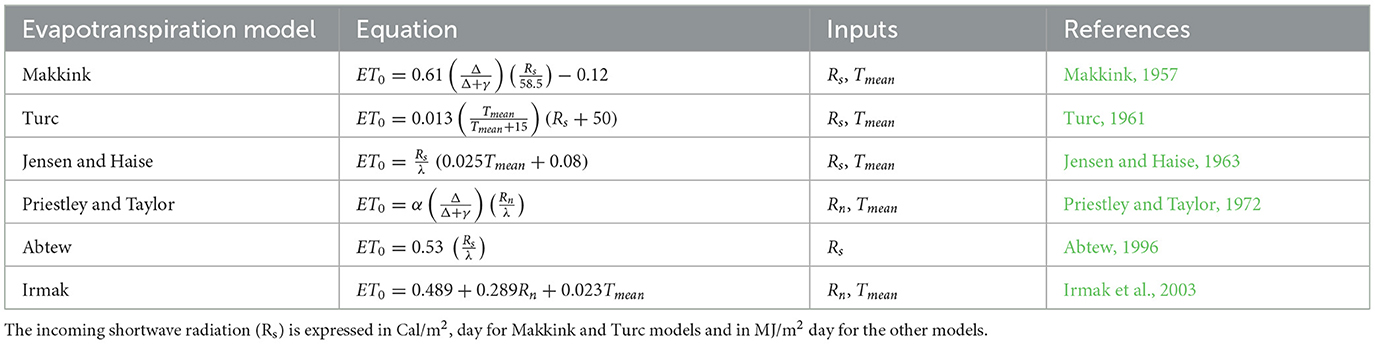
Table 2. Radiation-based ET0 models.
The Dalton, Trabert, Meyer, Rohwer, Penman, and Albrecht were grouped as mass transfer-based modela which involve three major meteorological parameters including temperature, humidity, and wind speed (Table 3). These models are primarily based on Dalton's gas law as expressed in Equation 2 (Singh and Xu, 1997).
Where E0 is the free water surface evaporation and f(u) is the wind function. The vapor pressure deficit (VPD) is the difference between the saturation vapor pressure (es) and actual vapor pressure (ea).
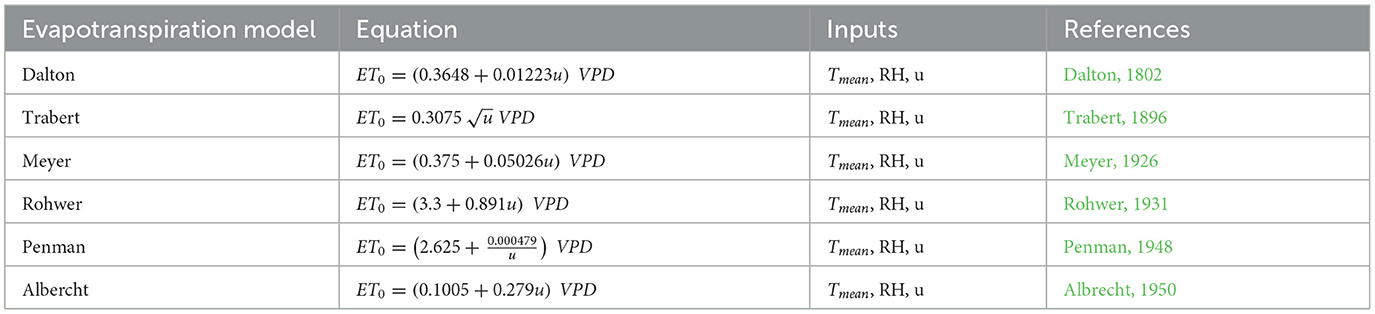
Table 3. Mass-transfer based ET0 models.
The FAO56 Penman Monteith and Stanghellini are combination-based models established on physical laws of energy balance and mass transfer (Table 4). Both models are directly derived from the original Penman Monteith model (Stanghellini, 1987; Allen et al., 1998). The Stanghellini model was mainly derived to accommodate greenhouse environments by involving the leaf area index (LAI) parameter in the formulation and suppressing wind speed. This model principally links the internal resistance to microclimate variables including solar radiation, leaf temperature, CO2 concentration and vapor pressure deficit as expressed in Equations 4–9 (Stanghellini, 1987; Acquah et al., 2018).
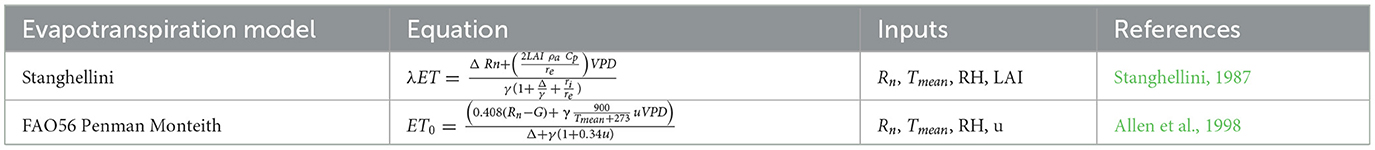
Table 4. Combination-based ET models.
The slope of vapor pressure temperature curve and psychometric constant are expressed in Pa/C for the Stanghellini model and kPa/C for the other models. The net solar radiation Rn is estimated in W/m2 for the Stanghellini model and in MJ/m2 day for the other models.
The Stanghellini model requires the estimation of external and internal resistances. The external (aerodynamic) resistance re can be expressed using the Nusselt (Nu) which is defined using the Grashof (Gr) and Reynolds (Re) numbers as expressed in Equations 3 and 4.
The internal resistance can be estimated through the independent action of all microclimate parameters from the minimum possible resistance rmin as presented in Equation 5. correspond to functions representing the relative increase in transpiration due to microclimate data.
Where is the mean density flux of the shortwave irradiation, As is the coefficient of shortwave radiation, Tm is the temperature corresponding to the minimum possible internal resistance, and C1-C5 are model constants built from empirical relations (Stanghellini, 1987).
The dual crop coefficient method was used for all empirical and mechanistic models to estimate transpiration. Including crop coefficients has been extensively used as a method to estimate actual evapotranspiration when the necessary parameters such as aerodynamic and internal resistances cannot be acquired. Crop coefficients are dimensionless parameters that represent the ratio of the actual evapotranspiration of a specific crop to the reference evapotranspiration of a hypothetical reference crop. The basal crop coefficient values (kcb) are taken from the FAO tabulated data depending on the type of the crop and the growing stage and are adjusted for the relative humidity of the greenhouse (Allen et al., 1998).
2.4. Statistical and performance analyses
A preliminary correlation analysis was conducted to learn about the data measured and determine the microclimate variables that have the most significant effect on the measured transpiration. The studied variables include solar radiation, greenhouse relative humidity, temperature, and CO2 concentration. Pearson's coefficient of correlation (PCC) was used in this analysis as presented in Table 5. The correlation coefficient represents the linear relationship between two variables in which a positive value signifies that an increase in one variable leads to an increase in the other, and a negative coefficient indicates that an increase in one variable is accompanied by a decrease in the other and vice versa.
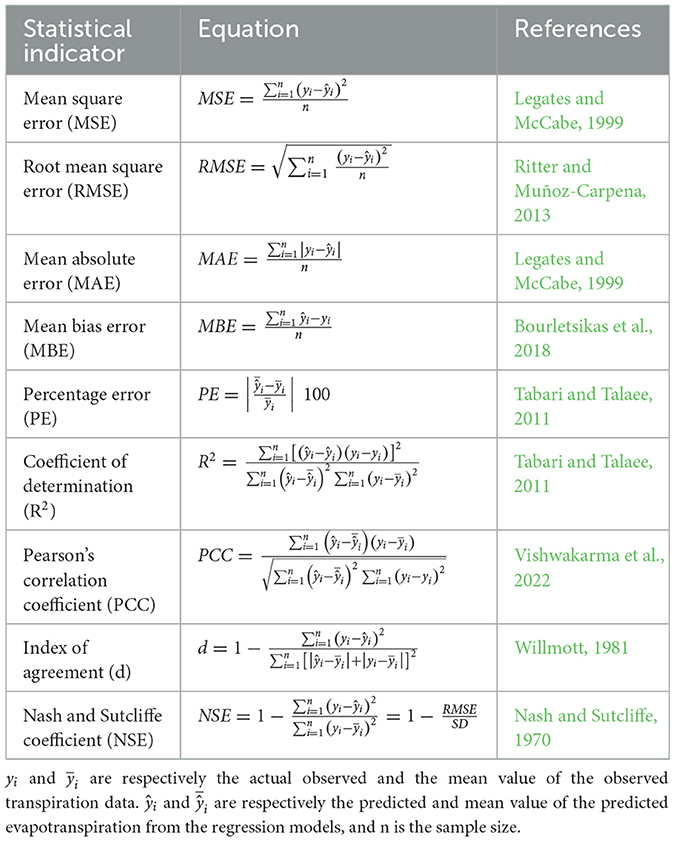
Table 5. Statistical indicators.
Nine statistical indicators were used to compare between the different evapotranspiration models following the recommendation of Legates and McCabe (1999) as presented in Table 5. Correlation-based measures (e.g., R2) are not recommended to be used solely in the evaluation the goodness of fit of hydrological models and should be accompanied with additional indicators. Legates and McCabe (1999) suggests that a good assessment should include at least one absolute error statistic (e.g., RMSE, MAE) and one relative error statistic (i.e., NSE, d). The coefficient of determination (R2) is an indicator that describes the degree of collinearity between the observed and predicted values and can easily be assessed (Ritter and Muñoz-Carpena, 2013). The root mean square error (RMSE), mean absolute error (MAE) and the mean bias error (MBE) are useful indicators that describe the error in the units of the studied variables. Usually, RMSE is greater or equal to MAE, and the degree of the difference between the two indicators represents the presence of outliers in the data (Legates and McCabe, 1999; Akhavan et al., 2019). Lower values of RMSE and MAE indicate more accurate estimates to the observed values. The MBE statistic is useful as it indicates if there is an overestimating or underestimating trend in the predicted values (Akhavan et al., 2019). The Nash and Sutcliffe (NSE) coefficient of efficiency is the most used indicator in the hydrology field to evaluate the goodness of fit of models. However, researchers have indicated that it is sensitive to bias and outliers. The Nash and Sutcliffe (NSE) coefficient of efficiency corresponds to the unity minus the ratio of MSE to the standard deviation and takes values between –∞ and 1. An NSE value of 1 represents a perfect fit, contrary to a value of 0 which indicates that the observed mean is as good as the predicted model, and an NSE value less to 0 implies that the mean of the observed values are better predictors than the model (Ritter and Muñoz-Carpena, 2013). The index of agreement (d) takes into consideration the observed and predicted means and variances which prevails over the bias from correlation-based indicators. The index of agreement has a range between 0 and 1. Large values of the index d indicate good agreement between the observed and modeled data (Legates and McCabe, 1999).
The models with the lowest MSE, RMSE, MAE and MBE along with the largest R2, NSE, and d were selected as the most accurate in predicting transpiration for this application.
3. Results
The correlation coefficient is an important measure which evaluates the strength and direction of the relationship between two variables. Figure 3 revealed that there is a significant correlation of transpiration with greenhouse temperature and outside solar radiation as well as a moderate relationship with relative humidity and CO2 concentration. The strongest correlations were reported between transpiration and solar radiation (0.78) followed by transpiration and greenhouse temperature (0.63). This explains that with high solar radiation and temperature, plants tend to transpire more to cool themselves and balance the heat stress. Moreover, the inverse relationship between transpiration and CO2 (−0.32) is explained by the stomatal closure mechanism due to higher CO2 concentrations in the air which consequently leads to less water loss via transpiration. Similarly, transpiration and relative humidity held an inversely proportional correlation (−0.32) because the higher the humidity in the air, the more the air is close to saturation which limits water loss through transpiration.
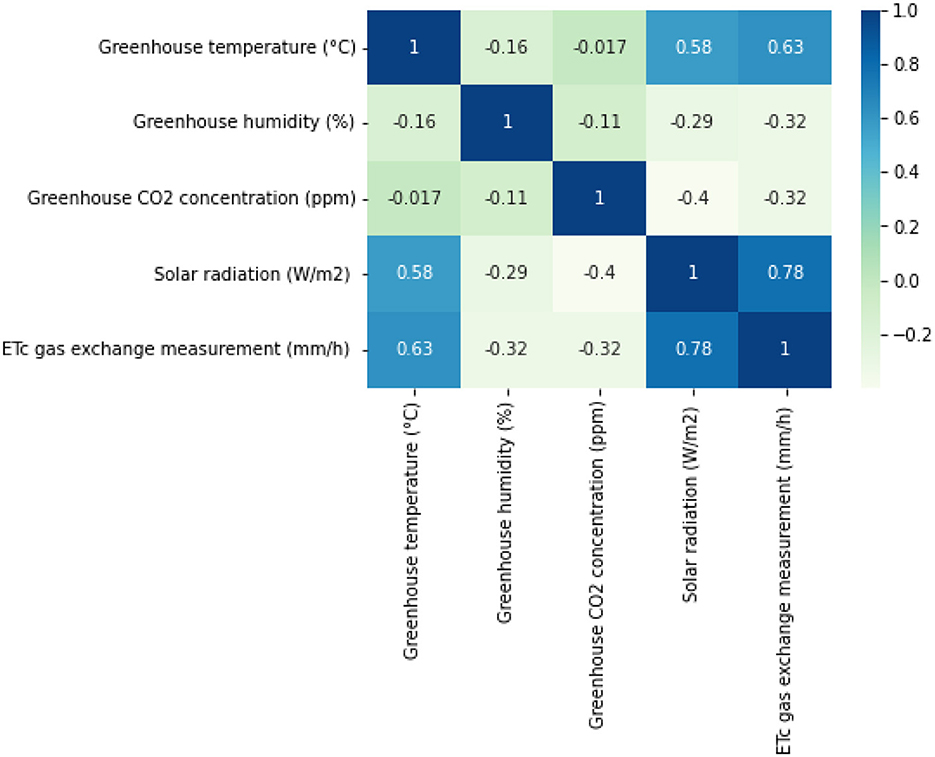
Figure 3. Correlation matrix between different microclimate variables and transpiration.
Microclimate variables also exhibited interesting relationships between each other. Outside solar radiation and greenhouse air temperature displayed a strong positive correlation (0.63). Greenhouse temperature and humidity were inversely proportional (−0.16) because as air temperature increases, its equilibrium vapor pressure increases, and the relative humidity decreases. Greenhouse temperature and CO2 concentration held a small negative correlation (−0.017) which explains that in the presence of light and with higher greenhouse temperature photosynthesis is stimulated which leads to higher CO2 consumption by the plants. Moreover, there was a strong negative correlation between CO2 concentration and solar radiation (−0.4). This implies that with high solar radiation, there is a higher uptake of CO2 by the plants due to photosynthesis activation which reduces the amount of available CO2 in the greenhouse environment.
The transpiration rates of cucumber crops grown in an HVAC cooling based greenhouse were evaluated through different mechanistic and empirical evapotranspiration models. Four ET0 model categories were studied covering combination-based, temperature-based, mass-transfer based and radiation-based models. ET0 model values were compared against direct gas exchange measurements on cucumber leaves in the greenhouse for one growing season. Figure 4 displays the average evapotranspiration estimates from the various studied models and transpiration from the direct gas exchange measurement. The radiation-based Priestley and Taylor model exhibited the largest evapotranspiration value of 1.718 mm/h which was 150% higher than the average measured value. The lowest average ET0 was recorded with the mass-transfer based Trabert model with a value of 0.192 mm/h which was 72% lower than the average gas exchange measured value. In general, all mass transfer-based models exhibited lower average ET0 rates compared to the average direct measurement with an average percentage error (PE) of 38.6%. All the temperature-based models estimated ET0 rates higher than the measured gas exchange value (average PE = 88%) except for Ivanov and Schendel models (average PE = 52.2%). Most radiation-based models resulted in higher average ET0 rates than the gas exchange measurement (average PE = 97.2%) except for Makkink and Turc models (average PE = 37.6%). The combination-based models had the closest average ET0 estimate to the direct measurement, with values 22.7% lower on average. The mass-transfer based Rohwer model exhibited similar average ET0 estimates to the combination-based models, followed by the Dalton model with an average PE of 23.6% from the two models as compared to the gas exchange measured ET0.
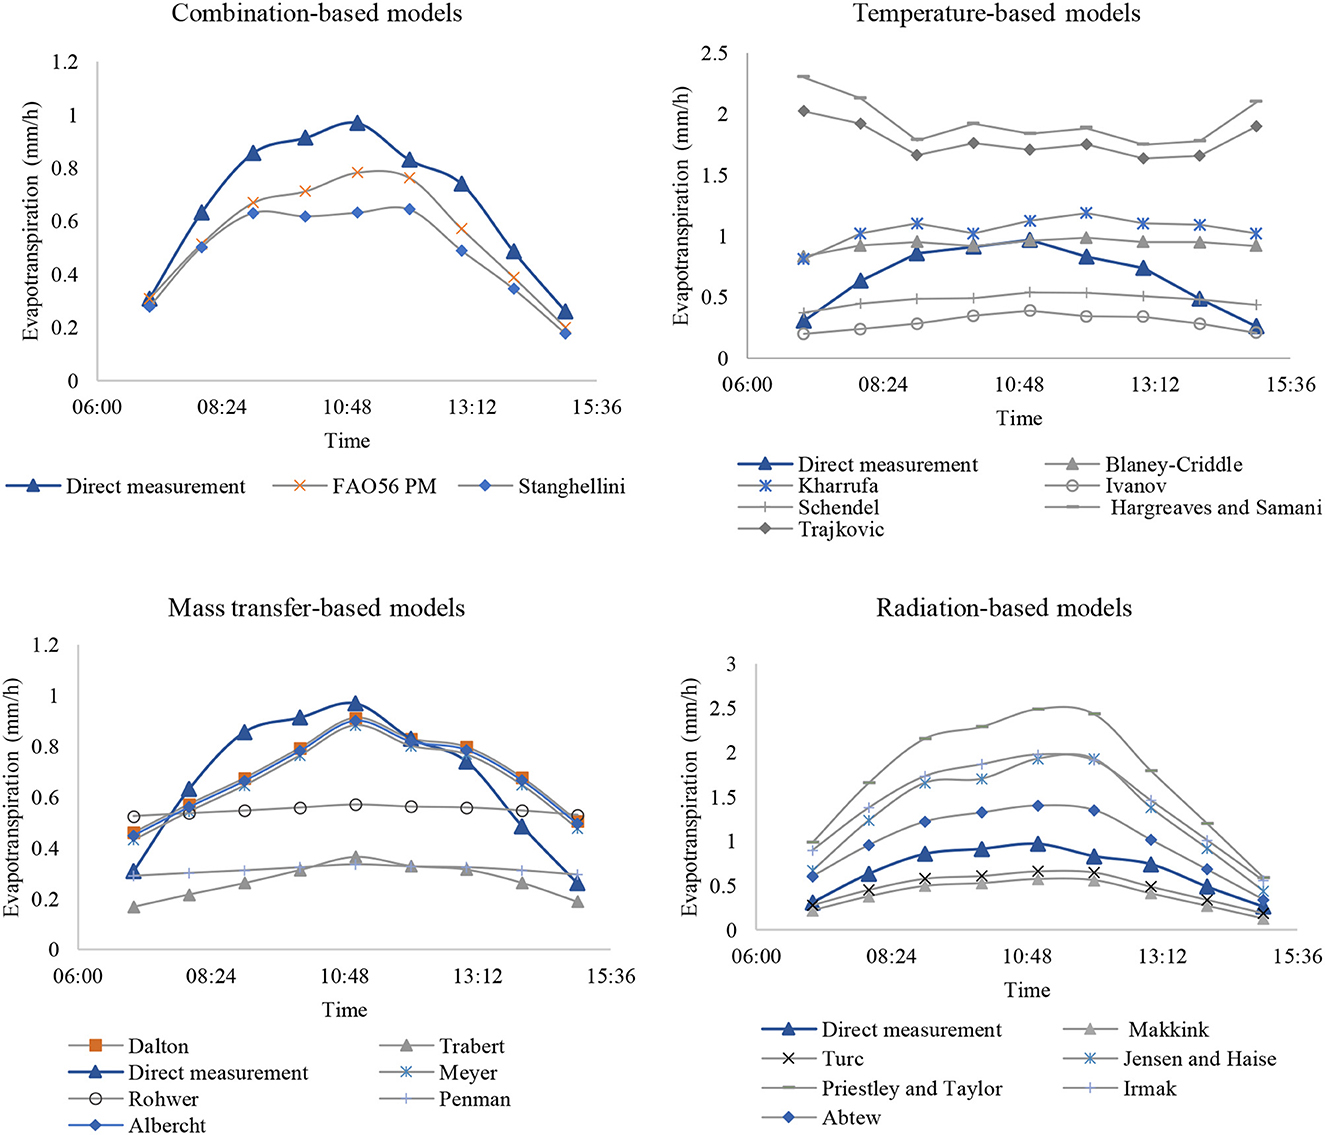
Figure 4. Hourly evapotranspiration evaluated from various ET0 models and transpiration from direct gas exchange measurement.
The evapotranspiration models were plotted against observed gas exchange transpiration data as illustrated in Figure 5. Linear regression lines were built for each ET0 model and were compared with the reference 1:1 line which serves as the best fit. Models with regression lines occurring under the reference line imply that the model underestimates the actual measured data. These include both combination-based models, the temperature-based Ivanov and Schendel models, the Dalton, Trabert, the six mass-transfer based, and the radiation-based Makkink and Turc models. The regression lines for the temperature-based Blaney-Criddle, Kharrufa, Hargreaves and Samani, and Trajkovic models and the radiation-based Jensen and Haise, Priestley and Taylor, Irmak and Abtew models were above the reference line which entails that the models overestimated the observed gas exchange data.
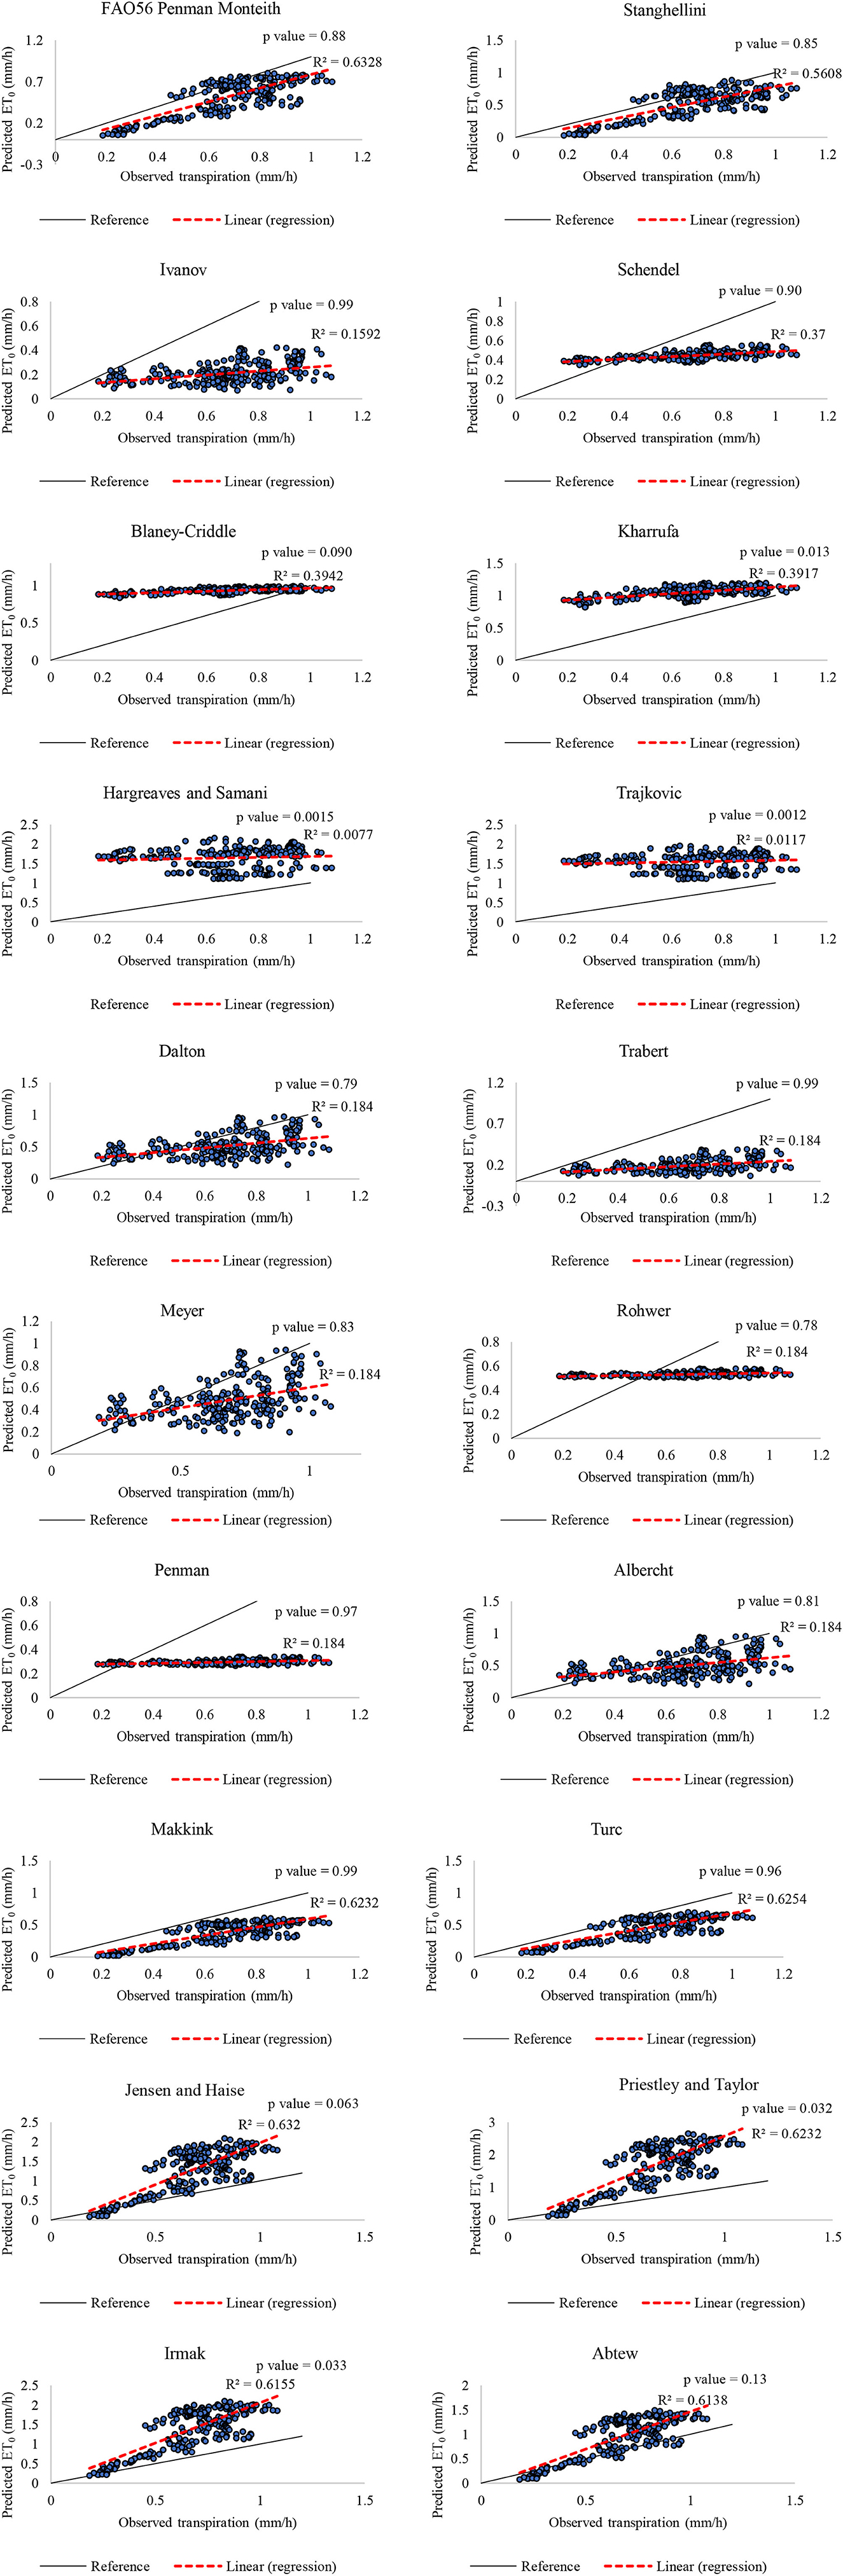
Figure 5. Predicted evapotranspiration against observed transpiration for the different ET0 models.
The 20 ET0 models were evaluated using eight statistical indicators as illustrated in Figure 6. The model(s) with the highest accuracy in predicting the transpiration rate for greenhouse cucumbers should exhibit the lowest values in the error measurements (i.e., MSE, RMSE, MAE, and MBE) and the highest values in the other performance indicators including R2, NSE, PCC, and d.
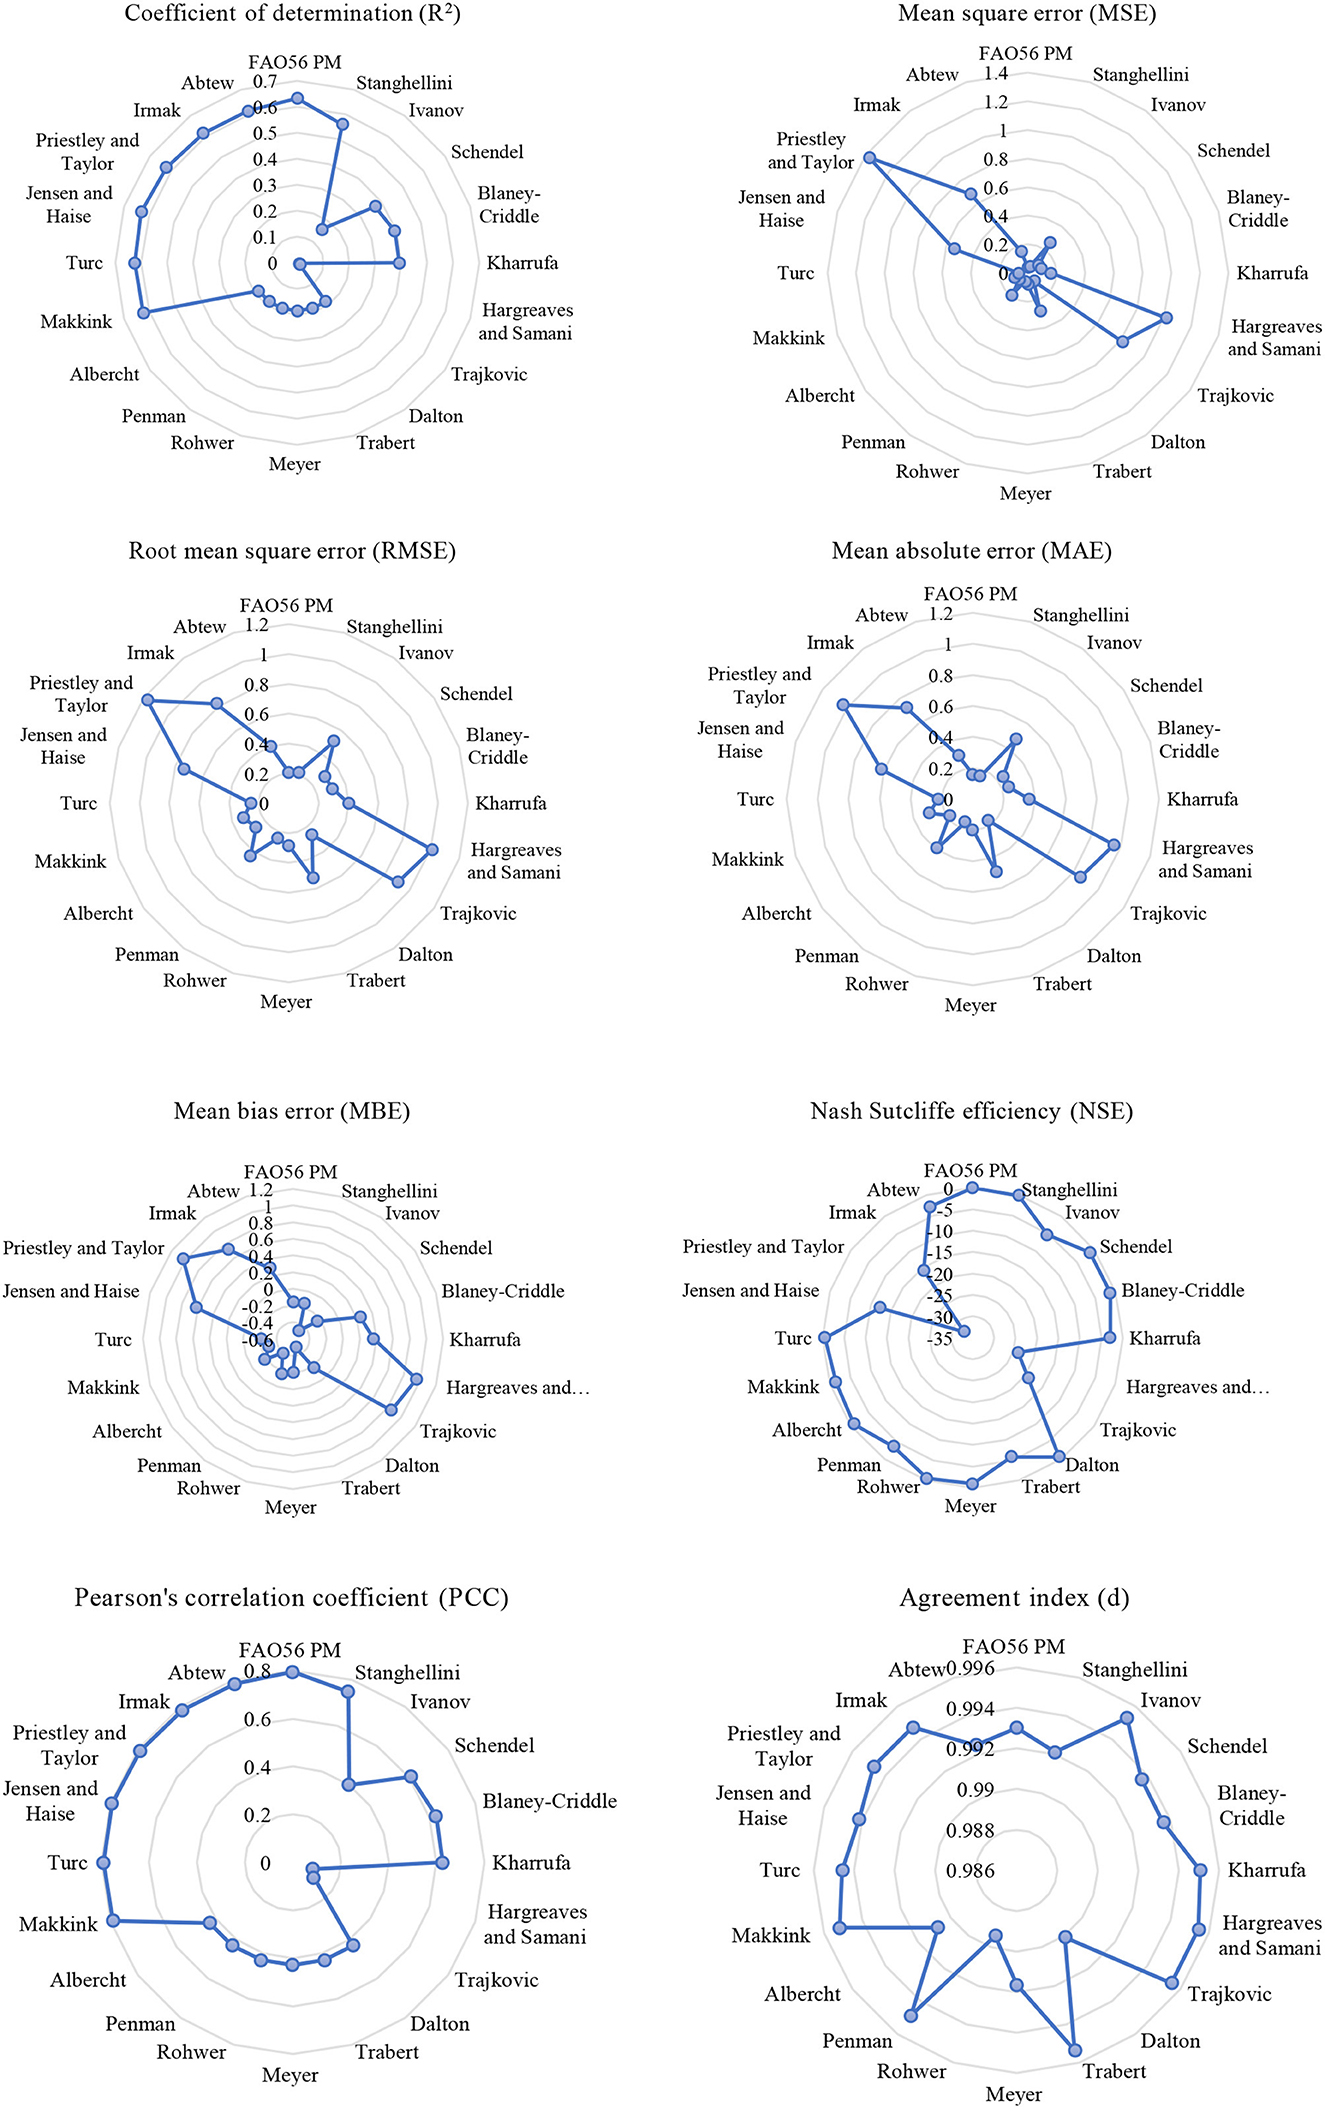
Figure 6. Radar charts for the different statistical indicators.
The FAO56 PM model had the highest R2, explaining 63% of the variability of the gas exchange measurements. The radiation-based models ranked second to seventh with an average R2 of 62%. The Stanghellini model was ranked after the radiation-based models and was able to explain 56% of the changes in the measured data. The temperature-based models held an average R2 of approximately 22% with Hargreaves and Samani and Trajkovic models representing the lowest R2 values amongst all category models. All six mass-transfer based models had similar R2 values of ~18%.
According to RMSE values, the best performing temperature-based model was the Schendel model with a value of 0.3004 mm/h. As for the radiation-based models, the Turc equation delivered the closest predicted values to the observed data with the lowest RMSE value of 0.254 mm/h. The Rohwer model outperformed the other models in the mass-transfer based model category with an RMSE value of 0.249 mm/h. The combination-based models exhibited the lowest RMSE values amongst the other categories, which entails that these models fit best the observed transpiration data. The FAO56 Penman Monteith model ranked first with an RMSE value of 0.205 mm/h, and the Stanghellini model ranked second with an RMSE value of 0.215 mm/h. The third and fourth lowest RMSE values amongst all categories pertain to the mass-transfer based Rohwer model with a value of 0.249 mm/h and the radiation-based Turc model with a value of 0.254 mm/h. Dalton, Albercht, Meyer, Schendel, Blaney-Criddle, Makkink, and Abtew ranked fifth to tenth respectively with RMSE values between 0.264 and 0.398 mm/h. The mass transfer-based models (i.e., Dalton, Albrecht, and Meyer) performed better than the temperature-based models (i.e., Schendel, Blaney-Criddle) which performed better than the radiation-based models (i.e., Makkink and Abtew) according to RMSE. Kharrufa, Penman, Ivanov, Trabert, Jensen and Haise, Irmak, Trajkovic, Hargreaves and Samani, Priestley Taylor ranked twelfth to twentieth respectively with RMSE values between 0.399 and 1.171 mm/h. The Priestley Taylor, Hargreaves and Samani, and Trajkovic models held the highest RMSE values and represent the worst fit to the measured data (between 0.902 and 1.171 mm/h). Thus, RMSE values indicated that the two combination-based models represent best the microclimate conditions of a cooling-based greenhouse under high solar radiation.
Transpiration overestimations and underestimations were revealed through MBE and MAE values. The lowest MBE value representing the largest transpiration underestimation corresponded to the mass-transfer based Trabert model with a value of −0.494 mm/h. The largest overestimation of transpiration related to the largest MBE value of 1.031 mm/h which corresponds to the radiation-based Priestley and Taylor model. Both combination-based models underestimated transpiration with an average MBE value of −0.156 mm/h and an average MAE of 0.156 mm/h, which correspond to the lowest underestimations amongst all models. Moreover, the mass-transfer based Rohwer model also involved a similar underestimation to the combination-based models. Within the temperature-based model category, Ivanov and Schendel underestimated transpiration with an average MBE of −0.358 mm/h, though, Blaney-Criddle, Kharrufa, Hargreaves, and Trajkovic overestimated transpiration with an average MBE and MAE values of 0.606 mm/h. All six mass-transfer based models underestimated transpiration with an average MBE of −0.265 mm/h. As for the radiation-based models, Makkink and Turc underestimated transpiration with average MBE of −0.258 mm/h, however, Jensen and Haise, Priestley Taylor, Irmak and Abtew overestimated transpiration with an average MBE and MAE values of 0.667 mm/h.
The largest NSE values were reported at −0.028 by the FAO56 PM model, followed by the Stanghellini model with a value of −0.132, and the mass-transfer based Rohwer model with a value of −0.522. The FAO56 PM model also resulted in the highest PCC value of 0.795 followed by the six radiation-based models with an average PCC value of 0.788 and the Stanghellini model with a value of 0.748. All models reported index of agreement (d) values close to 0.99 which indicate a good match between predicted and observed data. However, the index of agreement is highly sensitive to extreme values due to the squared differences in the formulation which can also lead to high d value estimates with large errors.
Moreover, the temperature-based models involving mean temperatures (i.e., Ivanov, Schendel, Blaney-Criddle, and Kharrufa) resulted in lower values of MSE, RMSE, MAE, and MBE and higher values of NSE, and PCC and hence deliver better transpiration estimations than the ones with maximum and minimum temperatures (i.e., Hargreaves and Samani, and Trajkovic). This can be explained by the somewhat semi-closed and non-homogeneous environment of the greenhouse as compared to the aerated open field which makes the use of mean microclimate data more accurate then maximum and minimum peak values.
The best mass-transfer based model was Rohwer with the lowest RMSE (0.249), MAE (0.155), MSE (0.062), MBE (−0.155) and highest NSE (−0.522). The Dalton model was the second-best performing model in the mass-transfer based category. On the other hand, the Trabert model displayed the worst performance in predicting transpiration rates with the highest values in error measurements and lowest NSE value amongst the other mass-transfer based models. The comparison among the radiation-based models demonstrates that the Turc model was the best performing model with the lowest RMSE (0.254), MAE (0.221), MSE (0.064), MBE (−0.221) and highest NSE (−0.58) and second highest PCC (0.79). The Priestley and Taylor model yielded the worst performance with the highest error values and the lowest NSE (−32.53).
The comparative results demonstrated that the FAO56 PM model exhibits the best performance against the gas exchange measurements with the lowest MSE (0.042), RMSE (0.205), the second lowest MAE (0.157) and MBE underestimation (−0.157) and the highest R2 (0.632), NSE (−0.028) and PCC (0.795). The Stanghellini model represented the second lowest MSE (0.046) and RMSE (0.215), the lowest MAE (0.155) and MBE underestimation (−0.155) and the second highest NSE (−0.132). This implies that the FAO56 PM simulated the CO2 enriched and HVAC based greenhouse environment better than the Stanghellini model and the other category models. Although the Stanghellini model was developed to accommodate CO2 enriched greenhouse environments, but it was based on a naturally ventilated greenhouse which is different than the application at hand. The HVAC system can induce major differences in microclimate stimulated plant responses as compared to Stanghellini's environment which can explain the discrepancies between Stanghellini's model and the gas exchange transpiration rates.
Results of the inferential statistics analysis reveal that the error between the predicted and observed transpiration was found to be statistically significant, with a p-value < 0.05 for the temperature-based Kharrufa, Hargreaves and Samani, and Trajkovic models along with the radiation-based Priestley and Taylor and Irmak models (Figure 5). These p-values were calculated based on the reference line, which denotes zero error. The low p-values (< 0.05) indicate that there is a significant difference (overestimation) between the predicted and observed values, rendering these models unsuitable for predicting transpiration accurately for this application. The results are consistent with findings from the descriptive statistics where these models were identified as the least performant (with the exception of the Kharrufa model). Moreover, it is worth mentioning that in the case of a one-tailed test, p-values greater than 0.95 indicate a significant underestimation. The Ivanov, Trabert, Penman, Makkink, and Turc models exhibit a p-value exceeding 0.95, which suggests that they may result in a significant underestimation of transpiration. As a result, such models are not suitable for accurately predicting transpiration for this particular application. Furthermore, this highlights the significance of evaluating the accuracy and validity of empirical and mechanistic models in predicting transpiration for different settings. In contrast, the analysis results indicate that the p-value for the error between the predicted and observed transpiration was between 0.05 and 0.95 for all the other models (FAO56 Penman Monteith, Stanghellini, Schendel, Blaney-Criddle, Dalton, Meyer, Rohwer, Albrecht, Jensen and Haise, and Abtew) (Figure 5). This suggests that there is no statistically significant difference between the predicted and observed values, indicating that these models can be used for predicting transpiration for greenhouses under high solar radiation. However, it is essential to note that results of the descriptive statistics are crucial to evaluate and compare the accuracy of the different models for predicting transpiration. Further research is still required to parametrize these models to better predict transpiration for greenhouse applications.
The results obtained from both inferential and descriptive statistics suggest that the Schendel and Blaney-Criddle models based on mean temperatures are the recommended models within the temperature category, with the Schendel model as the most accurate. For the mass transfer category, it is recommended to use the Dalton, Meyer, Rohwer, and Albrecht models, with the Rohwer model being the most accurate among them. For the radiation-based category, it is suggested to use the Jensen and Haise as well as the Abtew models, with the Abtew model being more accurate compared to the Jensen and Haise model. Both combination-based models are recommended for transpiration prediction in greenhouses that are exposed to high solar radiation, with the FAO56 PM model being the most accurate among them.
4. Discussion
Findings of this study align with the results obtained in other comparable studies in similar climates settings, which also showed that the FAO-56 Penman-Monteith method had the highest level of accuracy (López-Cruz et al., 2008). López-Cruz et al. (2008) also demonstrated that for semiarid climates, the Blaney-Criddle method significantly overestimated evapotranspiration, while the Penman method resulted in considerable underestimations as found in this study. Studies in greenhouse settings have shown that, contrary to our findings, the Stanghellini model outperformed the FAO56-PM model. However, this may be attributed to the parametrization and careful estimation of parameters in the Stanghellini model, such as leaf area index and stomatal resistance, which made the model more applicable (López-Urrea et al., 2006; Acquah et al., 2018).
The mass transfer models demonstrated lower prediction accuracy than the combination-based models for transpiration in greenhouses. This can be explained by the limited air movement and the somewhat heterogeneous microclimate in the greenhouse which can lead to variations in transpiration which may not be captured by the mass-transfer models. Lower accuracy estimates from the radiation-based models can be due to the different exposure of plants to solar radiation due to the glass cover and positioning of the greenhouse. Moreover, greenhouse grown plants receive a non-uniform light distribution as compared to the open field, which is due to many factors such as shading or plant alignment. The radiation-based models do not consider these greenhouse specific factors which may be subject to inaccuracies since they heavily rely on the solar radiation parameter. Moreover, the combination-based models encompass all major factors affecting transpiration including solar radiation, temperature, humidity, wind speed and atmospheric pressure, which makes them more accurate and reliable than other single variable-based models. The Penman-Monteith model is derived from physical laws which makes it more robust and applicable for predicting for different crop types and in different settings. This can explain the higher performance of the Penman-Monteith model over the Stanghellini model which involves empirical relations corresponding to a different crop than the one studied in this work.
Although, the FAO56 PM model demonstrated the best performance among the other models in predicting transpiration for greenhouses under high solar radiation, HVAC and CO2 enriched environments, but it is linked to approximately a 22.9% error difference from the gas exchange measurements. Hence, it is still important to further improve the prediction accuracy by parametrizing the model or sub-model components such as the internal or aerodynamic resistances which can be considered as one of the limitations of this work. The parametrization of such mechanistic models requires larger experimental sampling and longer time frames than the presented work. Hence, Future work is envisaged to parametrize the best performing models with advanced sampling and measurement techniques to provide a more accurate modeling roadmap for irrigation management in agricultural greenhouses located in regions with high solar radiation.
5. Conclusion
Greenhouse cultivation practices are recognized as one the leading enablers in achieving precision agriculture which require high accuracy precision in microclimate and irrigation management. The accurate estimation of ET is crucial to evaluate crop water requirements and help guide growers in their irrigation management schemes. This work emerged from the need to evaluate existing ET0 models and determine their applicability for agricultural greenhouse systems located in high solar radiation regions under both HVAC and CO2 enriched environments. Twenty ET0 models including temperature-based, radiation-based, mass transfer-based, and combination models were evaluated against direct gas exchange measurement for a cucumber crop-based greenhouse using several statistical indicators. The main findings of this study are:
• The FAO56 Penman-Monteith model demonstrated the best performance for the estimation of transpiration with the lowest RMSE (0.205), second lowest MAE (0.157), and the highest R2 (0.632).
• The Stanghellini model proved to be the second most accurate in estimating transpiration.
• The FAO56 PM model, having the best performance, is recommended over the other simplified temperature, mass-transfer and radiation-based models to be used for estimating transpiration in HVAC based and CO2 enriched greenhouses located in high solar radiation regions.
Future work is necessary to parametrize the model or sub-model components of the FAO56 PM model to further improve the accuracy of transpiration predictions for this application. In the case of the unavailability of full microclimatic data, the Schendel model, the Rohwer, and Abtew models can be applied to predict transpiration for this application as they exhibit the best performances amongst the temperature-based, mass transfer based, and radiation-based model categories respectively. This work demonstrates its feasibility as it determines the most suitable models for predicting transpiration in greenhouses located in hyper-arid regions which are challenged by high solar radiation and water scarcity, hence requiring the deployment of special technologies and management practices such as HVAC cooling and CO2 enrichment. Hence, it is important to study the applicability of the different existing ET0 models for greenhouses under these challenges to improve the prediction of irrigation water requirements and contribute to the purpose of precision agriculture for greenhouse systems. This work will also aid in the irrigation management of greenhouses under the CO2 enrichment practice which is an important sink for carbon capture and utilization (CCU) with cross-sectoral energy, water and food nexus opportunities.
Data availability statement
The raw data supporting the conclusions of this article will be made available by the authors, without undue reservation.
Author contributions
IG: conceptualization, methodology, validation, formal analysis, investigation, and writing—original draft. RG: conceptualization, methodology, and investigation. TA-A: conceptualization, methodology, writing—review and editing, resources, supervision, project administration, and funding acquisition. All authors contributed to the article and approved the submitted version.
Funding
This research was supported by Hamad Bin Khalifa University (HBKU) and the Qatar National Research Fund (QNRF), members of Qatar Foundation, through the National Priorities Research Program (NPRP) grant No. NPRP11S-0107-180216.
Conflict of interest
The authors declare that the research was conducted in the absence of any commercial or financial relationships that could be construed as a potential conflict of interest.
Publisher's note
All claims expressed in this article are solely those of the authors and do not necessarily represent those of their affiliated organizations, or those of the publisher, the editors and the reviewers. Any product that may be evaluated in this article, or claim that may be made by its manufacturer, is not guaranteed or endorsed by the publisher.
Abbreviations
ET0, reference evapotranspiration (mm/h); ETc, crop evapotranspiration (mm/h); kc, crop coefficient; Tmean, average mean temperature (°C); Tmax, maximum temperature (°C); Tmin, minimum temperature (°C); p, atmospheric pressure (kPa); RH, average relative humidity (%); Rn, net solar radiation (MJ/m2 day); Ra, extraterrestrial radiation (MJ/m2 day); Rs, incoming shortwave radiation (MJ/m2 day); Δ, slope of vapor pressure and temperature curve (kPa/°C); γ, psychrometric constant (kPa/°C); α, Priestley Taylor coefficient; λ, Latent heat of vaporization (MJ/kg); u, wind speed (m/s); VPD, vapor pressure deficit (kPa); LAI, Leaf area index; ρa, Air density (kg/m3); Cp, Specific heat capacity of air (J/kg °C); re, External crop resistance (s/m); ri, Internal resistance (s/m); G, Soil heat flux (MJ/m2 day); Nu, Nusselt number; Re, Reynolds number; Gr, Grashof number; l, Characteristic dimension of a leaf (m); λa, Thermal conductivity (W/m K).
References
Abtew, W. (1996). Evapotranspiration measurements and modeling for three wetland systems in south Florida. J. Am. Water Resour. Assoc. 32, 465–473. doi: 10.1111/j.1752-1688.1996.tb04044.x
Acquah, S. J., Yan, H., Zhang, C., Wang, G., Zhao, B., Wu, H., et al. (2018). Application and evaluation of Stanghellini model in the determination of crop evapotranspiration in a naturally ventilated greenhouse. Int. J. Agric. Biol. Eng. 11, 95–103. doi: 10.25165/j.ijabe.20181106.3972
Akhavan, S., Kanani, E., and Dehghanisanij, H. (2019). Assessment of different reference evapotranspiration models to estimate the actual evapotranspiration of corn (Zea mays L.) in a semiarid region (case study, Karaj, Iran). Theor. Appl. Climatol. 137, 1403–1419. doi: 10.1007/s00704-018-2634-y
Albrecht, F. (1950). Die Methoden zur Bestimmung der Verdunstung der natürlichen Erdoberfläche. Archiv Meteorol. Geophys. Bioklimatol. Serie B 2, 1–38. doi: 10.1007/BF02242718
Allen, R., Peirera, L. S., Raes, D., and Smith, M. (1998). Crop Evapotranspiration—Guidelines for Computing Crop Water Requirements. Rome: Food and Agriculture Organization of the United Nations (FAO).
Bao, Y., Liu, T., Duan, L., Tong, X., Ji, H., Zhang, L., et al. (2022). A comparative study of three stomatal conductance models for estimating evapotranspiration in a dune ecosystem in a semi-arid region. Sci. Total Environ. 802, 149937. doi: 10.1016/j.scitotenv.2021.149937
Bao, Y., Liu, T., Duan, L., Tong, X., Zhang, L., Singh, V. P., et al. (2021). Comparison of an improved Penman-Monteith model and SWH model for estimating evapotranspiration in a meadow wetland in a semiarid region. Sci. Total Environ. 795, 148736. doi: 10.1016/j.scitotenv.2021.148736
Blaney, H. F., and Criddle, W. D. (1962). Determining Consumptive Use and Irrigation Water Requirements. Washington, DC: U. S. Department of Agriculture.
Bourletsikas, A., Argyrokastritis, I., and Proutsos, N. (2018). Comparative evaluation of 24 reference evapotranspiration equations applied on an evergreen-broadleaved forest. Hydrol. Res. 49, 1028–1041. doi: 10.2166/nh.2017.232
Cruz-Blanco, M., Lorite, I. J., and Santos, C. (2014). An innovative remote sensing based reference evapotranspiration method to support irrigation water management under semi-arid conditions. Agric. Water Manag. 131, 135–145. doi: 10.1016/j.agwat.2013.09.017
Dalton, J. (1802). Experimental essays on the constitution of mixed gases; on the force of steam of vapour from waters and other liquids in different temperatures, both in a torricellian vacuum and in air on evaporation and on the expansion of gases by heat. Mem. Manch. Lit. Philos. Soc. 5, 535–602
Djaman, K., O'Neill, M., Diop, L., Bodian, A., Allen, S., Koudahe, K., et al. (2019). Evaluation of the Penman-Monteith and other 34 reference evapotranspiration equations under limited data in a semiarid dry climate. Theor. Appl. Climatol. 137, 729–743. doi: 10.1007/s00704-018-2624-0
Ershadi, A., McCabe, M. F., Evans, J. P., and Wood, E. F. (2015). Impact of model structure and parameterization on Penman–Monteith type evaporation models. J. Hydrol. 525, 521–535. doi: 10.1016/j.jhydrol.2015.04.008
Ghiat, I., Mackey, H. R., and Al-Ansari, T. (2021a). A review of evapotranspiration measurement models, techniques and methods for open and closed agricultural field applications. Water (Basel) 13, 2523. doi: 10.3390/w13182523
Ghiat, I., Mahmood, F., Govindan, R., and Al-ansari, T. (2021b). CO2 utilisation in agricultural greenhouses : a novel ‘plant to plant' approach driven by bioenergy with carbon capture systems within the energy, water and food nexus. Energy Convers. Manag. 228, 113668. doi: 10.1016/j.enconman.2020.113668
Ghiat, I., Pradhan, S., Govindan, R., Mackey, H. R., McKay, G., and Al-Ansari, T. (2022). Biochar: a sustainable approach of green waste management in agricultural practices under controlled microclimate. Chem. Eng. Trans. 92, 331–336. doi: 10.3303/CET2292056
Hargreaves, G. H., and Samani, Z. A. (1985). “Reference crop evapotranspiration from ambient air temperature,” in Paper—American Society of Agricultural Engineers, 96–99.
Irmak, S., Irmak, A., Allen, R. G., and Jones, J. W. (2003). Solar and net radiation-based equations to estimate reference evapotranspiration in humid climates. J. Irrigat. Drain. Eng. 129, 336–347. doi: 10.1061/(ASCE)0733-9437(2003)129:5(336)
Jensen, M. E., and Haise, H. R. (1963). Estimating evapotranspiration from solar radiation. J. Irrig. Drain. Div. 89, 15–41. doi: 10.1061/JRCEA4.0000287
Jolliet, O., and Bailey, B. J. (1992). The effect of climate on tomato transpiration in greenhouses: measurements and models comparison. Agric. For. Meteorol. 58, 43–62. doi: 10.1016/0168-1923(92)90110-P
Katsoulas, N., and Stanghellini, C. (2019). Modelling crop transpiration in greenhouses: different models for different applications. Agronomy 9, 392. doi: 10.3390/agronomy9070392
Kharrufa, N. (1985). Simplified equation for evapotranspiration in arid regions. Beitr age zur HydrologieSonderheft 5, 39–47.
Łabedzki, L., Bak, B., and Labedzki, S. S. E.-L. (2011). “Estimation of reference evapotranspiration using the FAO Penman-Monteith method for climatic conditions of Poland,” in Evapotranspiration, ed. E. Kanecka-Geszke (Rijeka: IntechOpen), 12. doi: 10.5772/14081
Lahlou, F.-Z., Mackey, H. R., and Al-Ansari, T. (2022). Role of wastewater in achieving carbon and water neutral agricultural production. J. Clean. Prod. 339, 130706. doi: 10.1016/j.jclepro.2022.130706
Legates, D. R., and McCabe, G. J. (1999). Evaluating the use of “goodness-of-fit” measures in hydrologic and hydroclimatic model validation. Water Resour. Res. 35, 233–241. doi: 10.1029/1998WR900018
López-Cruz, I. L., Olivera-López, M., and Herrera-Ruiz, G. (2008). Simulation of greenhouse tomato crop transpiration by two theoretical models. Acta Hortic. 145–150. doi: 10.17660/ActaHortic.2008.797.18
López-Urrea, R., Martín de Santa Olalla, F., Fabeiro, C., and Moratalla, A. (2006). Testing evapotranspiration equations using lysimeter observations in a semiarid climate. Agric. Water Manag. 85, 15–26. doi: 10.1016/j.agwat.2006.03.014
Mahmood, F., and Al-Ansari, T. (2022). Design and analysis of a renewable energy driven greenhouse integrated with a solar still for arid climates. Energy Convers. Manag. 258, 115512. doi: 10.1016/j.enconman.2022.115512
Mahmood, F., Govindan, R., Bermak, A., Yang, D., Khadra, C., and Al-Ansari, T. (2021). Energy utilization assessment of a semi-closed greenhouse using data-driven model predictive control. J. Clean. Prod. 324, 129172. doi: 10.1016/j.jclepro.2021.129172
Makkink, G. F. (1957). Testing the Penman formula by means of lysimeters. J. Inst. Water Eng. 11, 277–288.
Meyer, A. (1926). Über einige Zusammenhänge zwischen Klima und Boden in Europa. Chem. Erde 2, 209–347.
Mondal, I., Thakur, S., De, A., and De, T. K. (2022). Application of the METRIC model for mapping evapotranspiration over the Sundarban Biosphere Reserve, India. Ecol. Indic. 136, 108553. doi: 10.1016/j.ecolind.2022.108553
Morille, B., Migeon, C., and Bournet, P. E. (2013). Is the Penman–Monteith model adapted to predict crop transpiration under greenhouse conditions? Application to a New Guinea Impatiens crop. Sci. Hortic. 152, 80–91. doi: 10.1016/j.scienta.2013.01.010
Muniandy, J. M., Yusop, Z., and Askari, M. (2016). Evaluation of reference evapotranspiration models and determination of crop coefficient for Momordica charantia and Capsicum annuum. Agric. Water Manag. 169, 77–89. doi: 10.1016/j.agwat.2016.02.019
Nash, J. E., and Sutcliffe, J. V. (1970). River flow forecasting through conceptual models part I—a discussion of principles. J. Hydrol. 10, 282–290. doi: 10.1016/0022-1694(70)90255-6
Osakabe, Y., Osakabe, K., Shinozaki, K., and Tran, L.-S. P. (2014). Response of plants to water stress. Front. Plant Sci. 5, e86. doi: 10.3389/fpls.2014.00086
Penman, H. L. (1948). Natural evaporation from open water, hare soil and grass. Proc. R. Soc. Lond. Ser. A Math. Phys. Sci. 120–45. doi: 10.1098/rspa.1948.0037
Priestley, C. H. B., and Taylor, R. J. (1972). On the assessment of surface heat flux and evaporation using large scale parameters. Mon. Weather Rev. 100, 81–92. doi: 10.1175/1520-0493
Rahimikhoob, A., Behbahani, M. R., and Fakheri, J. (2012). An evaluation of four reference evapotranspiration models in a subtropical climate. Water Resour. Manag. 26, 2867–2881. doi: 10.1007/s11269-012-0054-9
Rawat, K. S., Kumar Singh, S., Bala, A., and Szab,ó, S. (2019). Estimation of crop evapotranspiration through spatial distributed crop coefficient in a semi-arid environment. Agric. Water Manag. 213, 922–933. doi: 10.1016/j.agwat.2018.12.002
Ritter, A., and Muñoz-Carpena, R. (2013). Performance evaluation of hydrological models: Statistical significance for reducing subjectivity in goodness-of-fit assessments. J. Hydrol. 480, 33–45. doi: 10.1016/j.jhydrol.2012.12.004
Rohwer, C. (1931). Evaporation From Free Water Surface. Washington, DC: US Department of Agriculture.
Romanenko, V. (1961). Computation of the Autumn Soil Moisture Using a Universal Relationship for a Large Area. Kiev: Ukrainian Hydrometeorological Research Institute.
Sabeh, N. C., Giacomelli, G. A., and Kubota, C. (2011). Water Use in a Greenhouse in a Semi-Arid Climate. Trans. ASABE 54, 1069–1077. doi: 10.13031/2013.37098
Singh, V. P., and Xu, C.-Y. (1997). Evaluation and generalization of 13 mass-transfer equations for determining free water evaporation. Hydrol. Process. 11, 311–323. doi: 10.1002/(SICI)1099-1085(19970315)11:3<311::AID-HYP446>3.0.CO;2-Y
Soussi, M., Chaibi, M. T., Buchholz, M., and Saghrouni, Z. (2022). Comprehensive review on climate control and cooling systems in greenhouses under hot and arid conditions. Agronomy 12, 626. doi: 10.3390/agronomy12030626
Subedi, A., and Chávez, J. L. (2015). Crop evapotranspiration (ET) estimation models: a review and discussion of the applicability and limitations of et methods. J. Agric. Sci. 7, 50. doi: 10.5539/jas.v7n6p50
Tabari, H., Grismer, M. E., and Trajkovic, S. (2013). Comparative analysis of 31 reference evapotranspiration methods under humid conditions. Irrig. Sci. 31, 107–117. doi: 10.1007/s00271-011-0295-z
Tabari, H., and Talaee, P. H. (2011). Local calibration of the Hargreaves and Priestley-Taylor equations for estimating reference evapotranspiration in arid and cold climates of iran based on the Penman-Monteith model. J. Hydrol. Eng. 16, 837–845. doi: 10.1061/(asce)he.1943-5584.0000366
Trabert, W. (1896). Neue Beobachtungen über Verdampfungsgeschwindigkeiten. Meteorol. Z. 13, 261–263.
Trajkovic, S. (2007). Hargreaves versus Penman-Monteith under humid conditions. J. Irrig. Drain. Eng. 133, 38–42. doi: 10.1061/(ASCE)0733-9437(2007)133:1(38)
Trajkovic, S., and Kolakovic, S. (2009). Evaluation of reference evapotranspiration equations under humid conditions. Water Resour. Manage. 23, 3057–3067. doi: 10.1007/s11269-009-9423-4
Turc, L. (1961). Evaluation des besoins en eau irrigation, l'evapotranspiration potentielle. Annu. Agron. 12, 13–49.
Villarreal-Guerrero, F., Kacira, M., Fitz-Rodríguez, E., Kubota, C., Giacomelli, G. A., Linker, R., et al. (2012). Comparison of three evapotranspiration models for a greenhouse cooling strategy with natural ventilation and variable high pressure fogging. Sci. Hortic. 134, 210–221. doi: 10.1016/j.scienta.2011.10.016
Vishwakarma, D. K., Pandey, K., Kaur, A., Kushwaha, N. L., Kumar, R., Ali, R., et al. (2022). Methods to estimate evapotranspiration in humid and subtropical climate conditions. Agric. Water Manag. 261, 107378. doi: 10.1016/j.agwat.2021.107378
Wang, L., Iddio, E., and Ewers, B. (2021). Introductory overview: evapotranspiration (ET) models for controlled environment agriculture (CEA). Comput. Electron. Agric. 190, 106447. doi: 10.1016/j.compag.2021.106447
Willmott, C. J. (1981). On the validation of models. Phys. Geogr. 2, 184–194. doi: 10.1080/02723646.1981.10642213
Wu, Z., Cui, N., Zhao, L., Han, L., Hu, X., Cai, H., et al. (2022). Estimation of maize evapotranspiration in semi-humid regions of northern China using Penman-Monteith model and segmentally optimized Jarvis model. J. Hydrol. (Amst) 607, 127483. doi: 10.1016/j.jhydrol.2022.127483
Xu, C.-Y., and Singh, V. P. (2001). Evaluation and generalization of temperature-based methods for calculating evaporation. Hydrol. Process. 15, 305–319. doi: 10.1002/hyp.119
Yan, H., Huang, S., Zhang, C., Gerrits, M. C., Wang, G., Zhang, J., et al. (2020). Parameterization and application of Stanghellini Model for estimating greenhouse cucumber transpiration. Water (Basel) 12, 517. doi: 10.3390/w12020517
Keywords: evapotranspiration, greenhouse, CO2 enrichment, solar radiation, irrigation
Citation: Ghiat I, Govindan R and Al-Ansari T (2023) Evaluation of evapotranspiration models for cucumbers grown under CO2 enriched and HVAC driven greenhouses: A step towards precision irrigation in hyper-arid regions. Front. Sustain. Food Syst. 7:1155443. doi: 10.3389/fsufs.2023.1155443
Received: 31 January 2023; Accepted: 24 March 2023;
Published: 13 April 2023.
Edited by:
Mesfin Mergia Mekonnen, University of Alabama, United StatesReviewed by:
Santosh S. Palmate, Texas A&M AgriLife Research and Extension Center at El Paso, United StatesLa Zhuo, Northwest A&F University, China
Copyright © 2023 Ghiat, Govindan and Al-Ansari. This is an open-access article distributed under the terms of the Creative Commons Attribution License (CC BY). The use, distribution or reproduction in other forums is permitted, provided the original author(s) and the copyright owner(s) are credited and that the original publication in this journal is cited, in accordance with accepted academic practice. No use, distribution or reproduction is permitted which does not comply with these terms.
*Correspondence: Tareq Al-Ansari, dGFsYW5zYXJpQGhia3UuZWR1LnFh