 Shuang Cheng
 Zhipeng Xing
 Chao Tian
- Jiangsu Key Laboratory of Crop Cultivation and Physiology, Jiangsu Co-innovation Center for Modern Production Technology of Grain Crops, Research Institute of Rice Industrial Engineering Technology, Yangzhou University, Yangzhou, China
Biaxial rotary tillage is considered an effective approach for enhancing the structure of soil in rice fields. There are few reports on the effects of biaxial rotary tillage on the carbon footprint (CF), energy budget, and net ecosystem economic efficiency (NEEB) of rice fields. Here, we evaluated the effects of dryland biaxial rotary tillage (DBRT), as well as two traditional tillage methods, dryland and paddy field in uniaxial rotary tillage (DPURT) and paddy field in uniaxial rotary tillage (PURT), on the CF, energy budget, and NEEB of rice production to clarify the economic and ecological utility of DBRT. The tillage depth was 9.5–15.4% higher under DBRT than under DPURT and PURT (p < 0.05). The soil bulk density was 5.4–12.1% lower under DBRT than under DPURT and PURT. The rice grain yield was 7.6–8.7% and 17.7–19.1% higher under DBRT than under DPURT and PURT, respectively (p < 0.05). The total global warming potential was 7.6–10.6% and 17.0–20.4% lower under DBRT than under DPURT and PURT, respectively (p < 0.05). The CF was 17.7–18.9% and 35.4–36.1% lower under DBRT than under DPURT and PURT, respectively. The energy use efficiency was 8.7–10.4% and 16.4–18.3% higher under DBRT than under DPURT and PURT, respectively. The NEEB were 13.2–15.7% and 28.6–32.1% higher under DBRT than under DPURT and PURT, respectively. In summary, DBRT is beneficial for increasing rice yield and reducing greenhouse gas emissions, thereby improving the economic and ecological benefits of rice.
1. Introduction
Intensive agricultural production processes are a major source of environmental pollution, and the relative contribution of these processes to environmental pollution is steadily increasing as these processes are increasingly employed to accommodate the growing demand for food (De Notaris et al., 2018; Chen et al., 2021). Net CH4 and N2O emissions due to agricultural production activities are estimated to have reached 10.2 Gt CO2-eq per year, which comprises approximately 10 to 12% of human greenhouse gas (GHG) emissions (Zhang et al., 2015). Rice is one of the major important crops, and its production requires intensive agricultural operations, such as tillage, fertilization, and irrigation, resulting in extensive GHG emissions (Li et al., 2021). The energy-demanding nature of these intensive agricultural operations has a major effect on the sustainability of rice production under the background of global climate change (Bruce et al., 2012; Gulab et al., 2020; Liu et al., 2020). The development of rice production technologies with high energy and economic efficiency and with low GHG emissions is thus needed to ensure both food security and environmental safety as the human population grows and global climate change intensifies.
Rotary tillage has been widely used to enhance the structure of agricultural soil because of its low costs and high efficiency (Wang et al., 2006; Lal et al., 2019; Chen et al., 2020). However, conventional rotary tillage is shallow due to the limitation of low-horsepower machinery (Yu et al., 2019; Scott and Stephen, 2020). And the concentration of straw from previous crops on the soil surface often leads to increased GHG emissions (Kim et al., 2016). Also straw decomposition reduces the available nitrogen for plants (Shan et al., 2008; Chu et al., 2015; Cao et al., 2018), and increased the toxic effects of reducing substances on seedlings (Chu et al., 2015; Wang Z. Q. et al., 2018). Some approaches that have been used to address the above problems include increasing the number of basic seedlings, increasing the frequency of irrigation and drainage, and increasing the frequency of N application during the rice tillering period (Chen et al., 2019). However, these measures increase energy inputs and GHG emissions in rice fields and reduce economic efficiency.
Dryland biaxial deep rotary tillage has become increasingly used in rice production in recent years, and the increased use of this technique has been associated with increases in the horsepower of machinery and the application of biaxial rotary tillage implements (Cong et al., 2021; Zhang et al., 2021). In dryland biaxial deep rotary tillage, biaxial rotary tillage, straw burying, soil suppression, and ditching are performed in a single operation after the previous crop is harvested; this approach thus permits crops to be planted after the flooding water has fully soaked the soil (Cheng et al., 2022). Dryland biaxial deep rotary tillage has been shown to enhance rice grain yield (Tian et al., 2022). However, no studies to date have characterized the effects of dryland biaxial deep rotary tillage practices on the CF, energy budget, and NEEB of rice production, yet quantifying the effects of tillage practices on these variables is critically important for the development of energy-efficient and GHG emission-reducing agricultural practices and assessments of agricultural economic benefits (Li et al., 2021; Sun et al., 2022).
CF is a comprehensive indicator of the net GHG emissions per grain yield during the crop growth cycle (Luo et al., 2021). Energy use efficiency (EUE), energy productivity (EP), and specific energy (SE) are important indicators for characterizing changes in GHG emissions in agroecosystems (Chaudhary et al., 2017). The NEEB are often used to evaluate the comprehensive economic and environmental benefits of agricultural measures (Zhou et al., 2019). Here, we evaluated the effects of dryland biaxial deep rotary tillage and traditional rice tillage on the CF, energy budget, and NEEB to clarify the economic and ecological feasibility of using dryland biaxial deep rotary tillage in rice production. Our study provides valuable data that will help policymakers enhance the productivity and ecosystem service capacity of rice fields.
2. Materials and methods
2.1. Experiment site and materials
The field experiments were conducted in Suqian City, Jiangsu Province, China, in 2021 and 2022. This experiment site was the rice-wheat crop rotation area with a temperate monsoon climate zone. The wheat planting information at the experiment site in 2020 and 2021 is shown in Table 1. The average of annual rainfall and temperature in this area are 893.9 mm and 14.6°C, respectively. The daily average temperature and rainfall during the 2021 and 2022 rice growth period are shown in Figure 1. The soil in the experimental site was a clay loam with 27.31 g kg−1 (28,116 kg ha−1) organic matter, 1.89 g kg−1 total N, 118.42 mg kg−1 alkaline hydrolysable N, 32.34 mg kg−1 Olsen P, and 85.64 mg kg−1 exchangeable K.
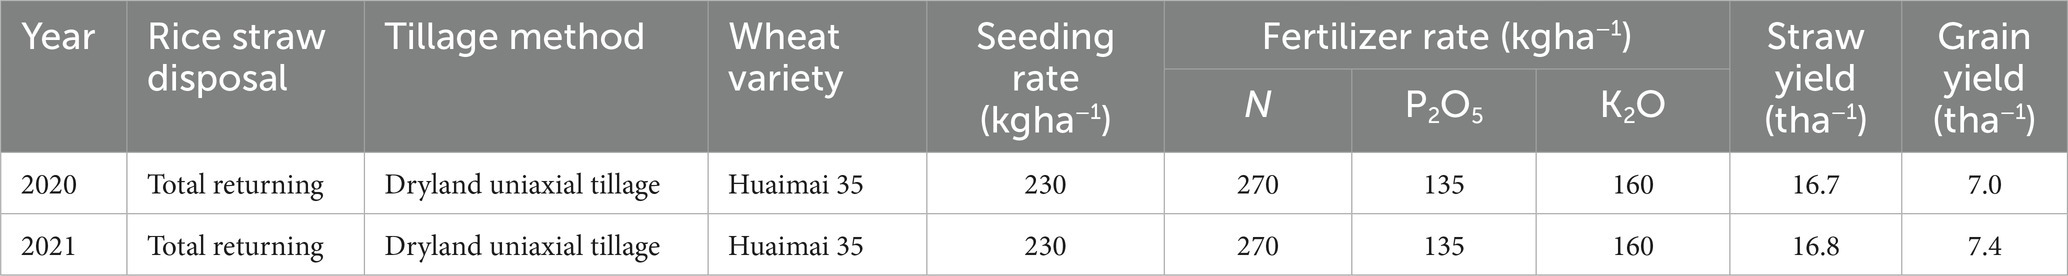
Table 1. Wheat planting information at experiment site in 2020 and 2021.
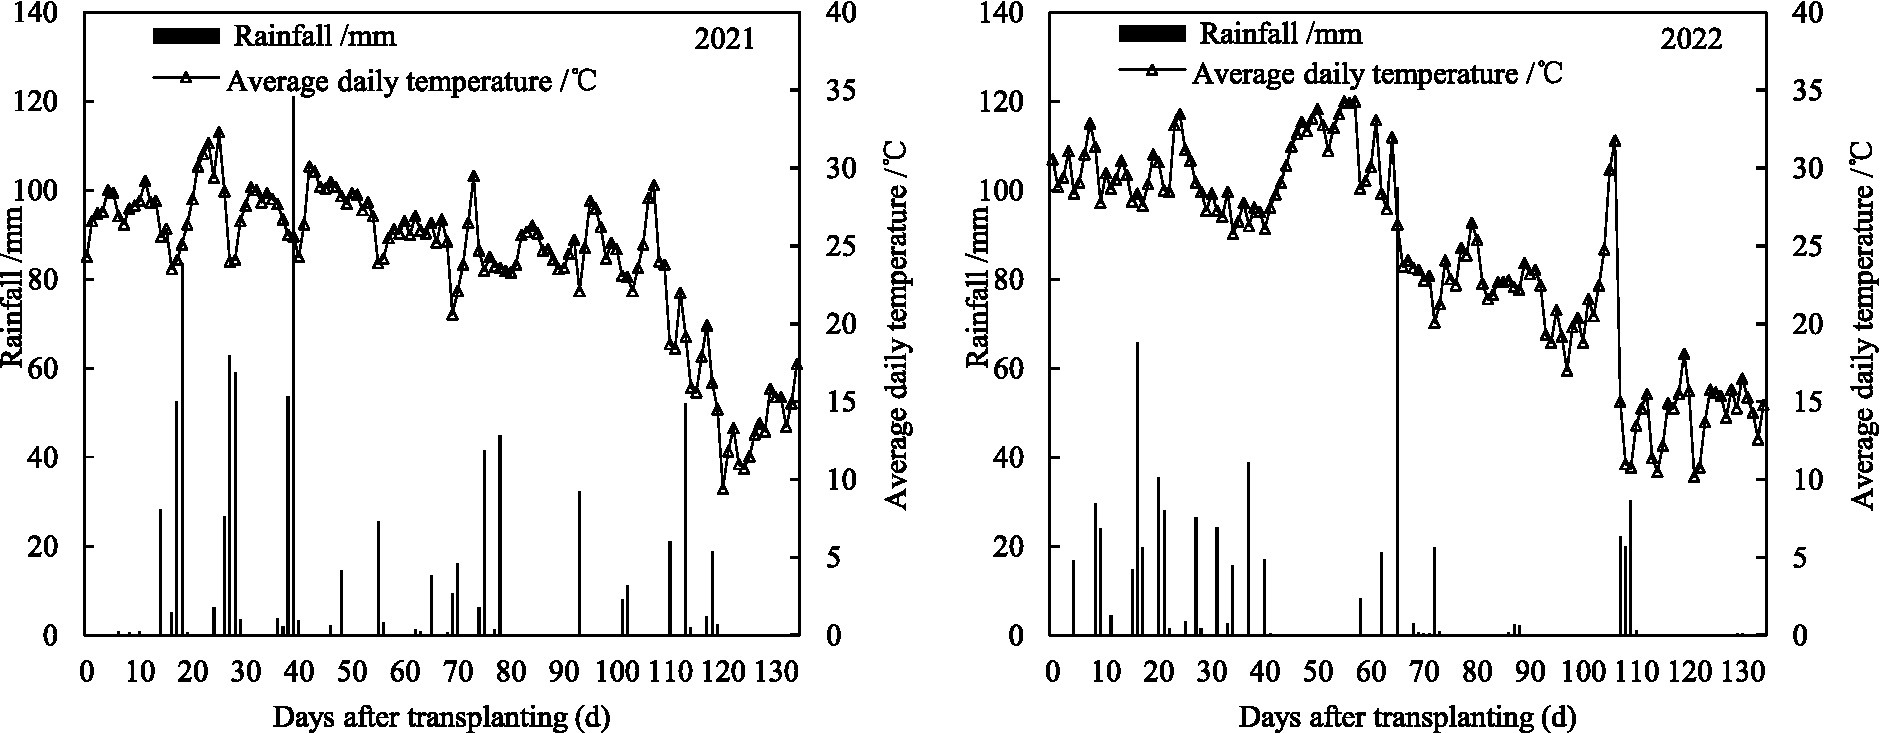
Figure 1. Average daily temperature (bars) and rainfall (line) during the 2021 and 2022 rice growth season.
Japonica rice variety Nanjing 5,718 was planted in 2021, and japonica rice varieties Nanjing 5,718 and Hongyang 5 were planted in 2022. Fertilizers applied in the rice field included a controlled release of urea (Maoshi Ecological Fertilizer Co., Ltd). Conventional urea (46% N), calcium superphosphate (12.5% P2O5), and potassium chloride (60% K2O) were purchased from local fertilizer outlets.
2.2. Experiment design and agricultural practices
Three tillage methods were applied as treatments with a full return of wheat straw to the rice field, including dryland biaxial rotary tillage (DBRT), dryland and paddy field in uniaxial rotary tillage (DPURT), and paddy field uniaxial rotary tillage (PURT). All three methods were implemented in one field with three replications of each method. The cultivated area of each treatment was about 0.7 ha. Mechanical channels were reserved among tillage methods to facilitate mechanical operation. The land preparation procedure and equipment used in the three tillage methods are listed in Table 2.

Table 2. Operation procedures and the equipment used of three tillage methods.
Fertilizer application in the field was completely consistent, applying 270 kg N ha−1, 135 kg P2O5 ha−1 and 240 kg K2O ha−1. Where, nitrogen fertilizer was applied by conventional urea and controlled-release urea at the ratio (N) of 5: 5. All fertilizers were applied at one time by the fertilizer throwing machine before the field machinery operation.
Blanket seedlings were cultivated on hard plastic seedling trays (58 cm × 28 cm) on May 29, 2021 and May 28, 2022, respectively, and the seeding rates of Nanjing 5,718 and Hongyang 5 were both 180 g per tray. Mechanical transplanting was carried out on June 19 in 2021 and 2022. Planting 33.3 × 10⁴ hills per ha, 4 seedlings per hill (30 cm × 10 cm). Herbicides were sprayed at 1 day, 33–35 and 62–65 days after transplanting to control weeds. The paddy field was flooded from 8 days after rice transplanting to the mid-tillering, and the mid-term drainage was carried out from the mid-tillering to the panicle initiation time. After that, the flooding state was maintained and the pre-harvest drainage was carried out 7 days before harvest. Other farming operations are carried out under the guidance of local agricultural experts.
2.3. Gas sampling and measurements
CH4 and N2O fluxes were measured from regreening to maturity using the static chamber method as described by Chu et al. (2015). Flux measurements were initiated 10 days after transplanting and were taken until 2 days before harvest to minimize the effects of transplanting machinery on greenhouse gas emissions in paddy fields, as well as the effects of greenhouse gas measurement equipment on the rice harvest. Measurements were taken at an interval of 7 days during the entire rice growth period. Four acrylic chambers were installed in each treatment in 2021; in 2022, two acrylic chambers were installed in each treatment under each variety. For each flux measurement, gas samples were collected from 08:00 to 10:00 using a 20 ml syringe at 0, 10, 20, and 30 min after chamber closure. The concentrations of CH4, N2O, and CO2 from the collected gas samples were analyzed by a gas chromatograph system (Agilent 7890A, Agilent Technologies, Palo Alto, CA, United States). N2O was detected with an electron capture detector (ECD), and CH4 with a hydrogen flame ionization detector (FID). CO2 was reduced with hydrogen to CH4 in a nickel catalytic converter at 375°C and then detected by the FID. The carrier gas was argon–CH4 (5%) at a flow rate of 40 ml min−1. The temperatures of the column and ECD detector were maintained at 40°C and 300°C, respectively. The oven and FID were operated at 50°C and 300°C, respectively. Total emissions of CH4 ( ) and N2O ( ) for the entire growing season were determined using the integral functions in Wang Z. Q. et al. (2018).
2.4. Soil sampling and measurements
The soil bulk density of the 0–20 cm soil layer was measured prior to tillage in 2021 and when rice plants reached maturity in 2021 and 2022 using the core method (Ferraro and Ghersa, 2007). Six soil samples were taken, representing each tillage method in 2021. However, only three soil samples representing each tillage method and rice variety were taken in 2022, and the soil samples representing two varieties were mixed. A ruler was used to measure the thickness of the soil plow layer. The potassium dichromate volumetric method was used to determine the content of soil organic carbon (SOC; Deng et al., 2022) after soil samples had been crushed and passed through a 2-mm mesh sieve. SOC storage (Ssoc) was calculated using the following formula (Batjes, 1996):
2.5. Rice yield measurement
Each rice variety was harvested at maturity in a 10-m2 area at three survey points in each tillage method, and grain yield (water content 14.5%) was determined after air drying. Moisture of rice grain was measured by grain moisture meter (PM-8188A, Kett Scientific Research Institute, Japan).
2.6. Carbon footprint calculation
CF was calculated based on the total carbon emissions in the rice growing season, annual variation in SOC storage in the plow layer, and rice grain yield. The CF of the rice field was calculated using the following formula (Li et al., 2021):
GWPT during the rice growing season not only includes CH4 and N2O emissions from the soil but also carbon emissions from agricultural inputs. GWPT was calculated using the following formula:
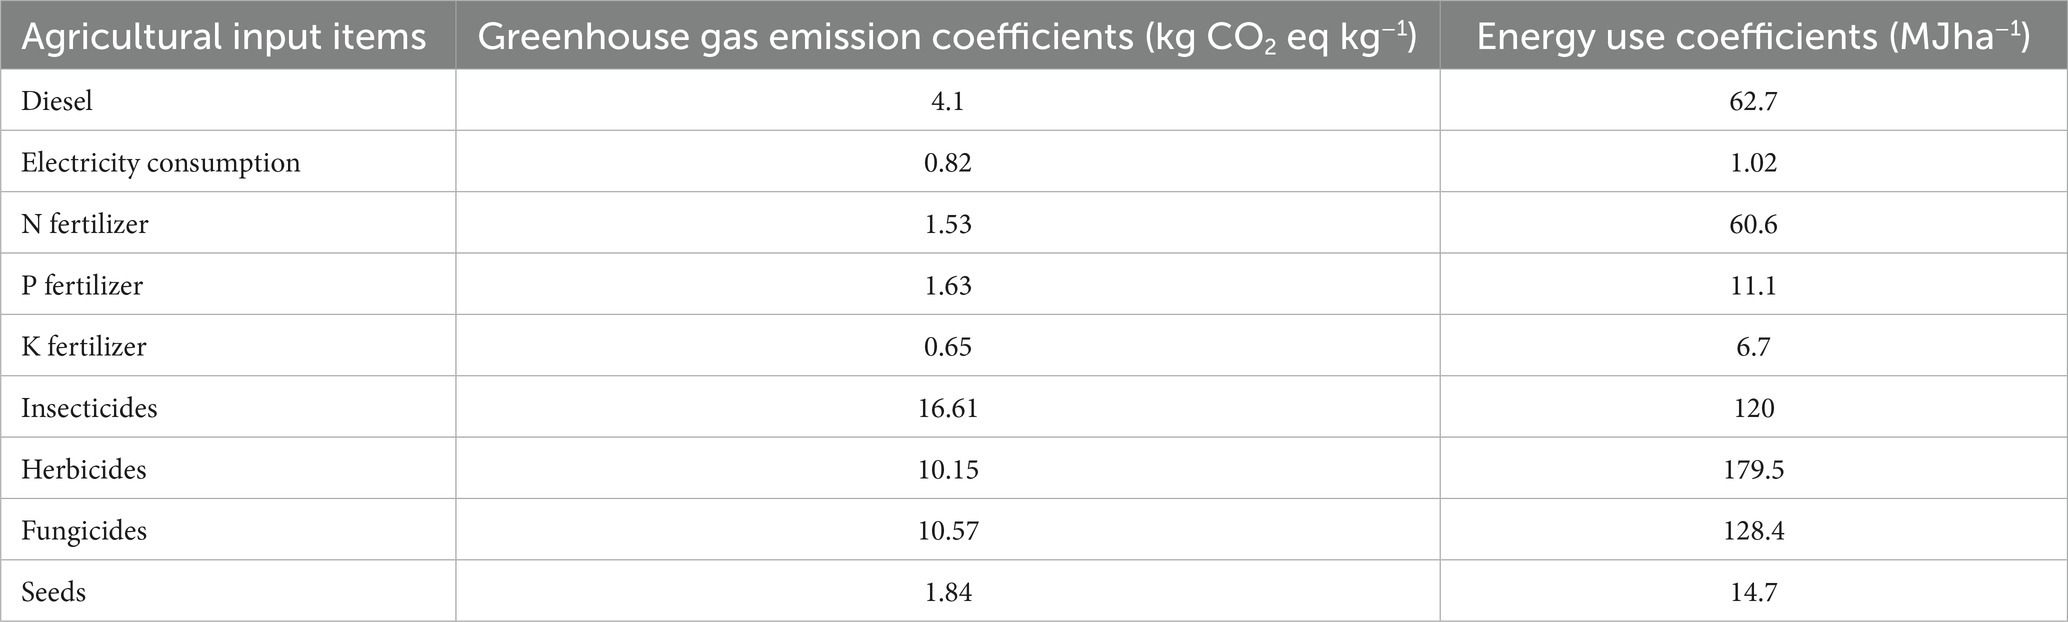
Table 3. Greenhouse gas emission coefficients and energy utilization coefficients of different agricultural inputs.
△SSOC was calculated using the following formula:
Each rice variety was harvested at maturity in a 10-m2 area at three survey points in each tillage method, and grain yield (water content 14.5%) was determined after drying.
2.7. Energy budget calculation
The energy budget of rice production includes agricultural inputs and outputs. Agricultural inputs include the fuel consumption required for agricultural machinery (e.g., tillage, sowing, fertilization, transplanting, spraying, and harvesting), electricity consumption associated with irrigation, and agricultural materials (e.g., fertilizers, pesticides, herbicides, fungicides, and seeds). Energy input was calculated by multiplying the amount of each item consumed by its energy use coefficient. The energy use coefficients of each item are shown in Table 2, and these were calculated using the method of Gulab et al. (2017). The agricultural output was rice grain yield. According to Chaudhary et al. (2017), the energy budget of rice production was calculated using the following formulas:
2.8. Net ecosystem economic efficiency calculation
The economic benefits (EB), ecosystem economic benefits (EEB), and NEEB were calculated using the following formulas (Zhang et al., 2015):
Rice income was calculated according to the current local grain price and grain yield, which was 2,700 CNY t−1 and 2,600 CHY t−1 for 2021 and 2022, respectively; the government subsidy for mechanized transplanting was 3,000 CNY ha−1 per year (Min et al., 2021), Agricultural input costs included the costs of agricultural materials (e.g., fertilizers, pesticides, and seeds) and the costs of operating agricultural equipment (e.g., sowing, fertilization, tillage, transplanting, spraying pesticides, irrigation, and harvesting).
Carbon cost (Li et al., 2015) was calculated using the following formula:
2.9. Statistical analysis
Analysis of variance was performed using SPSS 18.0 software (SPSS Inc., Chicago, IL, United States). Statistical analyzes were performed by two-way ANOVA combined with the least significant difference (LSD) test, and means were separated at a significant level of p ≤ 0.05 (*) or 0.01 (**). The figures were plotted excel 2010.
3. Results
3.1. Human greenhouse gas emissions from soil and agricultural inputs
The cumulative soil CH4 and N2O emissions were significantly affected by tillage treatment (Figure 2). CH4 emissions were 18.9–20.1% and 30.2–37.0% lower under DPURT and DBRT than under PURT, respectively (p < 0.05). The opposite pattern was observed in the cumulative N2O emissions; specifically, N2O emissions were 32.1–34.6% and 50.05–73.1% higher under DPURT and DBRT than in PURT, respectively (p < 0.05; Table 4).
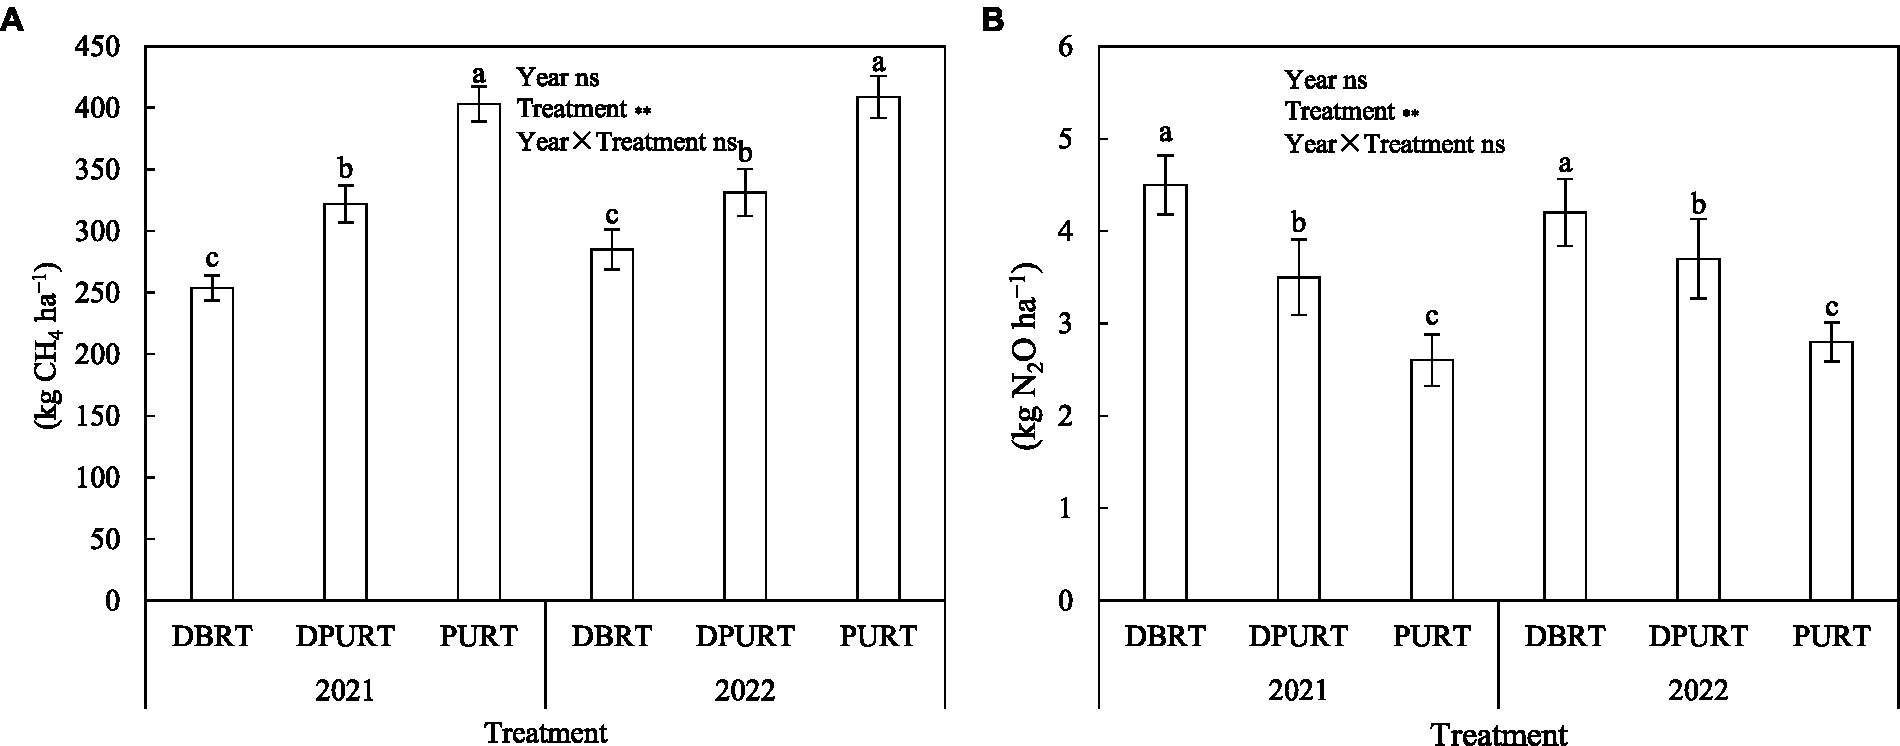
Figure 2. Cumulative soil CH4 (A) and N2O (B) emissions in the three tillage treatments in 2021 and 2022. DBRT, dryland biaxial rotary tillage; DPURT, dryland and paddy field uniaxial rotary tillage; and PURT, paddy field uniaxial rotary tillage. Data for 2022 were presented as the average of the two varieties. Vertical bars are mean ± standard error (n = 4). NS, not statistical significance (p > 0.05); **, statistical significance (p < 0.01). Different lowercase letters after the data in the table indicate statistically significance within the same column and the same year (p < 0.05).
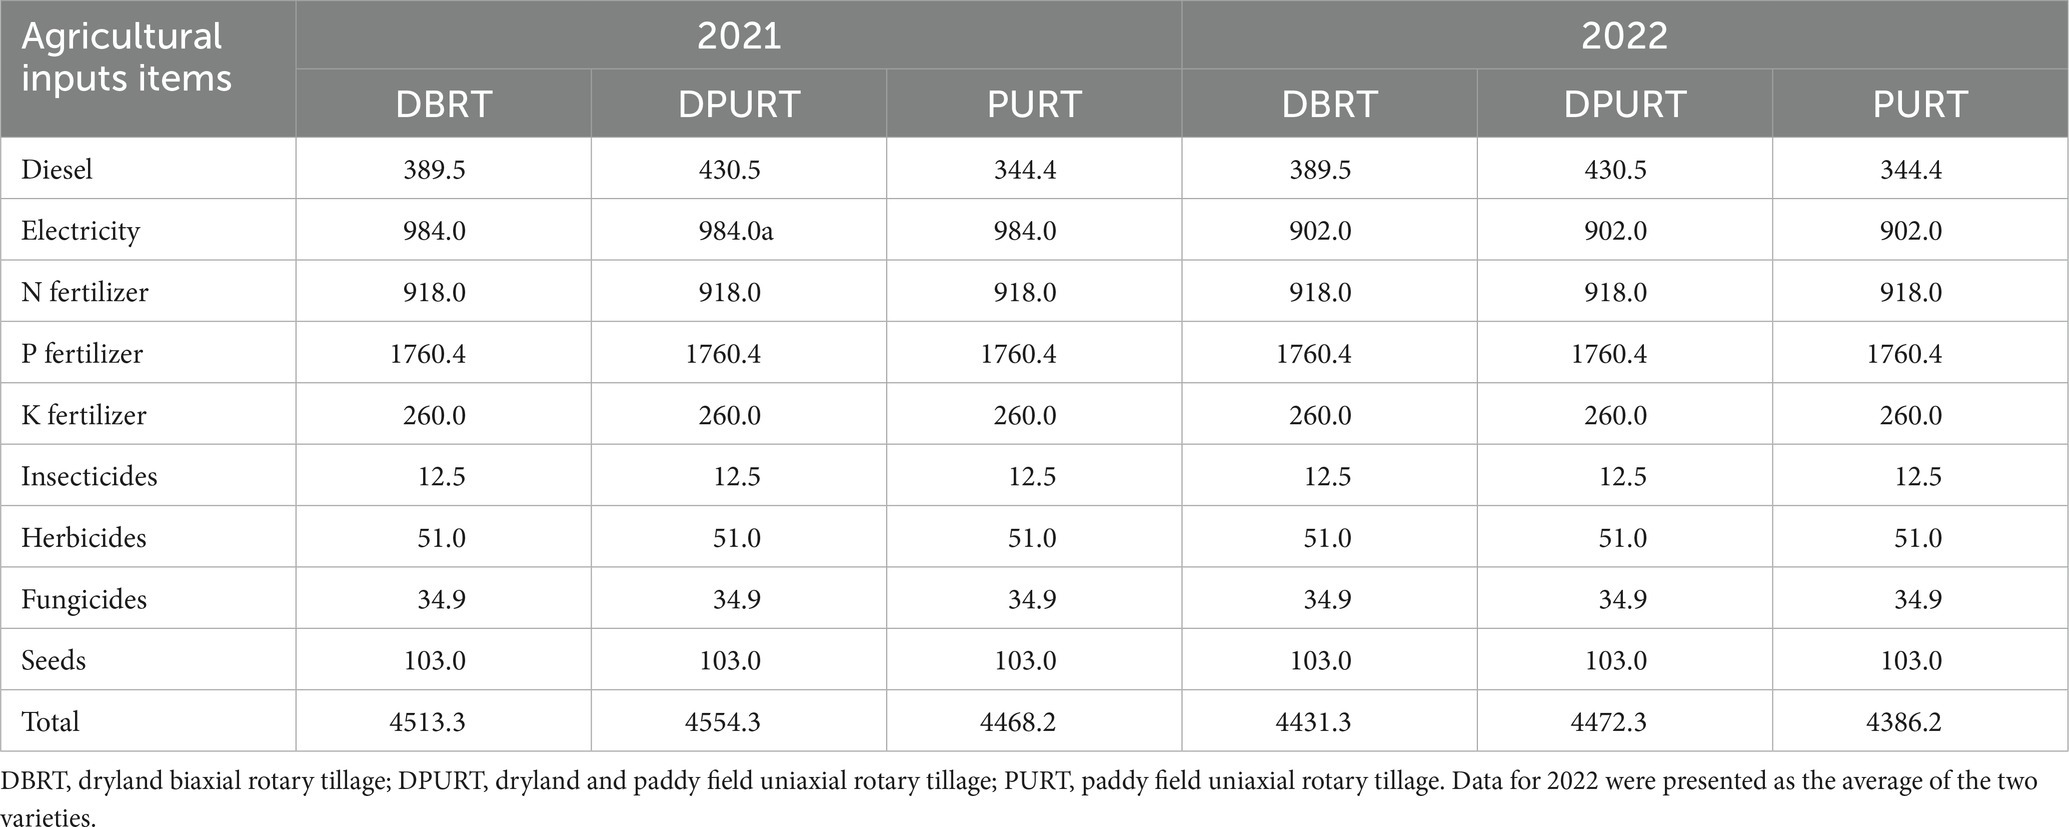
Table 4. GHG emissions (kg CO2 -eq ha−1) from agricultural inputs in the three tillage treatments in 2021 and 2022.
The GHG emissions range of agricultural inputs is 4431.3–4554.3 kg CO2 -eq ha−1 in the three tillage treatments. Fertilizers, electricity for irrigation, and fuel consumption were the main sources of the GHG emissions of agricultural inputs (64.5–67.0%, 20.2–22.0%, and 7.7–9.6% of the total GHG emissions, respectively). The GHG emissions derived from pesticides (e.g., insecticides, herbicides, and fungicides) and seeds were relatively low (2.16–2.24% and 2.26–2.35% of the total GHG emissions, respectively).
3.2. Soil organic carbon storage, CF, GWP, and grain yield
Tillage treatment had a significant effect on soil bulk density and plow layer thickness. BD was 5.7–10.3% and 9.8–13.8% higher under DPURT and PURT than under DBRT, respectively (p < 0.05). PLT was 8.7–9.2% and 12.5–13.3% lower under DPURT and PURT than under DBRT, respectively (p < 0.05). The SOC content and storage were not significantly affected by tillage treatment. SSOC was higher in all treatments in 2022 than in 2021 (Table 5).
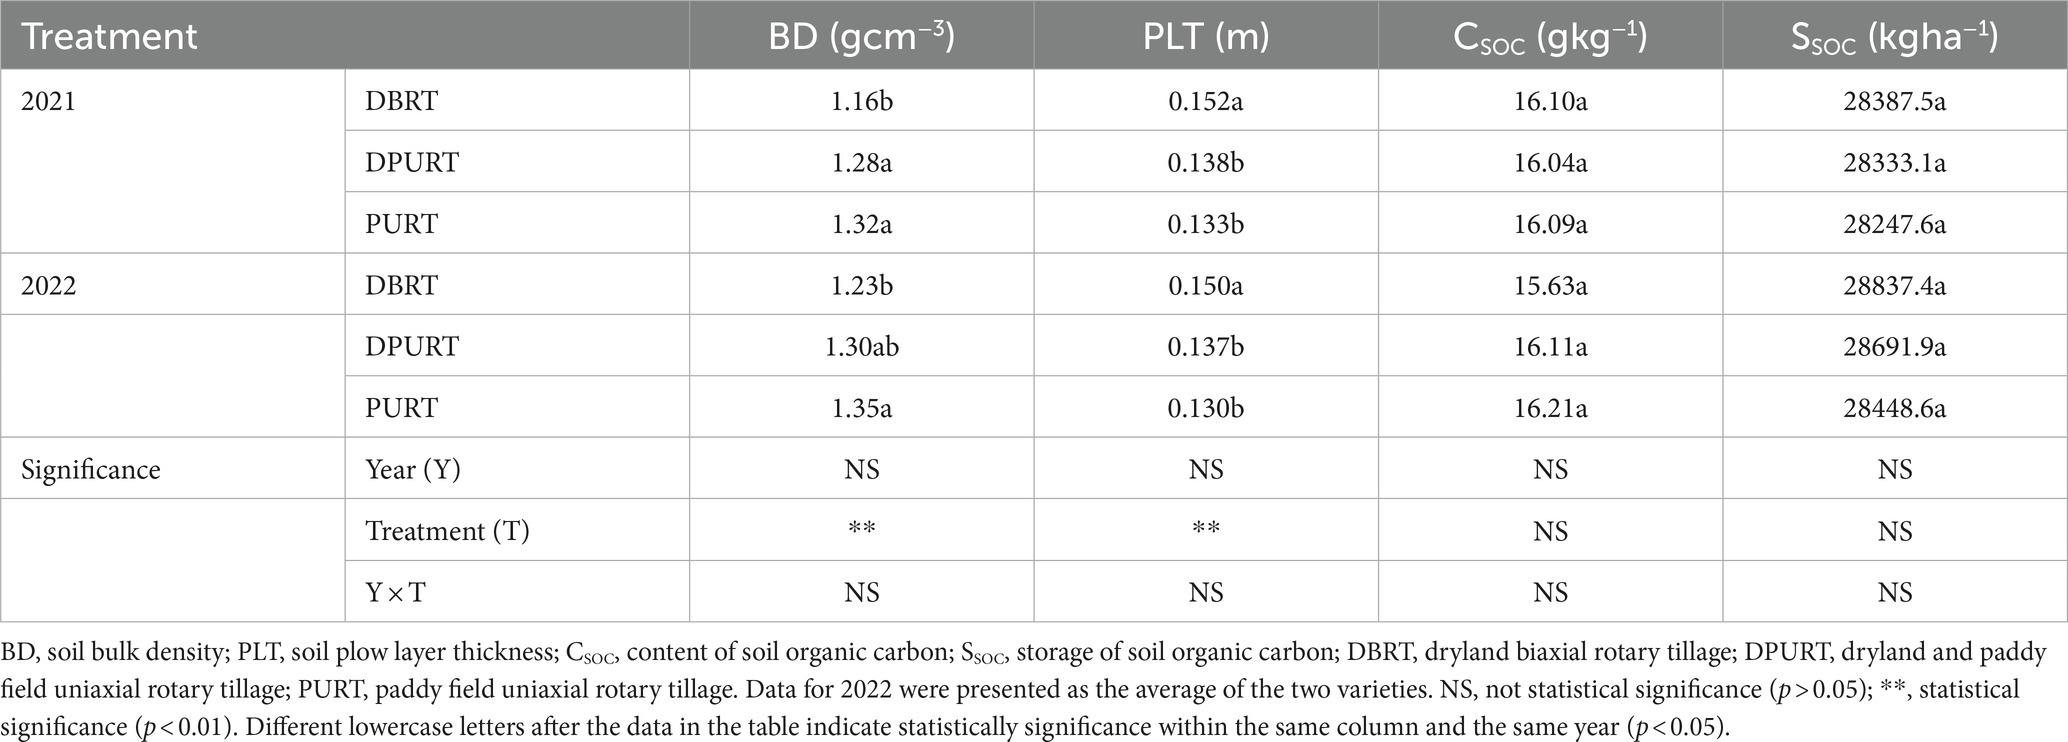
Table 5. BD, T, CSOC, and SSOC of soil in the three tillage treatments in 2021 and 2022.
Tillage treatment had a significant effect on CF and its components in rice fields. CF was 35.4–36.1% and 17.7–18.9% lower under DBRT than under PURT and DPURT, respectively, and these differences were significant (p < 0.05). GWPT was 17.0–20.4% and 7.6–10.6% lower under DBRT than under PURT and DPURT, respectively (p < 0.05). △SSOC was 106.3–116.9% and 25.1–25.3% higher under DBRT than under PURT and DPURT, respectively (p < 0.05). Grain yield was 17.7–19.1% and 7.6–8.7% higher under DBRT than under PURT and DPURT, respectively (p < 0.05; Table 6).
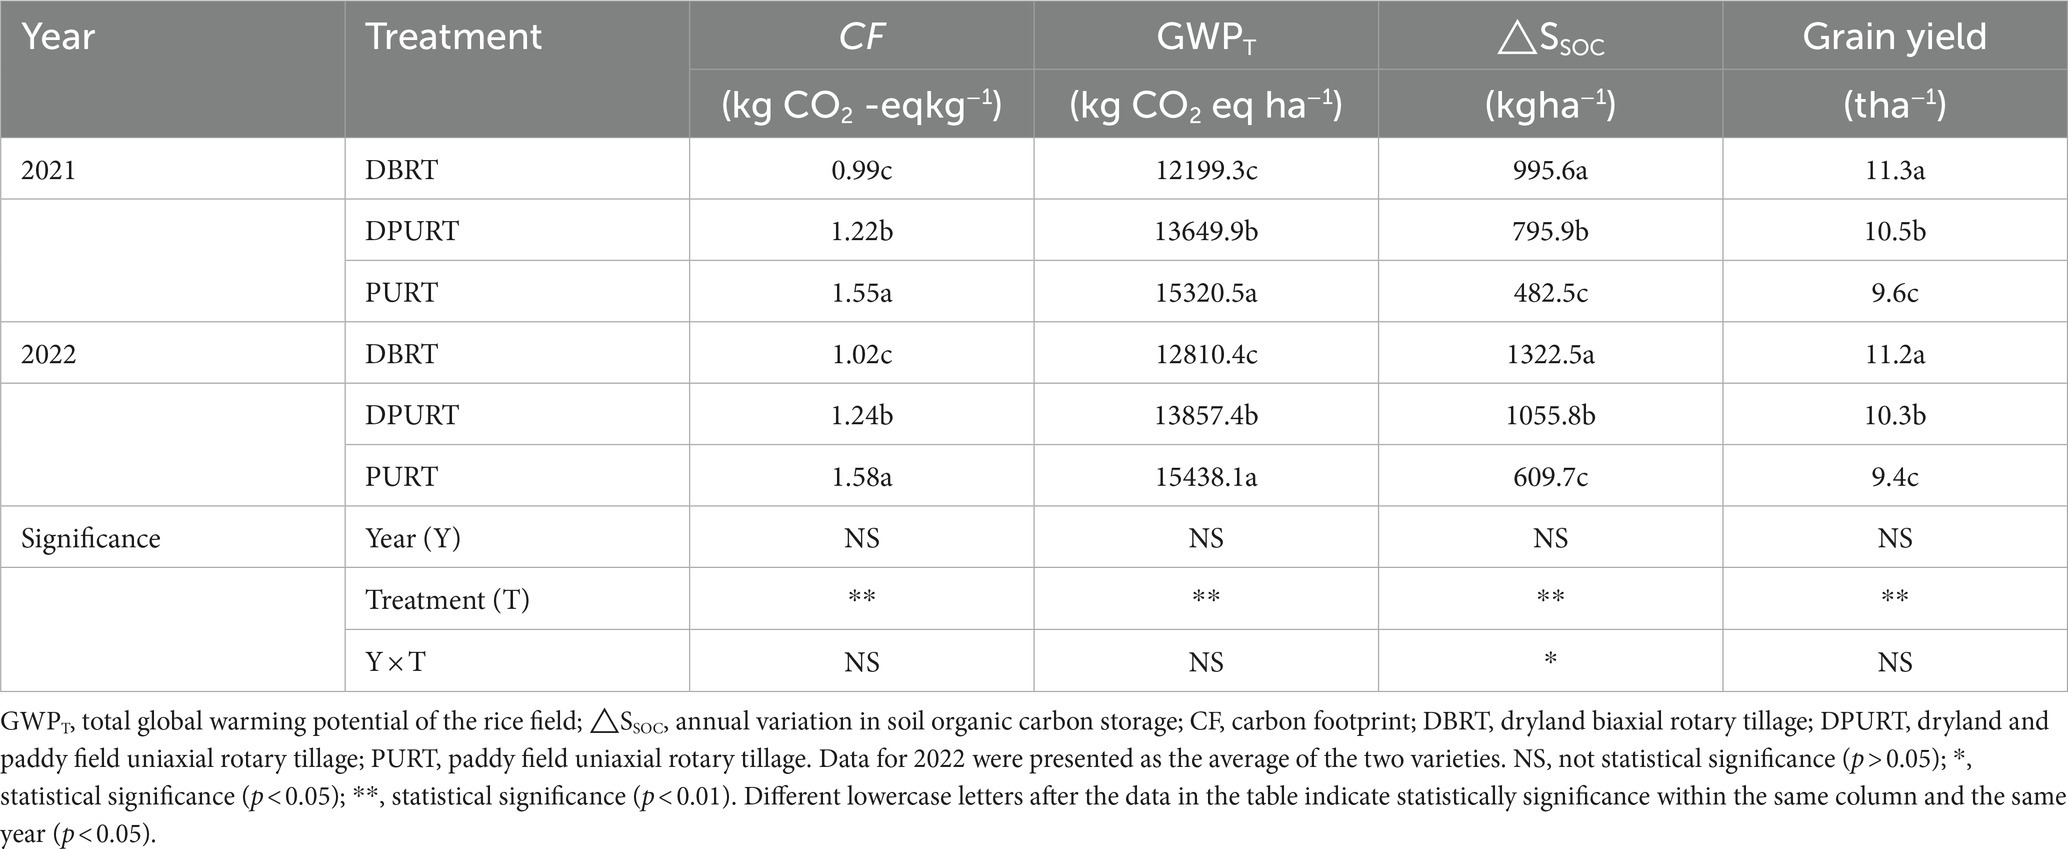
Table 6. CF, GWPT, △SSOC, and grain yield in the three tillage treatments in 2021 and 2022.
3.3. Energy inputs, energy outputs, and energy budget
The total energy of agricultural inputs ranged from 59,655.7 to 61,074.4 MJ ha−1 in each tillage treatment. Fertilizers (N fertilizer, P fertilizer, and K fertilizer) were the main contributors to total energy inputs (83.6–85.5%). The energy inputs of fuel consumption, the electricity required for irrigation, pesticides (pesticides, herbicides, and fungicides), and seeds were lower (8.8–10.8%, 1.84–2.05%, 2.32–2.37%, and 1.35–1.38%, respectively). The energy output of rice grain significantly differed among the three tillage treatments. The energy output under DBRT was 7.6–9.2% and 17.7–19.7% higher under DBRT than under PURT and DPURT, respectively (p < 0.05; Table 7).
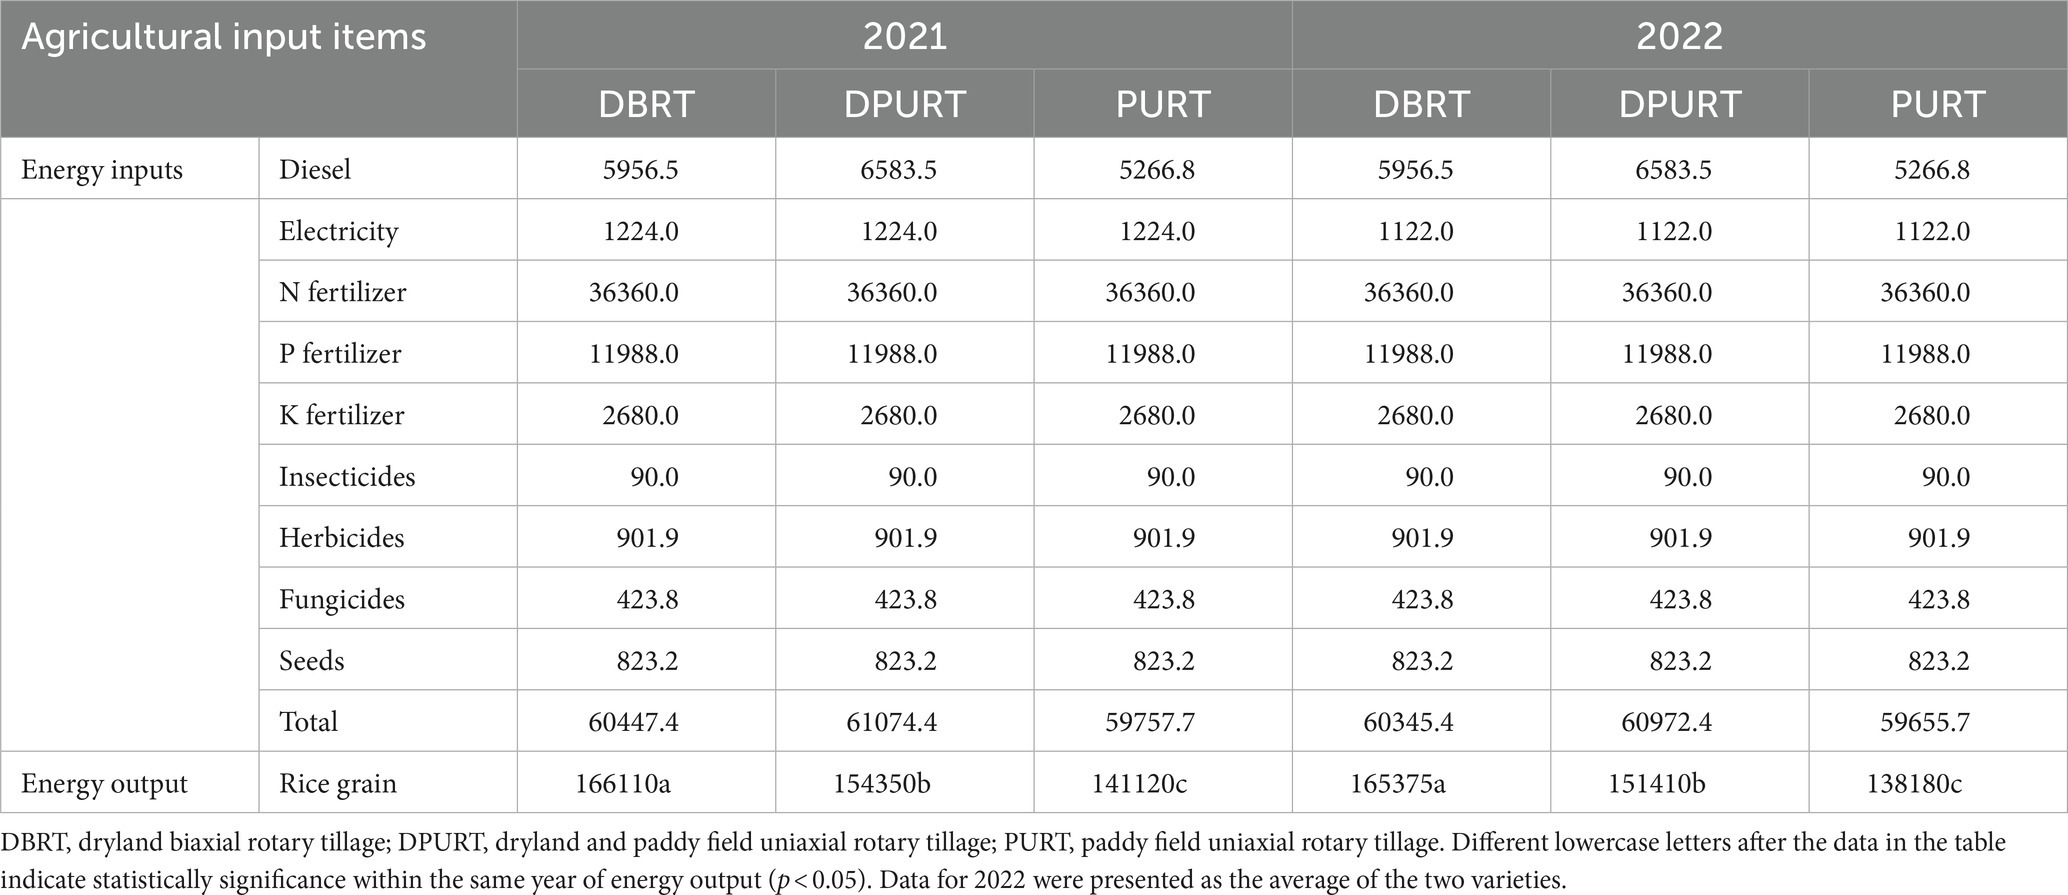
Table 7. Energy inputs and energy output (MJ ha−1) in the three tillage treatments in 2021 and 2022.
NE, EUE, EP, and SE were significantly affected by tillage treatment. NE was 29.9–33.8% and 13.3–16.1% higher under DBRT than under PURT and DPURT, respectively (p < 0.05). EUE was 16.4–18.3% and 8.7–10.4% higher under DBRT than under PURT and DPURT, respectively. EP was 16.2–17.7% and 8.7–10.1% higher under DBRT than under PURT and DPURT, respectively (p < 0.05). SE was 14.1–15.5% and 8.0–9.4% lower under DBRT than under PURT and DPURT, respectively (p < 0.05; Table 8).
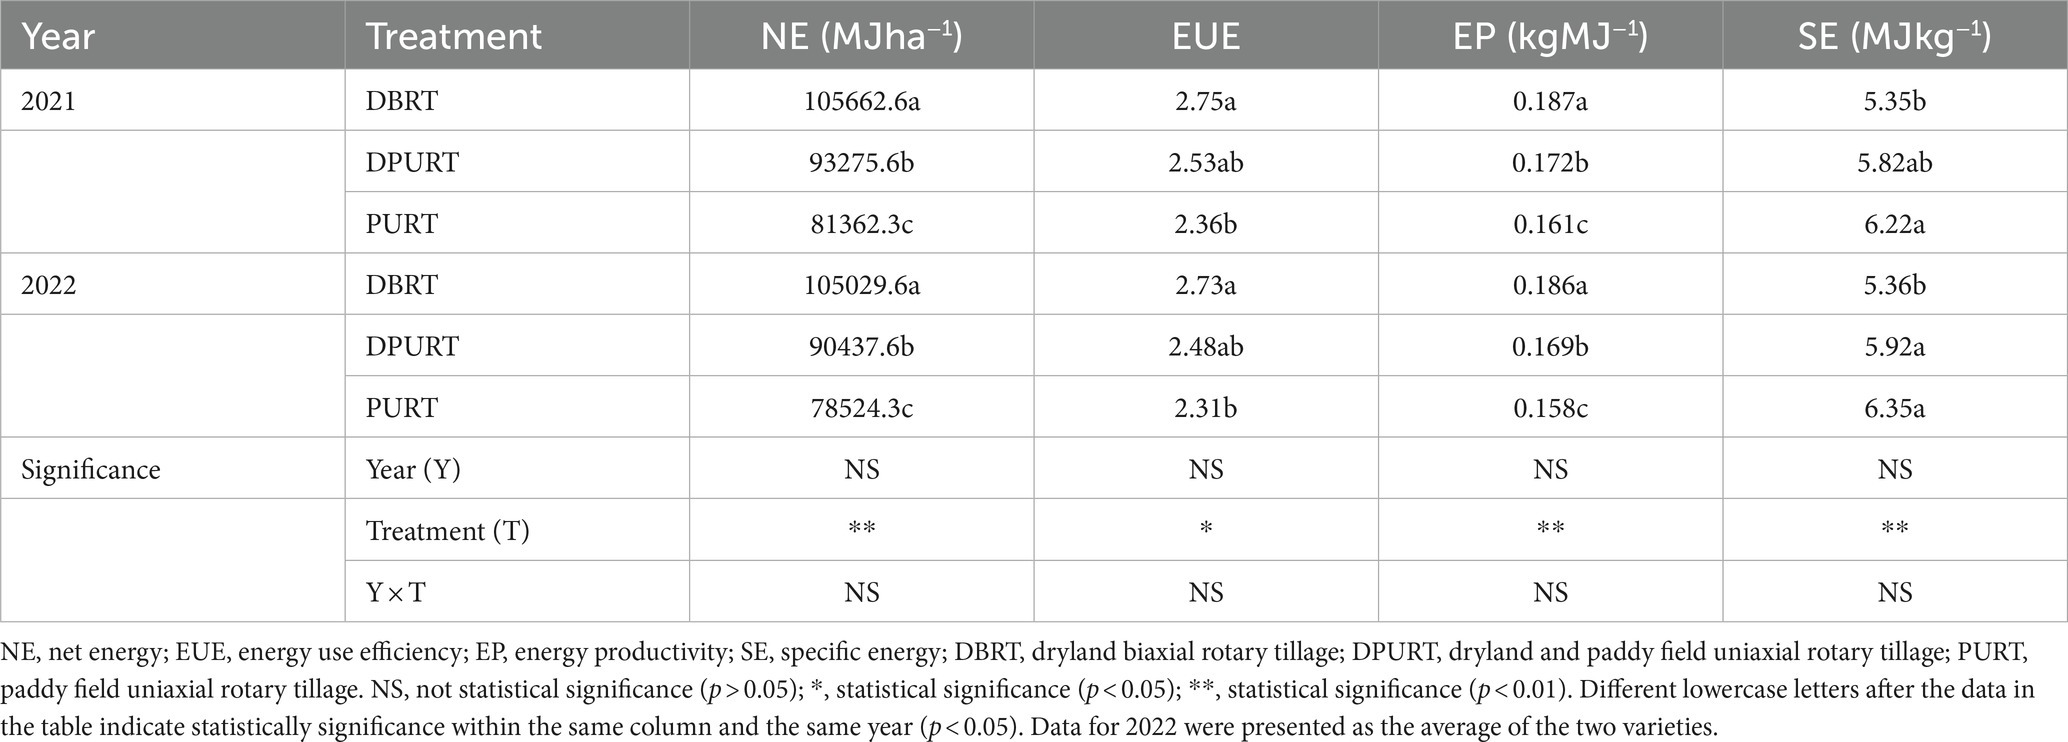
Table 8. Energy budget (MJ ha−1) in the three tillage treatments in 2021 and 2022.
3.4. Economic benefits EEB, and NEEB
The total agricultural costs ranged from 9,524.9 to 9,924.9 CNY ha−1 among tillage treatments. The cost of agricultural materials was 6,354.9 CNY ha−1, which comprised 64.0–66.7% of the total agricultural inputs; the cost of agricultural operations ranged from 3,170 to 3,570 CNY ha−1 and comprised 33.3–36.0% of the total agricultural costs. The operational costs were highest for DPURT, followed by PURT and DBRT (Table 9).
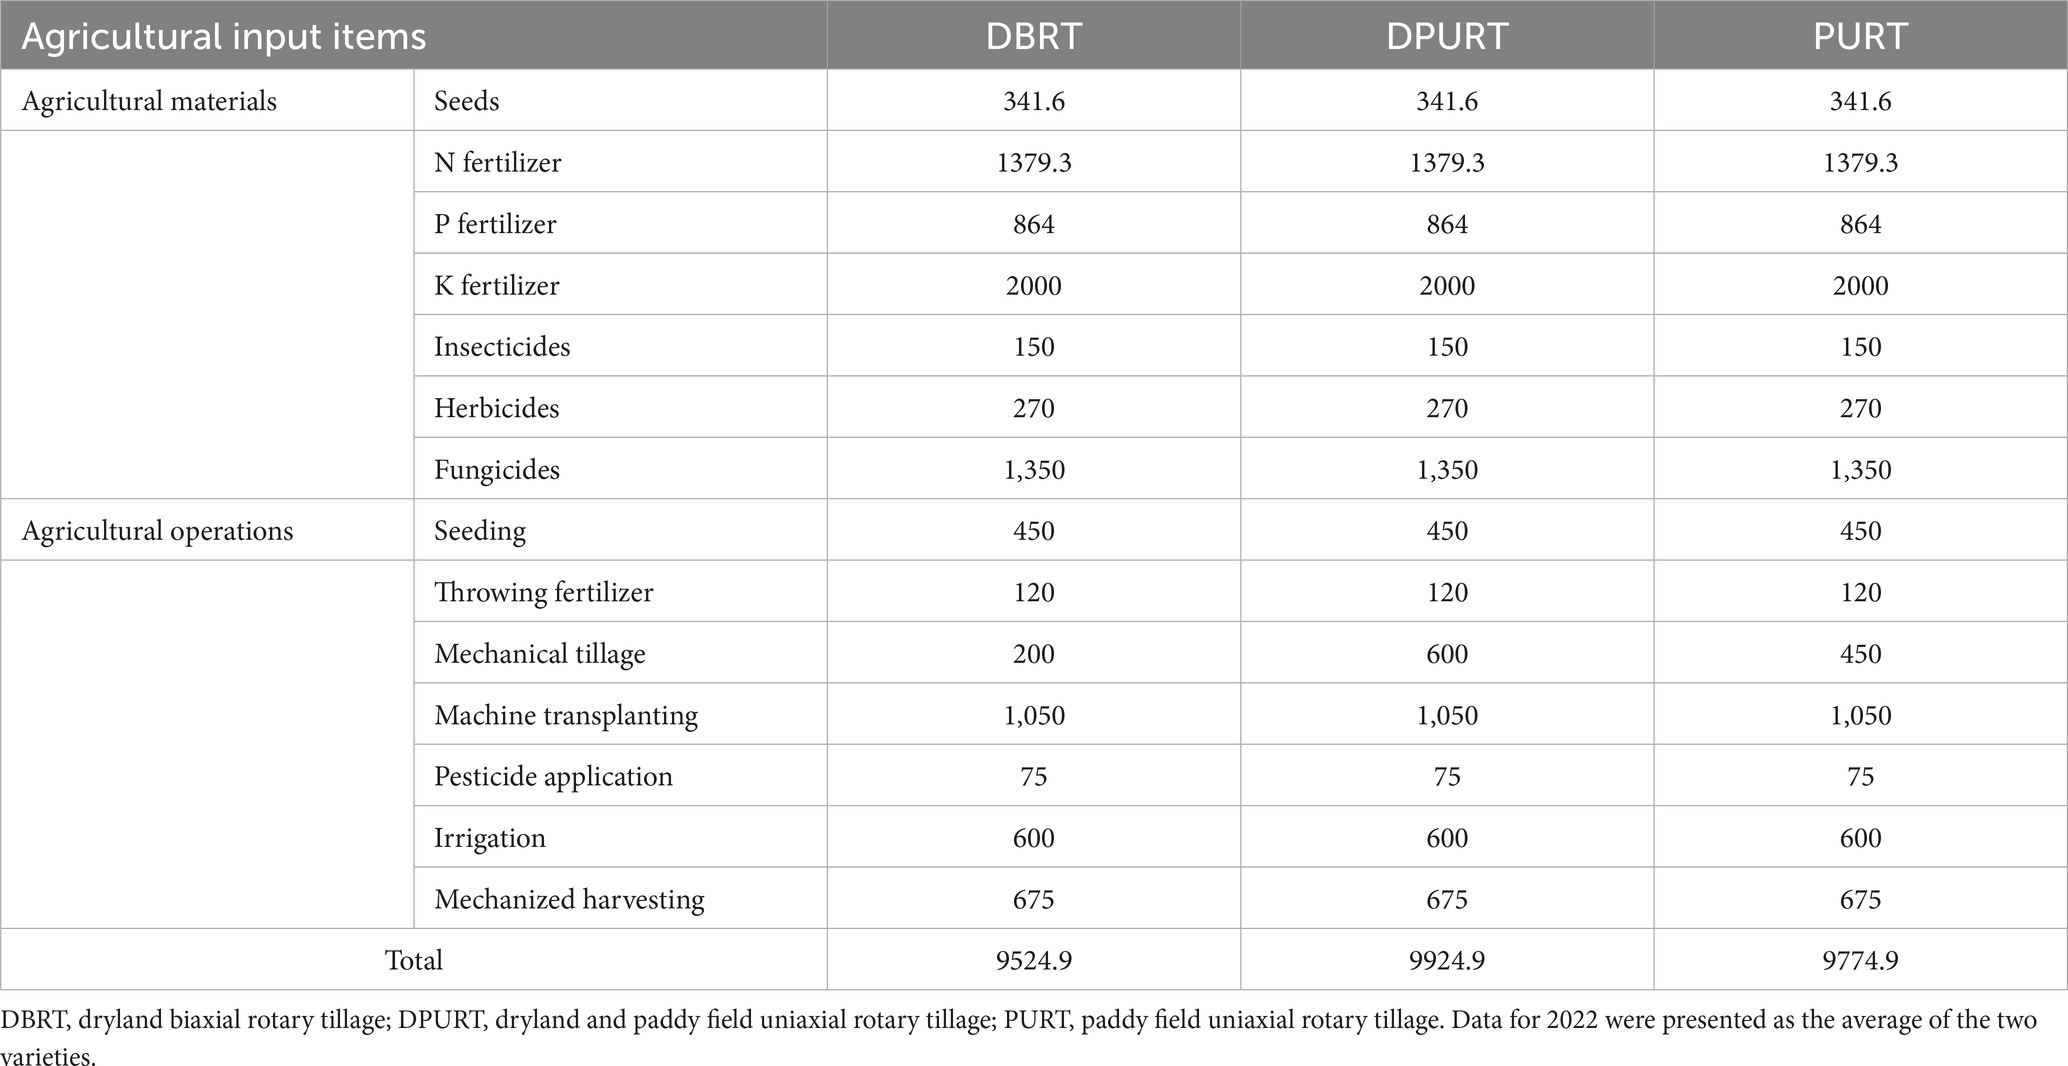
Table 9. Costs (CNY ha−1) of agricultural materials and operations in the three tillage treatments in 2021 and 2022.
Rice income and GWP costs ranged from 24,440 to 30,510 CNY ha−1 and from 797.0 to 1,115.9 CNY ha−1, respectively. Rice income was 7.6–9.2% and 17.7–19.7% higher under DBRT than under DPURT and PURT, respectively (p < 0.05). GWP costs were 10.7–15.5% and 23.7–28.6% lower under DBRT than under DPURT and PURT, respectively (p < 0.05). EB, EEB, and NEEB were significantly affected by tillage treatment. EB, EEB, and NEEB were 25.3–28.6%, 17.7–19.3%, and 28.6–32.1% higher under DBRT than under PURT, respectively (Table 10).
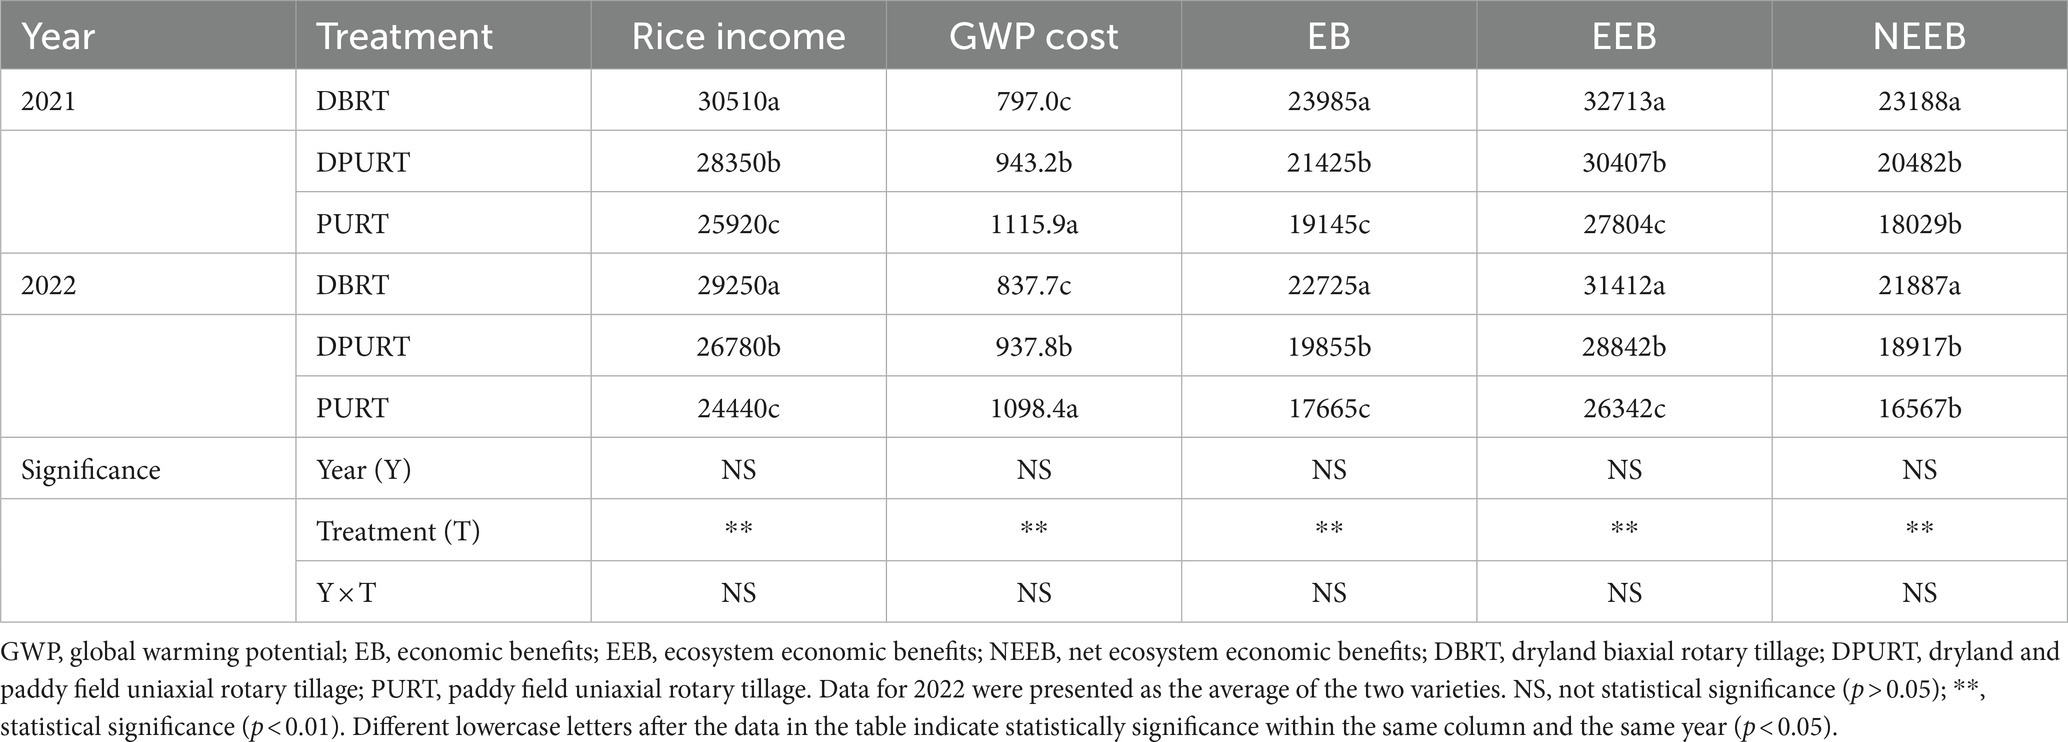
Table 10. Rice income, GWP cost, and EB, EEB, and NEEB (CNY ha−1) in three tillage treatments in 2021 and 2022.
4. Discussion
4.1. Carbon footprint
We evaluated the CF of rice production systems using a comprehensive CF measure that accounts for SOC sequestration. Our findings revealed that average annual soil carbon sequestration increased in the three tillage treatments, which suggests that soil carbon sequestration reduces the CF of rice fields. This positive effect mainly stems from the return of straw to the experimental plots in recent decades and cannot be explained alone by the short period over which our experiments were conducted (2 years; Huang et al., 2013; Tang et al., 2022). Some studies have also suggested that soil carbon sequestration reduces the CF in winter wheat–summer maize rotation and double-cropping rice systems (Shang et al., 2021; Sun et al., 2022). Although the effects of soil carbon sequestration were considered in this study, and the rice grain yield (9.4–11.3 t ha−1) was high, the significant increase in total GWP (12199.3–15438.1 kg CO2 eq ha−1) contributed to the high CF (0.99–1.58 kg CO2 -eq kg−1) in rice fields. The GWP of agricultural inputs, CH4, and N2O accounted for 28.4–37.0%, 52.0–66.2%, and 5.4–11.0% of the total GWP, respectively. The seasonal cumulative emissions of CH4 in soil are the main contributor to the high CF when organic carbon storage is high in rice fields under flood irrigation (Wang J. et al., 2018; Shang et al., 2021). Thus, optimizing agricultural practices to minimize CH4 emissions from soils is an effective approach for reducing the CF of rice fields. Reductions in the seasonal cumulative emissions of CH4 under DBRT were mainly attributed to improvements in soil bulk density and porosity by biaxial rotary tillage, which has a deeper tillage depth than DPURT and PURT; this improving soil redox properties and suppresses the activity of methanogenic bacteria (Li et al., 2014; Chen et al., 2019; Deng et al., 2022). The CF was lower and rice grain yield and soil carbon sequestration were higher under DBRT than under DPURT and PURT.
4.2. Energy budget
The total energy inputs in this study were 60345.4–60447.4 MJ ha−1, 60972.4–61074.4 MJ ha−1, and 59655.7–59757.7 MJ ha−1 under DBRT, DPURT, and PURT, respectively. These findings suggest that the one-time dryland biaxial rotary tillage operation did not increase energy input despite the fact that a higher horsepower farm machine was used for DBRT. Among all agricultural inputs, nitrogen fertilizer has the highest energy input (36,360 MJ ha−1), which accounted for approximately 59.5–60.9% of the total energy inputs. Thus, reducing the amount of N fertilizer by optimizing N fertilizer management, such as side-deep fertilization (Liu et al., 2020), reducing N application, and increasing planting density (Guan et al., 2022), is a key approach for reducing energy inputs and alleviating energy supply shortages in rice production.
The energy outputs in this study were considered to be the results of rice grain yield multiplied by grain price. The energy output was 7.6–9.2% and 17.7–19.7% higher under DBRT than under DPURT and PURT, respectively, and this was mainly driven by increases in rice grain yield. The higher grain yield under DBRT mainly stemmed from increases in tillage depth, which promoted the deep burial of straw, alleviated the toxic effect of straw decay on rice seedlings and competition for soil N (Shen et al., 2014; Zhang et al., 2021), and thus promoted the growth of rice seedlings. The greater tillage depth in DBRT facilitates the growth of the roots of rice plants at greater soil depths, which enhances nutrient uptake (Garnett et al., 2009; Lynch, 2013). Under DBRT, furrowing operations, biaxial rotary tillage, and ditching are performed in a one-time procedure; the effect of DBRT might thus be similar to that of ridge cultivation with no-tillage furrows. The capillarity of the soil contributes to the transfer of rain water collected in the ditch to the ridge surface soil, and this promotes the growth of rice plants (Wang et al., 2008; Sun et al., 2022). NE, EUE, EP, and SE are important indicators for evaluating the energy budget in agroecosystems (Dhawan et al., 2021). The NE, EUE, and EP were significantly higher under DBRT than under DPURT and PURT. This suggests that DBRT can enhance grain yield and energy outputs compared with DPURT and PURT.
4.3. Net ecosystem economic efficiency and outlook
The main motivation for farmers to adopt specific agricultural practices is economic benefits; by contrast, ecological benefits are a more important consideration for government policymakers (Gao et al., 2021; Kumar et al., 2021). Excellent agricultural measures not only have good economic benefits, but also help to promote ecosystem health and sustainability. Economic and ecological benefits were higher under DBRT than under DPURT and PURT, as rice grain yield was higher and GHG emissions were lower under DBRT than under DPURT and PURT.
A recent study has shown that biaxial deep rotary tillage and leveling can enhance the structure of the soil in paddy fields as well as economic benefits (Zhang et al., 2021). In this study, DBRT had lower CF, higher EUE and NEEB than DPURT and PURT. These results are mostly associated with the effects of deep rotary tillage, which increased rice grain yield and decreased greenhouse gas emissions. That results showed that deep rotary tillage can enhance the structure of both dryland and paddy field soil. However, high quality soil preparation requires deep rotary tillage with high horsepower farm machinery to complete, but many small farmers cannot afford the expensive price of high horsepower agricultural machinery. Thus, the development of market-based agricultural machinery leasing services is needed to make the equipment required to perform deep rotary tillage more accessible to a wider range of farmers. Reducting nitrogen application with increasing planting density, alternating wet and dry irrigation and other measures can help to further promote the productivity of rice fields, while reducing CF and energy inputs.
5. Conclusion
The tillage depth was higher and soil bulk density was lower under DBRT than under DPURT and PURT. The CF was lower under DBRT than under DPURT and PURT, and this was mainly associated with the increase in soil carbon sequestration under DBRT, which enhanced rice grain yield, reduced the total global warming potential, and reduced the seasonal cumulative emissions of CH4. The energy output, energy use efficiency, and grain yield were higher under DBRT than under DPURT and PURT. The net ecosystem economic efficiency was higher under DBRT than under DPURT and PURT, and this resulted in the production of more rice grains and reductions in GHG emissions from rice fields. In sum, DBRT is an energy-efficient tillage method that can enhance the productivity of rice fields while minimizing GHG emissions.
Data availability statement
The original contributions presented in the study are included in the article/Supplementary material, further inquiries can be directed to the corresponding authors.
Author contributions
ZX and HZ contributed to conception and design of the study. SC organized the database and wrote the first draft of the manuscript. CT, ML, and YF performed the statistical analysis. SC, ZX, and HZ wrote sections of the manuscript. All authors contributed to manuscript revision, read, and approved the submitted version.
Funding
This study was jointly supported by the Jiangsu Agriculture Science and Technology Innovation Fund [CX(20)1012], the Jiangsu Technical System of Rice Industry [JATS(2022)485], the National Natural Science Foundation of China (31801293) and a Project Funded by the Priority Academic Program Development of Jiangsu Higher Education Institutions (PAPD).
Conflict of interest
The authors declare that the research was conducted in the absence of any commercial or financial relationships that could be construed as a potential conflict of interest.
Publisher’s note
All claims expressed in this article are solely those of the authors and do not necessarily represent those of their affiliated organizations, or those of the publisher, the editors and the reviewers. Any product that may be evaluated in this article, or claim that may be made by its manufacturer, is not guaranteed or endorsed by the publisher.
Supplementary material
The Supplementary material for this article can be found online at: https://www.frontiersin.org/articles/10.3389/fsufs.2023.1169886/full#supplementary-material
References
Batjes, N. H. (1996). Total carbon and nitrogen in the soils of the world. Eur. J. Soil Sci. 47, 151–163. doi: 10.1111/j.1365-2389.1996.tb01386.x
Bruce, L., Kees, J. G., Maria, A. A. B., Cameron, P., and Chris, K. (2012). An agronomic assessment of greenhouse gas emissions from major cereal crops. Glob. Chang. Biol. 18, 194–209. doi: 10.1111/j.1365-2486.2011.02502.x
Cao, Y. S., Sun, H. F., Zhang, J. N., Chen, G. F., Zhu, H. T., Zhou, S., et al. (2018). Effects of wheat straw addition on dynamics and fate of nitrogen applied to paddy soils. Soil Till. Res. 178, 92–98. doi: 10.1016/j.still.2017.12.023
Chaudhary, V. P., Singh, K. K., Pratibha, G., Bhattacharyya, R., Shamim, M., Srinivas, I., et al. (2017). Energy conservation and greenhouse gas mitigation under different production systems in rice cultivation. Energy 130, 307–317. doi: 10.1016/j.energy.2017.04.131
Chen, Y., Li, S. Y., Zhang, Y. J., Li, T. T., Ge, H. M., Xia, S. M., et al. (2019). Rice root morphological and physiological traits interaction with rhizosphere soil and its effect on methane emissions in paddy fields. Soil Biol. Biochem. 129, 191–200. doi: 10.1016/j.soilbio.2018.11.015
Chen, J., Pang, D. W., Jin, M., Luo, Y. L., Li, H. Y., Li, Y., et al. (2020). Improved soil characteristics in the deeper plough layer can increase grain yield of winter wheat. J. Integr. Agr. 19, 1215–1226. doi: 10.1016/S2095-3119(19)62679-1
Chen, B. Q., Shahar, B., Dong, W. Y., He, W. Q., Liu, E. K., and Yan, C. R. (2021). Response of carbon footprint to plastic film mulch application in spring maize production and mitigation strategy. J. Integr. Agr. 20, 1933–1943. doi: 10.1016/S2095-3119(20)63278-6
Cheng, S., Xing, Z. P., Tian, C., Li, S. P., Tian, J. Y., Liu, Q. Y., et al. (2022). Effects of controlled release urea formula and conventional urea ratio on grain yield and nitrogen use efficiency of direct-seeded Rice. Agriculture 12:1230. doi: 10.3390/agriculture12081230
Chu, G., Wang, Z. Z., Zhang, H., Liu, L. J., Yang, J. C., and Zhang, J. H. (2015). Alternate wetting and moderate drying increases rice yield and reduces methane emission in paddy field with wheat straw residue incorporation. Food Energy Secur. 4, 238–254. doi: 10.1002/fes3.66
Cong, Q., Yang, Z., Xu, J., Ma, B., Chen, T., Zhang, X., et al. (2021). Design and test of load-lifting performance for hydraulic linkage of the high-medium horsepower tractor. Appl. Sci. 11:9758. doi: 10.3390/app11209758
De Notaris, C., Rasmussen, J., Sørensen, P., and Olesen, J. E. (2018). Nitrogen leaching: a crop rotation perspective on the effect of N surplus, field management and use of catch crops. Agric. Ecosyst. Environ. 255, 1–11. doi: 10.1016/j.agee.2017.12.009
Deng, J. Y., Deng, Y. L., Sun, Z. J., Wang, G., Cao, L. L., Yuan, H. F., et al. (2022). Tillage and residue management affect growing-season soil respiration in paddy fields. Soil Till. Res. 218, 105315–105326. doi: 10.1016/j.still.2022.105315
Dhawan, G., Dheri, G. S., and Gill, A. A. S. (2021). Nitrogen budgeting of rice-wheat cropping system under long-term nutrient management in an Inceptisol of North India. Eur. J. Agron. 130:126376. doi: 10.1016/j.eja.2021.126376
Ferraro, D. O., and Ghersa, C. M. (2007). Quantifying the crop management influence on arable soil condition in the inland Pampa (Argentina). Geoderma 141, 43–52. doi: 10.1016/j.geoderma.2007.04.025
Gao, J., Xu, C., Luo, N., Liu, X., Huang, S., and Wang, P. (2021). Mitigating global warming potential while coordinating economic benefits by optimizing irrigation managements in maize production. J. Environ. Manag. 298:113474. doi: 10.1016/j.jenvman.2021.113474
Garnett, T., Conn, V., and Kaiser, B. N. (2009). Root based approaches to improving nitrogen use efficiency in plants. Plant Cell Environ. 32, 1272–1283. doi: 10.1111/j.1365-3040.2009.02011.x
Guan, X. J., Chen, J., Chen, X. M., Xie, J., Deng, G. Q., Hu, L. Z., et al. (2022). Root characteristics and yield of rice as affected by the cultivation pattern of strong seedlings with increased planting density and reduced nitrogen application. J. Integr. Agric. 21, 1278–1289. doi: 10.1016/S2095-3119(20)63595-X
Gulab, S. Y., Rattan, L., Ram, S. M., Mrinmoy, D., Subhash, B., Anup, D., et al. (2017). Energy budgeting for designing sustainable and environmentally clean/safer cropping systems for rainfed rice fallow lands in India. J. Clean. Prod. 158, 29–37. doi: 10.1016/j.jclepro.2017.04.170
Gulab, S. Y., Subhash, B., Anup, D., Mohapatra, K. P., Raghavendra, S., Avasthe, R. K., et al. (2020). No-till and mulching enhance energy use efficiency and reduce carbon footprint of a direct-seeded upland rice production system. J. Clean. Prod. 271:122700. doi: 10.1016/j.jclepro.2020.122700
Huang, J. X., Chen, Y. Q., Sui, P., and Guo, W. S. (2013). Estimation of net greenhouse gas balance using crop- and soil-based approaches: two case studies. Sci. Total Environ. 456–457, 299–306. doi: 10.1016/j.scitotenv.2013.03.035
Kim, S. Y., Gutierrez, J., and Kim, P. J. (2016). Unexpected stimulation of CH4 emissions under continuous no-tillage system in mono-rice paddy soils during cultivation. Geoderma 267, 34–40. doi: 10.1016/j.geoderma.2015.12.021
Kumar, A., Rana, K. S., Choudhary, A. K., Bana, R. S., Sharma, V. K., Prasad, S., et al. (2021). Energy budgeting and carbon footprints of zero-tilled pigeonpea–wheat cropping system under sole or dual crop basis residue mulching and Zn-fertilization in a semi-arid agro-ecology. Energy 231:120862. doi: 10.1016/j.energy.2021.120862
Lal, B., Priyanka, G., Nayak, A. K., Panda, B. B., Bihari, P., Tripathi, R., et al. (2019). Energy and carbon budgeting of tillage for environmentally clean and resilient soil health of rice-maize cropping system. J. Clean. Prod. 226, 815–830. doi: 10.1016/j.jclepro.2019.04.041
Li, B., Fan, C. H., Zhang, H., Chen, Z. Z., Sun, L. Y., and Xiong, Z. Q. (2015). Combined effects of nitrogen fertilization and biochar on the net global warming potential, greenhouse gas intensity and net ecosystem economic budget in intensive vegetable agriculture in southeastern China. Atmos. Environ. 100, 10–19. doi: 10.1016/j.atmosenv.2014.10.034
Li, S. H., Guo, L. J., Cao, C. G., and Li, C. F. (2021). Integrated assessment of carbon footprint, energy budget and net ecosystem economic efficiency from rice fields under different tillage modes in Central China. J. Clean. Prod. 295:126398. doi: 10.1016/j.jclepro.2021.126398
Li, X. L., Ma, J., Yao, Y. J., Liang, S. L., Zhang, G. B., Xu, H., et al. (2014). Methane and nitrous oxide emissions from irrigated lowland rice paddies after wheat straw application and midseason aeration. Nutr. Cycl. Agroecosys. 100, 65–76. doi: 10.1007/s10705-014-9627-8
Liu, T. Q., Li, S. H., Guo, L. G., Cao, C. G., Li, C. F., Zhai, Z. B., et al. (2020). Advantages of nitrogen fertilizer deep placement in greenhouse gas emissions and net ecosystem economic benefits from no-tillage paddy fields. J. Clean. Prod. 263:121322. doi: 10.1016/j.jclepro.2020.121322
Luo, X. Q., Guo, Y. T., Wang, R., Wang, N. J., Li, C., Chu, X. S., et al. (2021). Carbon footprint of a winter wheat-summer maize cropping system under straw and plastic film mulching in the loess plateau of China. Sci. Total Environ. 794:148590. doi: 10.1016/j.scitotenv.2021.148590
Lynch, J. P. (2013). Steep, cheap and deep: an ideotype to optimize water and N acquisition by maize root systems. Ann. Bot. London 112, 347–357. doi: 10.1093/aob/mcs293
Min, S. P., Paudel, K., and Chen, F. B. (2021). Mechanization and efficiency in rice production in China. J. Integr. Agr. 20, 1996–2008. doi: 10.1016/S2095-3119(20)63439-6
Scott, J., and Stephen, B. (2020). The spread of smaller engines and markets in machinery services in rural areas of South Asia. J. Rural. Stud. 73, 10–20. doi: 10.1016/j.jrurstud.2019.11.013
Shan, Y. H., Cai, Z. C., Han, Y., Johnson, S. E., and Buresh, R. J. (2008). Organic acid accumulation under flooded soil conditions in relation to the incorporation of wheat and rice straws with different C:N ratios. Soil Sci. Plant Nutr. 54, 46–56. doi: 10.1111/j.1747-0765.2007.00218.x
Shang, Q., Cheng, C., Wang, J. J., Luo, K., Zeng, Y. J., and Yang, X. X. (2021). Net global warming potential, greenhouse gas intensity and carbon footprint as affected by different tillage systems from Chinese double-cropping paddy fields. Soil Till. Res. 209:104947. doi: 10.1016/j.still.2021.104947
Shen, J. L., Tang, H., Liu, J. Y., Wang, C., Li, Y., Ge, T., et al. (2014). Contrasting effects of straw and straw-derived biochar amendments on greenhouse gas emissions within double rice cropping systems. Agric. Ecosyst. Environ. 188, 264–274. doi: 10.1016/j.agee.2014.03.002
Sun, J., Wang, Z., Yadan, D., Zhang, E., Gan, H. C., Sun, D., et al. (2022). Optimized tillage improves yield and energy efficiency while reducing carbon footprint in winter wheat-summer maize rotation systems. Sci. Total Environ. 820:153278. doi: 10.1016/j.scitotenv.2022.153278
Tang, H. M., Li, C., Shi, L. H., Cheng, K. K., Wen, L., Li, W. Y., et al. (2022). Effects of short-term tillage managements on CH4 and N2O emissions from a double-cropping Rice field in southern of China. Agronomy 12:517. doi: 10.3390/agronomy12020517
Tian, J., Li, S., Xing, Z., Cheng, S., Liu, Q., Zhou, L., et al. (2022). Seedling establishment and yield performance of dry direct-seeded Rice after wheat straw returning coupled with early nitrogen application. Agronomy 12:565. doi: 10.3390/agriculture12040565
Wang, J., Akiyama, H., Yagi, K., and Yan, X. (2018). Controlling variables and emission factors of methane from global rice fields. Atmos. Chem. Phys. 18, 10419–10431. doi: 10.5194/acp-18-10419-2018
Wang, X. B., Cai, D. X., Hoogmoed, W. B., Oenema, O., and Perdok, U. D. (2006). Potential effect of conservation tillage on sustainable land use: a review of global long-term studies. Pedosphere 16, 587–595. doi: 10.1016/S1002-0160(06)60092-1
Wang, Z. Q., Gu, D. J., Beebout, S. S., Zhang, H., Liu, L. J., Yang, J. C., et al. (2018). Effect of irrigation regime on grain yield, water productivity, and methane emissions in dry direct-seeded rice grown in raised beds with wheat straw incorporation. Crop J. 6, 495–508. doi: 10.1016/j.cj.2018.05.004
Wang, Q., Zhang, E. H., Li, F. M., and Li, F. R. (2008). Runoff efficiency and the technique of micro-water harvesting with ridges and furrows, for potato production in semi-arid areas. Water Resour. Manag. 22, 1431–1443. doi: 10.1007/s11269-007-9235-3
Yu, X. F., Zhang, Q., Gao, J. L., Wang, Z. G., Borjigin, Q., Hu, S. P., et al. (2019). Planting density tolerance of high-yielding maize and the mechanisms underlying yield improvement with subsoiling and increased planting density. Agronomy 9, 370–386. doi: 10.3390/agronomy9070370
Zhang, Z. S., Guo, L. J., Liu, T. Q., Li, C. F., and Cao, C. G. (2015). Effects of tillage practices and straw returning methods on greenhouse gas emissions and net ecosystem economic budget in rice–wheat cropping systems in Central China. Atmos. Environ. 122, 634–644. doi: 10.1016/j.atmosenv.2015.09.065
Zhang, Y. F., Liu, J., Yuan, W., Zhang, R. H., and Xi, X. B. (2021). Multiple leveling for Paddy field preparation with double Axis rotary tillage accelerates Rice growth and economic benefits. Agriculture 11:1223. doi: 10.3390/agriculture11121223
Keywords: rice fields, combined tillage method, carbon footprint, energy budget, net ecosystem economic efficiency
Citation: Cheng S, Xing Z, Tian C, Liu M, Feng Y and Zhang H (2023) Effects of tillage method on the carbon footprint, energy budget, and net ecosystem economic efficiency of rice fields. Front. Sustain. Food Syst. 7:1169886. doi: 10.3389/fsufs.2023.1169886
Edited by:
Chengfang Li, Huazhong Agricultural University, ChinaReviewed by:
Jinfei Feng, Chinese Academy of Agricultural Sciences, ChinaCougui Cao, Huazhong Agricultural University, China
Zhenwei Song, Chinese Academy of Agricultural Sciences, China
Copyright © 2023 Cheng, Xing, Tian, Liu, Feng and Zhang. This is an open-access article distributed under the terms of the Creative Commons Attribution License (CC BY). The use, distribution or reproduction in other forums is permitted, provided the original author(s) and the copyright owner(s) are credited and that the original publication in this journal is cited, in accordance with accepted academic practice. No use, distribution or reproduction is permitted which does not comply with these terms.
*Correspondence: Zhipeng Xing, enB4aW5nQHl6dS5lZHUuY24=; Hongcheng Zhang, aGN6aGFuZ0B5enUuZWR1LmNu