Abstract
Climate change poses a greater threat for more exposed and vulnerable countries, communities and social groups. People whose livelihood depends on the agriculture and food sector, especially in low- and middle-income countries (LMICs), face significant risk. In contexts with gendered roles in agri-food systems or where structural constraints to gender equality underlie unequal access to resources and services and constrain women’s agency, local climate hazards and stressors, such as droughts, floods, or shortened crop-growing seasons, tend to negatively affect women more than men and women’s adaptive capacities tend to be more restrained than men’s. Transformation toward just and sustainable agri-food systems in the face of climate change will not only depend on reducing but also on averting aggravated gender inequality in agri-food systems. In this paper, we developed and applied an accessible and versatile methodology to identify and map localities where climate change poses high risk especially for women in agri-food systems because of gendered exposure and vulnerability. We label these localities climate-agriculture-gender inequality hotspots. Applying our methodology to LMICs reveals that the countries at highest risk are majorly situated in Africa and Asia. Applying our methodology for agricultural activity-specific hotspot subnational areas to four focus countries, Mali, Zambia, Pakistan and Bangladesh, for instance, identifies a cluster of districts in Dhaka and Mymensingh divisions in Bangladesh as a hotspot for rice. The relevance and urgency of identifying localities where climate change hits agri-food systems hardest and is likely to negatively affect population groups or sectors that are particularly vulnerable is increasingly acknowledged in the literature and, in the spirit of leaving no one behind, in climate and development policy arenas. Hotspot maps can guide the allocation of scarce resources to most-at-risk populations. The climate-agriculture-gender inequality hotspot maps show where women involved in agri-food systems are at high climate risk while signaling that reducing this risk requires addressing the structural barriers to gender equality.
1. Introduction
Climate change can undermine global efforts to transform food systems such that they enable the provision of affordable and nutritious food for all in environmentally sustainable ways. Agri-food systems—including cropping, livestock, forestry, fishery and aquaculture sectors—face direct stress from climate change through increases in temperature, variation in precipitation patterns and weather anomalies, and the intensified frequency of extreme weather events. Agricultural production is projected to experience reduced crop suitability and yields, crop failure, pest and disease outbreaks (IPCC, 2019). Livestock production and pastoralism is projected to experience lower pasture and animal productivity, damaged reproductive function, and biodiversity loss (McGahey et al., 2014; IPCC, 2019). Globally, over one billion people rely on agri-food systems to sustain their livelihoods. Climate change affects everyone engaged in agri-food systems. Smallholder farmers in low- and middle-income countries (LMICs) who mainly depend on agriculture for food, incomes and livelihoods are at particular risk, especially those in tropical and subtropical regions where climate change is pronounced and acute (De Souza et al., 2015; Amjath-Babu et al., 2019; Schipper et al., 2022).
Climate change also compromises gender equality. Women comprise up to 48 percent of the rural agricultural labor force in low-income countries [Food and Agriculture Organization of the United Nations (FAO), 2020] and over 55 percent in parts of South Asia and Africa [United Nations Women (UN Women), 2020]. They play a crucial role in agri-food systems as agents of food and nutritional security, smallholder farmers and livestock keepers, as well as managers of natural resources (Allen et al., 2018; Njuki et al., 2022). Women also make substantial contributions to climate change adaptation practices such as crop diversification, water harvesting, small-scale irrigation, improved livestock feeding and improved grain storage (Kristjanson et al., 2017; Bryan et al., 2021). Yet, evidence shows that, in many cases, women in agri-food systems in LMICs face higher climate risk than men. In various contexts, prevailing gender norms and associated dynamics at work in agri-food systems underlie gender differentiated climate change impact and resilience at the disadvantage of women (Bryan et al., 2023).
Climate-related hazards affecting agri-food systems and gender-differentiated exposure and vulnerabilities do not exist discretely. They often overlap and interact with each other in complex ways specific to the local context and conditions. Understanding these locally specific interactions is essential to inform actions aiming to effectively improve the coping and adaptation mechanisms of those who are most at risk, which are often women, as well as empower them (Chanana-Nag and Aggarwal, 2018). This is important for the intrinsic value of gender equality and women’s empowerment. It can also unlock gender agency and enable women as agents of change for climate sustainability outcomes and climate resilience in agri-food systems.
Prior evidence of hotspot mapping bringing together climate risk and gender include Khatri-Chhetri et al. (2017) who identify potential labor saving climate-smart agriculture technology for women farmers in high climate risk localities. Chanana-Nag and Aggarwal (2018) provide a methodology to identify women in agriculture and climate risk hotspots to better target climate change adaptation interventions. Rao et al. (2019b) explore the relationship between women’s agency and adaptation responses in different localities that have been identified as climate hotspots.
The main objective of this paper is to provide a viable, robust, efficient, and parsimonious methodology to combine different data types and sources to obtain a reliable estimate of the spatial distribution of the gender-related risk through the convergence of hazard and gender-differentiated exposure and vulnerability of agricultural involvement in relation to climate change. Our methodology draws on insights from different disciplines – climate change research and research on gender in agri-food systems – to identify and map localities where climate change poses high risk especially for women in agri-food systems because of gendered exposure and vulnerability. We label these localities climate-agriculture-gender inequality hotspots. To ensure the accessibility and versatility of the methodology, we use publicly accessible, cross-country comparable, (sub-)nationally representative secondary data and user-friendly data analysis and mapping methods.
Fostering an enabling environment for gender equality in the face of climate change does not stop with the identification of climate-agriculture-gender inequality hotspots. As a way of informing policy or interventions supporting women’s adaptive and resilience capacities and climate action targeted at localities where women are at high climate risk, next steps can include, but are not limited to: (i) a validation of the locality as a hotspot using secondary case study evidence (see Section 4.2); (ii) an analysis of the main contributing components – hazards, exposure, vulnerability – based on the data used for identifying hotspots; (iii) in-depth case studies in hotspot localities of the way agri-food system outcomes, climate resilience capacities and gender inequalities intersect, as well as the prevalent policies; and (iv) pilot studies testing the potential of interventions or policy to support gender equality in adaptive and resilience capacities and climate action in hotspot localities. As part of a wider research project, in-depth case studies and pilot testing of interventions have been conducted in sub-national hotspot areas in Zambia and Bangladesh.
The paper is structured as follows: We start with developing a methodological framework, after which we explain the methodology for identifying and mapping climate–agriculture–gender inequality hotspot countries and subnational areas. We proceed with the results of applying our methodology and their interpretation, followed by a discussion and conclusion.
2. A methodological framework for identifying hotspots where women in agri-food systems are at highest climate risk
The framework of risk proposed by the Fifth Assessment Report of the Intergovernmental Panel on Climate Change (IPCC) (2014)1 forms the basis of the methodological framework for the climate–agriculture–gender inequality hotspots as defined in this paper (see Box 1).
BOX 1 Definitions of risk, hazards, exposure and vulnerability in relation to climate change.
Risk is defined as the potential for adverse consequences for human or ecological systems. Risk can “arise from potential impacts of climate change as well as human responses to climate change” (IPCC, 2020). Risk in relation to climate change results from the dynamic interaction between climate-related hazards, exposure and vulnerability of the affected human or ecological system to the hazards (IPCC, 2014).
Hazards refer to factors indicating the current or future hazards induced by climate change that a system may experience (IPCC, 2014; Malakar et al., 2021).
Exposure consists of factors indicating the presence of people, livelihoods, ecosystems or any kind of asset which may be affected by the hazard (Malakar et al., 2021).
Vulnerability, or the predisposition to be adversely affected, is driven by a combination of sensitivity to harm caused by hazards and a lack of capacity to cope and adapt (Sharma and Ravindranath, 2019).
A gender perspective on climate change affecting agri-food systems is important for two reasons. Recent conceptual frameworks linking climate change, gender and agri-food systems lay out that, on the one hand, climate related hazards affect women and men involved in agri-food systems differently (Kristjanson et al., 2017; Theis et al., 2019). Part of the differential impacts on men and women can be directly linked to differences in exposure to climate hazards (Bryan et al., 2023). On the other hand, women and men experience different vulnerability. There are gender differences in sensitivity to harm caused by climate related hazards (Bryan et al., 2023). Indirectly, the institutional context (i.e., the formal and informal ‘rules of the game’ governing human interaction) and actions taken to address negative effects can be at the source of differential sensitivity to harm and impacts on men and women. In many cases, women and men also have different capacities to cope with and adapt to climate change to keep producing adequate food and earning a living (Bryan et al., 2023). Coping and adaptive capacities are influenced by user characteristics and access to information and technology, which tend to differ between men and women. The biophysical and institutional context can influence adaptive capacities; but often in different ways for women and men (Kristjanson et al., 2017). Gender differences in adaptive capacities are also strongly tied to a gendered decision-making context and people’s ability to negotiate a response option to climate change (Theis et al., 2019).
To refine the methodological framework for identifying hotspots where women in agri-food systems are at high climate risk, we build on evidence of gendered exposure and vulnerability to climate hazards. We proceed with presenting this evidence.
2.1. Evidence of gendered exposure to climate related hazards
While many people in LMICs face significant climate risks because of their dependency on an exposed agricultural sector (or stage of a value chain), climate-related hazards are locally specific and are experienced differently by social groups differentiated by gender, age, ethnicity, wealth, class and/or disability (Nelson et al., 2002; Vincent and Cull, 2014). In many contexts, gender is an important determinant of exposure to climate related hazards affecting agri-food systems Neumayer and Plümper (2007) demonstrated that natural disasters—including climate hazards, such as droughts, extreme temperatures, floods, and windstorms—lower women’s life expectancy partly in a direct way by killing more women than men. Erman et al. (2021) refer to evidence of higher disaster-related mortality rates among men than among women which are linked to gender differential exposure for instance because of higher male involvement in search and rescue during disasters or in outdoor occupations such as construction or forestry. Socio-economic status and location are other important determinants of exposure. Informal settlements housing poor urban populations, like in Kenya or Bangladesh for instance, tend to be located near rivers, flood plains or in valleys which exposes these populations to floods (Hossain et al., 2012; Otieno, 2016). Poorer segments of the rural population tend to occupy more marginalized lands and areas more prone to natural disasters, which is the case in coastal areas of Bangladesh that are hard hit by climate hazards (Hossain et al., 2012).
Exposure of agri-food systems to climate change in LMICs affects women because of their significant involvement in the sector. In low-income countries, women are estimated to comprise up to 48 percent of the rural agricultural labor force [Food and Agriculture Organization of the United Nations (FAO), 2020]; over 55 percent in some parts of South Asia and Africa [United Nations Women (UN Women), 2020]. Agricultural households in LMICs often depend highly on women’s labor in subsistence or cash-crop production or for other agricultural activities—as producers, wage workers, and providers of (unpaid) family labor (Nelson et al., 2002; Eastin, 2018). At the same time, in many cases, women carry out most of the care work.
Besides, the socioeconomic context and cultural norms influence gendered preferences for cultivating certain crops and the adoption of management practices. Evidence from sub-Saharan Africa shows that some crops are disproportionately grown by men or by women and that women are more likely to grow crops with less complicated production techniques (Doss, 2002; de Brauw, 2015). This can be another reason for gender-differentiated exposure to climate hazards.
2.2. Evidence of gendered sensitivity to harm
In many contexts, gender is an important determinant of sensitivity to harm caused by hazards. For instance, women and girls are found to be more likely than men to go hungry following natural disasters linked to climate change (FAO, 2017; Oxfam, 2019). In India, for example, twice the number of women than men reported eating less in response to a drought (Lambrou and Nelson, 2010). Neumayer and Plümper (2007) argue that part of the reasons why women are more likely to be killed by natural disasters is a higher sensitivity to harm because of a lower socioeconomic status, limited access to warning information and shelter and restrained agency for making decisions about a hazard event.
Climate hazards can negatively impact people’s assets which are critical for their livelihood as well as their resilience in gender differentiated ways. For instance, drought in Uganda, where women are highly involved in agriculture, had an important negative impact on women’s assets, particularly their non-land assets (Quisumbing et al., 2018). In Bangladesh, women reported losing household resources, farm-equipment and various other assets in the aftermath of a cyclone (Alam and Rahman, 2014). In pastoral communities like the Samburu in Kenya, for instance, gender roles assign livestock and livestock management to men and homestead development and farming to women (Ongoro and Ogara, 2012). When livestock drowns due to floods this mainly affects men. Floods affect women by destroying their homesteads and gardens.
There is also evidence of more indirect gendered sensitivity to harm. For instance, in the aftermath of a natural hazard, healthcare services are impaired, which, like in the case of Pakistan, exacerbated a situation of limited health care for women [United Nations Population Fund (UNFPA), 2011]. There is also evidence of a significant rise in cases of human trafficking, sexual slavery and gender-based violence in the aftermaths of a climate hazard (Cameron et al., 2021).
2.3. Evidence of gendered capacities to cope with and adapt to climate related hazards
Both women and men in LMICs face significant climate risks. Yet, women’s relative economic, social, cultural and political marginalization, their lower access to productive resources, technology, markets, finance and information and prevailing discriminatory sociocultural norms and gender roles cumulatively put women in a disadvantaged position in coping with and adapting to climate hazards (Perez et al., 2015; Huyer, 2016; Chanana-Nag and Aggarwal, 2018; IPCC, 2019).
Various socio-economic and cultural factors limit women’s ability to cope with and adapt to climate related hazards (Huyer, 2016; Chanana-Nag and Aggarwal, 2018). Formal policy can influence coping and adaptive capacities (Kristjanson et al., 2017). For example, a study by Paudyal et al. (2019) shows that only two of twenty policy documents on climate change in Nepal deal with integration of gender and climate change impacts, which risks exacerbating existing gender inequalities. Discriminatory social institutions, including, for instance, formal inheritance laws or informal customary rules disadvantaging women in land rights set barriers to women’s equal access to resources. Such institutions, as well as discriminatory social norms and gender roles, further restrict women’s agency and their ability to make decisions —both at household and community levels (Yadav and Lal, 2018; Evertsen and van der Geest, 2020; Aita and Ahmed, 2022).
Access, ownership and control over financial and productive resources, including land, are important for women farmers’ capacities to cope with and adapt to climate change and shocks affecting agri-food systems. However, there is ample evidence that women have fewer and lower-value assets, less access to capital and (paid and unpaid family) labor, limited land ownership and fewer agricultural inputs (Nchu et al., 2019; Anugwa et al., 2020; Diouf et al., 2020). There is also evidence that women tend to be more dependent on natural resources as compared to men as they have limited options for livelihood diversification (Osman-Elasha, 2012).
Even where women have access to resources, they may not have the agency to use and control the resources they need to adapt to climate change impacts (Akter et al., 2016; Acosta et al., 2019; Duffy et al., 2021). In Bangladesh, for instance, women are less likely to diversify into viable livelihood options in the face of climate shocks due to restrictive social norms, lack of education, and limited access to productive resources (Rabbani et al., 2015).
Women’s often more restricted access to information results in lower awareness and knowledge of climate risk, making women less prepared than men (Partey et al., 2018; Gumucio et al., 2020). It also limits their ability to adopt strategies to cope with or adapt to climate related hazards (Bernier et al., 2015; Bryan et al., 2021). In Burundi, for example, men were found to adopt technical innovations, such as disease management practices for banana crops, faster than women because they have more access to information and farmer learning groups (Iradukunda et al., 2019). In Uganda, Ghana and Bangladesh, Jost et al. (2016) found that women use fewer climate sustainable agricultural practices than men because of limited access to information and extension services, resource constraints and sociocultural norms and practices that restrict women’s participation in training programs.
In many contexts, social norms tend to limit particularly women’s ability to participate in group activities, move freely, and use specific technologies or practices—reducing their capacity to respond to climate-related stresses (Bryan et al., 2017). In parts of Africa, even if they are member of community groups, women are often unable to benefit to the same extent as men due sociocultural factors determining who owns land, who is head of a household, who has domestic responsibilities (Ngigi et al., 2017; Acosta et al., 2019; Tsige et al., 2020).
Furthermore, climate-related changes in cropping patterns and livestock production have been observed to affect the gendered division of labor and increase the farm, household and care workload of women (Eastin, 2018; Rao et al., 2019a). Outmigration, a climate change adaptation strategy adopted especially by men, tends to be associated with increased labor responsibilities for women but not necessarily with improved access to finance, social networks or knowledge (Rao et al., 2020). Faced with male outmigration, poor women in South Africa have been observed to adopt diversification strategies and take on extra workloads (Babugura, 2020). In India, women in poverty and women belonging to the lower castes or ethnic minorities have been found to face both increased work burdens and loss of social and economic support due to climate change (Rao and Mitra, 2013).
In many contexts, capacities to cope with and adapt to climate related hazards also differ by intersecting social differences related to, among others, age, education, marital status, wealth, class, caste or ethnicity (Fisher and Carr, 2015; Djoudi et al., 2016; Van Aelst and Holvoet, 2016; Acosta et al., 2021; Nhat Lam Duyen et al., 2021). Overlooking such differences linked to intersectional identities risks ill-adapted support and policy or, worse, exacerbating inequalities and vulnerabilities (Lau et al., 2021).
2.4. A climate risk framework with a gender perspective
As a methodological framework, we adopt a climate risk framework with a gender perspective that builds on (i) the IPCC risk framework (2014); (ii) the conceptual frameworks linking climate change, gender and agri-food systems discussed in Kristjanson et al. (2017), Theis et al. (2019) and Bryan et al. (2023); and (iii) the evidence of gendered exposure and vulnerability we reviewed here. The framework is visualized in Figure 1.
Figure 1
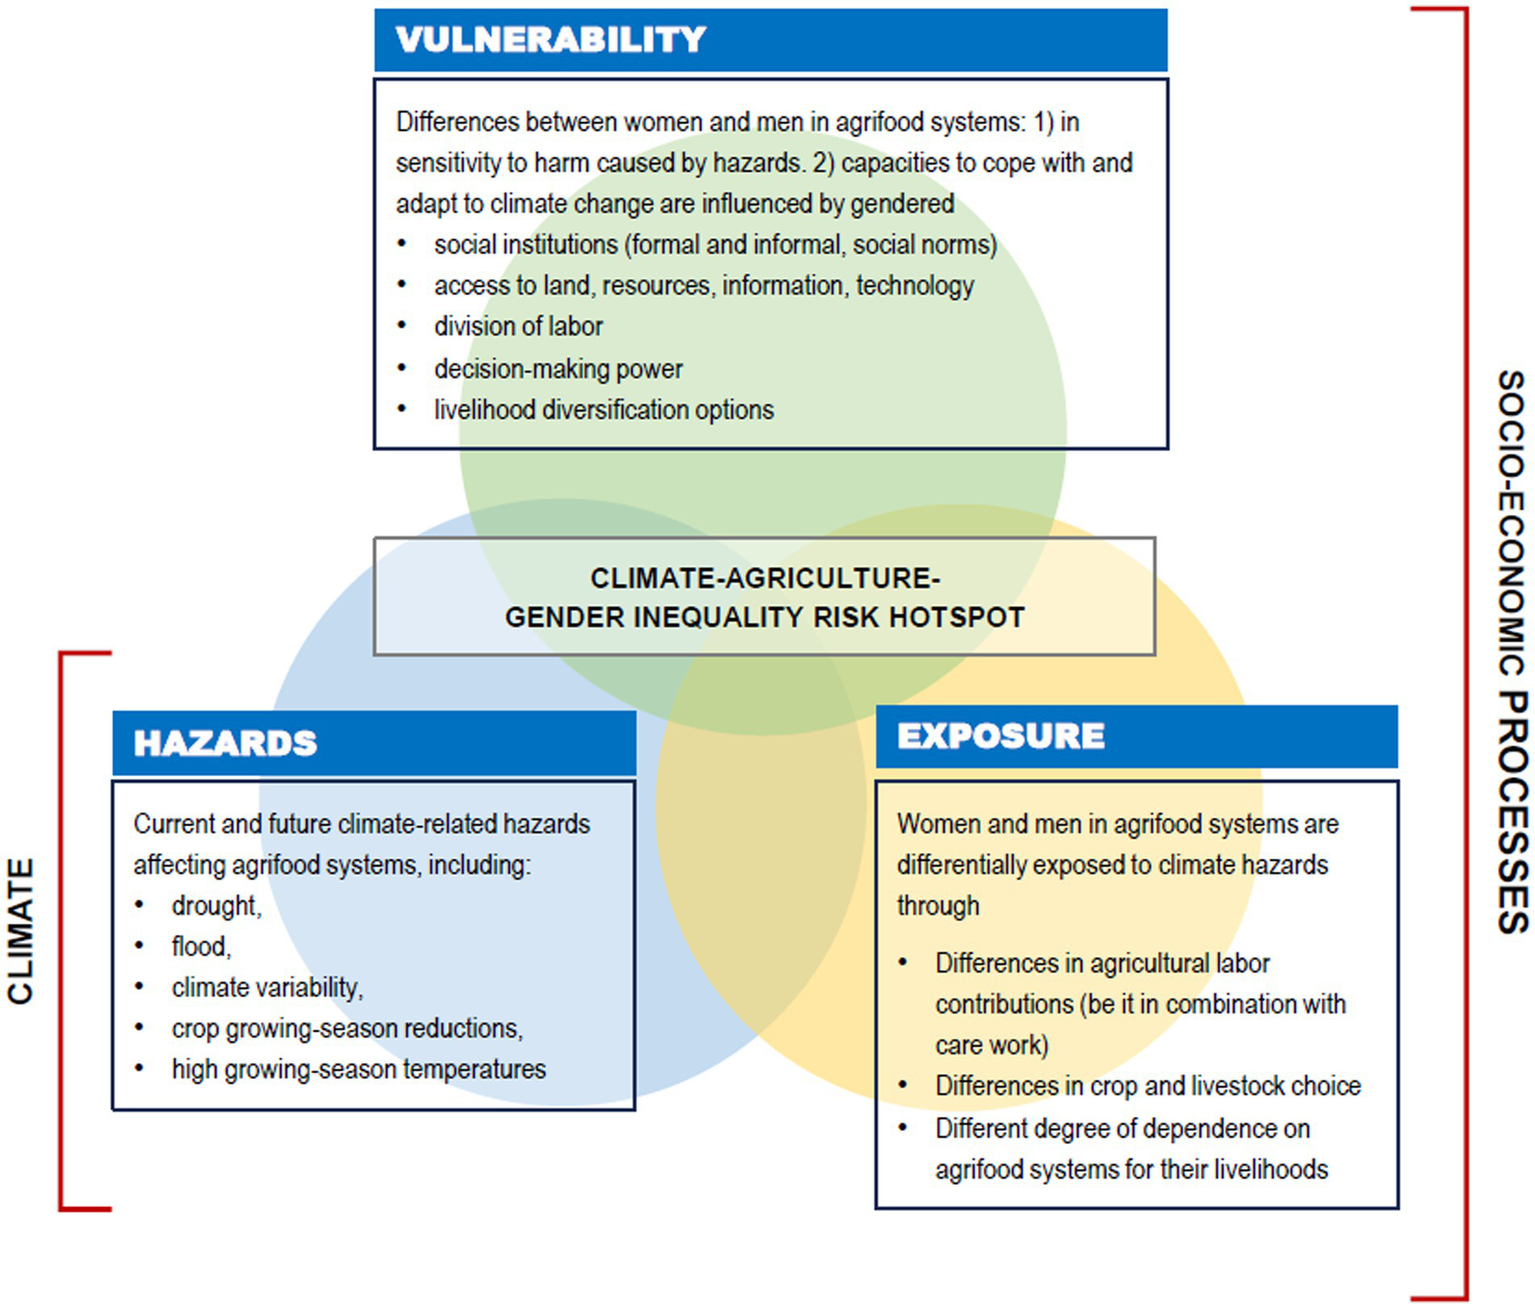
Climate–agriculture–gender inequality hotspot where climate hazards, high exposure and high vulnerability converge for women in agri-food systems.
Climate-related hazards, as natural and weather phenomena, are not gendered, but exposure and vulnerability are. Women and men in agrifood systems tend to be differentially exposed to climate hazards because of differences in labor involvement in agrifood systems. Differences between women and men in agrifood systems in sensitivity to harm caused by climate related hazards as well as in capacities to cope with and adapt to climate change are influenced by: (i) gendered access to land, assets, other resources, information, and technology; (ii) gendered division of labor; (iii) gender differences in livelihood diversification; (iv) gendered social institutions including formal laws and regulations as well as social norms and gender roles; (v) gender differences in decision making power. If prevailing gender inequalities particularly disadvantage women, they tend to face high sensitivity to harm and limited adaptive and resilience capacities.
We define climate–agriculture–gender inequality hotspots as geographic areas where climate change poses high risk to agri-food systems and has gendered implications, affecting especially to women, because these systems concurrently experience: (i) high levels of climate hazards (potentially) affecting agri-food systems, agricultural and/or livestock production in particular; (ii) high exposure experienced by women because of their labor involvement in agri-food systems; and (iii) high levels of vulnerability faced especially by women because of prevailing gender inequalities that cause high sensitivity to harm and limited adaptive and resilience capacities of women in these agri-food systems.
3. Materials and methods
The methodology for identifying and mapping climate–agriculture–gender inequality hotspots takes a two-step approach. We first identify climate–agriculture–gender inequality hotspot LMICs and, subsequently, climate–agriculture–gender inequality hotspot subnational areas in a selection of four hotspot LMICs. The method for identifying hotspot LMICs and subnational hotspot areas in selected hotspot countries follow the same framework and procedures, but, due to data limitations, partly differ in the data and extent of detail in the data used for measuring the components that define climate–agriculture–gender inequality hotspots. We use publicly accessible large socioeconomic datasets with geospatial information representative at country level for identifying hotspot LMICs and representative at the first level of administrative division for subnational hotspot areas.
In what follows, we discuss the methodological framework, the indicators and methods for defining, ranking and mapping climate–agriculture–gender inequality hotspot countries and subnational areas.
3.1. Indicator of climate hazards
Table 1 includes an overview of the indicators of climate hazards (Section 3.2), exposure (Section 3.3), and vulnerability due to gender inequalities (Section 3.4) used for defining climate–agriculture–gender inequality hotspots at national and subnational levels. Values of the national level indicators per LMIC are included in Appendix A, values of the subnational level (sub-)indicators in the Supplementary materials.
Table 1
| Factors of risk | Indicators for identification of climate–agriculture–gender inequality hotspot countries | Indicators for identification of climate–agriculture–gender inequality subnational hotspot areas (First administrative division) |
|---|---|---|
| Climate hazards | Share of rural population under projected climate risks aggregated at the country level (Tatem, 2017; EC-JRC, 2019; Jarvis et al., 2021) | Share of rural population under projected climate risks aggregated at the subnational-level (First administrative division) (Tatem, 2017; EC-JRC, 2019; Jarvis et al., 2021) |
| Exposure | Gender participation in agriculture: Share of women employed in agriculture (national figure) [Labor Force Surveys (LFS)] | Composite index of gender participation in agriculture constructed from the following sub-indicators aggregated at the first administrative division:
|
| Vulnerability due to gender inequalities | Social Institutions and Gender Index 2014 (OECD, 2014) which captures five dimensions of discriminatory social institutions that drive gender inequalities in social and economic outcomes, including:
| Composite index constructed from the following sub-indicators aggregated at the first administrative division:
|
Indicators of hazard, exposure and vulnerability used to define climate–agriculture–gender inequality hotspots at national and subnational levels.
For the purposes of this paper, hazards are based on the predominant ‘Climate Hazard Types’ data developed by the CGIAR Research Program on Climate Change, Agriculture and Food Security (CCAFS). This comprises five types of climate hazards relevant to changes in crop suitability including drought, flood, climate variability, crop growing-season reductions, and high growing-season temperatures (under warming scenario RCP 8.5 or ‘business as usual’ by the year 2050), as well as their combinations (Jarvis et al., 2021).2
For the indicator of climate hazards, we use the share of rural population facing any of the five types of climate hazards or their combinations to approximate the climate impacts on agrifood systems, assuming their livelihoods mainly depend on agriculture and/or livestock production activities. To estimate the rural population facing climatic hazards across LMICs, the gridded population headcount and the extent of urban and rural areas with the geospatial data layer of CCAFS Climate Hazard Types have been overlaid at 10 kilometers grids resolution (Tatem, 2017; EC-JRC, 2019). We generate this indicator of climate hazards at the country level, as well as at the first level of subnational administrative boundaries.
3.2. Indicators of exposure
Exposure to climate hazards and stressors affecting agri-food systems faced by women is proxied by the extent to which women, as compared to men, are involved in crop and/or livestock farming. Given the presence of contextual gender patterns in crop and commodity choices and responsibilities (Doss, 2002; de Brauw, 2015), it is assumed that exposure to climate hazards affecting agri-food systems particularly concerns women where they are heavily involved in agriculture and/or livestock production by providing a relatively large share of labor.3
At the national level, exposure of agri-food systems faced by women is measured by women’s relative participation in agricultural employment—that is, the share of female agricultural workers out of the total agricultural workers.
To measure exposure at the subnational level (first level of administrative division), we construct composite indices for six agricultural activities from three sub-indicators of exposure faced by women. These sub-indicators (i) the relative importance in the local economy of each of the six agricultural activities measured by overall labor participation in the particular activity, regardless of gender; (ii) the agricultural activity-specific women’s share of labor participation4; and (iii) the agricultural activity-specific share of hours worked by women (relative to men) capturing effort intensity.5 The six agricultural activities include6: (i) cereals, leguminous crops and oilseeds; (ii) rice; (iii) vegetables, melons, roots and tubers; (iv) perennial crops; (v) livestock; and (vi) mixed farming.7
Data for these indicators (national and sub-national first administrative level) are obtained from the latest nationally representative Labor Force Survey (LFS) datasets retrieved from the World Development Indicators database (The World Bank, 2021).
We use a Principal Component Analysis (PCA)-based method described in Filmer and Pritchett (2001) to construct the composite indices based on the three (standardized) sub-indicators capturing agricultural-activity specific exposure.8
3.3. Indicators of vulnerability due to gender inequalities
Vulnerability of agri-food systems faced particularly by women follows from prevailing gender inequalities and structural constraints to gender equality. These make the propensity of adverse effects of climate hazards higher for women by increasing the sensitivity to harm caused by hazards and limiting women’s capacity to cope with and adapt to climate hazards and stressors.
At the national level, vulnerability faced by women in agri-food systems due to gender inequalities is proxied by the Social Institutions and Gender Index (SIGI) 2014, which “measures gender-based discrimination in social institutions − social norms, practices and laws” at formal and informal systemic levels, and “takes stock of the underlying structural barriers that deny women’s rights and their access to justice, resources and empowerment opportunities” (OECD, 2014, p. 1). It distinguishes five broad dimensions of discriminatory social institutions that restrict women’s access to opportunities, resources and power including discriminatory family code, restricted physical integrity, son bias, restricted resources and assets, and restricted civil liberties (OECD, 2014). The higher the value of the SIGI the more discriminatory vis-a-vis women.9 With SIGI 2014 as a proxy, we capture the structural gender inequalities that are at the basis of high sensitivity to harm and limited coping and adaptive capacities of women in agri-food systems.10
As a subnational level SIGI 2014 is not available, we construct a composite index of a set of four sub-indicators measured at the subnational level (first level of administrative division) to capture vulnerability faced by women in agri-food systems due to gender inequalities. This composite index includes (i) the Subnational Gender Development Index (SGDI) 2019 and components of the SIGI 2014 that can be proxied using (the latest available) publicly accessible data including (ii) prevalence of child marriage; (iii) prevalence of gender-based violence; and (iv) missing women (son bias).11
The first sub-indicator, SGDI, is an indicator of the relative human development achievements in three basic dimensions of human development, including education, health and standard of living, of women as compared to men (Global Data Lab, 2019).12 In the spirit of its origins in the capability approach, we use SGDI as an indicator of women’s versus men’s capabilities for a long and healthy life (health), access to knowledge (education), and a decent standard of living (income). The data for the selected four focus hotspot countries—namely Mali, Zambia, Pakistan and Bangladesh (see Section 4)—are extracted from the SGDI Database of the Global Data Lab for the year 2019 (Global Data Lab, 2020).
The second sub-indicator is the prevalence of child marriage among girls aged 15–19 years reflecting the SIGI 2014 dimension of discriminatory family code. It is based on the 2018 LFS for Mali, Zambia and Pakistan; and the 2013 LFS for Bangladesh.13
The third sub-indicator is the prevalence of gender-based violence experienced by women aged 15–49 years over their lifetime reflecting the dimension of restricted physical integrity. It is based on data from the 2018 Demographic and Health Surveys for Mali, Zambia, and Pakistan, and the 2015 Bangladesh Integrated Household Survey.14
The fourth sub-indicator is the ratio of male children to female children between zero and four years old reflecting the dimension of missing women (son bias). National Census data are used to construct this indicator [2010 for Zambia, 2009 for Mali, 2011 for Bangladesh, and 2017 for Pakistan, retrieved through the Integrated Public Use Microdata Series (IPUMS), 2020; Minnesota Population Center, 2020].
We similarly use the PCA-based method by Filmer and Pritchett (2001) to construct a composite index based on the four sub-indicators capturing vulnerability faced by women in agri-food systems due to gender inequalities.
3.4. Defining, ranking and mapping by climate–agriculture–gender inequality hotspot index values
First, we define climate–agriculture–gender inequality hotspot LMICs in Latin America, Asia, and Africa. To construct a climate–agriculture–gender inequality hotspot risk index at the national level, we use an index based on averages of the standardized component variables, as only three factors -related to climate hazard, exposure, and vulnerability due to gender inequality- are used to rank countries along these dimensions. This climate–agriculture–gender inequality hotspot risk index captures the convergence of climate hazards, exposure and vulnerability in agri-food systems faced by women.
As the index is ordinal and standardized, we can rank countries15 by their climate–agriculture–gender inequality hotspot risk index value (see Appendix A). We then illustrate the ranking on a global map using color codes for relative high or low risk of each country.16
As a robustness test, we constructed two alternative national level climate–agriculture–gender inequality hotspot risk indices, one using the PCA-based method described in Filmer and Pritchett (2001) (see Footnote 8) and another using the method described in Anderson (2008).17 We ran similar correlation, rank correlation and classification difference tests as Filmer and Pritchett (2001). These lead us to conclude our hotspot risk index based on the average of the standardized component variables is relatively robust to index construction methods (see Appendix B).18
Secondly, we define climate–agriculture–gender inequality hotspot subnational areas in a selection of four focus hotspot countries in Africa and Asia where data representative at the subnational level are available. For these focus hotspot countries, we construct six agricultural activity-specific climate–agriculture–gender inequality hotspot risk indices at the subnational level, using the method described in Anderson (2008) (see Footnote 18). These indices are based on: (1) the climate hazards indicator; (2) the six composite agricultural activity-specific indices of exposure experienced by women; and (3) the composite index of vulnerability due to gender inequalities.19. The index values of each agricultural activity-specific climate–agriculture–gender inequality hotspot index are available in Appendix D.
As a robustness test for the agricultural activity-specific subnational level climate–agriculture–gender inequality hotspot risk indices based on the Anderson (2008) method, we constructed alternative indices using averages of the standardized component variables and the PCA-based method. Similar tests as above show reasonable robustness of the subnational agricultural activity-specific hotspot risk indices to index construction method (see Appendix E).20
In this paper, we included the agricultural activity-specific data of all subnational areas of all four focus countries in the construction of the hotspot risk indices. This implies the index values are relative to all subnational areas across the four focus countries. The relative ranking computed across countries is helpful for international policy makers and donors alike in taking decisions not only on the countries to prioritize, but also to zoom into specific areas once a set of countries is selected.21
Subsequently, based on the agricultural activity-specific climate–agriculture–gender inequality hotspot index values, we ranked and mapped the subnational areas within each country and separately for each agricultural activity using a GIS application.22 The maps of subnational areas per country reflect within country and within agricultural activity ranking by the hotspot risk index.23
Different criteria can be used to single out a subnational area as a hotspot. To illustrate the methodology, in this paper, we identify an agricultural activity-specific subnational hotspot area in each focus country based on its relatively high hotspot index value for a particular agricultural activity.24
3.5. Validation of hotspot localities with secondary case study evidence
Following the identification of climate-agriculture-gender inequality hotspots, we consulted relativity recent secondary case study evidence on climate change, agrifood systems, women’s involvement in agrifood systems, and gender equality in selected examples of hotspot localities. This helped to contextualize and validate the results of applying our climate-agriculture-gender inequality hotspot methodology.
Besides, such validation, potentially complemented with analysis of the main contributing components to high hotspot risk index values, can contribute to informing policy or interventions on how to best address the high climate risk faced particularly by women in these hotspots.
Detailed policy, institutional and contextual analyses of the localities identified as hotspots, however, are outside the scope of this paper. As mentioned, primary in-depth case studies, including of policies in place, and pilot testing of interventions in hotspot localities can be next steps in developing targeted policy and interventions (and have been conducted in the context of a wider research project).25
4. Results
4.1. Climate–agriculture–gender inequality hotspot LMICs
First, we applied the climate-agriculture-gender-inequality hotspot methodology to rank LMICs. Globally, we ranked 87 LMICs from Latin America, Asia, and Africa by the national level hotspot risk index value we illustrated the ranking on a global map (Figure 2; Appendix A).
Figure 2
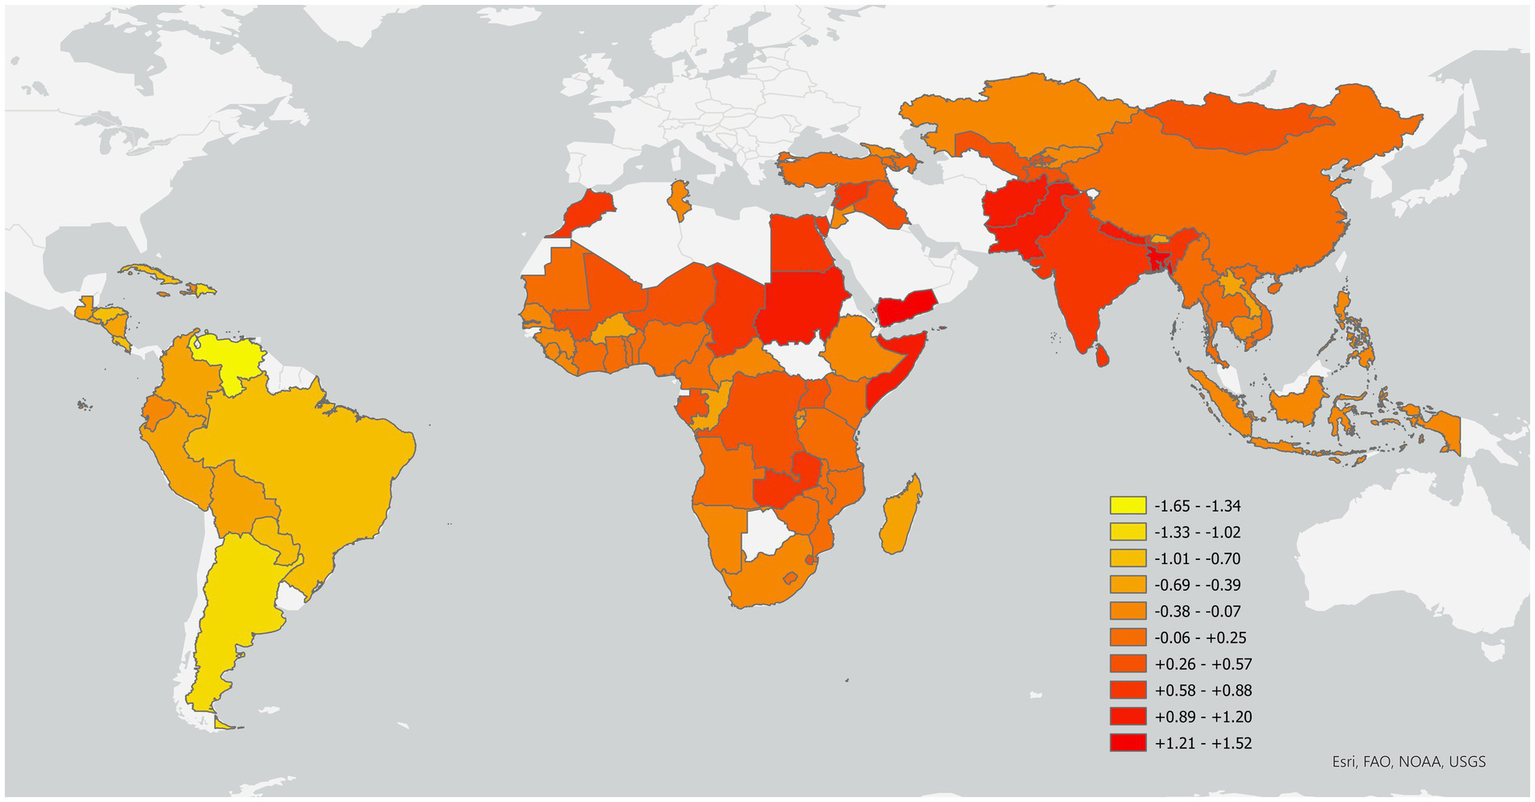
Climate–agriculture–gender inequality hotspot LMICs across the globe. Darker orange-colored countries have relatively high climate–agriculture–gender inequality hotspot index values; therefore face higher risk. Lighter orange-colored countries have relatively low climate–agriculture–gender inequality hotspot index values; therefore face lower risk. LMICs with a white color have not been ranked due to data limitations.
The global map shows that significant climate hazards, high exposure faced by women in agri-food systems, and high vulnerability faced by women due to gender inequalities converge particularly in Sahelian countries in Africa and Central-, East-, and Southern Africa; and in Western and South Asia. Rao et al. (2019b) similarly pointed out semi-arid regions in Africa and parts of South and Central Asia as well as deltas in Africa and South Asia as climate hotspots where gendered vulnerability is exacerbated by the convergence of climate change, social structures, and sensitivity of livelihoods.
While a decomposition and in-depth discussion of the main contributing components fall out of the scope of this paper, different drivers of climate risk influence the hotspot ranking differently in different contexts. For example, examining the values of the different components in Appendix A, shows that high rates of climate hazards and exposure faced by women contribute highly to climate risk faced by women in the case of Pakistan and Bangladesh in Asia. In the case of Mali and Zambia in Africa; high vulnerability due to structural gender inequalities plays a larger role.
While this does not allow inference about a direct relationship between poverty levels and climate–agriculture–gender inequality hotspot risk, results show that the highest ranked countries are mostly low and lower-middle income countries.
Recent studies show that the extent to which climate, agriculture, livestock and natural resource policies – and their implementation and budgets – are gender response is variable across countries (Ampaire et al., 2020; Huyer et al., 2020). In East Africa, Uganda and Tanzania in particular, policies are increasingly gender responsive, although this varies across governance levels and budgets are not always well aligned to or sufficient for the intended gender responsiveness. Gender policy action does not adequately address structural inequalities (Ampaire et al., 2020). In South Asia, like for instance in India, Nepal, and Sri Lanka, climate action policies in South Asia are oriented toward improving climate resilience but are often gender-blind and non-inclusive. Building climate resilience in an equitable and sustainable way, however, will require policy action that considers the root causes of gender inequality (Aita and Ahmed, 2022). Huyer et al. (2020) believe that the UNFCCC Gender Action Plan may have the potential to boost gender in climate policy and action but emphasize that particularly the structural gender inequalities that exacerbate vulnerability of women in particular should be addressed.
4.2. Subnational climate–agriculture–gender inequality hotspot areas in four focus countries
Next, we applied the subnational agricultural activity-specific climate-agriculture-gender-inequality hotspot methodology in selected hotspot countries. In this paper, we selected two countries each from Africa and Asia based on their ranking and data availability to develop our subnational climate–agriculture–gender inequality hotspot methodology as a proof-of-concept.
The two selected focus countries in (South) Asia are Bangladesh and Pakistan, respectively ranked second and fourth by the hotspot risk index among all LMIC and the highest risk countries in Asia (Risk index values 1.471 and 1.120; Appendix A). The two selected focus countries in Africa are Zambia and Mali, ranked 13 and 18, respectively (Risk index values 0.651 and 0.448 respectively; Appendix A). Zambia is a hotspot in Southern Africa, Mali is a representative Sahelian arid African country. These countries also have the necessary data representative at the subnational level in publicly accessible databases. As observed in Appendix A, multiple drivers of climate risk influence the hotspot ranking in different contexts. For the two focus countries in (South) Asia; Pakistan and Bangladesh, high climate hazards and exposure of female farmers drives climate risks. Whereas in the two focus countries in Africa; Mali and Zambia, high vulnerability (i.e., structural inequalities) plays a larger role.
We refer to Appendix D for agricultural activity-specific climate-agriculture-gender inequality hotspot index values of subnational areas in our focus hotspot countries – Mali, Zambia, Pakistan, and Bangladesh. The hotspots maps for each agricultural activity for each of the four countries are provided in Appendix F.26
We continue with the contextualization and validation of selected agricultural activity-specific subnational hotspot localities in each of the four focus countries using available secondary case study evidence.
4.2.1. Mali
Mali, a Sahelian country, is majorly dependent on agriculture. Agriculture contributes 37 percent to the national GDP and is a source of income for more than 65 percent of its population. The rural economy of Mali is dominated by rainfed and subsistence crop and livestock production (FAO, 2017). Increasingly variable and unpredictable rainfall, droughts and floods have led to multiple crop failures and food shortages. While women constitute half of the labor force in the agriculture sector, they have less control over agricultural and household assets (especially land) than men. Women have limited representation in decision-making spheres which is linked to restrictive customary laws (CIAT et al., 2021).
Within Mali, the subnational climate–agriculture–gender inequality hotspot analysis reveals that the Tombouctou region is a hotspot for livestock (M06 in Figure 3; Appendix D), suggesting that women involved in livestock in this region face high climate risk.27
Figure 3
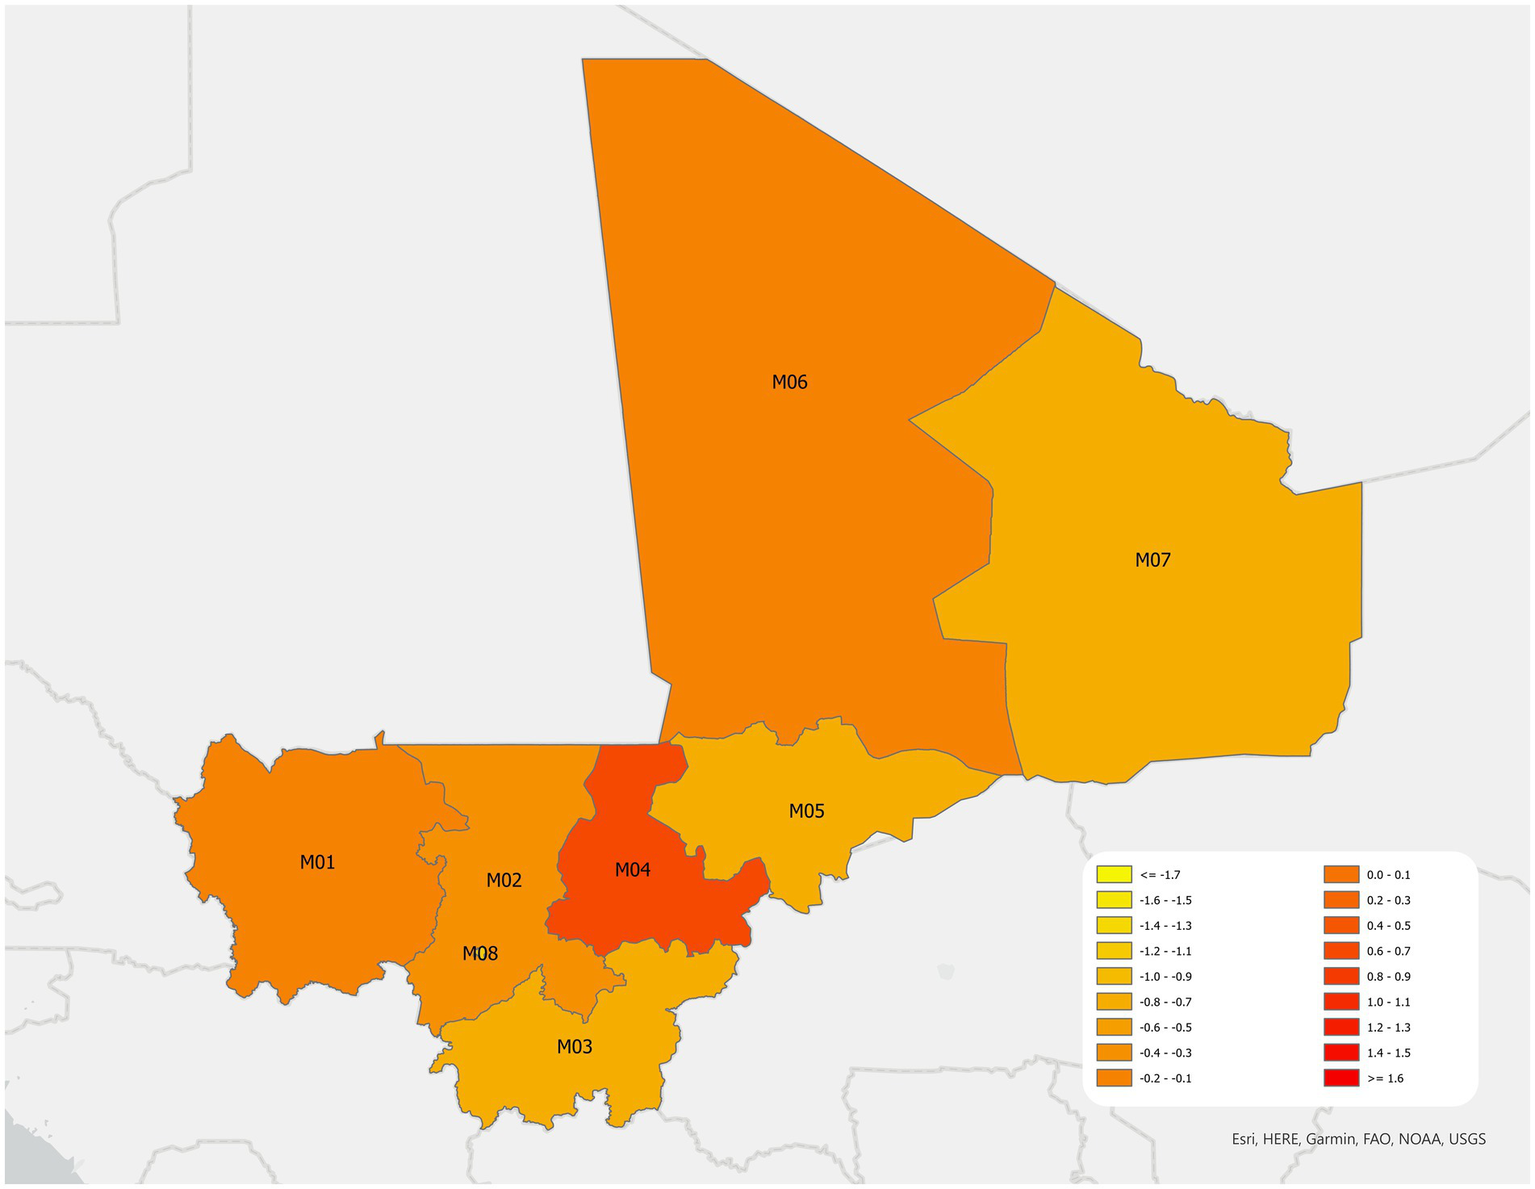
Subnational level climate–agriculture–gender inequality hotspot map for livestock in Mali. Darker orange-colored countries have relatively high climate–agriculture–gender inequality hotspot index values; therefore face higher risk. Lighter orange-colored countries have relatively low climate–agriculture–gender inequality hotspot index values; therefore face lower risk. Names of the regions are M01: Kayes; M02: Koulikoro; M03: Sikasso; M04: Segou; M05: Mopti; M06: Tombouctou; M07: Gao and Kidal; M08: Bamako.
The northern part of Mali, where Tombouctou region is located, is centered around a pastoralist livestock economy (Djoudi and Brockhaus, 2011). Evidence corroborates that, throughout the Sahel—including in Mali—climate change has made a pastoral livelihood strategy difficult. Access to water and foraging resources have greatly reduced due to increasingly warm and dry weather patterns, and extended dry periods (McOmber, 2020; Segnon et al., 2021). Generally, Mali faces high poverty levels (USAID, 2019; The World Bank, 2020). Tombouctou region has among the highest percentages of people living in poverty (Data Africa, 2014).
While differences exist by community and class, Djoudi and Brockhaus (2011) found that women in Tombouctou are subject to restrictive norms and roles hindering their access to resources, extension and information, diverse livelihood portfolios, and mobility; as well as burdening them with heavy domestic, care and productive workloads.
Pastoralist livelihoods in the Sahel are also marked by specific gendered roles and responsibilities and associated norms. McOmber (2020) states that women are less likely to control cattle than men, but more likely to control small livestock. Nevertheless, women contribute labor in both types of livestock rearing. For instance, women tend to be responsible for milking and dairy processing. Few women own agricultural land, and most have restricted access not only to land but also other productive resources. Heavy productive and reproductive work burdens, in addition to other structural and logistic barriers, constrain women’s access to livestock extension and information about raising new breeds of livestock more adaptive to ecological changes Besides, the conflict in the region drove outmigration, particularly by men, as women have less access to financial assets and transportation or face mobility restrictions (McOmber, 2020). As a result of male outmigration, women’s tasks now include what have been traditionally male activities [Djoudi and Brockhaus, 2011; Strengthening Partnerships, Results, and Innovations in Nutrition Globally project (SPRING), 2016].
The secondary evidence supports the identification of the Tombouctou region as a hotspot area for livestock as it points to a convergence of climate hazards affecting livestock production and pastoralist livelihoods, in which women play a significant role, with gender unequal control over resources and information as well as discriminatory gender norms and roles.
4.2.2. Zambia
Close to 50 percent Zambia’s economically active population is employed in agriculture. Women constitute an estimated 55 percent of the agricultural labor force [International Labour Organization (ILO), 2021]. Smallholder farmers are majorly reliant on a few staple crops like maize and cassava. Climate hazards and stressors include drought and dry spells, seasonal and flash floods, extreme temperatures, and changes in season onset and cessation. Combined with relatively low yields, high deforestation rates and localized land degradation, these induce high risks of food security (CIAT and The World Bank, 2017b).
Within Zambia, Luapula province has been identified as a hotspot area for perennial crops – such as cassava (Z04 in Figure 4; Appendix D).28
Figure 4
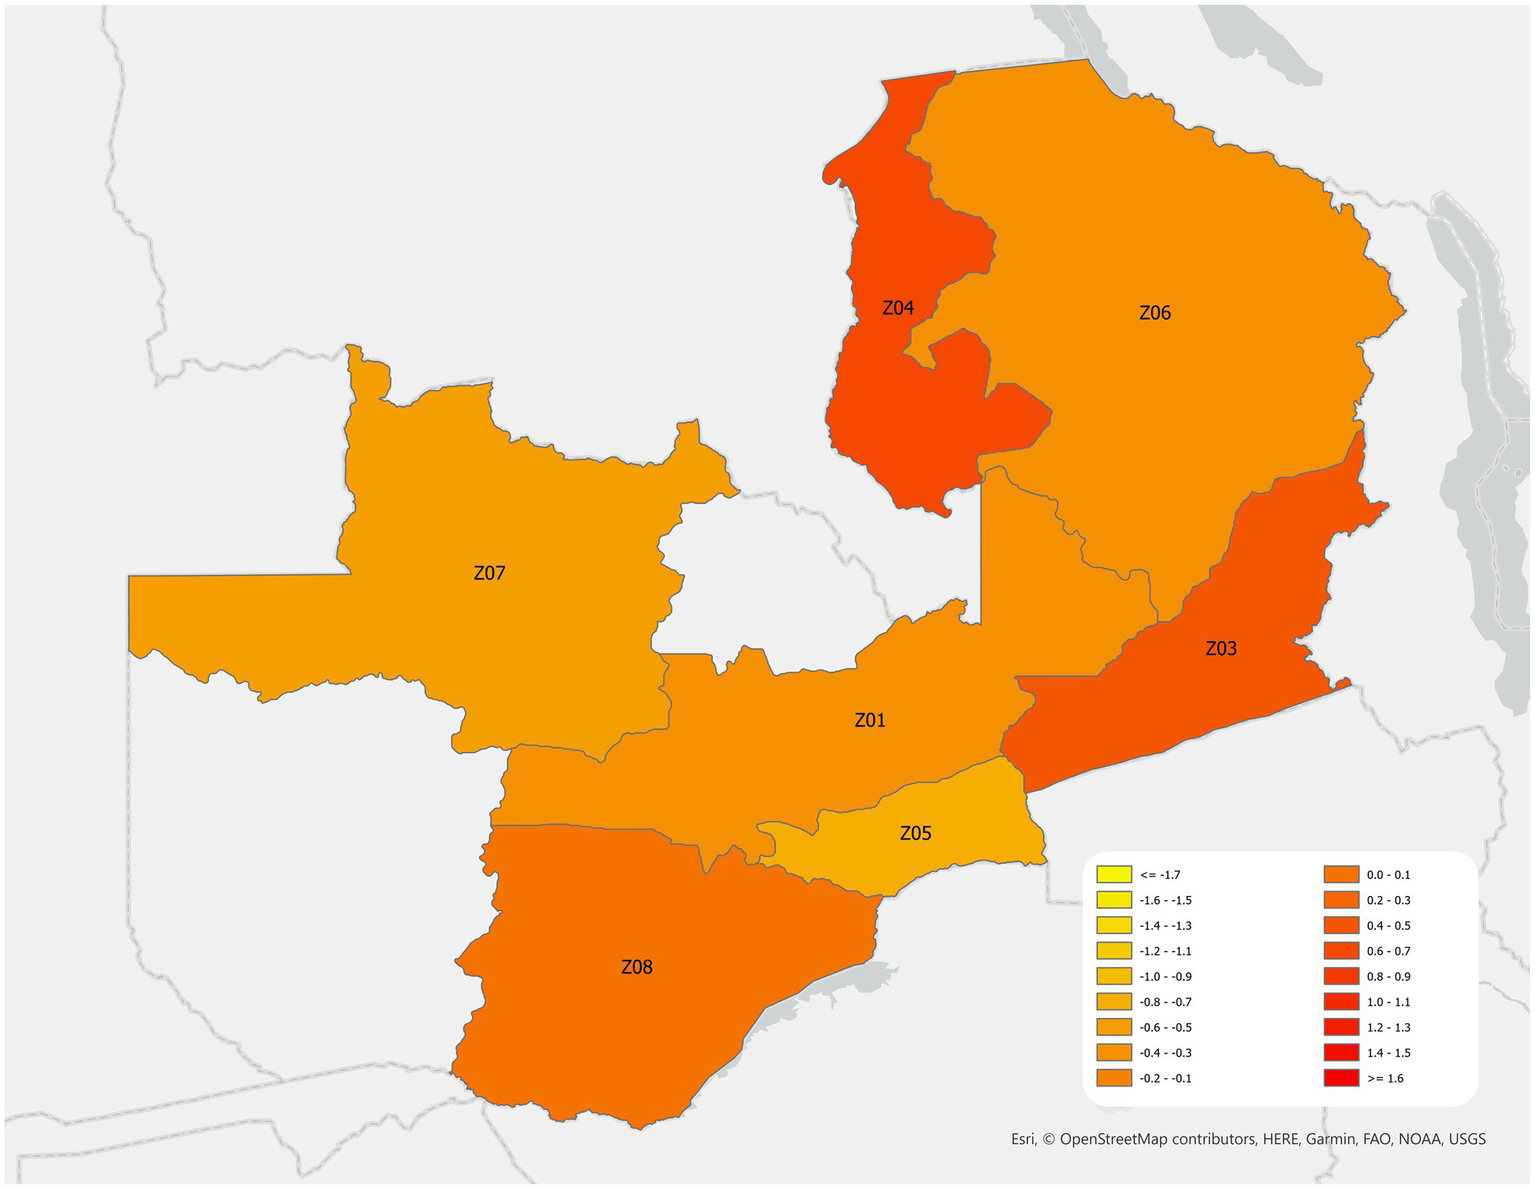
Subnational level climate–agriculture–gender inequality hotspot map for perennial crops in Zambia. Darker orange-colored countries have relatively high climate–agriculture–gender inequality hotspot index values; therefore face higher risk. Lighter orange-colored countries have relatively low climate–agriculture–gender inequality hotspot index values; therefore face lower risk. Names of the provinces are Z01: Central; Z03: Eastern; Z04: Luapula; Z05: Lusaka; Z06: Northern; Z07: North-Western; Z08: Southern. (Missing data: Z02: Copperbelt; Z09: Western).
Evidence shows that Luapula province witnesses heavy annual rainfall, which helps the growing season but also makes the region prone to flooding (USAID, 2014). Seasonal flooding causes significant crop damage to the perennial crop of cassava which is extensively cultivated and the second most important staple food in the province (Curran et al., 2009; White et al., 2015). Zambia has high percentages of its population living in poverty and Luapula province has among the highest percentages of all provinces (Data Africa, 2010).
While farming is the key livelihood option for most of the population in the province, 68 percent of the women in Luapula province do not own land (Zambia Statistics Agency et al., 2019). According to statutory law, women in Zambia have equal rights to acquire land and inherit land upon widowhood. However, Kapihya (2017) argue that customary law co-exists and often overrules statutory regulations, especially in rural areas. In practice, in many cases, women have access to land via their husband but insecure tenure or inheritance rights over land. Besides, women have limited access to credit and financial services in Zambia and lack the support of policies and legal framework that can facilitate their economic empowerment (OECD, 2019). Evidence shows that Luapula province is one of the most gender unequal regions in Zambia offering limited economic opportunities and experiencing high levels of unemployment [United Nations Development Programme (UNDP), 2016; Government of the Republic of Zambia (GRZ), 2021].
Cassava is commonly labeled as a women’s crop. Alamu et al. (2019) show that, in the Samfya and Mansa districts of Luapula province, for instance, women are not only heavily involved in cassava production but also in 90 percent of the processing activities. Women’s access to inputs and tools to improve the efficiency of processing is restricted, contributing to their time poverty-which is high given that women tend to provide most of the unpaid family and care labor. Furthermore, women working in cassava production lack access to relevant knowledge and information that can help them diversify production in the face of a changing climate (Alamu et al., 2019). Baidu-Forson et al. (2015) point out that mobility restrictions and power relations limit women farmers’ ability to cultivate different crops and adapt to flooding.
In sum, the evidence from the secondary case studies corroborate the identification of Luapula province as a hotspot area for perennial crops, cassava in particular, since climate hazards affecting the production of this ‘women’s crop’ coincide with significant gender inequalities in access to resources, work burdens, and adaptive capacities rendering women particularly vulnerable.
4.2.3. Pakistan
Agriculture in Pakistan contributes 19 percent to its national GDP (Government of Pakistan (GoP), 2021a). Agriculture, however, is severely affected by a range of climate hazards including, for instance, droughts and floods in the Punjab province and extreme temperatures in the Sindh province. In Pakistan, the Punjab province emerges as a hotspot region for cereals (P01 in Figure 5; Appendix D).
Figure 5
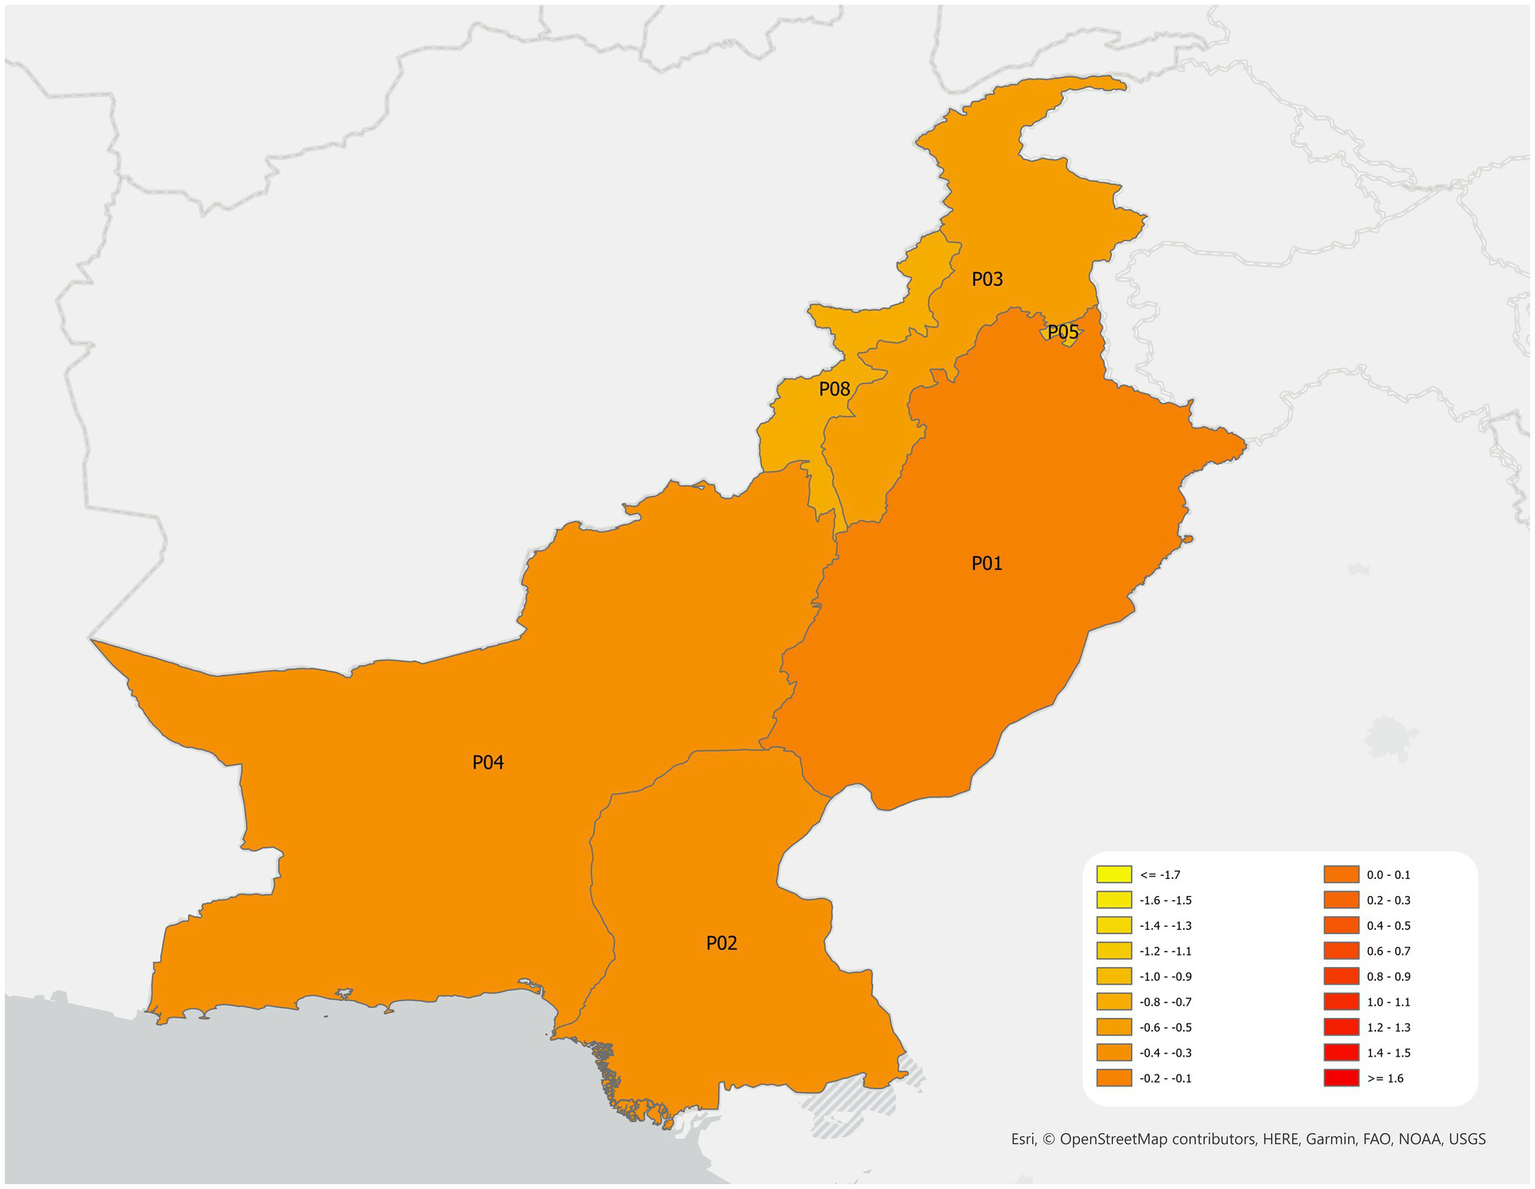
Subnational level climate–agriculture–gender inequality hotspot map for cereals, leguminous crops and oilseeds in Pakistan. Darker orange-colored countries have relatively high climate–agriculture–gender inequality hotspot index values; therefore face higher risk. Lighter orange-colored countries have relatively low climate–agriculture–gender inequality hotspot index values; therefore face lower risk. Names of the regions are P01: Punjab; P02: Sindh; P03: Khyber Pakhtunkhwa (NW Frontier); P04: Balochistan; P05: Islamabad (ICT); P08: FATA. (Missing data P06: Gilgit Baltistan; P07: AJK).
Punjab is an agriculturally rich region contributing 24 percent to Punjab’s GDP. The province is responsible for 80 percent of the wheat produced in the country (FAO, 2015). Farooq (2022) report that the province is prone to climate hazards and faces recurring droughts, heatwaves and floods. The increase in temperatures in Pakistan has led to an increase in heatwaves in the southern regions of the Punjab province [Government of Pakistan (GoP), 2021b]. The recent dramatic Monsoon floods (June to August 2022) also hit the Punjab province hard (OCHA, 2022; Puskur and Mishra, 2022). While poverty levels are generally high in Pakistan, Punjab has the lowest proportion of people in poverty as compared to other provinces [Pakistan Institute of Development Economics (PIDE), 2021; United Nations Development Programme (UNDP), 2023].
Women contribute significant labor to harvesting activities particularly of wheat and cotton, as well as to livestock maintenance and dairy production and processing.29 Apart from this, women additionally take on household chores and care work, adding up to working 12 up to 15 h a day (FAO, 2015). Yet, women have limited access to technologies and income-generating assets due to weak extension systems, illiteracy and lack of legal ownership of land (CIAT and The World Bank, 2017a; Wilderspin et al., 2019).
Land constitutes a significant asset in rural Punjab. Due to restrictive social and cultural norms, women are discouraged from getting a share, particularly when it is large in size (FAO, 2015). Only 2 percent of women in rural Punjab own land (NIPS, 2019). Drucza and Peveri (2018) point out that social norms restrict women’s mobility. As a result, men deal with marketing and take most of the decisions regarding selling and buying. This is especially the case in the rural parts of the province and more so for women belonging to rich farming or land-owning households. Women from poorer groups in these rural societies are more likely to have to leave the home for work. Consequently, with increasing economic prosperity of the households, women have become more confined to their home and more isolated from the outside world. According to FAO (2015), other factors that limit women’s empowerment include lack of access to credit, gender bias in transfer of new technologies and required training, and lack of access to education. A case study in rural areas in Punjab by Habib et al. (2022) shows that limited access to resources hinders women in adopting measures to deal with natural disasters. The adaptation measures that women tend to adopt during natural hazards include reducing food consumption and purchase of clothes as well borrowing money from relatives to cope with the impact.
The secondary evidence thus supports the rural Punjab as a hotspot area for cereals with climate hazards affecting cereal crop farming in which women are substantially involved while facing significant structural gender inequalities that contribute to their vulnerability.
4.2.4. Bangladesh
Agriculture in Bangladesh contributes 17 percent to the national GDP. It constitutes at least one source of livelihood for 87 percent of its rural households. Bangladesh faces multiple climate hazards, including frequent flooding, droughts, cyclones and rising salinity (Ferdushi et al., 2019; Ahmed and Eklund, 2021).
Based on the subnational hotspot analysis, the cluster of Kishoreganj districts (in Dhaka Division) and Mymensingh and Netrokona districts (in Mymensingh Division), in the Haor region in northeastern Bangladesh, emerges as a hotspot for rice (B11 in Figure 6; Appendix D).30,31 There is evidence that the occurrence of flash floods before the harvesting season affects crop output and causes severe livelihood losses to farmers in these districts, where substantial areas are characterized by wetland ecosystems (Haor) [Government of the People’s Republic of Bangladesh (GOB), 2018; Rahaman et al., 2019; Hoq et al., 2021]. Siltation and sedimentation of major rivers, as well as riverbank erosion, are other challenges in this region [Centre for Environmental and Geographic Information Services (CEGIS), 2012]. Poverty maps show that these districts have relatively high proportions of their population below the 2016 poverty line (The World Bank, 2023).
Figure 6
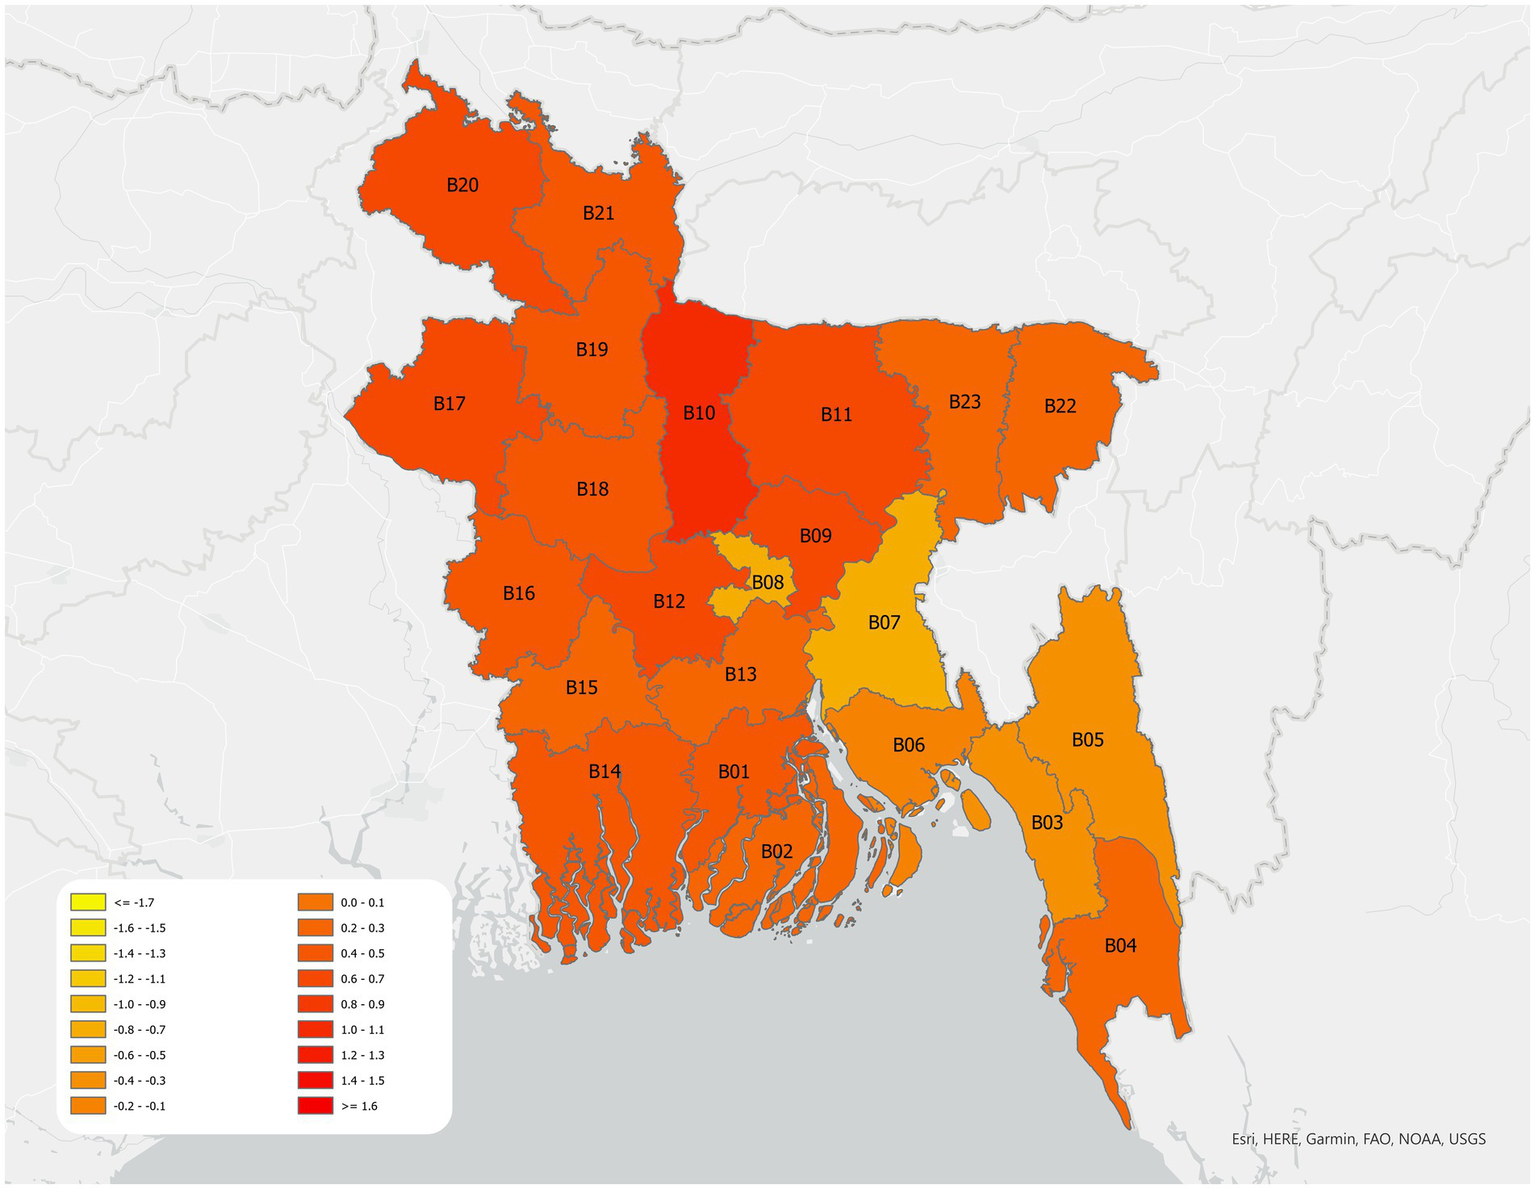
Subnational level climate–agriculture–gender inequality hotspot map for rice in Bangladesh. Darker orange-colored countries have relatively high climate–agriculture–gender inequality hotspot index values; therefore face higher risk. Lighter orange-colored countries have relatively low climate–agriculture–gender inequality hotspot index values; therefore face lower risk. Name of the district groups are B01: Barisal–Jhalokati–Pirojpur; B02: Barguna–Bhola–Patuakhali; B03: Chittagong; B04: Bandarban–Cox’s Bazar; B05: Khagrachhari–Rangamati (Chattagram); B06: Feni–Lakshmipur–Noakhali; B07: Brahmanbaria–Chandpur–Comilla; B08: Dhaka; B09: Gazipur–Narayanganj–Narsingdi; B10: Jamalpur–Sherpur–Tangail; B11: Kishoreganj–Mymensingh–Netrakona; B12: Faridpur–Manikganj–Rajbari; B13: Gopalganj–Madaripur–Munshiganj–Shariatpur; B14: Bagerhat–Khulna–Satkhira; B15: Jessore–Magura–Narail; B16: Chuadanga–Jhenaidah–Kushtia–Meherpur; B17: Naogaon–Nawabganj–Rajshahi; B18: Natore–Pabna–Sirajganj; B19: Bogra–Gaibandha–Jaypurhat; B20: Dinajpur–Nilphamari–Panchagarh–Thakurgaon; B21: Kurigram–Lalmonirhat–Rangpur; B22: Maulvibazar–Sylhet; B23: Habiganj–Sunamganj.
Boro rice is the major crop cultivated in this region. It is grown using irrigation in waterlogged low-lying or medium lands (Hoq et al., 2021). Rahman et al. (2020) argue that women in northern Bangladesh typically have a substantial role in rice farming and are increasingly involved in farm management, in part due to male outmigration. The climate-induced male outmigration leaves women with increased productive and domestic workloads. Seymour and Floro (2016) show that, while women and men daily spend similar amounts of time working in Bangladesh, women spend 86 percent of their working time engaged in unpaid domestic activities—and men only 25 percent. Yet, women’s role and contributions are not always acknowledged by their male counterparts (Rahman et al., 2020). Women’s work burdens not only increase in times of acute climate crises, but also because of soil and riverbank erosion which necessitates moving fields.
Besides, in the context of Bangladesh, patriarchal gender norms restrict women’s access to resources, their mobility, and decision-making power in their households. However, according to Rahman et al. (2020) such normative restrictions may vary by women’s level of education, household wealth and non-governmental organization membership. Studies in North-Western Bangladesh by Tanny et al. (2017) and Naz and Saqib (2021) found that women have a lower adaptive capacity to climate shocks than men as they have limited choices for livelihood diversification. Rahman et al. (2020) state that, in wetland areas, such as the Kishoreganj-Mymensingh-Netrakona districts, women’s mobility restrictions hinder their access to timely warnings about floods and other information enabling them to mitigate or adapt to the climate adversities.
Thus, the hotspot analysis and secondary case study evidence support each other in identifying the cluster of Kishoreganj, Mymensingh and Netrokona districts, with large wetland areas, as a hotspot for rice production. Climate hazards including floods affect rice production in which women provide subnational amounts of labor in addition to their care work burden. The vulnerability of women is high given prevailing patriarchal gender norms, mobility restrictions, and restricted access to resources and decision-making power.
5. Discussion
Climate hazards, gender-differential exposure and vulnerability due to gender inequalities influence the climate risk that women in agri-food systems face. Each of these factors of climate risks – hazards, exposure, vulnerability - can differ and overlap each other in complex ways specific to location and context. We developed and applied a methodology that combines insights from climate, gender and agri-food system research to identify and map geographical areas that can be considered climate–agriculture–gender inequality hotspots. These hotspots are characterized by the local- and context-specific convergence of significant climate hazards, exposure faced by women because of their involvement in agriculture and/or livestock production, and high vulnerability particularly for women because of the social conditions that disadvantage women. The methodology uses geospatial information and publicly accessible, representative socioeconomic datasets and applies user-friendly methods to construct ordinal climate–agriculture–gender inequality hotspot indices. This is done at national and subnational area levels. This allows ranking countries and subnational areas within countries by the respective hotspot index values, hence, identifying and mapping hotspots and ‘cold-spots’ using color codes.
Our methodology has some limitations, some of which are related to the available data sources. First, some countries, including various Small Island Developing States (SIDS), are not included in the hotspot country analysis and our choice of focus countries for subnational hotspot analysis used data availability as a criteria. Often the most data-deficit environments are also the most poverty-stricken and vulnerable, or conflict-stricken, implying that we may remain uninformed of climate risk faced by women in these environments due to these data limitations.
Second, aquatic food systems and sectors -fisheries and aquaculture- have been not been adequately covered in the analysis. This is primarily due to the fact that fishery and aquaculture activities are largely overlooked in data collection efforts. For instance, the number of sampled participants in fisheries and aquaculture sector is very low in the Labor Force Survey (LFS) data selected for this study is too low calculate statistically meaningful indicators. Besides, the limited available suggests that women’s participation in the harvesting sector of fisheries and aquaculture in the four focus countries is very low, ranging between 0 and 23% for aquaculture and between 0 and 11% for fisheries.32 However, we acknowledge that the fisheries and aquaculture sector has a profound impact on economic development and food security and nutrition and that aquatic food systems have a specific set of climate hazards associated with them (Barange et al., 2019; Tigchelaar et al., 2021). These are compounded with exacerbating occurrences of recurrent losses and degradation of coastal and freshwater ecosystems due to human activities along coastlines and within water basins (FAO et al., 2023).
Third, the LFS data only allowed capturing participation in food production and processing activities and not food trading and transportation activities. Hence, this study is primarily focused on gender-specific exposure in crop and livestock production, which account for most of the women’s employment in the agrifood system. As such, it provides valuable insights into exposure to climate change faced by women in agrifood systems.33
Fourth, while, ideally, the climate hazard data would be split by the same agricultural activities as exposure data, this is not possible as the former are based on spatial-level data and the latter household-level data. We also acknowledge that, in some cases, the available data might not be sufficiently recent to be effectively used for policy making.
Our exercise is thus focused on the methodology and the feasibility to characterize and identify hotspot areas with the data required to conduct such analysis that is available at hand, which is not necessarily the most recent data. We also acknowledge that the results of the climate–agriculture–gender inequality hotspot ranking and mapping provide just a description and spatial distribution of the status quo without any indication, other than the underlying data, of factors that could positively affect it. Besides, the methodology we developed is one way to identify where women in agrifood systems are at high risk of climate change. It proves relatively robust but we recognize the complementarity of other methodologies.
Climate–agriculture–gender inequality hotspot ranking and mapping have multiple uses. First, hotspot mapping holds the potential to underpin decision-making. It can inform risk management and investments in coping or adaptation assistance. It can guide the allocation of scarce resources to populations at highest risk by identifying high-risk countries and subnational areas where climate change hazards, exposure and vulnerabilities most acutely converge for these groups (de Sherbinin, 2014). The identification of climate–agriculture–gender inequality hotspots can facilitate how future efforts are targeted to locations where women in agri-food systems are most at risk to make these more impactful. The underlying data signals that limiting climate risk for women by reducing the vulnerability requires addressing the systemic gender inequalities and structural barriers to equality.
Second, hotspot mapping can provide important comparable contextual information for projects or studies that aim to address issues at the nexus of climate change, gender, agri-food systems. The hotspot analysis and its indicators can support identifying and comparing the various local challenges the population, and women in particular, face across countries and within identified national boundaries. The results of this study, for instance, have been used to identify case study hotspot subnational areas in the hotspot countries of Zambia and Bangladesh for further research into the relationship between women’s participation in agri-food systems, their adaptive capacity and empowerment as well as potential solutions to empower women in agri-food systems in the face of climate change. Depending on data availability, other possible uses of hotspot ranking and mapping include thematic cross-country or cross-regional comparisons, tracking changes over time in relative climate–agriculture–gender inequality hotspot rankings, or monitoring correlations of hotspot rankings with changes in gender, climate and/or agricultural policies over longer-term periods.
Provided there is a theoretical and empirical basis and the necessary comparable and representative data, the climate-agriculture-gender inequality hotspot methodology could be fine-tuned further with the inclusion of additional variables for exposure to climate hazards beyond agriculture and livestock production. Measuring vulnerability due to gender inequalities could benefit from the inclusion of indicators of inequalities in land ownership, time poverty, access to finance, technology, information, and education, among others. The hotspot methodology could be extended to identifying populations at high climate risk differentiated not only by gender, subnational area and agricultural activity, but also by age, ethnicity, caste, dis(ability), and/or socioeconomic status. This would require developing the theoretical and empirical basis for differential exposure and vulnerability linked to inequalities that tie to these intersectional characteristics. It would also depend on the availability of representative cross-country and cross-region comparable data disaggregated by the relevant intersectional categories. Lau et al. (2021) see potential in using Women’s Empowerment in Agriculture Index or Individual Deprivation Measure data, but these are still only available for a limited number of countries. Lastly, the hotspot methodology could be expanded to include other factors of exposure and vulnerability, for instance, related to (gendered) access to water or poverty; or to identify hotspots of compound risk.
6. Conclusion
There is growing recognition and increasing evidence that impacts of climate change are gendered and that, in many contexts, women in agri-food systems in LMICs are more affected by and more vulnerable to the adverse impacts of climate change than men. Gender inequalities and structural constraints to equality in society tend to exacerbate negative impacts by limiting women’s coping and adaptive capacities. In the spirit of leaving no one behind, it is essential to ensure that women can take climate action and can seize coping and adaptation opportunities as agri-food systems transform against the background of climate change.
The climate-agriculture-gender inequality hotspot methodology enables mapping the countries and subnational areas within countries where women are at high risk of climate change. This can guide the allocation of scarce resources for avoiding exacerbating gender inequality and for supporting women’s adaptive and resilience capacities and climate action. Besides, the climate-agriculture-gender inequality hotspot methodology signals that part of the solutions of reducing climate risk for women requires addressing the structural barriers to gender equality.
Statements
Data availability statement
The original contributions presented in the study are included in the article/Supplementary material, further inquiries can be directed to the corresponding author.
Author contributions
EL, AM, NS, JK, CA, NC, and RP made substantial contributions to the conception and design of the work. JK, CA, GN, EL, AM, and NS made significant contributions to the acquisition, analysis, and interpretation of data for the work. EL, AM, NS, and NC reviewed and included prior literature. All authors contributed to writing (sections) of the manuscript.
Funding
We are grateful for the support of the International Development Research Centre Canada. This work was carried out under the CGIAR GENDER Impact Platform, which is grateful for the support of CGIAR Trust Fund contributors: www.cgiar.org/funders.
Conflict of interest
The authors declare that the research was conducted in the absence of any commercial or financial relationships that could be construed as a potential conflict of interest.
Publisher’s note
All claims expressed in this article are solely those of the authors and do not necessarily represent those of their affiliated organizations, or those of the publisher, the editors and the reviewers. Any product that may be evaluated in this article, or claim that may be made by its manufacturer, is not guaranteed or endorsed by the publisher.
Supplementary material
The Supplementary material for this article can be found online at: https://www.frontiersin.org/articles/10.3389/fsufs.2023.1197809/full#supplementary-material
Footnotes
1.^In contrast to the IPCC 2007 vulnerability framework, the IPCC 2014 risk framework conceptualizes vulnerability as an internal property of a system delinked from exposure to hazards (Sharma and Ravindranath, 2019).
2.^The types include current and future climate hazards. For current hazards, high-risk drought areas include grid cells in the top two deciles (most risky) of relative drought risk of the data set of (Dilley et al., 2005, as cited in Jarvis et al., 2021). Similarly, high-risk flooding areas include grid cells in the top two deciles (most risky) of relative flood risk. Areas with climate variability are those where the coefficient of variation of annual rainfall is currently greater than the median value for the global tropics (24 percent) (with current variability used as a proxy for future variability).Future climate hazards include measures of crop growing-season reductions, and high growing-season temperatures. These rely on downscaled climate projections from 17 CMIP5 global climate models using the methods by (Jones and Thornton, 2009, 2013, 2015, as cited in Jarvis et al., 2021) and climatologies for the 2050s as projected in response to RCP 8.5. Crop growing-season reductions are defined as hazard if the reduction in the number of reliable crop growing days per year (mostly due to changes in rainfall distributions and amounts) is below the critical threshold of 90 days (Jarvis et al., 2021). High growing-season temperatures are defined as hazard if the average maximum daily temperature during the primary growing season moves above the critical threshold for several major crops of 30°C by the 2050s (Jarvis et al., 2021).
3.^Labor participation rates in agriculture and/or livestock by women that are around 50 percent or lower can appropriately indicate climate-food-gender inequality hotspot risk since we are calculating relative risk, comparing countries or subnational areas with one another.Besides, even if labor participation rates in agriculture and/or livestock by women is around 50 percent or lower, it needs to be recognized that women often perform agricultural activities simultaneously with care work, which tends to remain unaccounted for. Hence, while a quantitative 50 percent rate implies equal probability to be involved in agriculture as men, women’s working conditions are sometimes qualitatively worse (i.e., for both physical and socio-emotional conditions such as for mental load).The norms putting a heavier care work burden on women can differ by context and are part of the structural gender inequalities that underly vulnerability.
4.^This indicator is calculated by dividing women’s labor participation in the particular activity by the sum of women’s and men’s labor participation in that activity (expressed as a percentage).
5.^This indicator is calculated by dividing women’s share of hours worked in the particular activity by the sum of women’s and men’s hours worked in that activity.
6.^The agricultural activities are grouped into six crop/categories (cereals, leguminous crops and oilseeds; rice; vegetables, melons, roots and tubers; perennial crops; livestock; and mixed farming) according to the lowest common information available on crop-level involvement across the LFS used through the International Standard Industrial Classification (ISIC) code of economic activity. The ISIC classifies employed individuals according to their economic activity, but while it extends beyond primary food production activities, encompassing both upstream and downstream sectors of the agri-food system, the four LFS analyzed in this study only allowed to capture participation in food production and processing activities.
7.^Correlation among all exposure indicators was analyzed to check complementarity in specific agricultural activities.
8.^PCA is a statistical technique for data reduction. It reduces the number of variables without imposing arbitrary weights. It constructs a series of uncorrelated linear combinations of the sub-indicators that contain the largest share of the variance (principal components), i.e., explain the greatest share of the variation. If these components would be correlated, PCA gives them lower weight as they do not add much information in explaining the variance of the linear combinations chosen, so that the correlation brought by these variables will be added only if their signal is greater than the noise. As PCA standardizes variables in different metrics, it allows combining the sub-indicators which are expressed in different metrics in an ordinal index.To construct the composite indices capturing agricultural-activity specific exposure, we first ran PCA using the STATA command ‘pca’ including the three sub-indicators: (i) the relative importance of the agricultural activity in the local economy measured by overall labor participation in the particular activity, regardless of gender; (ii) the agricultural activity-specific women’s share of labor participation; and (iii) the agricultural activity-specific share of hours worked by women (relative to men). Subsequently, we ran the command ‘predict’ (which predicts based on the first principal component if the principal component is not specified). Following the PCA-based method of Filmer and Pritchett (2001), the composite index values of agricultural-activity specific exposure are then calculated for each subnational area using the estimated coefficients of the first principal component as weights. This results in six agricultural-activity specific composite index values of exposure for each subnational area.PCA is used for constructing composite indices in multiple studies (e.g., Filmer and Pritchett, 2001; Vyas and Kumaranayake, 2006; Mazziotta and Pareto, 2019). PCA has its advantages and disadvantages, We refer to Mazziotta and Pareto (2019) for a detailed discussion and test.
9.^See https://www.genderindex.org/building/ for details on the SIGI 2014 methodology.
10.^We opted for SIGI 2014 rather than SIGI 2019 because it has fewer missing data points.
11.^Components of the SIGI 2014 that are not captured in our subnational level proxy sub-indicators include formal laws, informal laws, social norms, and restricted assets (including land). While, to some extent, these may vary by subnational area within a country, such data, representative at the first level administrative division, are not readily available.
12.^The Subnational Human Gender Development Index (SGDI) is calculated by dividing the Subnational Human Development Index (SHDI) for women by the SHDI for men. The SHDI for women (respectively for men) is computed using a geometric mean of the three women-(men-)specific indicators for education, health and standard of living. The SHDI for women (men) has a value between 0 and 1. The higher the SHDI value, the higher the human development achievements (Smits and Permanyer, 2019).
13.^This indicator measures the percentage of women/girls aged 15–19 years ever married, divorced, widowed or in informal union out of the total number of women/girls aged 15–19 years.
14.^This indicator measures the percentage of ever-partnered women aged 15–49 years who ever suffered intimate partner physical and/or sexual violence and/or women aged 15–49 years who ever experienced physical or domestic violence since age 15 in their lifetime.
15.^Some countries are not part of our 87 countries dataset due to lack of data available to compute the three risk component indicators and, unfortunately, often the most data-deficit environments are also the most poverty-stricken and vulnerable, or conflict-stricken.
16.^We used a geographic information system (GIS) application combining the hotspot index data by country and data files that store the location, shape and attributes of geographic features such as countries (Shapefiles). QGIS is an example of an open-source geographic information system application that can be used for mapping https://www.qgis.org/en/site/. Shapefiles are accessible through https://globaldatalab.org/mygdl/downloads/shapefiles/We used the GIS application to define ten equal intervals based on the range of the hotspot index values and applied a sequential color code to the ten intervals. We allocated the lightest orange color to lowest risk (i.e., lowest hotspot index values) and darker orange color with increasing risk (i.e., increasing hotspot index values).
17.^With the method proposed by Anderson (2008), an index is constructed as a weighted mean of standardized components with inverse-covariance weighting of the components. This ensures that components that are uncorrelated and thus represent new information receive more weight, while components that are highly correlated with each other receive less weight.
18.^Our hotspot risk index based on the average of the standardized component variables and the index based on the Anderson method are strongly and statistically correlated (according to both pairwise and Spearman rank correlation tests) (see Appendix B). These indices are also well correlated with the PCA-based index. Classification difference of LMICS in the highest and lowest risk tertiles by our hotspot risk index and the index based on the Anderson method are limited, there is more classification difference compared to the PCA-based index.
19.^The descriptive statistics of the sub-indicators used in the computation of the subnational agricultural-activity specific climate–agriculture–gender inequality hotspot index indices are presented in Appendix C.
20.^We ran similar correlation, rank correlation and classification difference analyses as robustness tests. While it varies by agricultural activity, we observe statistically significant (rank) correlations for most agricultural activity specific indices and moderate to low classification difference, particularly when comparing indices based on Anderson method and averages of the standardized component variables.
21.^On the other hand, calculating index values that only use information of subnational areas within one country (which would imply a relative hotspot ranking within a country) following the methodology described here might be relevant for local targeting and prioritization.
22.^Hotspot maps for vegetables, roots and tubers in Mali, rice in Zambia, perennial crops in Pakistan and mixed farming in Bangladesh are missing as the number of observations was insufficient to derive reliable statistics.
23.^Across country and across agricultural activity, we used the GIS application to define equal sized intervals of the hotspot index values and applied a sequential color code to the intervals similar to one used for hotspot countries.
24.^Other criteria for deciding a subnational area is a hotspot could be, for instance, that it has the highest number of highest hotspot index values, or it is the hottest for an agricultural activity (or set of activities) of particular interest for policy, study or intervention.
25.^Primary in-depth case studies and impact studies to pilot test interventions have been have been conducted in sub-national hotspot areas in Zambia and Bangladesh as part of the wider research project (Forthcoming).
26.^The maps in Appendix F illustrate that the hotspot ranking of subnational areas within a country differs per agricultural activity. This is linked to the importance of the agricultural activity and/or exposure faced by women that differs per agricultural activity.
27.^The importance of livestock and women’s high labor contributions are evident from the values of the exposure sub-indicators for Tombouctou included in the livestock-related hotspot risk index (see Supplementary materials). The relatively high values of the indicators also indicate significant climate hazard and vulnerability.
28.^The importance of perennials and women’s high labor contributions are also evident from the values of the exposure sub-indicators for Luapula (see Supplementary materials). The relatively high values of the indicators also indicate significant climate hazard and vulnerability.
29.^The importance of cereals, leguminous crops and oilseeds and women’s high labor contributions in these crops are evident from the values of the exposure sub-indicators for Punjab (see supplementary materials). The relatively high values of the indicators also indicate significant climate hazard and vulnerability.
30.^Haors are wetlands formed by tectonic depressions that receive surface runoff water. Hoars receive a lot of runoff water during the Monsoon rains and large sections become submerged.
31.^The importance of rice farming and women’s high labor contributions in rice farming are evident from the values of the exposure sub-indicators for the cluster of Kishoreganj, Mymensingh and Netrokona districts (see Supplementary materials). The relatively high values of the indicators also indicate significant climate hazard and vulnerability.
32.^For a gender analysis in small-scale fisheries refer to section 6.1 in FAO et al. (2023). “Illuminating Hidden Harvests – The contributions of small-scale fisheries to sustainable development.” Rome. https://doi.org/10.4060/cc4576en
33.^One could argue, however, that it would have been more accurate to use the term agriculture instead of agrifood system considering the limitation in data availability for calculating employment in downstream activities of the agri-food system.
References
1
AcostaM.van BommelS.van WesselM.AmpaireE. L.JassogneL.FeindtP. H. (2019). Discursive translations of gender mainstreaming norms: the case of agricultural and climate change policies in Uganda. Women Stud. Int. Forum.74, 9–19. doi: 10.1016/j.wsif.2019.02.010
2
AcostaM.van WesselM.van BommelS.FeindtP. H. (2021). Examining the promise of ‘the local’ for improving gender equality in agriculture and climate change adaptation. Third World Q.42, 1135–1156. doi: 10.1080/01436597.2021.1882845
3
AhmedS.EklundE. (2021). Climate change impacts in coastal Bangladesh: migration, gender, and environmental justice. Asian Affairs52, 155–174. doi: 10.1080/03068374.2021.1880213
4
AitaC.AhmedA. (2022). The intersection of climate change and gender equality in South Asia. The National Bureau of Asian Research. Available at: https://www.nbr.org/publication/the-intersection-of-climate-change-and-gender-equality-in-south-asia/ (Accessed June 23, 2023).
5
AkterS.KrupnikT. J.RossiF.KhanamF. (2016). The influence of gender and product design on farmers’ preferences for weather-indexed crop insurance. Global Environ. Chang.38, 217–229. doi: 10.1016/j.gloenvcha.2016.03.010
6
AlamK.RahmanM. H. (2014). Women in natural disasters: a case study from southern coastal region of Bangladesh. Int. J. Disaster Risk Reduct.8, 68–82. doi: 10.1016/j.ijdrr.2014.01.003
7
AlamuE. O.NtawuruhungaP.ChibweT.MukukaI.ChionaM. (2019). Evaluation of cassava processing and utilization at household level in Zambia. Food Secur.11, 141–150. doi: 10.1007/s12571-018-0875-3
8
AllenT.HeinrigsP.HeoI. (2018). Agriculture, food, and jobs in West Africa. West African Papers. 14. OECD Publishing, Paris.
9
Amjath-BabuT. S.AgarwalP. K.VermeulenS. (2019). Climate action for food security in South Asia? Analyzing the role of agriculture in nationally determined contributions to the Paris agreement. Clim. Pol.19, 283–298. doi: 10.1080/14693062.2018.1501329
10
AmpaireE. L.AcostaM.HuyerS.KigonyaR.MuchunguziP.MunaR.et al. (2020). Gender in climate change, agriculture, and natural resource policies: insights from East Africa. Clim. Chang.158, 43–60. doi: 10.1007/s10584-019-02447-0
11
AndersonM. L. (2008). Multiple inference and gender differences in the effects of early intervention: a reevaluation of the Abecedarian, Perry Preschool, and Early Training Projects. J. Am. Stat. Assoc.103, 1481–1495. doi: 10.1198/016214508000000841
12
AnugwaI. Q.AgwuA. E.SuvediM.BabuS. (2020). Gender-specific livelihood strategies for coping with climate change-induced food insecurity in Southeast Nigeria. Food Secur.12, 1065–1084. doi: 10.1007/s12571-020-01042-x
13
BabuguraA. A. (2020). Gender and green jobs in agriculture. Agenda34, 108–116. doi: 10.1080/10130950.2020.1719705
14
Baidu-ForsonJ. J.ChanamweS.MuyauleC.MulandaA.NdiyoiM.WardA. (2015). “Capturing views of men, women and youth on agricultural biodiversity resources consumed in Barotseland, Zambia” in Working paper AAS-2015-17. CGIAR research program on aquatic agricultural systems (Penang, Malaysia).
15
BarangeM.BahriT.BeveridgeM. C. M.CochraneK. L.Funge-SmithS.PoulainF. (2019). Impacts of climate change on fisheries and aquaculture: Synthesis of current knowledge, adaptation and mitigation options. Food and Agriculture Organization. Rome.
16
BernierQ.Meinzen-DickR.KristjansonP. et. al. (2015). Gender and institutional aspects of climate-smart agricultural practices: evidence from Kenya. Working Paper 79, CGIAR Research Program on Climate Change, Agriculture and Food Security (CCAFS). Available at: https://hdl.handle.net/10568/65680
17
BryanE.AlviM.HuyerS.RinglerC. (2023). “Addressing gender inequalities and strengthening women’s agency for climate-resilient and sustainable food systems” in CGIAR GENDER impact platform working paper (Nairobi: CGIAR GENDER Impact Platform).
18
BryanE.KatoE.BernierQ. (2021). “Gender differences in awareness and adoption of climate-smart agriculture practices in Bangladesh” in Gender, climate change and livelihoods: Vulnerabilities and adaptations. eds. EastinJ.DupuyK. (UK: CABI), 123–142.
19
BryanE.TheisS. C.ChoufaniJ.De PintoA.Meinzen-DickR.RinglerC. (2017). “Conceptual framework: gender, climate change, and nutrition integration initiative” in GCAN policy note 7, international food policy research institute (IFPRI) (Washington DC). Available at: http://ebrary.ifpri.org/cdm/singleitem/collection/p15738coll2/id/132300
20
CameronE. C.HemingwayS. L.CunninghamF. J.JacquinK. M. (2021). Global crises: gendered vulnerabilities of structural inequality, environmental performance, and modern slavery. Human Arenas.4, 391–412. doi: 10.1007/s42087-020-00154-2
21
Centre for Environmental and Geographic Information Services (CEGIS). (2012). Master plan of Haor area. Government of the People’s Republic of Bangladesh. Bangladesh Haor and Wetland Development Board. Available at: https://dbhwd.portal.gov.bd/sites/default/files/files/dbhwd.portal.gov.bd/publications/baf5341d_f248_4e19_8e6d_e7ab44f7ab65/Haor%20Master%20Plan%20Volume%201.pdf
22
Chanana-NagN.AggarwalP. K. (2018). Woman in agriculture, and climate risks: hotspots for development. Clim. Chang.158, 13–27. doi: 10.1007/s10584-018-2233-z
23
CIAT and The World Bank. (2017a). Climate-Smart Agriculture in Pakistan. CSA Country Profiles for Asia Series, CIAT, World Bank, Washington DC. Available at: https://climateknowledgeportal.worldbank.org/sites/default/files/2019-06/CSA-in-Pakistan.pdf
24
CIAT and The World Bank. (2017b). Climate-Smart Agriculture in Zambia. CSA Country Profiles for Africa Series. CIAT, World Bank, Washington, DC. Available at: https://climateknowledgeportal.worldbank.org/sites/default/files/2019-06/CSA%20_Profile_Zambia.pdf
25
CIAT, ICRISAT, and BFS/USAID. (2021). Climate-smart agriculture in Mali. CSA country profiles for Africa series. CIAT, Bureau for Food Security, United States Agency for International Development (BFS/USAID), Washington, DC. Available at: https://ccafs.cgiar.org/resources/publications/climate-smart-agriculture-mali
26
CurranS.AndersonL.C.GugertyM.K.CookJ. (2009). Gender and cropping: Cassava in Sub-Saharan Africa. EPAR Research Brief #32, Evans School Policy Analysis and Research Group, Washington, DC.
27
Data Africa. (2014). Tombouctou, Mali. Available at: https://dataafrica.io/profile/tombouctou-mli/PovertyByGender
28
de BrauwA. (2015). Gender, control, and crop choice in northern Mozambique. Agric. Econ.46, 435–448. doi: 10.1111/agec.12172
29
de SherbininA. (2014). Climate change hotspots mapping: what have we learned?Clim. Chang.123, 23–37. doi: 10.1007/s10584-013-0900-7
30
De SouzaK.KituyiE.HarveyB.LeoneM.MuraliK. S.FordJ. D. (2015). Vulnerability to climate change in three hot spots in Africa and Asia: key issues for policy-relevant adaptation and resilience-building research. Reg. Environ. Chang.15, 747–753. doi: 10.1007/s10113-015-0755-8
31
DioufN. S.OuedraogoM.OuedraogoI.AbloukaG.ZougmoréR. (2020). Using seasonal forecast as an adaptation strategy: gender differential impact on yield and income in Senegal. Atmos.11:1127. doi: 10.3390/atmos11101127
32
DjoudiH.BrockhausM. (2011). Is adaptation to climate change gender neutral? Lessons from communities dependent on livestock and forests in northern Mali. Int. For. Rev.13, 123–135. doi: 10.1505/146554811797406606
33
DjoudiH.LocatelliB.VaastC.AsherK.BrockhausM.SijapatiB. B. (2016). Beyond dichotomies: gender and intersecting inequalities in climate change studies. Ambio45, 248–262. doi: 10.1007/s13280-016-0825-2
34
DossC. R. (2002). Men’s crops? Women’s crops? The gender patterns of cropping in Ghana. World Dev.30, 1987–2000. doi: 10.1016/S0305-750X(02)00109-2
35
DruczaK.PeveriV. (2018). Literature on gendered agriculture in Pakistan: neglect of women’s contributions. Women Stud. Int. Forum.69, 180–189. doi: 10.1016/j.wsif.2018.02.007
36
DuffyC.PedeV.TothG.KilclineK.O’DonoghueC.RyanM.et al. (2021). Drivers of household and agricultural adaptation to climate change in Vietnam. Clim. Dev.13, 242–255. doi: 10.1080/17565529.2020.1757397
37
EastinJ. (2018). Climate change and gender equality in developing states. World Dev.107, 289–305. doi: 10.1016/j.worlddev.2018.02.021
38
EC-JRC (2019). Description of the GHS Urban Centre database 2015: public release 2019: version 1.0Publications Office Available at: https://data.europa.eu/doi/10.2760/037310.
39
ErmanA.De Vries RobbeS.A.ThiesS.F.KabirK.MaruoM. (2021). Gender dimensions of disaster risk and resilience: existing evidence. The World Bank and the Global Facility for Disaster Reduction and Recovery, Washington, DC.
40
EvertsenK. F.van der GeestK. (2020). Gender, environment and migration in Bangladesh. Clim. Dev.12, 12–22. doi: 10.1080/17565529.2019.1596059
41
FAO. (2015). Women in agriculture in Pakistan. FAO, Rome.
42
FAO. (2017). Country fact sheet on food and agriculture policy trends: mali. Fact sheet. FAORome.
43
FAO, Duke University, and World Fish. (2023). Illuminating hidden harvests – the contributions of small-scale fisheries to sustainable development. FAO, Rome.
44
FarooqZ. (2022). Effect of climate change on Punjab Province of Pakistan. Environmental issues. ENVPK. Available at: https://www.envpk.com/effect-of-climate-change-on-punjab-province-of-pakistan/#:~:text=With%20the%20increasing%20average%20temperatures,areas%20along%20with%20heat%20waves (Accessed March 23, 2023).
45
FerdushiK. F.IsmailM.KamilA. A. (2019). Perceptions, knowledge and adaptation about climate change: a study on farmers of Haor areas after a flash flood in Bangladesh. Climacteric7:85. doi: 10.3390/cli7070085
46
FilmerD.PritchettL. H. (2001). Estimating wealth effects without expenditure data—or tears: an application to educational enrolments in states of India. Demography38, 115–132. doi: 10.1353/dem.2001.0003
47
FisherM.CarrE. R. (2015). The influence of gendered roles and responsibilities on the adoption of technologies that mitigate drought risk: the case of drought-tolerant maize seed in eastern Uganda. Glob. Environ. Chang.35, 82–92. doi: 10.1016/j.gloenvcha.2015.08.009
48
Food and Agriculture Organization of the United Nations (FAO). (2020). Empowering rural women, powering agriculture. Available at: https://www.fao.org/3/ca2678en/CA2678EN.pdf
49
Global Data Lab (2019). Sub-national GDI. Available at: https://globaldatalab.org/shdi/metadata/sgdi/ (Accessed July 24, 2023).
50
Global Data Lab (2020). Subnational GDI. Available at: https://globaldatalab.org/shdi/table/sgdi/MLI+ZMB+BGD+PAK/?levels=1+4&years=2019&interpolation=0&extrapolation=0 (Accessed July 24, 2023).
51
Government of Pakistan (GoP). (2021a). Chapter 2: Agriculture, Pakistan Economic Survey 2020–21. Finance Division, Government of Pakistan, Islamabad. Available at: https://www.finance.gov.pk/survey/chapters_21/02-Agriculture.pdf
52
Government of Pakistan (GoP). (2021b). Punjab provincial climate change action plan. Ministry of climate change. Islamabad: Government of Pakistan.
53
Government of the People’s Republic of Bangladesh (GOB). (2018). Nationwide climate vulnerability assessment in Bangladesh. Available at: https://moef.portal.gov.bd/sites/default/files/files/moef.portal.gov.bd/notices/d31d60fd_df55_4d75_bc22_1b0142fd9d3f/Draft%20NCVA.pdf
54
Government of the Republic of Zambia (GRZ). (2021). Gender Status Report 2017–19. Ministry of Gender, Republic of Zambia, Lusaka.
55
GumucioT.HansenJ.HuyerS.Van HuysenT. (2020). Gender-responsive rural climate services: a review of the literature. Clim. Dev.12, 241–254. doi: 10.1080/17565529.2019.1613216
56
HabibN.AlauddinM.CrambR. (2022). What defines livelihood vulnerability to climate change in rain-fed, rural regions? A qualitative study of men’s and women’s vulnerability to climate change in Pakistan’s Punjab. Cogent. Soc. Sci.8:1. doi: 10.1080/23311886.2022.2054152
57
HoqM. S.RahaS. K.HossainM. I. (2021). Livelihood vulnerability to flood Hazard: understanding from the flood-prone Haor ecosystem of Bangladesh. Environ. Manag.67, 532–552. doi: 10.1007/s00267-021-01441-6
58
HossainA. M.RezaI. M.RahmanS.KayesI. (2012). “Climate change and its impacts on the livelihoods of the vulnerable people in the southwestern coastal zone in Bangladesh” in Climate change and the sustainable use of water resources. ed. FilhoW. L., Climate Change Management (Berlin: Springer), 237–259.
59
HuyerS. (2016). Closing the gender gap in agriculture. Gend. Technol. Dev.20, 105–116. doi: 10.1177/0971852416643872
60
HuyerS.AcostaM.GumucioT.IlhamJ. I. J. (2020). Can we turn the tide? Confronting gender inequality in climate policy. Gend. Dev.28, 571–591. doi: 10.1080/13552074.2020.1836817
61
Integrated Public Use Microdata Series (IPUMS) (2020). “Data from Minnesota population center” in Integrated public use microdata series, international: Version 7.3 (Minneapolis, MN: IPUMS) dataset.
62
Intergovernmental Panel on Climate Change (IPCC). (2014). Climate change 2014: impacts, adaptation, and vulnerability. Part A: Global and Sectoral Aspects. Cambridge University Press, Cambridge, United Kingdom and New York, NY, USA, 1132
63
International Labour Organization (ILO). (2021). Employment by sex and economic activity — ILO modelled estimates. ILOSTAT database. Available at: https://ilostat.ilo.org/data (Accessed May 27, 2022).
64
IPCC (2014). “Summary for policymakers,” in Climate Change 2014: impacts, Adaptation, and Vulnerability. Part A: Global and Sectoral Aspects. Contribution of Working Group II to the Fifth Assessment Report of the Intergovernmental Panel on Climate Change. eds. FieldC. B.BarrosV. R.DokkenD. J.MachK. J.MastrandreaM. D.BilirT. E.et al. (Cambridge, United Kingdom and New York, NY, USA: Cambridge University Press), 1–32.
65
IPCC (2019). Climate Change and Land: an IPCC special report on climate change, desertification, land degradation, sustainable land management, food security, and greenhouse gas fluxes in terrestrial ecosystems. IPCC, Geneva.
66
IPCC. (2020). The concept of risk in the IPCC Sixth Assessment Report: a summary of cross-working group discussions. IPCC, Geneva.
67
IradukundaF.BullockR.RietveldA.van SchagenB. (2019). Understanding gender roles and practices in the household and on the farm: implications for banana disease management innovation processes in Burundi. Outlook Agr.48, 37–47. doi: 10.1177/0030727019831704
68
JarvisA.RosenstockT.KooJ.ThorntonPhilip K.RodriguezAna María Loboguerrero (2021). Climate-informed priorities for one CGIAR regional integrated initiatives. CCAFS. Available at: https://hdl.handle.net/10568/113289
69
JostC.KyazzeF.NaabJ.NeelormiS.KinyangiJ.ZougmoreR.et al. (2016). Understanding gender dimensions of agriculture and climate change in smallholder farming communities. Clim. Dev.8, 133–144. doi: 10.1080/17565529.2015.1050978
70
KapihyaL. (2017). A comparative study on women’s land rights in Zambia: access, ownership, control, and decision-making. USAID: Tenure and Global Climate Change Program, Washington, DC. Available at: https://pdf.usaid.gov/pdf_docs/PA00SWWG.pdf
71
Khatri-ChhetriA.AggarwalP. K.JoshiP. K.VyasS. (2017). Farmers’ prioritization of climate smart agriculture (CSA) technologies. Agric. Syst.151, 184–191. doi: 10.1016/j.agsy.2016.10.005
72
KristjansonP.BryanE.BernierQ.et al. (2017). Addressing gender in agricultural research for development in the face of a changing climate: where are we and where should we be going?Int. J. Agric. Sustain.15, 482–500. doi: 10.1080/14735903.2017.1336411
73
LambrouY.NelsonS. (2010). Farmers in a changing climate: does gender matter? Food security in Andhra Pradesh, India, Rome. FAO.
74
LauJ. D.KleiberD.LawlessS.CohenP. J. (2021). Gender equality in climate policy and practice hindered by assumptions. Nat. Clim. Chang.11, 186–192. doi: 10.1038/s41558-021-00999-7
75
MalakarK.MishraT.HariV.KarmarkarS. (2021). Risk mapping of Indian coastal districts using IPCC-AR5 framework and multi-attribute decision-making approach. J. Environ. Manag.294:112948. doi: 10.1016/j.jenvman.2021.112948
76
MazziottaM.ParetoA. (2019). Use and misuse of pca for measuring well-being. Soc. Indic. Res.142, 451–476.
77
McGaheyD.DaviesJ.HagelbergN.OuedraogoR. (2014). Pastoralism and the green economy – a natural nexus?IUCN and UNEP, Nairobi.
78
McOmberC. (2020). Women and climate change in the Sahel. West African Papers 27 OECD Publishing, Paris.
79
Minnesota Population Center. (2020). Integrated public use microdata series, international: Version 7.3 [dataset]. IPUMS, Minneapolis.
80
NazF.SaqibS. E. (2021). Gender-based differences in flood vulnerability among men and women in the char farming households of Bangladesh. Nat. Hazards106, 655–677. doi: 10.1007/s11069-020-04482-y
81
NchuI. N.KimengsiJ. N.KappG. (2019). Diagnosing climate adaptation constraints in rural subsistence farming systems in Cameroon: gender and institutional perspectives. Sustainability11:3767. doi: 10.3390/su11143767
82
NelsonV.MeadowsK.CannonT.MortonJ.MartinA. (2002). Uncertain predictions, invisible impacts, and the need to mainstream gender in climate change adaptations. Gend. Dev.10, 51–59. doi: 10.1080/13552070215911
83
NeumayerE.PlümperT. (2007). The gendered nature of natural disasters: the impact of catastrophic events on the gender gap in life expectancy, 1981–2002. Ann. Assoc. Am. Geogr.97, 551–566. doi: 10.1111/j.1467-8306.2007.00563.x
84
NgigiM. W.MuellerU.BirnerR. (2017). Gender differences in climate change adaptation strategies and participation in group-based approaches: an intra-household analysis from rural Kenya. Ecol. Econ.138, 99–108. doi: 10.1016/j.ecolecon.2017.03.019
85
Nhat Lam DuyenT.RañolaR. F.SanderB. O.WassmannR.TienN. D.NgocN. N. K. (2021). A comparative analysis of gender and youth issues in rice production in north, central, and South Vietnam. Clim. Dev.13, 115–127. doi: 10.1080/17565529.2020.1734771
86
NjukiJ.EisslerS.MalapitH. J.Meinzen-DickR. S.BryanE.QuisumbingA. (2022). A review of evidence on gender equality, women’s empowerment, and food systems. Glob Food Secur.33:100622. doi: 10.1016/j.gfs.2022.100622
87
OCHA. (2022). Pakistan: 2022 flash floods – situation report. New York. UN Office for the Coordination of Humanitarian Affairs.
88
OECD. (2014). Social institutions and gender index (SIGI). Synthesis Report. OECD Development Centre. Available at: https://www.oecd.org/dev/development-gender/BrochureSIGI2015-web.pdf (Accessed July 26, 2022).
89
OECD. (2019). Social institutions and gender index (SIGI) 2019. Country profile: Zambia. OECD Development Centre. Available at: https://www.genderindex.org/wp-content/uploads/files/datasheets/2019/ZM.pdf (Accessed March 30, 2023).
90
OngoroE.OgaraW. (2012). Impact of climate change and gender roles in community adaptation: a case study of pastoralists in Samburu East District, Kenya. Int. J. Biodivers. Conserv.4, 78–89. doi: 10.5897/IJBC11.174
91
Osman-ElashaB. (2012). In the shadow of climate change. UN Chron.46, 54–55. doi: 10.18356/5d941c92-en
92
OtienoS. (2016). Climate change increases risks in slums. SciDevNet. Available at: https://www.scidev.net/sub-saharan-africa/news/climate-change-increases-risks-slums/. (Accessed August 28, 2023).
93
Oxfam. (2019). Stories of climate change: Learn and think about the impacts of the climate crisis on people’s lives. Education Resource Brief, Oxfam, Oxford.
94
Pakistan Institute of Development Economics (PIDE). (2021). The state of poverty in Pakistan. Available at: https://file.pide.org.pk/uploads/rr-050-the-state-of-poverty-in-pakistan-pide-report-2021-68-mb.pdf
95
ParteyS. T.ZougmoréR. B.OuédraogoM.CampbellB. M. (2018). Developing climate-smart agriculture to face climate variability in West Africa: challenges and lessons learnt. J. Clean. Prod.187, 285–295. doi: 10.1016/j.jclepro.2018.03.199
96
PaudyalB. R.ChananaN.Khatri-ChhetriA.SherpaL.KadariyaI.AggarwalP. (2019). Gender integration in climate change and agricultural policies: the case of Nepal. Front. Sustain. Food Syst.3:66. doi: 10.3389/fsufs.2019.00066
97
PerezC.JonesE. M.KristjansonP.CramerL.ThorntonP. K.FörchW.et al. (2015). How resilient are farming households and communities to a changing climate in Africa? A gender-based perspective. Global Environ. Chang.34, 95–107. doi: 10.1016/j.gloenvcha.2015.06.003
98
PuskurR.MishraA. (2022). Rural women in Pakistan are the most affected by ‘apocalyptic’ floods. Gender Insights. CGIAR GENDER Impact Platform. Available at: https://gender.cgiar.org/news/rural-women-pakistan-are-most-affected-apocalyptic-floods (Accessed on March 23, 2023).
99
QuisumbingA. R.KumarN.BehrmanJ. A. (2018). Do shocks affect men’s and women’s assets differently? Evidence from Bangladesh and Uganda. Dev. Policy Rev.36, 3–34. doi: 10.1111/dpr.12235
100
RabbaniM.G.KhanZ.M.TuhinM.H. (2015). Climate change and migration in Bangladesh: a gender perspective. Bangladesh Centre for Advanced Studies for UN Women, Dhaka. Available at: https://asiapacific.unwomen.org/en/digital-library/publications/2016/01/climate-change-and-migration-in-bangladesh
101
RahamanM. A.RahmanM. M.HossainM. S. (2019). “Climate-resilient agricultural practices in different agro-ecological zones of Bangladesh” in Handbook of climate change resilience. ed. FilhoW. L. (Cham: Springer), 2337–2363.
102
RahmanM.PalashM.JahanH.JalilovS. M.MainuddinM. (2020). An empirical investigation of men’s views of women’s contribution to farming in Northwest Bangladesh. Sustainability12:3521. doi: 10.3390/su12093521
103
RaoN.LawsonE. T.ElaineT.RaditloanengW. N.SolomonD.AngulaM. N. (2019a). Gendered vulnerabilities to climate change: insights from the semi-arid regions of Africa and Asia. Clim. Dev.11, 14–26. doi: 10.1080/17565529.2017.1372266
104
RaoN.MishraA.PrakashA.SinghC.QaisraniA.PoonachaP.et al. (2019b). A qualitative comparative analysis of women’s agency and adaptive capacity in climate change hotspots in Asia and Africa. Nat. Clim. Chang.9, 964–971. doi: 10.1038/s41558-019-0638-y
105
RaoN.MitraA. (2013). Migration, representations, and social relations: experiences of Jharkhand labour to Western Uttar Pradesh. J. Dev. Stud.49, 846–860. doi: 10.1080/00220388.2013.778399
106
RaoN.SinghC.SolomonD.CamfieldL.SidikiR.AngulaM.et al. (2020). Managing risk, changing aspirations and household dynamics: implications for wellbeing and adaptation in semi-arid Africa and India. World Dev.125:104667. doi: 10.1016/j.worlddev.2019.104667
107
SchipperE.LisaF.ReviA.PrestonB. L.CarrE. R.EriksenS. R.et al. (2022). “Climate resilient development pathways” in WGII sixth assessment report. Climate change 2022: impacts, adaptation and vulnerability. ed. IPCC (New York: Cambridge University Press), 2655–2819.
108
SegnonA. C.TotinE.ZougmoréR.LokossouJ. C.Thompson-HallM.OforiB. O.et al. (2021). Differential household vulnerability to climatic and non-climatic stressors in semi-arid areas of Mali, West Africa. Clim. Dev.13, 697–712. doi: 10.1080/17565529.2020.1855097
109
SeymourG.FloroM.S. (2016). Identity, household work, and subjective well-being among rural women in Bangladesh. IFPRI Discussion Paper 01580, IFPRI, Washington, DC.
110
SharmaJ.RavindranathN. H. (2019). Applying IPCC 2014 framework for hazard-specific vulnerability assessment under climate change. Environ. Res. Communicat.1:1004. doi: 10.1088/2515-7620/ab24ed
111
SmitsJ.PermanyerI. (2019). The subnational human development database. Sci. Data.6:190038. doi: 10.1038/sdata.2019.38
112
Strengthening Partnerships, Results, and Innovations in Nutrition Globally project (SPRING). (2016). Agriculture and nutrition in Mali through a gender lens: a qualitative study, literature review, SPRING. Arlington.
113
TannyN. Z.RahmanM. W.AliR. N. (2017). Climate-induced gender vulnerabilities in northwestern Bangladesh. Indian J. Gend. Stud.24, 360–372. doi: 10.1177/0971521517716808
114
TatemA. J. (2017). WorldPop, open data for spatial demography. Sci. Data4:170004. doi: 10.1038/sdata.2017.4
115
The World Bank. (2020). Poverty and equity brief; Africa Western & Central, Mali. Global Poverty Data. The World Bank, Washington, DC.
116
The World Bank. (2021). Employment statistics. Indicator: employment in agriculture. Available at: https://data.worldbank.org/indicator/SL.AGR.EMPL.ZS (Accessed May 27, 2022).
117
The World Bank. (2023). Poverty and equity brief; South Asia, Bangladesh Global Poverty Data. The World Bank, Washington, DC.
118
TheisS.BryanE.RinglerC. (2019). “Addressing gender and social dynamics to strengthen resilience for all” in 2019 annual trends and outlook report: Gender equality in rural Africa: From commitments to outcomes. eds. QuisumbingA. R.Meinzen-DickR. S.NjukiJ. (Washington, DC: IFPRI), 126–139.
119
TigchelaarM.CheungW. W. L.MohammedE. Y.PhillipsM. J.PayneH. J.SeligE. R.et al. (2021). Compound climate risks threaten aquatic food system benefits. Nat. Food.2, 673–682. doi: 10.1038/s43016-021-00368-9
120
TsigeM.SynnevågG.AuneJ. B. (2020). Gendered constraints for adopting climate-smart agriculture amongst smallholder Ethiopian women farmers. Sci. Afr.7:e00250. doi: 10.1016/j.sciaf.2019.e00250
121
United Nations Development Programme (UNDP). (2016). Zambia human development report 2016. UNDP, Lusaka.
122
United Nations Development Programme (UNDP). (2023). Unstacking global poverty: data for high impact action. Pakistan; Multidimensional Poverty Index.
123
United Nations Population Fund (UNFPA). (2011). Pakistan flooding: one year later. Available at: https://www.unfpa.org/news/pakistan-flooding-one-year-later (Accessed June 23, 2023).
124
United Nations Women (UN Women). (2020). Rural women, key for a world free from hunger and poverty. International Day of Rural Women. Observations. UN Women, New York. Available at: https://www.un.org/en/observances/rural-women-day
125
USAID. (2014). Zambia livelihood zones and descriptions. Famines Early Warning Systems Network (FEWS NET). Washington, DC: USAID.
126
USAID. (2019). Mali country profile. Mali Briefing Book. Washington, DC.
127
Van AelstK.HolvoetN. (2016). Intersections of gender and marital status in accessing climate change adaptation: evidence from rural Tanzania. World Dev.79, 40–50. doi: 10.1016/j.worlddev.2015.11.003
128
VincentK.CullT. (2014). Using indicators to assess climate change vulnerabilities: are there lessons to learn for emerging loss and damage debates?Geogr. Compass8, 1–12. doi: 10.1111/gec3.12105
129
VyasS.KumaranayakeL. (2006). Constructing socio-economic status indices: how to use principal components analysis. Health Policy Plan21, 459–468. doi: 10.1093/heapol/czl029
130
WhiteP.FinneganG.PehuE.PoutiainenP.VyzakiM. (2015). Linking women with agribusiness in Zambia: corporate social responsibility, creating shared value, and human rights approaches. The World Bank, Washington, DC.
131
WilderspinI.GilesJ.HildebrandJ.LizarazoM.KhanM.GrosjeanG. (2019). Climate-smart agriculture in Sindh, Pakistan. CSA Country Profiles for Asia Series. CIAT, FAO. Rome.
132
YadavS. S.LalR. (2018). Vulnerability of women to climate change in arid and semi-arid regions: the case of India and South Asia. J. Arid Environ.149, 4–17. doi: 10.1016/j.jaridenv.2017.08.001
133
Zambia Statistics Agency, Ministry of Health (MOH) Zambia, and ICF. (2019). Zambia demographic and health survey 2018. Lusaka, Zambia, and Rockville, Maryland, USA: Zambia Statistics Agency, Ministry of Health, and ICF.
Summary
Keywords
climate change, gender inequalities, women, agri-food systems, hotspot mapping, low- and middle-income countries
Citation
Lecoutere E, Mishra A, Singaraju N, Koo J, Azzarri C, Chanana N, Nico G and Puskur R (2023) Where women in agri-food systems are at highest climate risk: a methodology for mapping climate–agriculture–gender inequality hotspots. Front. Sustain. Food Syst. 7:1197809. doi: 10.3389/fsufs.2023.1197809
Received
31 March 2023
Accepted
05 October 2023
Published
16 November 2023
Volume
7 - 2023
Edited by
Katie Tavenner, Consultant, Turrialba, Costa Rica
Reviewed by
Viswanathan Pozhamkandath Karthiayani, Amrita Vishwa Vidyapeetham (Amritapuri Campus), India; Michelle Tigchelaar, Stanford University, United States
Updates
Copyright
© 2023 Lecoutere, Mishra, Singaraju, Koo, Azzarri, Chanana, Nico and Puskur.
This is an open-access article distributed under the terms of the Creative Commons Attribution License (CC BY). The use, distribution or reproduction in other forums is permitted, provided the original author(s) and the copyright owner(s) are credited and that the original publication in this journal is cited, in accordance with accepted academic practice. No use, distribution or reproduction is permitted which does not comply with these terms.
*Correspondence: Els Lecoutere, e.lecoutere@cgiar.org
Disclaimer
All claims expressed in this article are solely those of the authors and do not necessarily represent those of their affiliated organizations, or those of the publisher, the editors and the reviewers. Any product that may be evaluated in this article or claim that may be made by its manufacturer is not guaranteed or endorsed by the publisher.