Abstract
As wild-caught fish become scarce, feed ingredients for farming fish, such as salmon, are increasingly sourced from agricultural plants that depend on mineral fertilizers. Since these fish are naturally carnivorous, they have difficulty digesting the phosphorus in plant-based feed. So additional phosphorus supplements are added to the feed, resulting in a disproportionate increase in mineral phosphorus use and emission. Aquatic food production is increasingly relying on agriculture and mineral phosphorus resources. The feed surplus and the excreta are seldom collected and recycled, leading to a massive loss of nutrients to water bodies and the seafloor, resulting in local risk for eutrophication. Norway currently produces more than half of the world’s Atlantic salmon, and it is set to increase production from currently 1.5 to 5 Mt. in 2050. This has large implications for feed supply and emissions globally. There is a lack of studies that analyze the phosphorus system in aquatic food production at a sufficient spatial and temporal granularity to effectively inform interventions for a more circular use of phosphorus. Here, we present a multi-scale phosphorus flow analysis at monthly resolution ranging between 2005 and 2021 for aquatic food production in Norway and quantitatively discuss the effectiveness of alternative strategies for improving resource efficiency. The results indicate that P emissions from aquaculture have nearly doubled in the period between 2005 and 2021. The P use efficiency (PUE) in Norwegian aquaculture was 19% in 2021. The addition of phytase to the feed could improve the PUE by 8% by reducing P supplements and emissions by 7 kt/y. The use of Integrated Multi-Trophic Aquaculture close to fish farming sites could absorb emissions by 4 kt/y by creating new marine food products. Sludge collection systems could reduce P emissions by 4 to 11 kt/y, depending on the technology. Using the sludge in local agriculture would exacerbate the current P accumulation in soils close to the coastline, given that the animal density in this region is already high. Hence, a large and sophisticated processing infrastructure will be needed to create transportable, high-quality secondary fertilizers for effective sludge recycling in regions with a P deficit.
1. Introduction
Aquatic food production is rapidly increasing its impact on the global phosphorus (P) cycle, with potentially severe effects on both primary resource availability and eutrophication (Carpenter and Bennett, 2011). The growing and more affluent global population places a rising demand for fish protein. While capture fisheries have reached their sustainability limits in the 1980s, the growth in fish supply is mainly attributed to the expansion of aquaculture (Huang et al., 2020). Since 2004, the global phosphorus input to water bodies has exceeded the total phosphorus yield from both wild fish capture and fish farming (Huang et al., 2020). Aquaculture relies on terrestrial phosphorus resources for feed production and mineral supplements. Due to the limited availability of capture fish, the feed used for cultivating fish such as salmon contains increasing amounts of plant-based ingredients from agriculture, such as soybean (Aas et al., 2022b,c). Furthermore, as these fish have a poor capacity to digest plant-based P, additional mineral P is added to the fish feed (Kumar et al., 2012). Both of these P resources depend on the use of phosphate rock, a limited resource that is concentrated in a handful of countries, mainly Morocco, Western Sahara, and China (Kumar et al., 2012).
To address this challenge, we require robust information on (i) the systemic linkages between the agriculture, fisheries, and aquaculture, (ii) the spatial distribution of the emissions and intervention options, and (iii) the temporal variability of the P use and emissions. While phosphate rock availability is mainly a global challenge, eutrophication is often a local or regional problem with high seasonal variability due to changes in fish nutrition, growth, and excreta.
Nutrient budgets only balance the inflows and outflows of nutrients from fish farming (Verdegem, 2013; Wang et al., 2013), which is insufficient to analyze the potential for collection and recycling. In contrast, studies of sludge collection technologies, have focused mainly on the technologies themselves (Matias del Campo et al., 2010; Clarke et al., 2018), without analyzing the larger systemic effects on the P cycle. Hamilton et al. (2016) analyzed the P cycle in Norway and showed that P flows in aquaculture have reached the level of P flows in agriculture. They discussed options for improving P resource efficiency at the national scale, but lacked the spatial and temporal granularity to explore the potential and limitations of alternative strategies.
Norway is endowed with many fjords and a long coastline, which makes it well suited for large-scale aquaculture. Production is focused on Atlantic salmon, which is highly sensitive to water quality. In 2021, Norway was responsible for more than 50% of global Atlantic salmon production (FAO, 2023). As a consequence, several more granular studies of P balances were conducted for the aquaculture sector in Norway (Wang et al., 2012, 2013; Torrisen et al., 2016; Aas et al., 2019; Broch and Ellingsen, 2020). However, these studies had more limited and specific foci and they did not attempt to explore the full potential for improving phosphorus use efficiency within the industry. Wang et al. (2012) addressed the regional distribution of emission by developing a nutrient balance for a single salmon farm and scaling the results to the county and national levels. Broch and Ellingsen (2020) built on this model using refined parameters from Aas et al. (2019) and Wang et al. (2013) at the production area level rather than the county level. Meanwhile, the Norwegian Institute for Marine Research created the Total Ecosystem Water (TEOTIL) model in 1996 to monitor emissions and eutrophication risks at the watershed level, which has been widely used by policymakers (Norderhaug et al., 2016). However, all these studies estimated emissions based on the average rates of metabolism in fish’s digestive system, without considering regional conditions, seasonal fluctuations, and the age of the fish, all of which have significant impacts on feed demand and sludge collection potential.
Few studies have addressed the potential of implementing different strategies for improving phosphorus use in aquatic food production systems in Norway. Wang et al. (2012) have analyzed the total nutrient availability of salmon farming for upscaling Integrated Multi-Trophic Aquaculture (IMTA), but they did not quantify other potentials for using P more effectively. There is a lack of studies that systematically explore the potentials of Norway to reduce primary resource dependence and emissions.
Here, we present the results of a multi-scale substance flow analysis (SFA) for phosphorus in Norway’s aquatic food production systems, including fisheries, smolt production, and grow-out phase. We balance phosphorus flows in the grow-out phase at locality (farm level) scale with monthly resolution ranging between 2005 and 2021. We use the model is to explore the effectiveness of alternative strategies for a more circular use of phosphorus in aquatic food production and its necessary linkages with agriculture.
2. Methods
2.1. System definition
We conducted a multi-scale (Liu and Müller, 2013) and multi-layer (Hamilton et al., 2016) material flow analysis (Brunner and Rechberger, 2016) for the anthropogenic P cycle in the Norwegian ocean. The system analyzed includes the capture of wild fish (including pelagic fish and white fish) and crustaceans as well as the production of Atlantic salmon (Salmo salar) and rainbow trout (steelhead – Oncorhynchus mykiss irideus), which account for >98% of total aquaculture production. We defined a system that included fisheries and processing, smolt production, grow-out production, and sludge collection (see Figure 1). The trade of marine ingredients for fish feed as well as trade of living fish, the production and trade of plant and mineral based feed ingredients, final food products, and waste-based products (mostly ensilage of dead fish) are excluded from our system (see Figure 1).
Figure 1
Fisheries and processing of wild fish, smolt and the grow-out production were modelled as separate processes. Both fisheries and smolt production were balanced only at the national level whereas grow-out production was balanced at locality level (farm-level).
Smolt production, comprising of 231 localities nationally involves raising young salmonids to a certain size, was assumed to be entirely produced using Recirculatory Aquaculture Systems (RAS). In RAS, wastewater is treated on-site, and the sludge is collected. In practice, there are some production facilities with flow – through systems where the wastewater is not released into the nearby water bodies with or without further treatment. In Norway, approximately 50% of smolt were produced with RAS in 2018 and share of smolt produced using RAS is growing drastically (Nystøyl, 2019; PwC, 2022). Our assumption leads to an overestimation of collected sludge from the smolt production.
Grow-out production comprising of 989 localities in Norway, is a later stage, where the fish are usually transferred to the ocean and further grown to a marketable size. For the baseline quantification we assumed that all grow-out production happens in the open ocean. However, a recent study showed that as of September 2019, 48 RAS facilities were under operation and 7 under construction (Nistad, 2020), which is a small fraction (<5%) of the total grow-out production. This is however not reflected in the production data reporting and could therefore not be included in this study.
Within every grow-out production locality, the water column and the fish are modelled as distinct processes. Feed is introduced into the water column. Most of the feed is consumed by the fish, while the uneaten feed becomes part of the emissions (sludge). The process fish includes all the fish within the water column. It tracks the flow of living fish (such as smolt and grow-out), metabolization of feed and outflow from slaughter, as well as losses due to mortalities and escapes. To model metabolization, we further divided the fish into three subprocesses – Assimilation, Absorption, and Growth. The emitted sludge consists of fish excrements and uneaten feed, comprising both a particulate fraction (Particulate Organic Phosphorus or POP) and a dissolved fraction (Dissolved Organic and Inorganic Phosphorus or DOP and DIP).For additional modeling details, please refer to the Supplementary material.
2.2. Quantification
Data required for quantification of fisheries were derived from Statistics Norway (SSB, 2019) and for the quantification of smolt and grow-out the data was obtained from The Norwegian Directorate for Fisheries (2022, 2023).
Fisheries and processing, as well as smolt production are quantified at national level only for 2021, using the data reported by The Norwegian Directorate of Fisheries and estimates from literature.
The grow-out production is quantified from 2005 to 2021 at monthly resolution and locality level. Each locality (production site) is quantified based on data published by the Norwegian Directorate of Fisheries (The Norwegian Directorate of Fisheries). Reported dataset includes feed, total biomass, losses, live imports, and slaughters. Average concentrations for Dry Matter (DM) in Wet Weight (WW) and Phosphorus (P) in DM, assimilation efficiency of the fish, and solubility of particulate P and weight of smolt are supplemented with farm level data (see Table 1). Most flows are thereby calculated by multiplying reported numbers with average weight and concentrations. The values for growth and excrements are calculated by balancing the system at both DM and P levels. The emissions of P were aggregated at municipality level to obtain the geographical distribution of emissions.
Table 1
| Name | Unit | Lower limit | Upper limit | Mode | CI ratio nat. level | Source | Histogram of modes |
|---|---|---|---|---|---|---|---|
| Feed loss | kg/kg | 0.008 | 0.05 | 0.01 | 0.8 | Wang et al. (2013); Broch and Ellingsen (2020); Tassal (2017) | 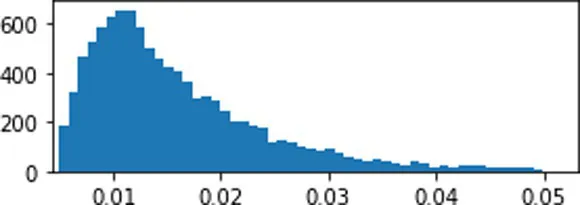 |
| Smolt weight at release | kg | 0.1 | 1 | 0.2 | 0.2 | Holte et al. (2018) | 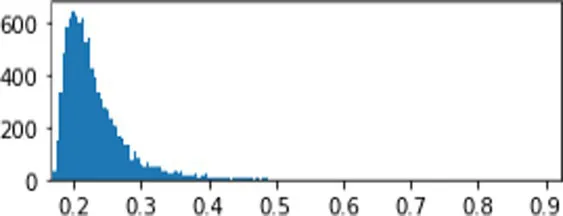 |
| Dry matter in feed | kg DM/ kg WW | 0.91 | 0.98 | 0.934 | 0.3 | Aas et al. (2022c) | 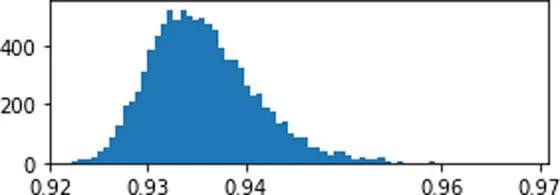 |
| Dry matter in fish | kg DM/ kg WW | 0.31 | 0.42 | 0.41 | 0.4 | Aas et al. (2022a) | 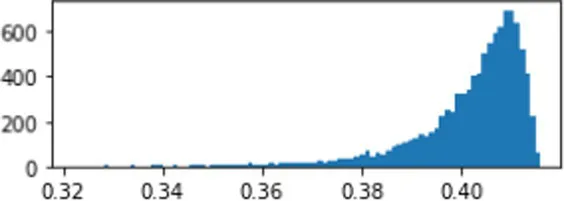 |
| P in feed | kg P/ kg DM | 0.0069 | 0.014 | 0.0094 | 0.4 | Aas et al. (2022c) | 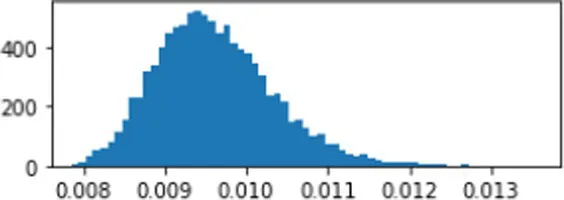 |
| Plant based P | % | 0.36 | 0.38 | 0.37 | 1 | Aas et al. (2022c) | 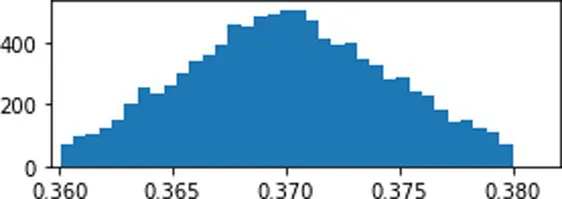 |
| Marine based P | % | 0.33 | 0.35 | 0.34 | 1 | Aas et al. (2022c) | 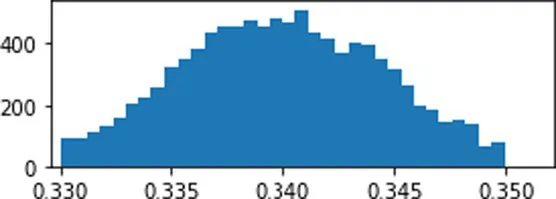 |
| Mineral based P | % | 0.28 | 0.30 | 0.29 | 1 | Aas et al. (2022c) | 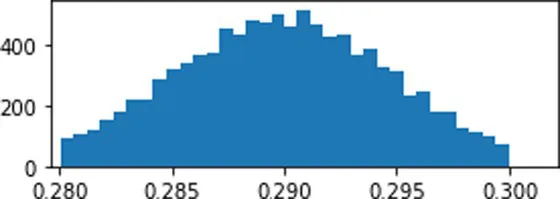 |
| P in fish | kg P/ kg DM | 0.0032 | 0.0092 | 0.006 | 0.8 | Aas et al. (2022a); Wang et al. (2013) | 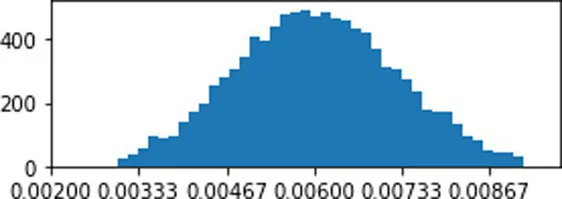 |
| Assimilation efficiency P | kg P/ kg P | 0.25 | 0.5 | 0.375 | 0.8 | Wang et al. (2013); Torrisen et al. (2016) | 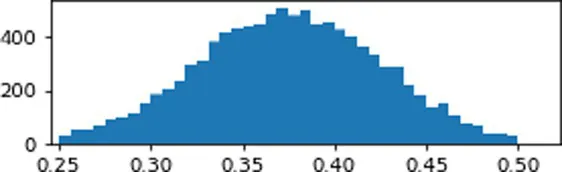 |
| Soluble fraction | kg P/ kg P | 0.1 | 0.2 | 0.15 | 0.8 | Wang et al. (2013); Broch and Ellingsen (2020) | 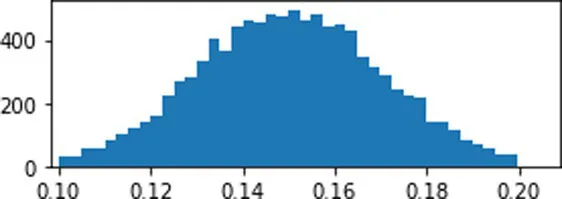 |
Key parameters for quantification.
Lower and upper limits represent the most extreme values that were found in the literature, while the mode is the most probable single value, also found in the literature. Each Monte Carlo iteration uses a different mode at national level based on the Class Interval (CI) ratio to determine the distribution for parameters at farm level; the histogram of modes shows the distribution of modes for all ten thousand Monte Carlo iterations.
We effectively balanced the fish pen based on reported statistics but account for the metabolism of individual fish through parameters derived from literature. We corroborated the use of our parameters with industry experts (H. Steffensen, personal communication, September 05, 2022). Feed loss, which is feed that cannot be eaten (dust & breakage) and the feed which is not eaten due to overfeeding or changes in appetite varies from site to site. But we assumed a standard value based on other models and experience within the industry (Wang et al., 2012; Tassal, 2017; Broch and Ellingsen, 2020). The parameters related to DM and P concentrations related to body of the fish (Aas et al., 2022a) and feed (Aas et al., 2022b,c) are based on primary studies that analyzed 70 slaughter sized salmon and feed ingredients from four large Norwegian feed companies for the year 2020. The values for soluble fraction and assimilation efficiency could not be corroborated by industry experts but we used the best estimates found within the literature.
To investigate the robustness of the results for grow-out production, we compiled uncertainties within the parameters used for quantification, in the form of lower and upper limits at the farm level. These upper and lower levels, as well as a mode (most probable value) were derived from literature and validated through personal communication (H. Steffensen, personal communication, September 5, 2022).
National level uncertainties are influenced by this farm level variation, but with a limited range centered around the mode. This range is specified as the Class Interval (CI) ratio national level, as presented in Table 1. These uncertainties are propagated using relative uncertainty with maximum and minimum values and a statistical distribution. The uncertainty was quantified using a Monte Carlo simulation with 10,000 iterations. The distribution as well as a realization of the farm level distribution can be found in Table 1.
2.3. Scenario assumptions
We analyzed four strategies for improving P resource efficiency using a scenario analysis by simulating alternative production methods:
Adding phytase to the feed to improve P digestibility (Cao et al., 2007; Carter and Sajjadi, 2010), lowering the phosphorus content within the feed. The P content of feed with phytase varies largely based on industry practice but we assumed it to be 0.6 ± 0.1% (Biomar, 2023). We assumed that this does not affect total feed consumption and phosphorus retention.
Implementing Integrated Multi-Trophic Aquaculture (IMTA) in the water bodies surrounding the grow out production. We used literature estimates for stocking densities based on Nederlof et al. (2022), where it is suggested for a commercial salmon farm of approximately 1,800 tons, 47 ha of seaweed, 12 ha of bivalves and 237 ha of deposit feeders has maximum absorption potential. Based on this we calculated 1ton salmon production potentially needs 0.026 ha of seaweed, 0.006 ha of bivalves, 0.13 ha of deposit feeders. We assumed that the seaweed cultivated here is Saccharina latissimi (Sugar Kelp), which grows naturally in large quantities in Norway and often discussed as a commercially viable product from IMTA (Fossberg et al., 2018). Bivalves grown here were assumed to be Crassostrea gigas (Oysters) and deposit feeder Hediste diversicolor (Ragworms). Since there are significant variations in stocking densities a 30% relative uncertainty was allocated. The dry matter andphosphorus (%) concentrations in Sugar Kelp, Oysters and Ragworms are assumed as 12% and 0.51% (Reid et al., 2013), 13% and 0.8% (Higgins et al., 2011), and 19% and 0.85% (Sæther, 2022) respectively.
For simplicity, ragworms were modeled to absorb POP, oysters DOP, and kelp DIP. Although DOP is not directly absorbed by oysters, it is consumed through their microbial food web, alongside dissolved organic carbon from sludge.
iii. Extending the period of the smolt production based on RAS. The industry’s strategy to combat sea lice and emissions is raising the smolt to weigh higher, i.e., 1 kg before release (Holte et al., 2018). We assessed phosphorus collection from all fish <1 kg in 2021, assuming RAS usage.
iv. We simulated the P flows for alternative production systems in the grow out phase to collect the sludge. We investigated the sludge collection in 2021 had the production method been changed to RAS or Closed Containment Systems at sea (CCS). We also investigated the effect of introducing collection systems in open cages, comprising of a collector placed in water in an area below the cage called Open Cage collection Systems (OCS). In RAS, although there are large variations in P removal efficiencies (Li et al., 2023),we assumed that POP is collected by the mechanical filter with an efficiency of 70 ± 10%; the DOP and DIP are collected in the biofilter with an efficiency of 70 ± 10%. In CCS the efficiency to filter out particulate waste to be around 60%–80% of particulate matter in the most efficient systems (Rosten et al., 2013; Clarke et al., 2018). We assumed that CCS collects POP in sludge with an efficiency of 70 ± 10%. We assume that OCS collects the POP in sludge with an efficiency of 50 ± 10% (Fossmark A., personal communication, April 20, 2021).
3. Results
3.1. Annual P cycle at national scale
In 2021, Norwegian aquatic food production, added approximately 5 kt more phosphorus into the ocean than what was harvested from caught and farmed fish. A total of 12 kt P was harvested from the ocean as caught fish. Of which, 2 kt P was used as feed for farming salmon, 9 kt P was sold for human consumption and 1 kt P was dumped back to the ocean as scrap. 17 kt P was emitted back in total from fishing and fish farming.
Smolt production, including post-smolt, resulted in the generation of 0.3 kt of phosphorus (P) in smolt and 1.0 kt of P in sludge. This required 1.3 kt P of feed, containing 0.5 kt P of plant-based ingredients, 0.4 kt P of marine based ingredients and 0.4 kt P of mineral based ingredients. The majority of secondary P available in the current sludge market originates from smolt production, amounting to 0.7 kt of P in sludge, while the remaining 0.3 kt of P is emitted into the ocean.
Grow-out production imported 19.3 ± 0.7 kt P in the form of fish feed and emitted 15.6 ± 0.8 (≈16) kt P to the ocean (Figure 2). The feed contained 7.2 ± 0.2 kt P from plant-based ingredients, 6.5 ± 0.2 kt P from marine-based ingredients and 5.6 ± 0.2 kt P in the form of micro-ingredients (mineral P). The amount of P in slaughtered salmon was 3.8 ± 0.4 (≈4) kt P. Hence, the grow-out phase had an average phosphorus use efficiency (PUE) – P in slaughtered fish to P added to the pen (feed + smolt) – of 19.6 ± 0.1%. Considering both smolt and grow-out phase is required for salmon production, the phosphorus use efficiency of aquaculture is 18.7 ± 0.1% (≈19%).
Figure 2
In grow-out production, 18.9 ± 0.6 kt P (98% of the feed) was eaten by the fish. The emissions, including feed loss and fish excretion, consisted of 10.2 ± 0.5 kt POP, 1.8 ± 0.1 kt DOP and 3.5 ± 0.1 kt DIP. The dead fish and live escapes amount to 0.2 ± 0.02 kt P and 0.08 ± 0.02 kt P, respectively. The average retention efficiency – the growth per feed eaten – is 19.1 ± 0.1%. The emissions differ significantly by production size: The largest 30% of producers (263 farms) generate 59% of the emissions, totaling 8.2 kt P. The largest 60% produce 87% of the total emissions, which amounts to 14 kt P.
3.2. Spatial distribution
The aquaculture industry produces fish mainly on the western coastline along the Norwegian sea. The areas in Norway with the largest P emissions from aquaculture coincide with the areas of the largest manure surplus in agriculture (Las Heras Hernández et al., 2023) (Figure 3).
Figure 3
The average fish producing municipality generated 0.1 ± 0.1 kt P/yr. of sludge. However, there are significant differences in emission levels across locations. The highest emissions in 2021 were found in Frøya, with 0.5 kt P/yr., followed by Naerøysund with 0.3 kt P/yr., and Stavanger with 0.2 kt P/yr. We have identified areas with high emission concentrations, which are indicated by circles with a 50 km radius. Hitra in Trøndelag has the highest concentration, with 1.7 kt P, followed by Tysnes in Vestland with 1.6 kt P. The emission clusters shown in Figure 3 account for over 35% of the total P emissions across Norway (Figure 3A).
3.3. Temporal variations
Atlantic salmon and rainbow trout typically have a 3-year growth cycle. The growth rate showed a strong seasonal oscillation: the fish grew 2–3 times faster during the warmer mid-year months compared to winter. Correspondingly the emissions also peaked mid-year creating large seasonal variation in sludge production over the year. For example, in 2021, the fish emitted only 0.7 kt P in January whereas the emissions rose to around 1.9 kt P in June, eventually falling back to 1.2 kt P again in November (Figure 4). The different fractions of emissions (POP, DOP, and DIP) follow this trend in their shares in total emissions. The average emissions from grow out fish production showed a constant increase over the years, more than doubling between 2005 and 2021.
Figure 4
3.4. Strategies to improve P use
Adding phytase reduced both the overall demand for P in feed and the P emissions, by 6.9 ± 1.6 (≈7) kt P without changing the P in harvested biomass. This increased the PUE from 19% to 27% (Figure 5).
Figure 5
Our model showed IMTA has the potential to collect up to 23% of total emissions (0.5 ± 0.2 kt of POP in ragworms, 1.0 ± 0.2 kt of DOP in oysters, and 2.2 ± 0.7 kt of DIP in kelp). The corresponding relative increase in PUE in this scenario is 19%. However, to achieve these yields, a large area of cultivation would be required, i.e., over 10,000 ha for ragworms, 400,000 ha for oysters, and 2,500,000 ha for kelp production. The required kelp production area would be nearly equivalent to the land area of Slovenia.
If the smolt and post-smolt were held on land longer until they reached a weight of 1 kg, approximately 1.0 ± 0.14 kt POP, 0.2 ± 0.02 kt DOP and 0.5 ± 0.1 kt DIP can be collected, counting for approximately 12% of the total emissions. Implementation of RAS across all production localities can collect approximately 71% of P in sludge – 7.1 ± 1.1 kt POP, 1.2 ± 0.2 kt DOP, and 2.5 ± 0.2 kt DIP. If RAS is implemented in 30% of the largest emitting localities, 41% of the total emissions could be collected. CCS could collect 7.2 ± 1.1 kt POP if implemented across all farms. OCS has the collection potential of 4.5 ± 0.8 kt of POP if implemented across all localities.
Assuming 50 kg DM/kg P and 22 MJ / kg DM in sludge, based on Aas and Åsgård (2017), the collection of sludge from grow-out production using different technologies makes available 4–10kt P and 4,400,000 TJ–11,000,000 TJ energy equivalents. Assuming a 50% conversion efficiency to biogas, an energy equivalent of up to 5,500,000 TJ is available for biomethane or electricity and heat production. However, the energy efficiency of electricity production from anerobic digestion is approximately 35% (IEA, 2020), meaning up to 1,925,000 TJ of electricity could be produced from the collected biogas. This corresponds to an energy demand of about corresponding to an energy demand of ≈ 26,000 households [A Norwegian household requires 73 GJ/ yr. according to SSB (2012)]. However, significant amounts of energy would also be required for transportation and drying of sludge.
4. Discussion
4.1. Robustness of the model
Our model is based on data from the Norwegian Directorate of Fisheries, which is considered to have high accuracy. A relatively uncertain value is production loss (deaths and escapes), because instead of always reporting empirical values, the localities use this field to rectify any inconsistencies.
At an aggregate level, our results present some degree of variation in comparison to earlier academic studies. Wang et al. (2013) estimated in their P balance of salmon farms in 2009 that P input in feed was found to be 13 kt/yr. and emissions to be 9 kt/yr.; for the same year the Guerrero and Sample (2022) estimated P emissions to be 8 kt/yr. In our model, we find that in 2009 inputs were 11 kt/yr. and emissions 9 kt/yr., which is a value that lies between the estimations of these studies. Hamilton et al. (2016) projected an average phosphorus emission from feed loss and waste of 9 kt/yr. during 2009–2011. Our own estimation of 9 kt/yr. for 2010 aligns with this figure. Broch and Ellingsen (2020) estimated that 2019 P emissions from grow out fish production emissions were 10 kt/yr. POP, 2 kt/yr. DOP and 2 kt/yr. DIP, comparatively higher than our estimated values of 8 kt/yr. POP, 1 kt/yr. DOP and 2 kt/yr. DIP. Guerrero and Sample (2022) estimated P emissions from aquaculture to be 12 kt/yr. in 2020 and our estimates showed a higher value of 14 kt/yr. We used the same data sources for feed consumption and fish production as the other studies, but the difference may be attributed mainly to the fact that we conduct mass balance based on locality level production while other studies use standard coefficient such as sludge to feed ratio or retention efficiency based on an average fish balance for calculation of emissions (Selvik et al., 2007; Wang et al., 2013).
According to Wang et al. (2013), approximately 52% of the total P input in fish feed is released as POP, 18% as DIP, and 8% as DOP. Our results for the same year are similar, we estimated that 53% of the total P input is released as POP, 18% as DIP, and 9% as DOP. However, there is no consensus in the literature on the total amount of DIP emissions from salmon. Some studies suggest that salmon absorb net inorganic P from the ocean, resulting in negative emissions of up to 1.5 kg per ton of salmon produced (Torrisen et al., 2016). Other studies suggest that salmon can emit up to 5.1 kg of DIP per ton of salmon produced (Wang et al., 2013; Broch and Ellingsen, 2020). Retention efficiency estimates for P in fish from literature vary from 18% to 29% (Wang et al., 2013; Torrisen et al., 2016; Aas et al., 2019, 2022c). Here, we estimated retention by calculating growth of the fish in pens by change in biomass in reported values, making retention implicit based on reported change in biomass within the pens. We find that the retention efficiency in our model is 19% with variations across the seasons.
4.2. Strategies for improving aquatic P use
The PUE in Norwegian salmon and trout production could be increased from 19% to 27% by adding phytase to the fish feed. Phytase not only improves P digestibility and reduces P excretion, it could also enhance the bioavailability of other nutrients such as Ca, Zn, and Fe (Lei and Stahl, 2000; Cao et al., 2007). This feed is, however, more expensive than the standard feed but it is increasingly becoming the standard practice among the fish farmers in the Baltic Sea where the waters are at a higher risk of eutrophication and the producers are therefore required by law to reduce their nutrient emissions (Kause et al., 2022).
An increase in share of marine ingredients would largely help in reduction of wastage of P from land to water bodies. According to a report by Miljøstiftelsen Bellona (2022), the important sources of marine feed ingredients to explore include (i) cultivated raw materials like blue mussel, tunicates, macroalgae, etc., (ii) harvested raw materials like Antarctic krill, mesopelagic fish and copepods (iii) byproducts from fisheries and aquaculture like liver, roe, skin, and heads. However, overharvesting of krill and other mesopelagic fish can potentially disrupt marine ecosystems and food chains, leading to reduced biodiversity, nutritional stress for dependent species, and potential population decline in predator species. This can have far-reaching ecological consequences and impact the overall stability and functioning of marine ecosystems. Hence, a systematic exploration of upscaling of these measures is needed for sustainably increasing the marine share in feed ingredients.
Implementation of integrated multi-trophic aquaculture (IMTA) can increase the share of usable products produced using the same inputs. It can also help in reduction of accumulation of P within water bodies. However, its implementation requires large amounts of land and significant infrastructural and market improvements to process new marine products. IMTA also provides an opportunity to create additional skilled jobs in coastal communities, and it could provide a source of alternative marine ingredients for feed (Ellis and Tiller, 2019). A Danish company Biå Biomasse AS (2023) harvests 8,000 tons of blue mussels from Limfjorden every year and reported the phosphorus uptake associated with this to be between 6 and 13 tons P/yr. There are also several initiatives in Norway such as the Lerøy ocean forest that are exploring sustainable and commercial production of kelp and mussels in IMTA. However, the utilization of seaweed and ragworms in IMTA is currently restricted due to incomplete regulations. The Regulations on Transmissible Spongiform Encephalopathies (2004) prohibit the use of ragworms as fish feed, citing potential disease transmission risks. The Strategy for an Environmentally Sustainable Norwegian Aquaculture Industry (Norwegian Ministry of Fisheries and Coastal Affairs, 2009) recognizes the importance of addressing key issues, including genetic interaction, pollution, disease, area utilization, and the use of IMTA products as feed. Kelp produced from IMTA, which could make up for 53% of total collected P, is shown to have is a large potential in Norway (Fossberg et al., 2018). However, despite some commercial success of IMTA in other countries (Soto, 2009; Buschmann et al., 2014; González-Roca et al., 2021), it is not widely implemented in Norway due to economic and regulatory reasons (Stévant et al., 2017). However, there are upcoming initiatives and pilot projects (Lerøy, 2022) in Norway that explore the commercial implementation IMTA, including the production of different types of kelp based on dissolved inorganic nutrients.
The transition from open cage to closed cage production including RAS helps significantly in collecting emissions. It also reduces sea lice, which causes higher mortality, lowers harvest weights, and reduces quality of the harvested salmon. We assumed that all the smolt is produced in RAS, but even with this assumption the sludge collection potential is insignificant in comparison with that of the grow out phase. Several salmon producers have started extension of the smolt and post (phase where salmon grow and mature following smolt phase) process in land-based phase to produce fish of up to 1 kg before they are released for on-growing in the sea (Holte et al., 2018). In comparison with sludge production from smolt that are released to ocean at 150 gms, the extension would lead to over 7 times more P in collected sludge. However, this still only accounts for 12% of the total emitted sludge from the grow-out phase. To effectively collect most of the sludge produced RAS is needed, as it collects over 70% of P in emissions. Drawbacks of RAS include increase in land use, water use, energy use and susceptibility to technical failures due to power outages or water supply disruptions (Bjørndal and Tusvik, 2019). The Closed Containment System at sea (CCS) systems are still in the research and development phase (Clarke et al., 2018). The main motivation to develop CCS is reduction of sea lice and fish escapes but it also collects the particulate fraction of the sludge. Development of research on the CCS technology with nutrient collection in mind might further increase the potential for sludge collection from these systems. Open Cage collection Systems (OCS) technology is mostly sought after at sites that are susceptible to eutrophication due to low currents, where increased emissions might lead to an extension of the fallowing period, reducing production capacities. OCS requires relatively low infrastructure investment compared to the other technologies discussed. Both CCS and OCS are only capable of collecting particulate nutrients while dissolved nutrients is lost to the sea. To collect also dissolved nutrients, they could be combined with IMTA. However, collecting a part of the emissions using another technology reduces the nutrients becoming available for IMTA. There are no empirical studies that analyze feasibility of implementing IMTA with other collection technologies.
The collection of sludge is regulated with the intention of reducing the release of polluting substances to the ocean (Klima- og miljødepartementet, 1981). The salmon producers are given licenses based on the evaluation of the environmental impact on the ocean bed under the production facility (Miljødirektoratet, 2022). However, to promote the implementation of new sludge collection technologies in the aquaculture industry, stronger regulations and viable markets for processed sludge are necessary (Føre et al., 2022). Designing licenses that addresses not only environmental concerns but also promote the development and adoption of new sludge collection technologies is also needed to support the sustainable development of aquaculture (Osmundsen et al., 2022).
The pathways for transforming sludge into a useful fertilizer product are still in a nascent stage and are unlikely to be able to handle the expected sudden increase in volume of organic waste if sludge collection becomes a standard practice (Sandvold et al., 2019). The current infrastructure for sludge treatment in Norway is capable of handling only small amounts of sludge. Fish producing firms often enter into simple agreements with local farmers who accept marginally treated sludge, which tends to result in large P surpluses in the soil.
Significant infrastructure investments will be needed to process sludge once it is collected. Furthermore, these infrastructures need to be able to handle the large seasonal variations in sludge production. Development of biogas plants for energy recovery is increasingly seen as an attractive option to process fish sludge in Norway (Berge, 2023). An LCA analysis of production of biogas from fish sludge has shown it could lead to positive environmental benefit in terms of avoided CO2 emissions from diesel consumption, provided that transport distances are less than 300 km and that the digestate can be readily substituted for mineral fertilizers (Carlos Francisco de Asis Acosta Moreno, 2016). If the sludge is processed in biogas plants, a large fraction carbon in sludge is transformed into biofuel while phosphorus remains in the digestate. It cannot be readily used as high-quality fertilizer as the ideal requirements for N:P:K ratios are not met. Co-digestion of anerobic fish sludge digestate with agriculture waste or combining anaerobic digestate with stabilized liquid fish products are being discussed as strategies develop high quality fertilizers (Ahuja et al., 2020).
The high-water content in fish sludge poses a cost challenge when transporting it over long distances. Due to the increased weight and volume, specialized infrastructure and transportation methods are required, leading to higher expenses. Moreover, the higher water content means that a larger volume of sludge needs to be transported or on-site infrastructure needs to be developed for de watering. As a result, the transportation costs associated with fish sludge over long distances can be considerable, requiring careful consideration and planning when implementing sludge management strategies.
Another barrier is the lack of coordination between fertilizer producers and fish producers. There needs to be effective collaboration and communication between these two industries to ensure the proper handling, processing, and utilization of fish sludge as fertilizer. Without proper coordination, the potential benefits of fish sludge as a resource may not be fully realized. Additionally, a supportive regulatory environment is crucial for the adoption of fish sludge-based fertilizers. Regulations need to be in place to ensure the safe and environmentally sustainable use of these fertilizers, while also addressing any concerns related to nutrient content, potential contaminants, and proper application practices.
Overall, addressing these barriers and challenges requires collaboration among stakeholders, including fish producers, biogas producers, fertilizer manufacturers, transportation networks, and regulatory bodies, to develop effective solutions and frameworks for the utilization of fish sludge-based fertilizers (Sandvold et al., 2019).
4.3. Usage of phosphorus in sludge within agriculture
If phosphorus (P) from fish sludge is not collected, it accumulates in water bodies, wasting resources and posing a risk of eutrophication. When collected but not transformed into high-quality fertilizer, the sludge is often applied to the soil alongside mineral fertilizers, causing excessive phosphorus application. Over time, the phosphorus in the soil becomes less available to plants as it reacts with minerals in the soil to form less soluble compounds. Fish sludge is often viewed as a waste product that can be disposed on agricultural land near production sites, without proper consideration for efficient management of nutrients. Whether the sludge can be used locally within agriculture depends on regional phosphorus demand and processing infrastructure. But once the sludge is collected, using it in a beneficial way requires a high level of sophistication in processing and evaluation of need for P in agriculture.
Circularity strategies therefore need to be evaluated for the combined agriculture and aquaculture system: a circular system between land and sea could be established only if the nutrients that originally came from land to the sea as feed would be collected as sludge and recycled back to land as fertilizer. If the aquaculture sludge were collected, an obvious strategy could be to use it as a fertilizer in the agricultural areas around the collection centers. However, there are severe limitations on utilizing collected secondary P within Norwegian agriculture. Collection of sludge within Norway leads to availability of up to 11 kt of secondary P, which is of similar order as the current annual production of P in manure. Due to spatial variations (Figure 4) and lack of transportable high quality manure fertilizer, farmers are unable to use the manure surplus efficiently within the country. If manure use was optimized nationally, the annual P fertilizer demand would be reduced from 12 kt to 2 kt (Las Heras Hernández et al., 2023). This would drastically reduce the potential for a meaningful utilization of fish sludge in Norwegian agriculture. Either how, to create a circular bioeconomy Norway will need to develop an infrastructure to process large quantities of manure and fish sludge. The nutrients required for producing fish feed in Norway comes from the global market, the increasing production of fish in Norway also has an impact on resource cycles at a global level. To support the creation of a circular economy, high-quality transportable organic fertilizers made from secondary P in Norway will be needed. This raises questions on whether sludge and manure in Norway should be processed together or separately.
The use of organic fertilizers is gaining popularity due to their nutrient-rich composition, especially in tropical and subtropical soils. In fact, Norwegian companies are already exploring collaborations with countries such as Vietnam and Thailand to use fish sludge as an organic fertilizer for crop production (Gibson, 2020). However, studies such as the one conducted by Brod and Øgaard (2021) found that the plant availability of P in fish sludge was significantly lower than that in animal manure. Additionally, while fish sludge is rich in P, it lacks sufficient nitrogen to become a high-quality fertilizer readily. Moreover, there are potential risks associated with heavy metal contamination of the sludge, particularly for Zn and Cd (Brod and Øgaard, 2021). To produce a high-quality secondary fertilizer based on fish sludge, these challenges need to be addressed. Moreover, the nutrient ratio (N: P: K) of fish sludge, which is often too high in P and too low in N and K, need to be tailored to meet farmers’ needs based on regional considerations and farming type.
Statements
Data availability statement
The datasets presented in this article are not readily available because it was obtained from The Norwegian Directorate of Fisheries. It contains information on biomass production at the locality level including sensitive data subject to the rules and regulations laid out by the General Data Protection Regulation (GDPR). The dataset is called ‘Biomass data at locality level’ and can be requested from The statistics department at The Norwegian Directorate of Fisheries (statistikk@fiskeridir.no).
Author contributions
DM and KR contributed to conception and design of the study. AP and AS collected and organized the data. ND programmed the model. LL conducted the geographic analysis. AP wrote the first draft of the manuscript. DM, ND, and ML wrote sections of the manuscript. All authors contributed to the article and approved the submitted version.
Funding
This article represents one of the outcomes of the scientific research carried out by the MIND-P project, which has received funding from the Norwegian Research Council (project number – 268338).
Acknowledgments
The authors thank Helen Hamilton from Biomar, Andreas Fossmark from Lift Up, and Harland Steffensen from Skretting for sharing insights and the Norwegian Directorate of Fisheries for providing data. We thank the advisory board of the MIND-P project for providing their insights on data and interpretation of the results.
Conflict of interest
The authors declare that the research was conducted in the absence of any commercial or financial relationships that could be construed as a potential conflict of interest.
Publisher’s note
All claims expressed in this article are solely those of the authors and do not necessarily represent those of their affiliated organizations, or those of the publisher, the editors and the reviewers. Any product that may be evaluated in this article, or claim that may be made by its manufacturer, is not guaranteed or endorsed by the publisher.
Supplementary material
The Supplementary material for this article can be found online at: https://www.frontiersin.org/articles/10.3389/fsufs.2023.1248984/full#supplementary-material
References
1
AasTurid SynnøveÅsgårdTorbjørn. (2017). “Estimated content of nutrients and energy in feed spill and faeces in Norwegian Salmon culture.” Nofima AS: 11562. Nofima AS.
2
AasT. S.ÅsgårdT.YtrestøylT. (2022a). Chemical composition of whole body and fillet of slaughter sized Atlantic Salmon (Salmo Salar) and rainbow trout (Oncorhynchus Mykiss) farmed in Norway in 2020. Aquacult. Rep.25:101252. doi: 10.1016/j.aqrep.2022.101252
3
AasT. S.ÅsgårdT.YtrestøylT. (2022b). Utilization of feed resources in the production of Atlantic Salmon (Salmo Salar) in Norway: an update for 2020. Aquacult. Rep.26:101316. doi: 10.1016/j.aqrep.2022.101316
4
AasT. S.YtrestøylT.ÅsgårdT. (2019). Utilization of feed resources in the production of Atlantic Salmon (Salmo Salar) in Norway: an update for 2016. Aquacult. Rep.15:100216. doi: 10.1016/j.aqrep.2019.100216
5
AasTurid SynnøveYtrestøylT.ÅsgårdTorbjørn Einar. (2022c). Utnyttelse av fôrressurser i norsk oppdrett av laks og regnbueørret i 2020. Faglig sluttrapport. Nofima AS.
6
AhujaI.DauksasE.RemmeJ. F.RichardsenR.LøesA.-K. (2020). Fish and fish waste-based fertilizers in organic farming – with status in Norway: a review. Waste Manag.115, 95–112. doi: 10.1016/j.wasman.2020.07.025
7
BergeA. (2023). “Slam fra fôrrester og fiskeekskrementer kan gi strøm til 600.000 husstander.” iLaks (blog). Available at: https://ilaks.no/slam-fra-forrester-og-fiskeekskrementer-kan-gi-strom-til-600-000-husstander/ (Accessed February 13, 2023).
8
Biå Biomasse AS. (2023). “Muslinger – Kan fjerne op mod 5.000 tons kvælstof pr år.” Available at: https://www.hedeselskabet.dk/om-hedeselskabet/fremtiden-og-nutiden-er-cirkulaer/muslinger-kan-fjerne-op-mod-5000-tons-kvaelstof.
9
Biomar. (2023). “Blue Impact Aqua.” Available at: https://www.biomar.com/globalassets/.global/pdf-files/datasheets/-denmark/trout/en-dk-blue-impact-aqua-9024-45-8-mm-trout.pdf.
10
BjørndalT.TusvikA. (2019). Economic analysis of land based farming of Salmon. Aquac. Econ. Manag.23, 449–475. doi: 10.1080/13657305.2019.1654558
11
BrodE.ØgaardA. F. (2021). Closing Global P Cycles: The Effect of Dewatered Fish Sludge and Manure Solids as P Fertiliser. Waste Manag.135, 190–98. doi: 10.1016/j.wasman.2021.08.041
12
BrochO. J.EllingsenI. (2020). “Kunnskaps- og erfaringskartlegging om effekter av og muligheter for utnyttelse av organisk materiale og næringssalter fra havbruk.” 2020:00342. Available at: https://www.sintef.no/publikasjoner/publikasjon/1882765/
13
BrunnerP. H.RechbergerH. (2016). Handbook of material flow analysis: for environmental, resource, and waste engineers. 2nd ed.Boca Raton, FL: CRC Press.
14
BuschmannA. H.PrescottS.PotinP.FaugeronS.VásquezJ. A.CamusC.et al. (2014). “Chapter six – the status of kelp exploitation and marine agronomy, with emphasis on Macrocystis Pyrifera, in Chile” in Advances in botanical research (sea plants). ed. BourgougnonN., vol. 71 (Cambridge, MA: Academic Press), 161–188.
15
CaoL.WangW.YangC.YangY.DianaJ.YakupitiyageA.et al. (2007). Application of microbial Phytase in fish feed. Enzym. Microb. Technol.4, 497–507. doi: 10.1016/j.enzmictec.2007.01.007
16
Carlos Francisco de Asis Acosta MorenoJ. (2016). “Potential environmental impacts from fish sludge biogas production in Norwegian Salmon farming.” Available at: https://nmbu.brage.unit.no/nmbu-xmlui/bitstream/handle/11250/2421595/MasterThesis_Carlos%20Acosta.pdf?sequence=1&isAllowed=y.
17
CarpenterS. R.BennettE. M. (2011). Reconsideration of the planetary boundary for phosphorus. Environ. Res. Lett.6:014009. doi: 10.1088/1748-9326/6/1/014009
18
CarterC.SajjadiM. (2010). Low fishmeal diets for Atlantic Salmon, Salmo Salar L., using soy protein concentrate treated with graded levels of Phytase. Aquac. Int.19, 431–444. doi: 10.1007/s10499-010-9358-z
19
ClarkeR.MaitlandD.BostockJ. (2018). “Technical considerations of closed containment sea pen production for some life stages of salmonids,” December, 169.
20
EllisJ.TillerR. (2019). Conceptualizing future scenarios of integrated multi-trophic aquaculture (IMTA) in the Norwegian Salmon industry. Mar. Policy104, 198–209. doi: 10.1016/j.marpol.2019.02.049
21
FAO. (2023). “Salmon – Main producers see record-breaking exports | GLOBEFISH | food and agriculture organization of the United Nations.” May 31, 2023. Available at: https://www.fao.org/in-action/globefish/market-reports/resource-detail/en/c/1640993/
22
FøreM.HeidiT. T.OsmundsenT. C.AscheF.TveteråsR.FagertunJ. T.et al. (2022). Technological innovations promoting sustainable Salmon (Salmo Salar) aquaculture in Norway. Aquac. Rep.24:101115. doi: 10.1016/j.aqrep.2022.101115
23
FossbergJ.ForbordS.BrochO. J.MalzahnA. M.JansenH.HandåA.et al. (2018). The potential for upscaling kelp (Saccharina Latissima) cultivation in Salmon-driven integrated multi-trophic aquaculture (IMTA). Front. Mar. Sci.5:418. doi: 10.3389/fmars.2018.00418
24
GibsonD. (2020). “Norway’s Bioretur Lays Plans to Take Sludge Conversion Service Global.” Undercurrent News. Available at: https://www.undercurrentnews.com/2020/09/16/norways-bioretur-lays-plans-to-take-sludge-conversion-service-global/
25
González-RocaF.GelcichS.Ángel Pérez-RuzafaJ. M.VegaA.VásquezJ. A. (2021). Exploring the role of access regimes over an economically important intertidal kelp species. Ocean Coast. Manag.212:105811. doi: 10.1016/j.ocecoaman.2021.105811
26
GuerreroJ.-L.SampleJ. E. (2022). “Kildefordelte Tilførsler Av nitrogen Og Fosfor Til Norske Kystområder i 2020 – Tabeller, figurer Og kart.” Miljødirektoratet rapport M-2174|2021.
27
HamiltonH. A.BrodE.HanserudO. S.GraceyE. O.VestrumM. I.BøenA.et al. (2016). Investigating cross-sectoral synergies through integrated aquaculture, fisheries, and agriculture phosphorus assessments: a case study of Norway. J. Ind. Ecol.20, 867–881. doi: 10.1111/jiec.12324
28
HigginsC. B.StephensonK.BrownB. L. (2011). Nutrient bioassimilation capacity of aquacultured oysters: quantification of an ecosystem service. J. Environ. Qual.40, 271–277. doi: 10.2134/jeq2010.0203
29
HolteE. A.HilmarsenØ.HøyliR.BrendeløkkenH. (2018). “Konsekvensanalyse av landbasert oppdrett av laks – matfisk og post-smolt.” OC2018 A-033.
30
HuangY.CiaisP.GollD. S.SardansJ.PeñuelasJ.Cresto-AleinaF.et al. (2020). The shift of phosphorus transfers in global fisheries and aquaculture. Nat. Commun.11:355. doi: 10.1038/s41467-019-14242-7
31
IEA. (2020). “Outlook for biogas and biomethane: prospects for organic growth.” Available at: https://www.iea.org/reports/outlook-for-biogas-and-biomethane-prospects-for-organic-growth/an-introduction-to-biogas-and-biomethane.
32
KauseA.NousiainenA.KoskinenH. (2022). Improvement in feed efficiency and reduction in nutrient loading from rainbow trout farms: the role of selective breeding. J. Anim. Sci.100:skac214. doi: 10.1093/jas/skac214
33
Klima- og miljødepartementet. (1981). Pollution act. LOV-1981-03-13-6. Available at: https://lovdata.no/dokument/NL/lov/1981-03-13-6.
34
KumarV.SinhaA. K.MakkarH. P. S.De BoeckG.BeckerK. (2012). Phytate and phytase in fish nutrition. J. Anim. Physiol. Anim. Nutr.96, 335–364. doi: 10.1111/j.1439-0396.2011.01169.x
35
Las Heras HernándezM.BarreF.DittrichN.GaleaT.PanditA.ØgaardA. F.et al. (2023). Farm-level MFA of the agricultural phosphorus cycle in Norway: informing resource efficiency strategies at different regional scales (forthcoming). Planned for Submission in 2023.
36
LeiX. G.StahlC. H. (2000). Nutritional benefits of phytase and dietary determinants of its efficacy. J. Appl. Anim. Res.17, 97–112. doi: 10.1080/09712119.2000.9706294
37
Lerøy. (2022). “Ocean forest.” Lerøy Sea Food. Available at: https://www.leroyseafood.com/en/sustainability/ocean-forest/.
38
LiH.CuiZ.CuiH.BaiY.YinZ.KemingQ. (2023). Hazardous substances and their removal in recirculating aquaculture systems: a review. Aquaculture569:739399. doi: 10.1016/j.aquaculture.2023.739399
39
LiuG.MüllerD. B. (2013). Mapping the global journey of anthropogenic aluminum: a trade-linked multilevel material flow analysis. Environ. Sci. Technol.47, 11873–11881. doi: 10.1021/es4024404
40
Matias del CampoL.IbarraP.GutiérrezX.TakleH. (2010). “Utilization of sludge from recirculation aquaculture systems.” ISBN: 978-82-7251-754-9 (printed). Available at: https://nofima.brage.unit.no/nofima-xmlui/bitstream/handle/11250/2559653/Rapport%2B09-2010.pdf?sequence=1&isAllowed=y.
41
Miljødirektoratet. (2022). “Akvakultur – Miljødirektoratet.” Miljødirektoratet/Norwegian Environment Agency. 2022. Available at: https://www.miljodirektoratet.no/ansvarsomrader/vann-hav-og-kyst/Akvakultur-fiskeoppdrett/.
42
Miljøstiftelsen Bellona. (2022). “Hva Skal Laksen Spise? – Råvareløftets Veikart Og Barrierestudier for Nye Fôrråvarer [What should the Salmon eat? The roadmap and barrier studies of the raw materials initiative for new feed ingredients].” Available at: https://bellona.no/publication/hva-skal-laksen-spise-ravareloftets-veikart-og-barrierestudier-for-nye-forravarer.
43
NederlofM. A. J.VerdegemM. C. J.SmaalA. C.JansenH. M. (2022). Nutrient retention efficiencies in integrated multi-trophic aquaculture. Rev. Aquac.14, 1194–1212. doi: 10.1111/raq.12645
44
NistadA. A. (2020). “Current and future energy use for Atlantic Salmon farming in recirculating aquaculture Systems in Norway.” Master thesis, NTNU. Available at: https://ntnuopen.ntnu.no/ntnu-xmlui/handle/11250/2656753.
45
NorderhaugK. M.GundersenH.JohnsenT. M.SeverinsenG.VedalJ.SørensenK.et al. (2016). Eutrophication Status for Norwegian Waters - National Report for the Third Application of OSPARs Common Procedure. M–589. https://www.miljodirektoratet.no/globalassets/publikasjoner/m589/m589.pdf
46
Norwegian Ministry of Fisheries and Coastal Affairs. (2009). The strategy for an environmentally sustainable Norwegian aquaculture industry. Available at: https://www.regjeringen.no/en/dokumenter/strategy-for-an-environmentally-sustaina/id566395/
47
NystøylR. (2019). “‘Laks På Land’ Markedsnært Eller Hjemmekjært?” May 13. Available at: https://norskfisk.no/wp-content/uploads/2019/05/Foredrag-7-Ragnar-Nyst%C3%B8yl.pdf.
48
OsmundsenT. C.OlsenM. S.GauteplassA.AscheF. (2022). Aquaculture policy: designing licenses for environmental regulation. Mar. Policy138:104978. doi: 10.1016/j.marpol.2022.104978
49
PwC. (2022). “Conditions for sustainable growth – an unpredictable future.” Available at: https://www.pwc.no/no/publikasjoner/2023-rapport-sjoematbarometeret.pdf.
50
Regulations on Transmissible Spongiform Encephalopathies. (2004). Forskrift Om Forebygging Av, Kontroll Med Og Utryddelse Av Overførbare Spongiforme Encefalopatier (TSE) – Lovdata. Available at: https://lovdata.no/dokument/SF/forskrift/2004-03-30-595.
51
ReidG. K.ChopinT.RobinsonS. M. C.AzevedoP.QuintonM.BelyeaE. (2013). Weight ratios of the kelps, Alaria Esculenta and Saccharina Latissima, required to sequester dissolved inorganic nutrients and supply oxygen for Atlantic Salmon, Salmo Salar, in integrated multi-trophic aquaculture systems. Aquaculture408–409, 34–46. doi: 10.1016/j.aquaculture.2013.05.004
52
RostenA. V.TrondW.BendikF. T.YngveU.KristianH.ErikB.et al. (2013). Lukkede oppdrettsanlegg i sjø – økt kunnskap er nødvendig Vann. 1: 5–13. Available at: https://vannforeningen.no/wp-content/uploads/2015/06/2013_872558.pdf
53
SætherH. O. E. (2022). “Nutrient (C, N and P) budgets of Hediste Diversicolor (OF Müller, 1776) fed Salmon Smolt sludge.” Norwegian University of Science and Technology Faculty of Natural Sciences Department of Biology. Available at: https://ntnuopen.ntnu.no/ntnu-xmlui/bitstream/handle/11250/3033749/no.ntnu%3Ainspera%3A101980170%3A15887954.pdf?sequence=1.
54
SandvoldH. N.GreggJ. S.OlsenD. S. (2019). “New pathways for organic waste in land-based farming of Salmon.” In From waste to value, by KlitkouA.FevoldenA. M.CapassoM., 1st ed., 145–161. London: Routledge.
55
SelvikJ. R.TjomslandT.EggestadH. O. (2007). “Teoretiske Tilførselsberegninger Av Nitrogen Og Fosfor Til Norske Kystområder i 2006.” 5512–2007. Available at: https://niva.brage.unit.no/niva-xmlui/bitstream/handle/11250/213872/5512-2007_200dpi.pdf?sequence=2&isAllowed=y.
56
SotoD. (2009). “Integrated Mariculture: a global review.” FAO Fisheries and Aquaculture Technical Paper, No. 529. Available at: https://www.cabdirect.org/cabdirect/abstract/20103074013.
57
SSB. (2012). “10574: average energy consumption per household, by size of household, contents and year. Statbank Norway.” SSB. Available at: https://www.ssb.no/en/system/.
58
SSB. (2019). “12846: catch, by catch species, contents, year and nationality of fishing vessel.” Available at: https://www.ssb.no/statbank/table/12846.
59
StévantP.ReboursC.ChapmanA. (2017). Seaweed aquaculture in Norway: recent industrial developments and future perspectives. Aquac. Int.25, 1373–1390. doi: 10.1007/s10499-017-0120-7
60
Tassal. (2017). “Macquarie harbour waste capture system (WCS).” Available at: https://www.tassal.com.au/wp-content/uploads/2017/09/Macquarie-Harbour-Waste-Capture-System-Monthly-Report-10.08.17.pdf.
61
The Norwegian Directorate for Fisheries. (2022). “Biomasse data at locality level for years 2005–2021.”Obtained on 11.10.2022.
62
The Norwegian Directorate for Fisheries. (2023). “Akvakulturstatistikk: Settefiskproduksjon Av Laks, Regnbueørret Og Ørre.” Available at: https://www.fiskeridir.no/Akvakultur/Tall-og-analyse/Akvakulturstatistikk-tidsserier/Laks-regnbueoerret-og-oerret/Settefiskproduksjon.
63
TorrisenO.HansenP. K.AureJ.HusaV.AndersenS.StrohmeierT.et al. (2016). “Næringsutslipp Fra Havbruk – Nasjonale Og Regionale Perspektiv.” 21-2016. Available at: https://www.hi.no/resources/publikasjoner/rapport-fra-havforskningen/2016/21-2016_neringsutslipp_fra_havbruk_ot.pdf.
64
VerdegemM. C. J. (2013). Nutrient discharge from aquaculture operations in function of system design and production environment. Rev. Aquac.5, 158–171. doi: 10.1111/raq.12011
65
WangX.AndresenK.HandåA.JensenB.ReitanK. I.OlsenY. (2013). Chemical composition and release rate of waste discharge from an Atlantic Salmon farm with an evaluation of IMTA feasibility. Aquac. Environ. Interact.4, 147–162. doi: 10.3354/aei00079
66
WangX.OlsenL.ReitanK.OlsenY. (2012). Discharge of nutrient wastes from Salmon farms: environmental effects, and potential for integrated multi-trophic aquaculture. Aquac. Environ. Interact.2, 267–283. doi: 10.3354/aei00044
Summary
Keywords
marine resource efficiency, sludge collection systems, integrated multitrophic aquaculture, aquatic food production, industrial ecology
Citation
Pandit AV, Dittrich N, Strand AV, Lozach L, Las Heras Hernández M, Reitan KI and Müller DB (2023) Circular economy for aquatic food systems: insights from a multiscale phosphorus flow analysis in Norway. Front. Sustain. Food Syst. 7:1248984. doi: 10.3389/fsufs.2023.1248984
Received
28 June 2023
Accepted
13 September 2023
Published
10 October 2023
Volume
7 - 2023
Edited by
Mumtaz Cheema, Memorial University of Newfoundland, Canada
Reviewed by
Saleem Mustafa, Universiti Malaysia Sabah, Malaysia; Shegufta Shetranjiwalla, Grenfell Campus, Memorial University of Newfoundland, Canada
Updates
Copyright
© 2023 Pandit, Dittrich, Strand, Lozach, Las Heras Hernández, Reitan and Müller.
This is an open-access article distributed under the terms of the Creative Commons Attribution License (CC BY). The use, distribution or reproduction in other forums is permitted, provided the original author(s) and the copyright owner(s) are credited and that the original publication in this journal is cited, in accordance with accepted academic practice. No use, distribution or reproduction is permitted which does not comply with these terms.
*Correspondence: Avijit Vinayak Pandit, avijit.v.pandit@ntnu.no
Disclaimer
All claims expressed in this article are solely those of the authors and do not necessarily represent those of their affiliated organizations, or those of the publisher, the editors and the reviewers. Any product that may be evaluated in this article or claim that may be made by its manufacturer is not guaranteed or endorsed by the publisher.