 Fasil Getachew Kebede1,2*
 Hans Komen1
 Tadelle Dessie2
 Olivier Hanotte2,3Steve Kemp2Setegn Worku Alemu2,4
 John W. M. Bastiaansen1
- 1Wageningen University and Research, Animal Breeding and Genomics, Wageningen, Netherlands
- 2International Livestock Research Institute (ILRI), Addis Ababa, Ethiopia
- 3Cells, Organism and Molecular Genetics, School of Life Sciences, University of Nottingham, Nottingham, United Kingdom
- 4AL Rae Centre for Genetics and Breeding, School of Agriculture, Massey University, Palmerston North, New Zealand
Animal performance is an outcome of genetic effects, environmental influences, and their interaction. Understanding the influences of the environment on performance is important to identify the right breeds for a given environment. Agroecological zonation is commonly used to classify environments and compare the performance of breeds before their wider introduction into a new environment. Environmental classes, also referred to as agroecologies, are traditionally defined based on agronomically important environmental predictors. We hypothesized that our own classification of agroecologies for livestock at a species level and incorporating the most important environmental predictors may improve genotype by environment interactions (GxE) estimations over conventional methodology. We collected growth performance data on improved chicken breeds distributed to multiple environments in Ethiopia. We applied species distribution models (SDMs) to identify the most relevant environmental predictors and to group chicken performance testing sites into agroecologies. We fitted linear mixed-effects models (LMM) to make model comparisons between conventional and SDM-defined agroecologies. Then we used Generalized Additive Models (GAMs) to visualize the influences of SDM-identified environmental predictors on the live body weight of chickens at species level. The model fit in LMM for GxE prediction improved when agroecologies were defined based on SDM-identified environmental predictors. Partial dependence plots (PDPs) produced by GAMs showed complex relationships between environmental predictors and body weight. Our findings suggest that multi-environment performance evaluations of candidate breeds should be based on SDM-defined environmental classes or agroecologies. Moreover, our study shows that GAMs are well-suited to visualizing the influences of bioclimatic factors on livestock performance.
Introduction
Scavenging family poultry significantly contributes to household nutrition and income in Sub-Saharan Africa. Current levels of productivity in these systems are too low to meet growing demands (Shapiro et al., 2015). Attempts at enhancing smallholder chicken productivity in tropical developing countries have mostly relied on the introduction of better performing breeds (Sonaiya and Swan, 2007; Chebo et al., 2022).
Some of the breeds introduced into smallholder systems of the tropics were developed for temperate production systems (i.e., assuming reasonable level of environmental uniformity in their management) and did not exhibit optimum performance across heterogenous environments. The lack of proper matching between the right genetics and the right environment is a major factor for low productivity of improved chicken breeds in the tropics (Lozano-Jaramillo et al., 2019b; de Kinderen et al., 2020). Studies conducted in Ethiopia have shown that breeding objectives of chicken producers and levels of production performance of breeds in terms of total number of eggs and growth vary across agroecologies (Lozano Jaramillo et al., 2018; Tilahun et al., 2022) indicating the need for a more tailored genetic improvement and livestock technology scaling approach.
Current approaches of evaluating GxE for chicken breeds introduced into smallholder systems have significant drawbacks. Firstly, breed comparison studies are based on agroecologies defined on suitability of the environment for major crops (Lozano-Jaramillo et al., 2019b; de Kinderen et al., 2020). Agroecological zonation refers to the spatial classification of the geographic and environmental landscape into units, within each of them agricultural and ecological characteristics are similar (Hurni, 1998). Classifications of the environment into roughly similar agroecological units have been primarily used in agronomy and forestry to compare agroclimatic conditions and to manage land resource conditions considering soil, water, vegetation, and topography parameters (Hurni, 1998). Agronomically defined agroecologies are made for crops and do not adequately consider environmental predictors which may have profound association with livestock productivity and local adaptation (Dove, 1890; Hurni, 1998; MoA, 1998, 2000; Tadesse Mulugeta et al., 2006; Dumont et al., 2014). GxE estimates based on these agroecologies may not give accurate results for levels of GxE. A proper classification of mega-environments into agroecologies, considering ecological factors influencing productive and reproductive performance is essential to select productive breeds (genotypes). Stratification of environments into environmental classes (agroecologies) improves the homogeneity within and reduces genotype by environment interactions, leading to better evaluation of the performance of breeds (Desclaux et al., 2007; Dumont et al., 2013). There were some attempts to use agroecological zonation in animal production as an operational framework to improve productivity (Dumont et al., 2014; Soussana et al., 2015). However, proper methodologies for definition of species-specific livestock agroecologies for use in animal genetic improvement programs or for multi-environment breed evaluations are not available. Only 5 percent of the indexed studies concerning agroecology deal with livestock (Soussana et al., 2015).
Secondly, current agroecological definitions consider an agroecology as a unit with little effort to identify the environmental predictors contributing the most to habitat suitability of a livestock species. Model fit and accuracy of GxE predictions for a species might be improved if the most important environmental predictors influencing habitat suitability and phenotypic variation are considered in defining agroecological classes. The influence of certain climatic factors such as extremes of temperature and solar radiation on performance, physiology and behavior of chickens and other birds has been documented (Lara and Rostagno, 2013; Bettridge et al., 2018; Raynor et al., 2018; Gicheha, 2021).
Thirdly, the existing agroecological classes assume all livestock species have similar environmental requirements and hence breeds of any species can be compared for performance and adaptability based on the existing classes. However, livestock species vary in their environmental requirements (e.g., chicken vs. camels in extreme cases) and livestock-species-specific agroecologies may allow a more accurate comparison among breeds and lead to better GxE estimations within a species.
Fourthly, current approaches of studying GxE in smallholder livestock systems that consider the environment as a continuous gradient often assume a linear relationship between breed performance for a trait and an environmental class. To explain such relationships, they use reaction norm plots (e.g., the change of body weight of breeds 1 and 2 in response to a range of values for an environmental parameter). Reaction norm plots are not suitable to display non-linear relationships between an environmental predictor and performance for a trait.
Analytical methods developed in ecology, geographic information system, and machine learning can be used to overcome limitations of conventional GxE predictions in breed performance comparisons in smallholder systems. Species distribution models (SDMs) also called environmental, ecological, niche, envelope, habitat modeling, range mapping or bioclimatic models are numerical tools that use computer algorithms to predict distribution of a species across geographic space and time using environmental data (Elith and Leathwick, 2009). The central concept in SDMs is the niche theory formulated by Soberón (2007). There are two types of niches (Hutchinson, 1957). The fundamental niche comprises all abiotic environmental conditions where a species can survive indefinitely and have a positive population growth. The realized niche is smaller and refers to those parts of the fundamental niche where the species can survive despite the presence of competitors or negative interactions. In recent years, the conceptual framework for SDMs has been extended by livestock scientists and used to identify environmental predictors associated with habitat suitability, productive performance (e.g., growth rate), population differentiation, and local adaptation in livestock populations (Vajana et al., 2018; Vallejo-Trujillo et al., 2018; Lozano-Jaramillo, 2019; Lozano-Jaramillo et al., 2019b; Gheyas et al., 2021; Kebede et al., 2021; Gebru et al., 2022; Trujillo et al., 2022) performed SDMs to calculate the percentage area suitable for improved chicken breeds across administrative (political) boundaries of Ethiopia. Spatial modeling improves genetic evaluation of livestock for smallholders (Selle et al., 2020) and is applicable for definition of agroecologies in multi-environment performance testing of candidate breeds.
SDMs consider a species as a homogenous unit and are constrained to meet some of their underlying assumptions when they are used alone in studying populations or breeds (Hampe, 2004; Wiens et al., 2009). But their shortcomings could be overcome if they are combined with other modeling approaches, such as phenotypic distribution models (PDMs). PDMs refer to a family of machine learning based models that are fitted to capture the response of a quantitative trait as a function of environmental conditions (Michel et al., 2017; Smith et al., 2017; Lozano-Jaramillo et al., 2019a,b; Kebede et al., 2021). The most notable ones include boosted regression trees (Elith et al., 2008), generalized linear models (Nelder and Wedderburn, 1972), and generalized additive models (GAMs) (Hastie and Tibshirani, 1990). The most contributing climatic predictors identified by SDMs can be used to redefine livestock-species-specific agroecology and to improve model fit in GxE predictions through linear mixed models (LMMs). LMMs combine different types of fixed, random, and smooth terms in a regression model to account for different types of effects. SDM-identified agroecologies can be fitted to LMMs to compare the performance of different chicken breeds on productivity levels. LMMs such as best linear unbiased prediction (BLUP) and restricted maximum likelihood estimation (REML) have been extensively used by plant breeders to in multi-environment crop trials to recommend highly productive genotypes (Piepho, 1994; Piepho and Möhring, 2005; Van Eeuwijk et al., 2016). Equally important to defining environments into agroecologies, is the understanding of how animals of the same species would react phenotypically to variations in climatic factors. In this respect, Generalized Additive Models (GAMs) are well suited to detecting non-linear relationships, which is a common feature of many ecological datasets (Zuur et al., 2007; Wood, 2017; Kebede et al., 2021). GAMs have been used in the past to study species distribution, abundance and density in wild animals in relation to climate change (Brown, 2011; Rezaei and Sengül, 2018). Phenotypes are expected to include non-linear responses to environmental predictors violating assumptions made by classical linear approaches (e.g., linear regression or ANOVA) (Zuur et al., 2007; Bolker et al., 2013; Oddi et al., 2019). GAMs can accommodate this non-linear relationship between the response and continuous explanatory variables by making use of non-parametric smoothers (Crawley, 2012; Wiley and Wiley, 2019). PDMs such as generalized additive models (GAMs) can also be utilized to evaluate the response of quantitative traits to specific environmental predictors using partial dependence plots (PDPs). PDPs are the most popular approach in for visualizing the effects of the predictor variables on the predicted outcome during supervised machine learning applications (Friedman, 2001; Apley and Zhu, 2020).
The objectives of the present study are to (1) apply species distribution models (SDMs) to identify the most relevant environmental predictors contributing to habitat suitability of chickens in Ethiopia; (2) use SDM-identified environmental predictors to classify environments of the chicken performance testing sites into distinct agroecologies; (3) use SDM-defined agroecologies to improve model fit of LMM in breed by environment interaction estimations for live body weight; and (4) apply partial dependence plots of GAMs to evaluate the relationship between the most relevant environmental predictors and live body weight.
Materials and methods
Environmental data
We took different steps to ensure representativeness of environmental data in our sampling frame. This entailed designing a robust sampling strategy, and inclusion of sufficient number of species occurrence and background points.
Selection of species occurrence points
The choice of sample locations for environmental data analysis was made at species level (Gallus gallus) and did not consider the distribution of specific chicken breeds. Out of the country’s estimated 49.4 million chickens (88% of the total) are indigenous (CSA, 2020) and kept by smallholder farmers, in extensive management conditions: they scavenge or semi-scavenge to fulfil their daily feed requirements and spend the night in simple night enclosures The environment influences the reproductive (egg productivity), productive performance (growth), and survival (prevalence of diseases and parasites) of the chickens in this system. The influences of climatic factors such as extremes of temperature and solar radiation on performance, physiology and behavior of chickens have been documented (Lara and Rostagno, 2013; Bettridge et al., 2018; Gicheha, 2021).
The distribution of indigenous chickens was used to delineate the species range and establish the sampling frame for SDMs in the present study. Ethiopian indigenous chickens also called local, village, backyard or family chickens are widely adapted domesticated populations that are not subject to selective breeding programs in their natural environment. A hybrid sampling strategy that ensures the environmental (e.g., climatic) and geographic representativeness of sample locations for performance testing was implemented. This approach ensures inclusion of contrasting habitats where a species can be potentially kept and improves prediction in SDMs (Selmoni et al., 2020). Five environmental gradients (elevational clines) within the species range were selected in different geographies of the country (Oromia, Amhara, Addis Ababa, Southern Nationalities and Peoples’ Region, and Tigray). In each gradient, the environment was clustered into three different elevational classes. These are lowland (500–1,800 m.a.s.l); midaltitude/midland (1,800–2,400 m.a.s.l.); and highland (2400–3,500 m.a.s.l.). Areas where chicken cannot be kept were removed from the sampling frame. These included water bodies, forests and bushlands, areas with elevation below 500 m.a.s.l., areas above 3,500 m.a.s.l., and areas with infrastructure (e.g., roads, buildings). Areas below 500 meters of elevation in Ethiopia are too hot (temperature exceeds 40°C and have high solar radiation) and are not used for chicken production. These areas represent pastoral areas around the borders of the country where farmers keep camels and ruminants. Areas above 3,500 meters are too cold (frosty) for livestock and humans and no agricultural activity is practiced.
Environmental data were extracted for a total of 1,548 locations along the five environmental gradients. Inclusion of records from 100 locations is considered large enough in species distribution modeling (Wisz, Hijmans et al., 2008).Values for 34 environmental predictors which were expected to influence chicken productive performance were extracted from online databases [see Additional file 1 Table S1 in Supplementary material]. These included climatic (n = 24), soil (n = 8), and vegetation (n = 2) predictors. Values for climatic predictors (n = 24), related with temperature, precipitation, solar radiation, and water vapor pressure in different seasons were obtained from WorldClim database (http://www.worldclim.org/; version 2) at a spatial resolution of 30 s (~1Km2) (Fick and Hijmans, 2017) based on the mean values of 30 years (1970–2000). Elevation data was obtained from DIVA-GIS1 (Hijmans et al., 2001; Farr et al., 2007) at a spatial resolution of 30 s (~1Km2). Vegetation data (cropland extent) was obtained from Global Food Security Analysis-Support Data (Xiong et al., 2017) at a spatial resolution of 30 meters. Soil data was obtained from ISRIC database (Hengl et al., 2015, 2017) based on observations and measurements of African SoilGrids system at 250-meter resolution, with standard numeric soil properties (organic carbon, bulk density, Cation Exchange Capacity (CEC), pH, and soil texture fractions at 15–30 cm depth). Different R software packages were used to manipulate geospatial data. Specifically, “dismo” (Hijmans et al., 2017) was used to link R software with “Maxent” model, “sp” (Pebesma et al., 2012), and “maptools” (Bivand et al., 2021) were used to plot maps based on geographic coordinates, “raster” (Hijmans et al., 2015) was used to read data, “rgdal” (Bivand et al., 2021) was used to adjust map projections, and “rgeos” (Bivand et al., 2017) was used for topological operations.
Maxent, which stands for maximum entropy modeling, is an algorithm or machine learning method developed for mapping species’ distribution. Maxent estimates the distribution (geographic range) of a species by finding the distribution which has maximum entropy (i.e., is closest to geographically uniform) subject to constraints derived from environmental conditions at recorded occurrence locations (Phillips et al., 2017). The constraints are rules that constrain the predicted distribution based on the values of environmental variables called features (Phillips et al., 2017).
Background points
The inclusion of occurrence records alone leads to bias in species distribution modeling. Considering the set of conditions at sample points from the entire environmental region available to be inhabited by the species improves the predictive performance of SDMs and habitat suitability mapping (Phillips et al., 2009). For this reason, we included a bias file and sampled 10,000 background points which were drawn randomly from the entire country using kernel density function (Venables and Ripley, 2002).
Conventional agroecological classification
Agroecological zones are conventionally classified in Ethiopia into five. Chickens cannot live in two of the five agroecologies: dry-hot/desert (<500 m.a.s.l.) and very-cold/afro-alpine (>3,500 m.a.s.l.). We considered the other three conventional agroecologies in our model comparison. AEZI = lowlands (500–1,800 m.a.s.l.); AEZII = 1,800–2,400 m.s.a.l.; and AEZIII = 2,400–3,500 m.a.s.l. (Dove, 1890; MoA, 1998). This classification mainly considers elevation, temperature, precipitation, and types of major grain crops grown (e.g., sorghum and oil seeds in the lowlands; maize, teff, and millet in midaltitude; and wheat and barley in the highlands). Chicken, small ruminants, and large ruminants are kept in all these three agroecologies (within 500–3,500 m.a.s.l.) (Hurni, 1998).
Phenotypic data
A total of 45 performance testing sites or smallholder chicken keeping villages from the five environmental gradients were chosen through cluster sampling. Each gradient represented three clusters or elevational classes (lowland, midaltitude, highland). The selection of performance testing sites within class, and households within a performance testing site, was carried out at random.
The target number of households was 20 for each performance testing site. Households without two years of experience in keeping any type of chicken (indigenous or improved) were excluded from the experiment. In total, 25 unsexed chicks of an improved breed, vaccinated against major diseases (Newcastle disease, Gumboro or infectious bursal disease, fowl pox, and Marek’s) and brooded to the end of 42 day-of-age were given to each household. The assignment of breeds into households within a performance testing site was completely at random. Performance data was collected on a total of 21,562 female chickens distributed to 1,548 households across 45 performance testing sites.
See Table 1 for a summary and [see Additional file 1 Table S2 in Supplementary material] for detailed information on each testing site.
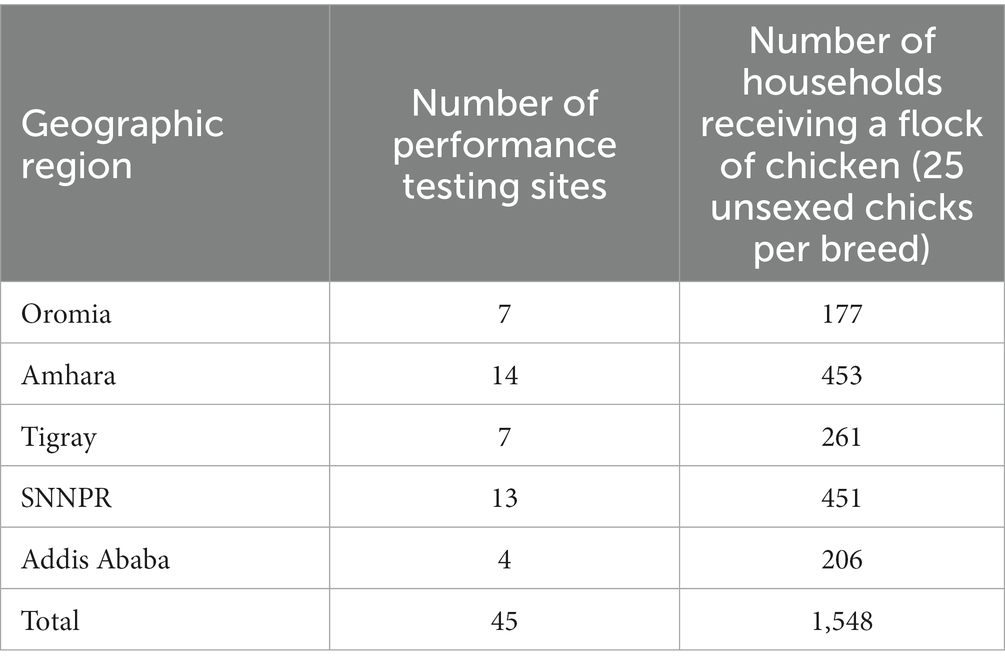
Table 1. Summary of sampling sites used for evaluation of growth performance of improved chicken breeds in Ethiopia.
Breeds
The five breeds (strains) tested in the present study were Improved Horro, Potchefstroom Koekoek, Kuroiler, Sasso, and SRIR (Sasso x Rhode Island Red). Improved Horro is the outcome of a selective breeding program on the local Horro chicken and was developed with the aim of improving age at first egg, egg production, body weight and survival (Dana et al., 2010, 2011; Wondmeneh et al., 2014). The Potchefstroom Koekoek is a composite of the White Leghorn, Black Australorp, and the Barred Plymouth Rock, developed during the 1950s in the Republic of South Africa (Grobbelaar et al., 2010). The Koekoek is very popular among rural farmers in South Africa and neighboring countries for egg and meat production as well as their ability to hatch their own offspring in medium input production systems (Grobbelaar et al., 2010). The Kuroiler is a hybrid chicken widely believed to originate from crossing the Rhode Island Red, the White Leghorn, the Barred Plymouth Rock and two Indian indigenous chicken breeds with some introgression of broilers to obtain specific broiler characteristics (Isenberg, 2007; Ahuja et al., 2008). The Kuroiler was developed in India by a commercial firm and was introduced to the market in early 1990s. The Sasso is a dual-purpose commercial hybrid developed by a breeding company in Europe. The SRIR is a hybrid closely related with the Sasso, with some genetic introgression from another dual-purpose genotype.
Management of chicks and phenotypic data collection
Farmers participating in the chicken performance evaluation were closely monitored for their adherence to the research protocols. All of them received trainings on basic chicken husbandry practices. Trained enumerators regularly visited the households to ensure they had constructed night shelters for the birds and provided water, and up to 30% of their daily feed requirement as a supplement in addition to scavenging.
Every bird was individually identified with a wing-tag and its body weight was measured every two weeks by the enumerators. The average live-body-weight-at-180-days-of-age (BW180) was interpolated by linear regression from available data points. In total, performance data was measured on 21,562 female chickens obtained from 1,548 households. Out of 25 unsexed brooded chicks of a breed received by a household, roughly 50% were females, and an average of 8 female birds (66.6%) survived per household for phenotypic measurement and stayed till the end of the experiment.
Species distribution models
Species distribution models (SDMs) were used to select environmental predictors associated with habitat suitability in chickens and hence influencing their performance at species level in terms of live body weight. The identified predictors were then used to group chicken performance testing sites into agroecologies to produce habitat suitability maps. SDM-identified predictors and the redefined agroecologies are used as inputs for phenotypic distribution modeling with GAMs to predict live body weight.
Selection of environmental predictors
To constrain model complexity and increase the performance of species distribution models, the highest contributing set of uncorrelated environmental variables were identified using the R package “MaxentVariableSelection” (Jueterbock et al., 2016). The package increases performance of Maxent habitat suitability models by identifying the most important set of uncorrelated environmental variables. First, an initial Maxent model was compiled with all the environmental predictors. Then the predictors with lower contribution to the model (contribution threshold <5) and those that were correlated (r > |0.6|) with the predictor of the highest contribution were removed. The remaining set of variables was then used to compile a new Maxent model. This process was repeated until left with a set of uncorrelated variables that all had a model contribution above the value set as contribution threshold.
Configuration of model parameters
Species-specific tuning of model parameters can improve the performance of Maxent model compared to the default settings (Elith et al., 2011; Radosavljevic and Anderson, 2014). Tuning model settings refers to exploring different combinations of feature classes and regularization multipliers and selecting the best combination based on their impacts on model performance. Regularization refers to smoothing of the model to achieve a trade-off between model goodness-of-fit and complexity. The default regularization multiplier in Maxent is 1.0 which can be changed by the user. It is a common approach in model selection to penalize coefficients (the betas) to values that allow both accurate prediction and generality (Tibshirani, 1996; Elith et al., 2011). Species’ responses to environmental covariates tends to be complex and usually requires fitting of nonlinear functions (Austin, 2002). In machine learning algorithms this is achieved by applying transformations of the original covariates into feature. Maxent currently has six feature classes: linear, product, quadratic, hinge, threshold and categorical (Elith et al., 2011).
The R package “ENMeval” was used to reduce the large set of feature types to the optimal subset to improve model fit and to identify the optimum regularization multiplier for model training (Muscarella et al., 2014; Radosavljevic and Anderson, 2014). We built models with regularization multiplier values ranging from 0.5 to 6.0 (increments of 0.5) and with six different feature combinations (H, LQH, HQP, HQC, LQHP, LQHPT; where L = linear, Q = quadratic, H = hinge, P = product and T = threshold); this resulted in 72 individual model runs. The parameter configuration with the lowest delta AICc value was chosen by ENMeval to run the final Maxent model.
Classifying the environments of chicken performance testing sites into agroecologies
Once the most important predictor contributing to habitat suitability were identified, the suitability score (I) was calculated between a pair of chicken performance testing sites. The I statistic was then used to cluster the sites into distinct agroecologies. The procedures we followed to calculate the I statistic was as follows: first, raster files of the highest contributing set of predictors were created and used with ENMTools to calculate similarity statistics (I) (Phillips and Dudík, 2008; Warren et al., 2011). A raster is an imagery from satellite which consists of a matrix of cells (or pixels) organized into rows and columns (or a grid) where each cell contains a value representing information for an environmental variable (Hijmans et al., 2015). Then, at each grid cell, estimates of habitat suitability are calculated using Maxent-generated species distribution models so that they sum to 1 over the geographic space being measured. The “I” value is an estimate of the probability that the relative ranking of any two patches of habitat is the same for two models, irrespective of the quantitative difference in suitability estimates. The “I” similarity measure range from 0, when species predicted environmental suitability in two performance testing sites do not overlap at all (i.e., 0 for all i), to 1, when all grid cells in the two models are estimated to be equally suitable for the species (Warren et al., 2011).
Comparison between SDM and conventionally-defined agroecologies
The study was designed in a Randomized Complete Block. The chicken breeds (n = 5) were assigned as treatments (GEN) into each agroecology (ENV) either defined by SDMs or conventionally. Performance testing sites within each ENV were considered as environmental replicates (REP). SDM-defined agroecologies were classified based on the most relevant environmental predictors contributing to habitat suitability, while conventionally-defined agroecologies were based on elevational classes. The chicken performance testing sites included in our study fell into three conventional classes (lowlands, midaltitude, and highlands) and three SDM-defined classes (I, II, and III). Comparison between models based on agroecological classification was desired to know which approach yields better GxE estimations. We analyzed our productivity data with two mixed-effects models in LMM (REML/BLUP) (Bates et al., 2014; Olivoto et al., 2019). In model 1, we fitted SDM-defined agroecology (SDM_AE) and its replications as a fixed effects and included breed (GEN) and breed by environment interactions (GXE) as random effects. In model 2, we fitted conventional agroecology (CON_AE) and its replications as a fixed effects and included breed (GEN) and breed by environment interactions (GXE) as random effects.
LMM for model 1 was fitted for live body weight traits (W180) as follows:
where is the response variable (i.e., average live body weight in grams at a household) observed in the th block of the th breed in the th SDM-defined agroecology (SDM_AE), ( = 1, 2, 3, 4, 5; = 1, 2, 3; = 1, 2,.., ); is the grand mean; is the random effect of the th breed; is the fixed main effect of the th agroecology (SDM_AE); is the random interaction effect of the th breed with the th agroecology (SDM_AE); is the fixed effect of the th block (REP) within the th agroecology (SDM_AE); and is the random normally distributed error. In model 2, the th agroecology was defined conventionally (CON_AE),
Relationship between environmental predictors and body weight
Once we compared SDM-defined agroecologies with conventionally-defined agroecologies on model fit, we sought to investigate how each one of the most relevant environmental predictors influence body weight at species level without considering the effect of agroecological classes and taking out the effect of breed. We applied generalized additive models (GAMs) to ascertain the effects of SDM-identified environmental predictors on performance of chickens. GAMs are similar to GLMs but differ by relaxing the linear assumption, potentially revealing non-linear relationships (Wiley and Wiley, 2019) which might be seen between environmental predictors and phenotypes. The effects of environmental covariates on body weight in GAM were viewed using partial dependence plots (PDPs). Visualization methods with GAMs are useful in environmental modeling to identify which variables have the strongest effect (Barton et al., 2020; Fasiolo et al., 2020). PDPs allow graphical exploratory evaluation of the variable effects by showing the mean change in response variable (body weight) as the variable interval changes over its distribution (mean centered since the variable interval must sum to zero in GAM), accompanied by the 95% confidence intervals. The estimated value of p (<0.001) will be used to determine the significance of the environmental predictor effect on phenotype (Supplementary R script).
The R package “mgcv” (Wood and Augustin, 2002) was used to fit GAMs (Hastie and Tibshirani, 1990). “mgcv” implements GAMs based on penalized regression splines with automatic smoothness estimation. The identity link is chosen when normal distribution is assumed (Hastie and Tibshirani, 1990). Meaning that the Gaussian distribution is parametrized by the mean and the variance parameters. The link function provides the relationship between the linear predictor and the mean of the distribution function.
The function “gam” was used to invoke a Gaussian smoothing spline process (bs = “gp”). REML was the method used for smoothing parameter estimation (Wahba, 1983; Silverman, 1985). The notation for the GAM smoothing in Gaussian distribution is as follows (Hastie et al., 2009)
Where the response variable (i.e., BW180) relates to an additive function of the predictors via a link function , represent the environmental predictor covariates identified by SDM, and the denote the smoothing term(s) of the SDM-selected non-parametric environmental predictor covariate(s) .
Results
Environmental predictors contributing to habitat suitability
Out of 34 environmental predictors, a final set of six least correlated (|r| < 0.6) predictors related with habitat suitability of chickens were identified by MaxentVariableSelection (Figure 1). These included elevation, solar radiation in May, precipitation of the driest month (Bio14), water vapor pressure of May, precipitation of the coldest quarter (Bio19), and precipitation of the wettest month (Bio13). Each of the six selected predictors that had more than 3% contribution to habitat suitability of chickens were retained for subsequent analysis. Elevation made the highest contribution (48.5%), followed by solar radiation of May (16.7%) and precipitation of the wettest month (8.7%).
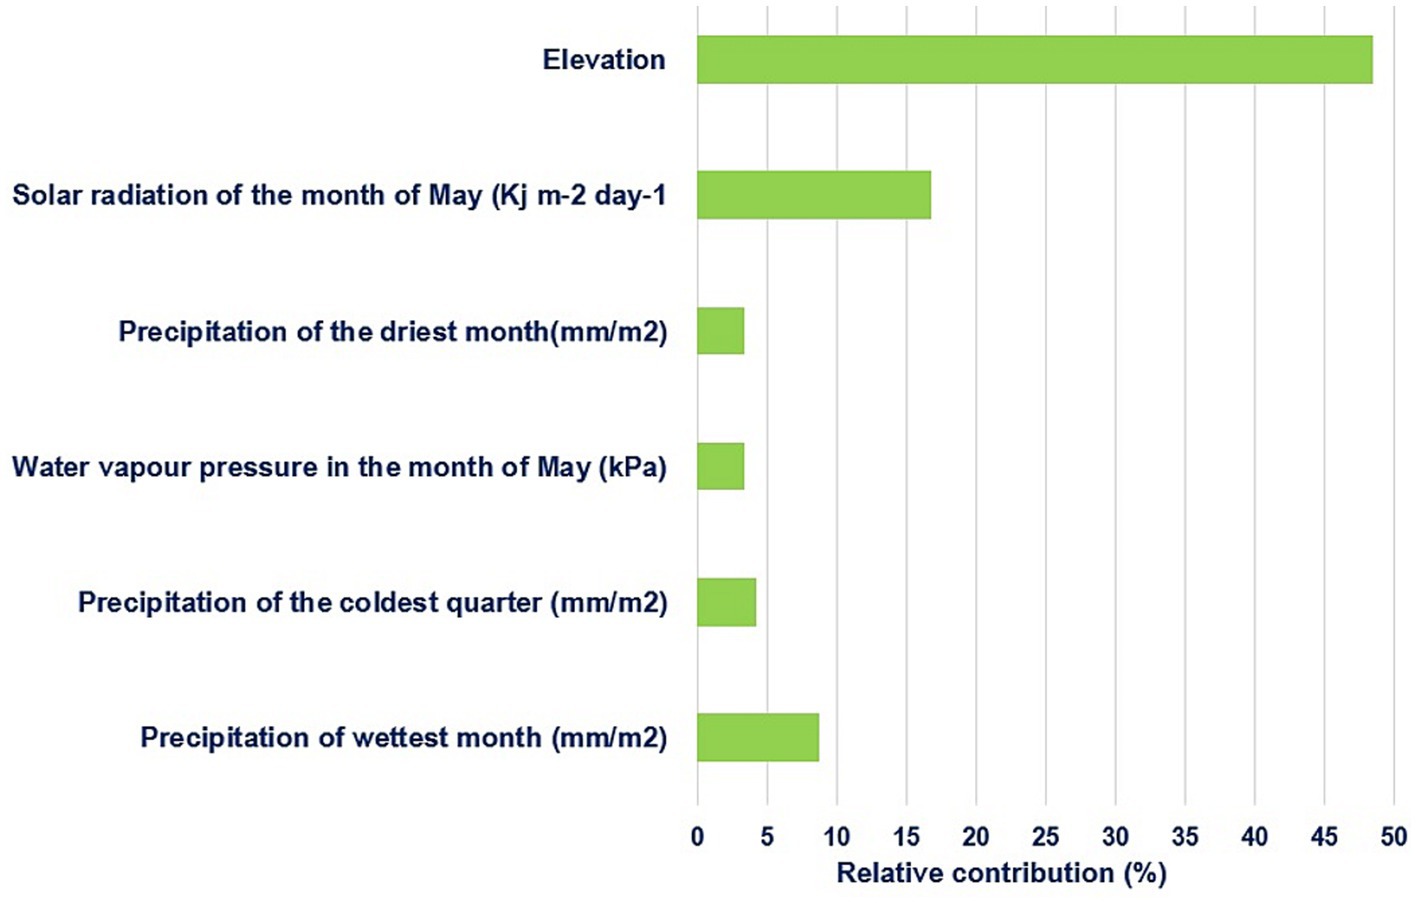
Figure 1. Relative contribution of the six most important environmental predictors selected to habitat suitability.
The six most contributing climatic predictors selected by MaxentVariableSelection along with the ENMeval identified model parameters were used to produce environmental maps of Ethiopia by Maxent (Figure 2). The maps show the environmental heterogeneity of the country in terms of precipitation, solar radiation, water vapor pressure and bioelevation (elevation), indicating that these predictors deserve consideration in the classification of agroecologies. ENVeval identified HQP (Hinge, Quadratic, Product) features with regularization-multiplier = 5 as the best parameter combination. This configuration yielded the lowest deltaAICc value [Additional file 1 Table S3 in Supplementary material]. The suitability maps show environmental heterogeneity of the country in terms of precipitation, solar radiation, water vapor pressure and elevation, indicating that these predictors deserve consideration in the classification of mega-environments into agroecologies.
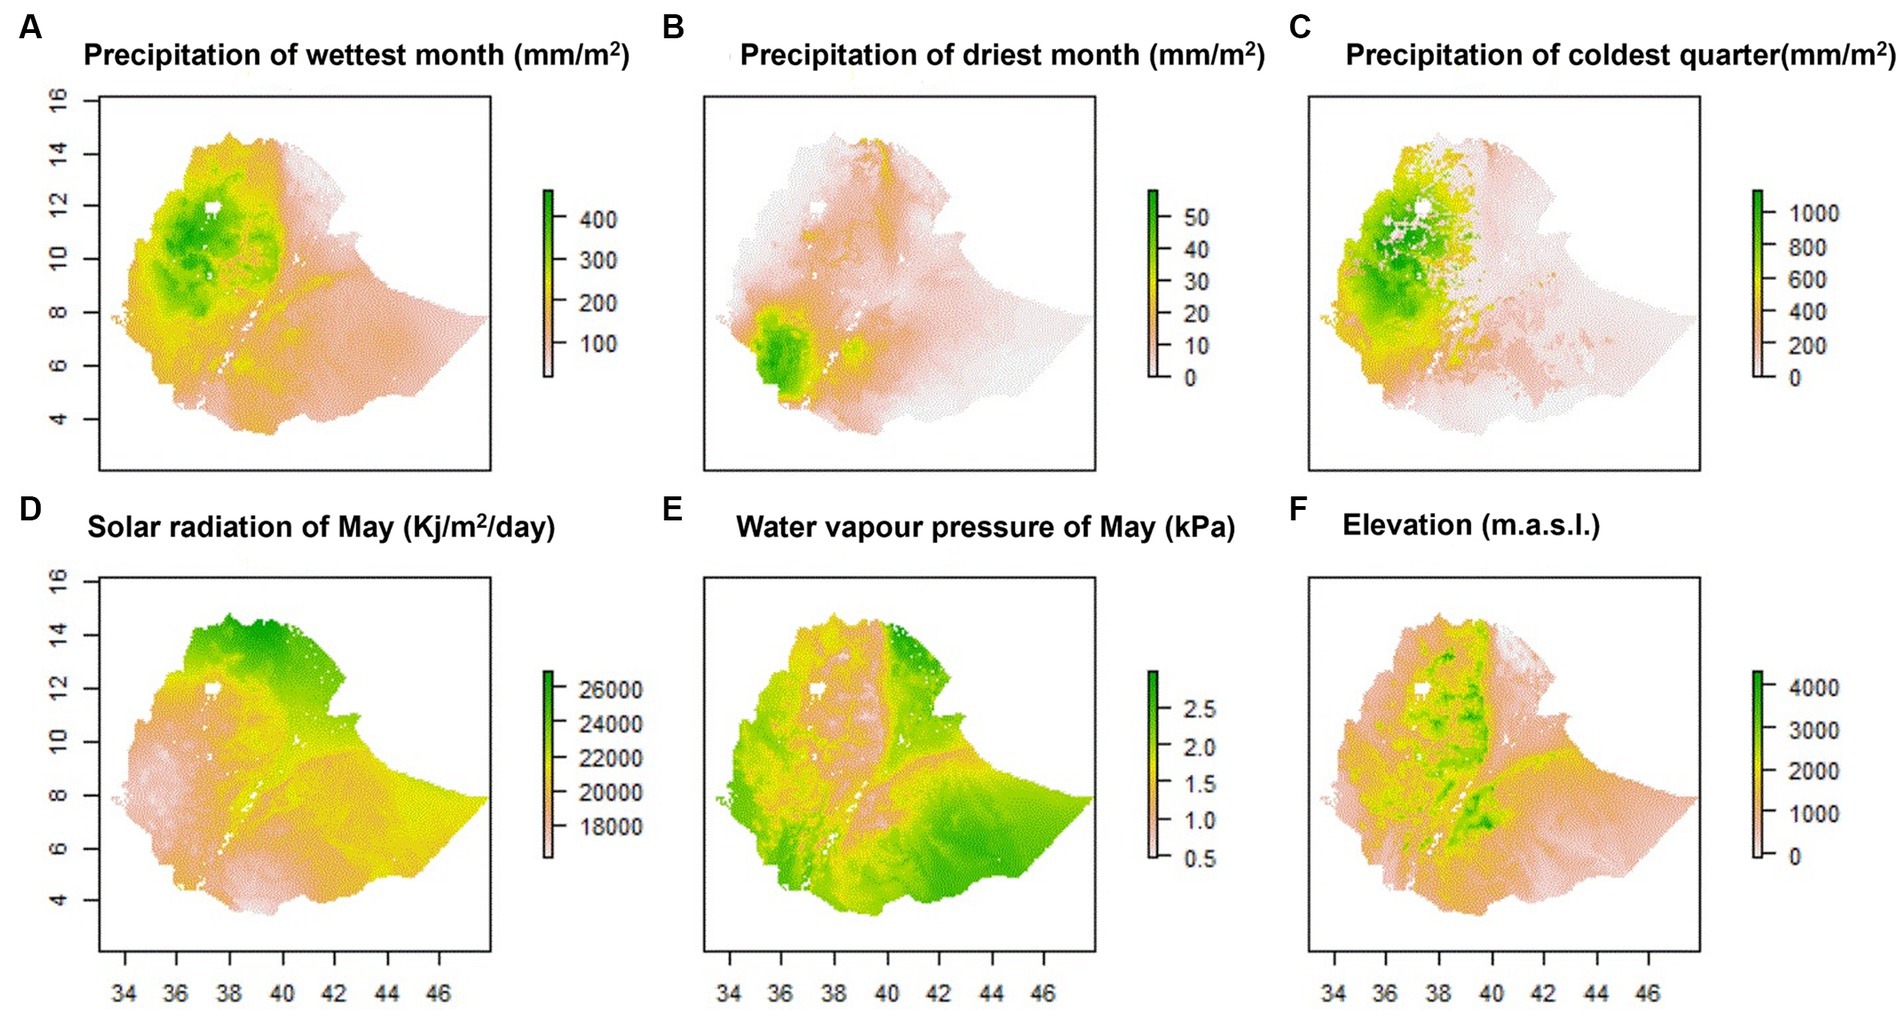
Figure 2. Environmental maps of Ethiopia based on the six most important environmental predictors.
Agroecologies defined on SDM-identified environmental predictors
These six most important environmental predictors associated with habitat suitability of chickens were used to classify the performance testing sites into three distinct agroecologies based on niche overlap statistic (I) (Figure 3). Out of the 45 villages where the improved breeds were distributed into, 16 villages were assigned into agroecology-I, 10 were assigned into agroecology-II, and 19 were assigned into agroecology-III [see full list in Additional file 1 Table S4 in Supplementary material].
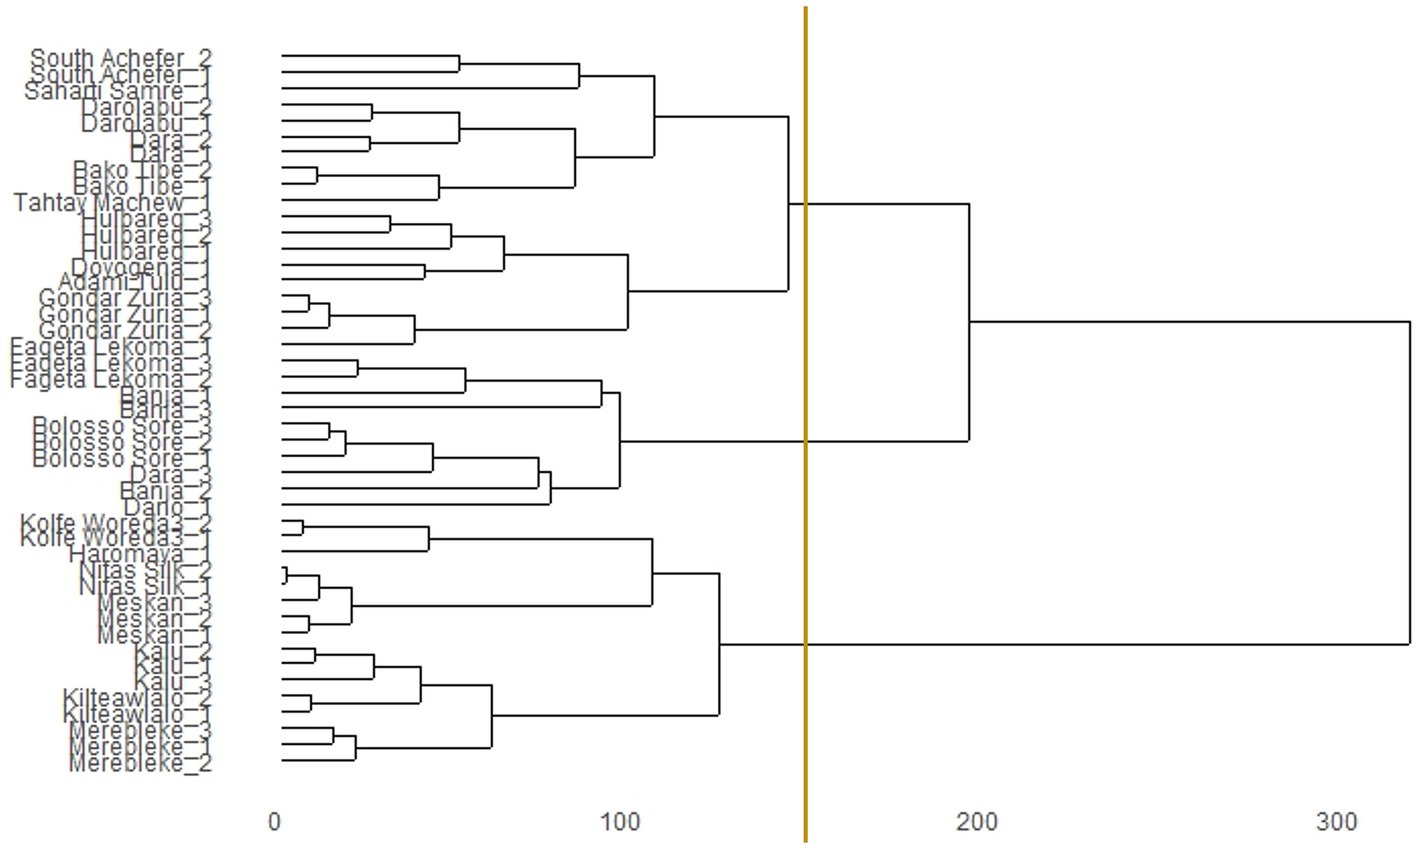
Figure 3. Dendrogram of niche overlap statistic (I) for testing sites of introduced chicken breeds in Ethiopia. The vertical line indicates the cut-off point to group environments of performance testing sites into three SDM-defined agroecologies.
For each of the three agroecologies, a habitat suitability map of chickens based on niche overlap was produced by SDMs for Ethiopia (Figure 4). Most of the suitable areas on the three maps are in the northern, central, southeastern, and southwestern parts of the country. Areas far in the west, far in the south, north-eastern, north-western parts of the country were shown as the least suitable for chicken production. These are characterized by extreme temperatures and high solar radiation, and low availability of scavenging feed resources for chickens (Getahun, 1978; Bayou and Assefa, 1989; CSA, 2017; Mirkena et al., 2018; Gebrechorkos et al., 2019).
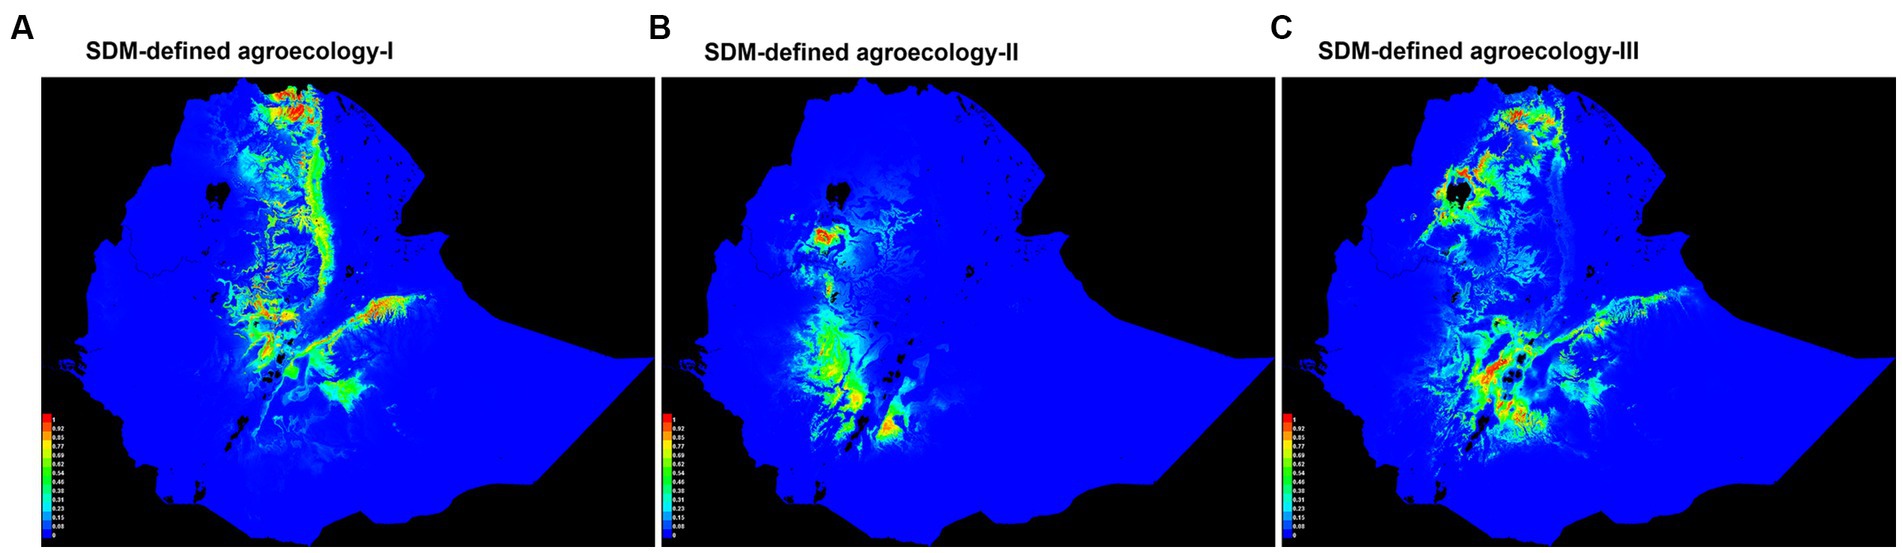
Figure 4. Suitability maps of SDM-defined agroecologies for chicken performance testing sites. Colors toward red spectrum in each of the three agroecologies (I, II, & III) show better habitat suitability to chickens.
Model comparison for SDM and conventionally defined agroecologies
Table 2 shows model comparisons of GxE for SDM and conventionally defined agroecologies using AIC. The LMM with SDM-defined agroecologies as a fixed effect had a better fit of genetic effects (lowest AIC value).
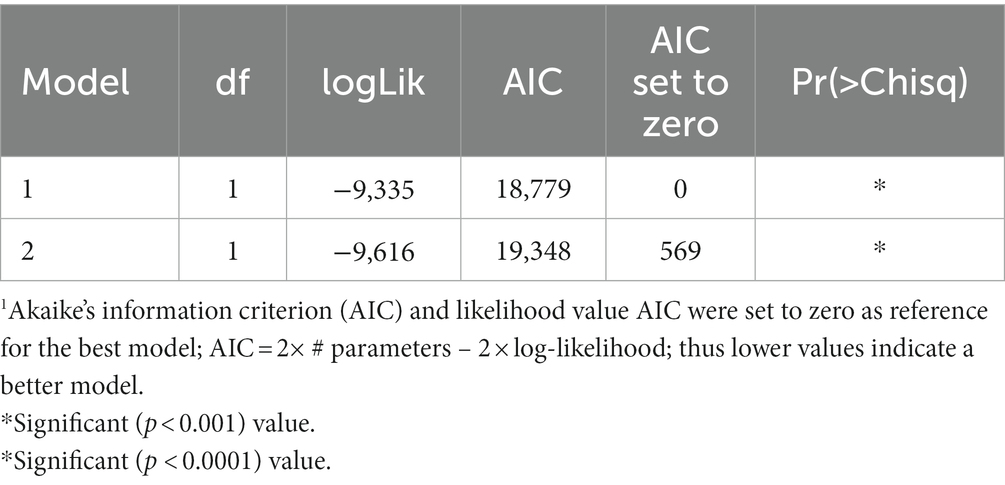
Table 2. Mixed-effects models (REML/BLUP) comparisons of GxE for SDM and conventionally defined agroecologies using AIC1.
Figure 5 shows line graph based on the least square means of live body weight (g) with standard deviations of female chickens. The five improved breeds were distributed into the three different SDM-defined agroecologies of Ethiopia. Kuroiler had the highest BW180 in SDM-defined agroecologies-I and -III, while Sasso had the highest BW180 in agroecology-II. SRIR had Koekoek had close to average performance in all the three agroecologies between the top performing breeds and the locally improved Horro. Changes in rank or magnitude of BW180 in the reaction norm plot showed a clear genotype by environment interaction among breeds assigned to the three agroecologies. Overall, the breeds performed better in agroecology-I than in agroecology-II and III, suggesting that this agroecology is more suitable for chickens regardless of breed.
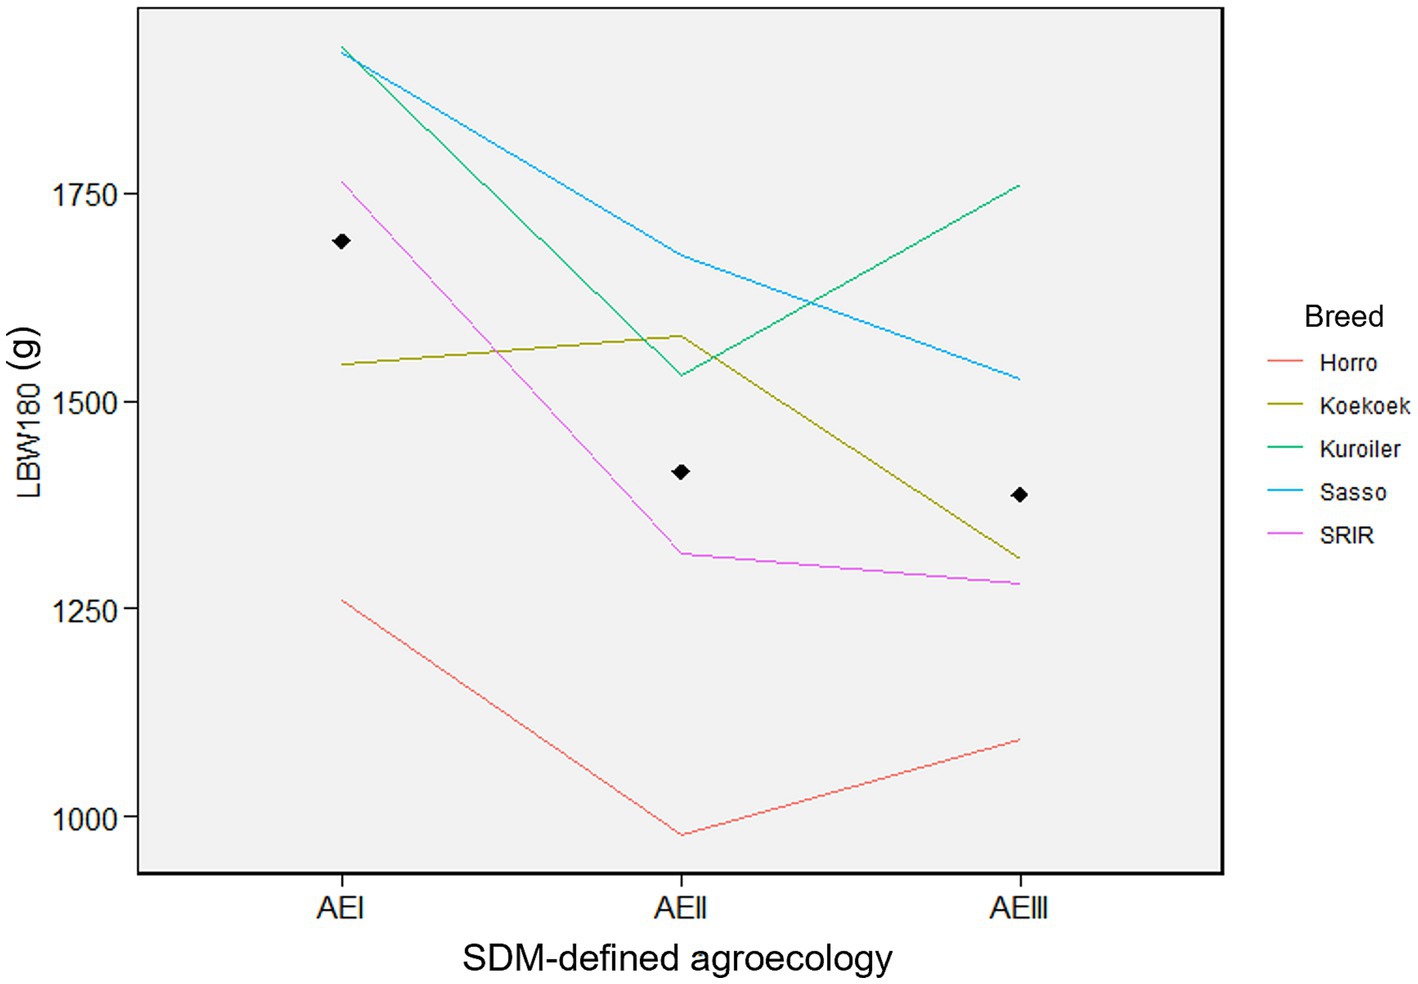
Figure 5. Reaction norm plots for female live body weight at different ages. Colors indicate each of the five chicken breeds with their live body weight (BW180). The three agroecologies are displayed for each of the plots along the x-axis (AEI = agroecology-I; AEII = agroecology-II; AEIII = agroecology-III).
Relationship between environmental predictors and body weight
The effect of environmental covariates on live body weight of female improved chickens at 180-days-of-age (BW180) estimated by GAMs are shown by partial dependence plots (PDPs) (Figures 6A–F). The zero line indicates mean model estimates, while the y-axis is a relative scale where the effect of different values of the environmental predictor on the response variable (BW180) is shown. Negative values on the y-axis indicate that at the corresponding levels of the predictor (x-axis), the model estimate for BW180 is lower than the mean. Similarly, positive values on the y-axis indicate that at the corresponding level of the environmental predictor, the model estimate for BW180 is above the mean. The highest body weight is predicted for solar radiation between 22,500 and 25,000 (Kj/m2/day), elevation below 2,400 m.a.s.l., precipitation in the coldest quarter of about 600 mm/m2, and water vapor pressure below 1.3 kPa in May. Precipitation of less than 200 mm/m2 in the wettest month and precipitation of less than 5 mm/m2 in the driest month affected BW180 negatively. The non-linear relationships between environmental predictors and the quantitative trait revealed by GAMs using PDMs, would not have been explained by the linear fixed-effects models.
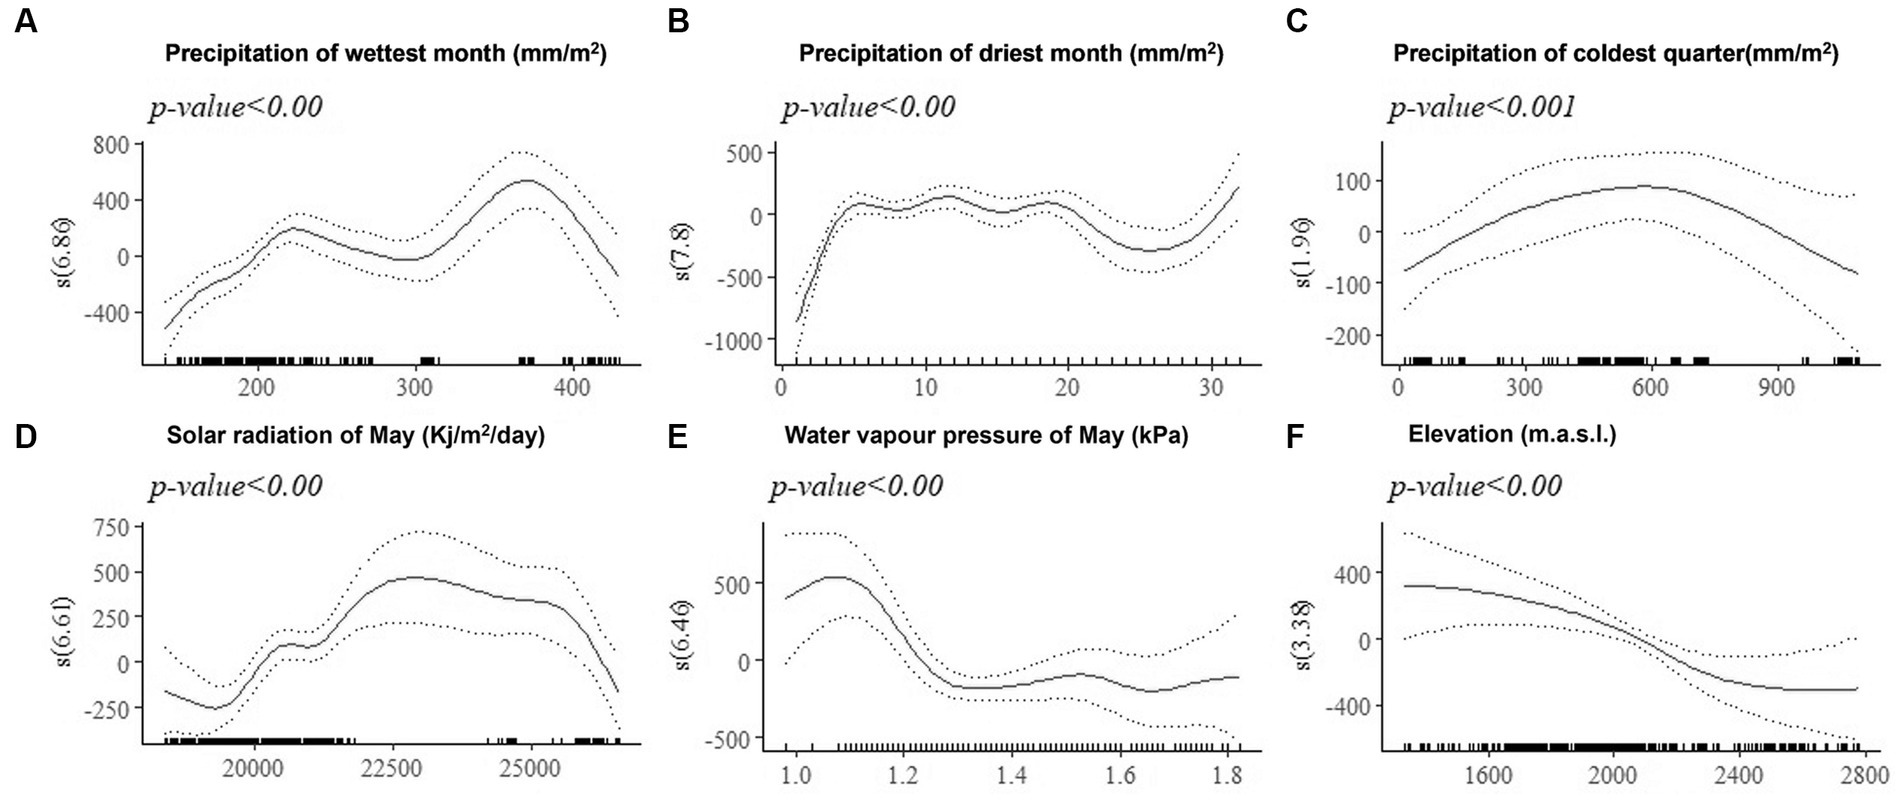
Figure 6. Generalized additive model partial dependence plots for live body weight in female chickens. Each plot shows a covariate and their partial dependence on BW180 in the context of the model. The y-axis shows the mean of observed change in live body weight and the x axis the covariate interval. The blue line represents the 95% confidence interval. Redline = mean of observed live body weight; blue line = standard error; s = smoothed variable; and () = effective degrees of freedom.
Discussion
An important reason for the failure of improved chicken breed introductions in the past 70 years to improve smallholder productivity in Africa is the lack of proper matching between environment and genotype. Multi-environment performance evaluation of candidate breeds requires a proper definition of livestock production agroecologies to improve GxE estimations. Knowledge on GxE helps to select breeds adapted to, and productive under specific or wider environmental conditions (Lozano-Jaramillo et al., 2019a,b; de Kinderen et al., 2020; Birhanu et al., 2021).
Existing agroecological zone definitions in Ethiopia (Dove, 1890; MoA, 1998; Tadesse Mulugeta et al., 2006; Deressa et al., 2010) are based on environmental predictors that are primarily of agronomic importance. Classifications primarily based on predictors such as cropping pattern and land use type are not sufficient to compare performance of livestock breeds and recommend the best performing ones for different environments.
The present study introduced an analytical framework for defining environments into agroecologies for species-specific investigation of genotype-by-environment interactions of livestock in smallholder systems. Agroecologies in the context of the present study are groupings of performance testing sites within which environmental conditions are relatively homogenous and chickens kept by the different households therein are expected to be similarly influenced.
We applied species distribution models (SDMs) to identify the environmental predictors contributing the most to habitat suitability of chickens in Ethiopia. These were elevation, solar radiation of May, precipitation of the wettest month, precipitation of the coldest quarter, water vapor pressure in May, and precipitation of the driest month.
The effects of elevation, solar radiation, and precipitation on performance of traits such as feed consumption, growth, meat and egg productivity and quality are well established (Howlider and Rose, 1987; Marsden and Morris, 1987; Shane, 1988; Shlomo, 2000; Lin et al., 2006; Lara and Rostagno, 2013; Huang et al., 2017; Lozano-Jaramillo et al., 2019a). Precipitation of the coldest quarter is a quarterly index which approximates the total precipitation that prevails during the three month-periods of the year. Precipitation of the coldest quarter above 700 mm/m2 might be related with less availability of scavenging feed resources and more prevalence of diseases and parasites, having adverse effects on mature body weight in indigenous chickens (Kebede et al., 2021).
Elevation made the highest contribution (48.5%), followed by solar radiation of May (16.7%) and precipitation of the wettest month (8.7%). It is not surprising that elevation contributed the most to habitat suitability. A tight relation is expected between elevation and climatic elements (e.g., precipitation, temperature, radiation) (Gamachu, 1988; Fazzini et al., 2015; Dinka, 2019) in Ethiopia. This is probably a reason for the significant effect of both SDM and conventionally defined agroecologies on body weight.
The most relevant environmental predictors were used to classify three SDM-defined agroecologies and produce habitat suitability maps. Areas shown as least suitable for chicken across the country are indeed least populated by the species. Areas around the boarders of Ethiopia (below 500 m.a.s.l.) have prohibitively high temperature, high solar radiation, and low precipitation; and they practice pastoral agriculture (Tilahun and Schmidt, 2012; CSA, 2017). Farmers in the northern, central, southeastern, and southwestern parts of the country have conducive climate for sedentary farming and chicken keeping (Getahun, 1978; Bayou and Assefa, 1989; CSA, 2017).
Once the most relevant environmental predictors are identified by SDMs and their agroecologies defined, multi-environment performance comparison of breeds for traits of interest can be done more accurately. The significance of spatial modeling in improving genetic evaluation, particularly of flocks/herds distributed in smallholder systems, is well recognized (Sæbø and Frigessi, 2004; Tiezzi et al., 2017; Selle et al., 2020). Apart from evaluation of breed effects, our approach of clustering performance testing sites into distinct agroecologies based on the most influential environmental predictors is applicable to improving model fit for genetic models analyzing individual records across space. Taking into account the environmental predictors influencing productivity leads to a better ranking of bulls and higher genetic gain in on-farm evaluations with possibilities to recommend best genotypes for specific environmental conditions in a precision-mating framework (Tiezzi et al., 2017). Further work is needed to evaluate the applicability of species distribution models to address GxE and identifying the best performing individuals within breed using phenotypic and genomic data.
As an alternative to reaction norm plots, partial dependence plots (PDPs) based on the best GAMs model can be used to explain the relationship (linear, monotonic, or more complex) between phenotypic performance for a trait and SDM-identified environmental predictors in livestock.
Conclusion
To the best of our knowledge, this is the first attempt to classify livestock agroecologies based on environmental predictors identified by species distribution models (SDMs) and to compare performances of breeds across SDM-defined agroecologies. We have demonstrated that better defined agroecology, considering environmental predictors associated with habitat suitability for a species, improves the prediction of GxE in multi-environment livestock performance evaluations. LMMs such as best linear unbiased prediction (BLUP) and restricted maximum likelihood estimation (REML) can be used to compare genotypes on productivity levels and recommend the most performing ones to smallholder farmers (Van Eeuwijk et al., 2016; Olivoto et al., 2019).
The use of phenotypic distribution models, such as GAMs, is recommended as a powerful method to visualize the relationships between performance of livestock at species level and environmental factors. This is useful to predict performance in future scenarios and take mitigation measures by understanding the influences of environmental predictors associated with worsening climate change.
Future research can investigate improvements in prediction of GxE for other important traits such as egg productivity and yield stability (environmental resilience) for breeds introduced into smallholder production systems. The present dataset was not detailed enough to see the effects of additional linear and random terms. We anticipate accuracies of multi-environment breed performance comparisons by species and phenotypic distribution models might increase if the models incorporate additional sources of information (e.g., pedigree, epigenetic, and genomic information). Apart from their applications in multi-environment phenotypic performance comparisons of different breeds, distribution (spatial) models hold opportunities to improve genetic evaluations within breed by enhancing separation of genetic and environmental effects for smallholders.
Data availability statement
The datasets presented in this study can be found in online repositories. The names of the repository/repositories and accession number(s) can be found in the article/supplementary material.
Ethics statement
The animal study was approved by Institutional Research Ethics Committee (IREC), International Livestock Research Institute (ILRI). The study was conducted in accordance with the local legislation and institutional requirements.
Author contributions
FK: Conceptualization, Data curation, Formal analysis, Investigation, Methodology, Project administration, Software, Validation, Visualization, Writing – original draft. HK: Conceptualization, Funding acquisition, Project administration, Resources, Supervision, Validation, Writing – review & editing. TD: Conceptualization, Funding acquisition, Project administration, Resources, Writing – review & editing. OH: Funding acquisition, Project administration, Resources, Supervision, Writing – review & editing. SK: Funding acquisition, Project administration, Resources, Validation, Writing – review & editing. SA: Conceptualization, Data curation, Methodology, Software, Writing – review & editing. JB: Conceptualization, Methodology, Project administration, Supervision, Validation, Writing – review & editing.
Funding
The author(s) declare financial support was received for the research, authorship, and/or publication of this article. The research was funded by the African Chicken Genetic Gains (ACGG) project under the Tropical Poultry Genetic Solutions (TPGS) Program of the International Livestock Research Institute (ILRI) with grant received from the Bill and Melinda Gates Foundation (Grant Agreement number: OPP1112198). Additional funding was obtained from the CGIAR Initiative on Sustainable Animal Productivity or SAPLING.
Acknowledgments
We thank the Ethiopian Agricultural Research Institute (EIAR) and Regional Agricultural Research Institutes in Oromia, Amhara, Southern, and Tigray Regional States for their crucial involvement in on-farm implementation of ACGG activities. We also thank the farmers and enumerators who participated in the chicken performance evaluation. ILRI, Animal Breeding and Genomics of Wageningen University and Research (WUR), and the Koepon Foundation provided a PhD scholarship to the first author. The findings and conclusions contained within are those of the authors and do not necessarily reflect the positions or policies of the Bill & Melinda Gates Foundation, WUR, ILRI, and the Kopoen Foundation.
Conflict of interest
The authors declare that the research was conducted in the absence of any commercial or financial relationships that could be construed as a potential conflict of interest.
Publisher’s note
All claims expressed in this article are solely those of the authors and do not necessarily represent those of their affiliated organizations, or those of the publisher, the editors and the reviewers. Any product that may be evaluated in this article, or claim that may be made by its manufacturer, is not guaranteed or endorsed by the publisher.
Supplementary material
The Supplementary material for this article can be found online at: https://www.frontiersin.org/articles/10.3389/fsufs.2023.1305799/full#supplementary-material
Footnotes
References
Ahuja, V., Dhawan, M., Punjabi, M., and Maarse, L. (2008). "Poultry based livelihoods of rural poor: case of Kuroiler in West Bengal." South Asia Pro Poor Livestock Policy Programme, initiative of NDDB and FAO: Document 12.
Apley, D. W., and Zhu, J. (2020). Visualizing the effects of predictor variables in black box supervised learning models. J. Roy. Statis. Soc. Ser. B (Statistical Methodology) 82, 1059–1086. doi: 10.1111/rssb.12377
Austin, M. (2002). Spatial prediction of species distribution: an interface between ecological theory and statistical modelling. Ecol. Model. 157, 101–118. doi: 10.1016/S0304-3800(02)00205-3
Barton, N. A., Farewell, T. S., and Hallett, S. H. (2020). Using generalized additive models to investigate the environmental effects on pipe failure in clean water networks. Npj Clean Water 3, 1–12. doi: 10.1038/s41545-020-0077-3
Bates, D., Mächler, M., Bolker, B., and Walker, S. (2014). "Fitting linear mixed-effects models using lme4." arXiv preprint arXiv:1406.5823.
Bettridge, J. M., Psifidi, A., Terfa, Z. G., Desta, T. T., Lozano-Jaramillo, M., Dessie, T., et al. (2018). The role of local adaptation in sustainable production of village chickens. Nat. Sustain. 1, 574–582. doi: 10.1038/s41893-018-0150-9
Birhanu, M. Y., Alemayehu, T., Bruno, J. E., Kebede, F. G., Sonaiya, E. B., Goromela, E. H., et al. (2021). Technical efficiency of Traditional Village chicken production in Africa: entry points for sustainable transformation and improved livelihood. Sustainability 13:8539. doi: 10.3390/su13158539
Bivand, R., Keitt, T., Rowlingson, B., Pebesma, E., Sumner, M., Hijmans, R., et al. (2021). Package ‘rgdal’. Bindings for the Geospatial Data Abstraction Library.
Bivand, R., Lewin-Koh, N., Pebesma, E., Archer, E., Baddeley, A., Bearman, N., et al. (2021). Package ‘maptools’
Bivand, R., Rundel, C., Pebesma, E., Stuetz, R., Hufthammer, K. O., and Bivand, M. R. (2017). "Package ‘rgeos’." The Comprehensive R Archive Network (CRAN).
Bolker, B. M., Gardner, B., Maunder, M., Berg, C. W., Brooks, M., Comita, L., et al. (2013). Strategies for fitting nonlinear ecological models in R, AD M odel B uilder, and BUGS. Methods Ecol. Evol. 4, 501–512. doi: 10.1111/2041-210X.12044
Brown, G. S. (2011). Patterns and causes of demographic variation in a harvested moose population: evidence for the effects of climate and density-dependent drivers. J. Anim. Ecol. 80, 1288–1298. doi: 10.1111/j.1365-2656.2011.01875.x
Chebo, C., Betsha, S., and Melesse, A. (2022). Chicken genetic diversity, improvement strategies and impacts on egg productivity in Ethiopia: a review. Worlds Poult. Sci. J., 1–19.
CSA (2017). Livestock characteristics, agricultural sample survey. Addis Ababa, Ethiopia. Statistical Bull. 2, 9–13.
CSA (2020). Agricultural sample survey 2019/20 [2012 E.C.]. Volume II report on livestock and livestock characteristics (private peasant holdings). C. S. A. (CSA) Ethiopia: Addis Ababa.
Dana, N., Van der Waaij, L. H., Dessie, T., and van Arendonk, J. A. (2010). Production objectives and trait preferences of village poultry producers of Ethiopia: implications for designing breeding schemes utilizing indigenous chicken genetic resources. Trop. Anim. Health Prod. 42, 1519–1529. doi: 10.1007/s11250-010-9602-6
Dana, N., Vander Waaij, E., and van Arendonk, J. A. (2011). Genetic and phenotypic parameter estimates for body weights and egg production in Horro chicken of Ethiopia. Trop. Anim. Health Prod. 43, 21–28. doi: 10.1007/s11250-010-9649-4
de Kinderen, M. A., Sölkner, J., Mészáros, G., Alemu, S. W., Esatu, W., Bastiaansen, J. W., et al. (2020). Genotype by environment interaction for egg number and egg weight of five dual-purpose chicken breeds in different zones of Oromia region in Ethiopia. Acta Fytotechnica et Zootechnica 23, 205–213. doi: 10.15414/afz.2020.23.mi-fpap.205-213
Deressa, T. T., Ringler, C., and Hassan, R. M. (2010). "Factors affecting the choices of coping strategies for climate extremes." The case of farmers in the Nile Basin of Ethiopia IFPRI Discussion Paper 1032.
Desclaux, D., Nolot, J., Chiffoleau, Y., Gozé, E., and Leclerc, C. (2007). Changes in the concept of genotype x environment interactions to fit agriculture evolution: multidisciplinary points of view, WU 163. doi: 10.1007/s10681-008-9717-2,
Dinka, M. O. (2019). “Development and application of conceptual rainfall-altitude regression model: the case of Matahara area (Ethiopia)” in Topics in Hydrometerology. V. H. Theodore, II and R. Prasada. Rijeka eds (London: IntechOpen)
Dumont, B., Fortun-Lamothe, L., Jouven, M., Thomas, M., and Tichit, M. (2013). Prospects from agroecology and industrial ecology for animal production in the 21st century. Animal 7, 1028–1043. doi: 10.1017/S1751731112002418
Dumont, B., González-García, E., Thomas, M., Fortun-Lamothe, L., Ducrot, C., Dourmad, J.-Y., et al. (2014). Forty research issues for the redesign of animal production systems in the 21st century. Animal 8, 1382–1393. doi: 10.1017/S1751731114001281
Elith, J., and Leathwick, J. R. (2009). Species distribution models: ecological explanation and prediction across space and time. Annu. Rev. Ecol. Evol. Syst. 40, 677–697. doi: 10.1146/annurev.ecolsys.110308.120159
Elith, J., Leathwick, J. R., and Hastie, T. (2008). A working guide to boosted regression trees. J. Anim. Ecol. 77, 802–813. doi: 10.1111/j.1365-2656.2008.01390.x
Elith, J., Phillips, S. J., Hastie, T., Dudík, M., Chee, Y. E., and Yates, C. J. (2011). A statistical explanation of MaxEnt for ecologists. Divers. Distrib. 17, 43–57. doi: 10.1111/j.1472-4642.2010.00725.x
Farr, T. G., Rosen, P. A., Caro, E., Crippen, R., Duren, R., Hensley, S., et al. (2007). The shuttle radar topography mission. Rev. Geophys. 45, 1944–9208. doi: 10.1029/2005RG000183
Fasiolo, M., Nedellec, R., Goude, Y., and Wood, S. N. (2020). Scalable visualization methods for modern generalized additive models. J. Comput. Graph. Stat. 29, 78–86. doi: 10.1080/10618600.2019.1629942
Fazzini, M., Bisci, C., and Billi, P. (2015). The climate of Ethiopia Landscapes and landforms of Ethiopia. Amsterdam: Springer.
Fick, S. E., and Hijmans, R. J. (2017). WorldClim 2: new 1-km spatial resolution climate surfaces for global land areas. Int. J. Climatol. 37, 4302–4315. doi: 10.1002/joc.5086
Friedman, J. H. (2001). Greedy function approximation: a gradient boosting machine. Ann. Stat. 29, 1189–1232. doi: 10.1214/aos/1013203451
Gamachu, D. (1988). Some patterns of altitudinal variation of climatic elements in the mountainous regions of Ethiopia. Mt. Res. Dev. 8, 131–138. doi: 10.2307/3673439
Gebrechorkos, S. H., Hülsmann, S., and Bernhofer, C. (2019). Long-term trends in rainfall and temperature using high-resolution climate datasets in East Africa. Sci. Rep. 9, 1–9. doi: 10.1038/s41598-019-47933-8
Gebru, G., Belay, G., Vallejo-Trujillo, A., Dessie, T., Gheyas, A., and Hanotte, O. (2022). Ecological niche modelling as a tool to identify candidate indigenous chicken ecotypes of Tigray (Ethiopia). Front. Genet. 13:968961. doi: 10.3389/fgene.2022.968961
Getahun, A. (1978). Agricultural systems in Ethiopia. Agric. Syst. 3, 281–293. doi: 10.1016/0308-521X(78)90014-8
Gheyas, A. A., Vallejo-Trujillo, A., Kebede, A., Lozano-Jaramillo, M., Dessie, T., Smith, J., et al. (2021). Integrated environmental and genomic analysis reveals the drivers of local adaptation in African indigenous chickens. Mol. Biol. Evol. 38, 4268–4285. doi: 10.1093/molbev/msab156
Gicheha, M. G. (2021). The effects of heat stress on production, reproduction, health in chicken and its dietary amelioration. London: Advances in Poultry Nutrition Research, IntechOpen
Grobbelaar, J. A. N., Sutherland, B., and Molalakgotla, N. (2010). Egg production potentials of certain indigenous chicken breeds from South Africa. Anim. Genet. Resour. 46, 25–32. doi: 10.1017/S2078633610000664
Hampe, A. (2004). Bioclimate envelope models: what they detect and what they hide. Glob. Ecol. Biogeogr. 13, 469–471. doi: 10.1111/j.1466-822X.2004.00090.x
Hastie, T., Tibshirani, R., and Friedman, J. (2009). The elements of statistical learning: Data mining, inference, and prediction London: Springer Science & Business Media.
Hengl, T., de Jesus, J. M., Heuvelink, G. B., Gonzalez, M. R., Kilibarda, M., Blagotić, A., et al. (2017). SoilGrids250m: global gridded soil information based on machine learning. PLoS One 12:e0169748. doi: 10.1371/journal.pone.0169748
Hengl, T., Heuvelink, G. B., Kempen, B., Leenaars, J. G., Walsh, M. G., Shepherd, K. D., et al. (2015). Mapping soil properties of Africa at 250 m resolution: random forests significantly improve current predictions. PLoS One 10:e0125814. doi: 10.1371/journal.pone.0125814
Hijmans, R. J., Guarino, L., Cruz, M., and Rojas, E. (2001). Computer tools for spatial analysis of plant genetic resources data: 1. Plant Genet. Resour. Newsl. 127: 15–19.
Hijmans, R. J., Phillips, S., Leathwick, J., Elith, J., and Hijmans, M. R. J. (2017). Package ‘dismo’. Circles 9, 1–68.
Hijmans, R. J., Van Etten, J., Cheng, J., Mattiuzzi, M., Sumner, M., Greenberg, J. A., et al. (2015). Package ‘raster’.R package 734
Howlider, M., and Rose, S. (1987). Temperature and the growth of broilers. Worlds Poult. Sci. J. 43, 228–237. doi: 10.1079/WPS19870015
Huang, S., Zhang, L., Rehman, M. U., Iqbal, M. K., Lan, Y., Mehmood, K., et al. (2017). High altitude hypoxia as a factor that promotes tibial growth plate development in broiler chickens. PLoS One 12:e0173698. doi: 10.1371/journal.pone.0173698
Hurni, H. (1998). "Agroecological belts of Ethiopia." Explanatory notes on three maps at a scale of 1(1,000,000).
Hutchinson, G. E. (1957). Concluding remarks Cold Spring Harbor symposia on quantitative biology. New York: Cold Spring Harbor Laboratory Press.
Isenberg, D. (2007). "Keggfarms (India)-which came first, the Kuroiler or the Kegg." Boston: Harvard Business School Case Study.
Jueterbock, A., Smolina, I., Coyer, J. A., and Hoarau, G. (2016). The fate of the Arctic seaweed Fucus distichus under climate change: an ecological niche modeling approach. Ecol. Evol. 6, 1712–1724. doi: 10.1002/ece3.2001
Kebede, F. G., Komen, H., Dessie, T., and Alemu, S. W. (2021). Species and phenotypic distribution models reveal population differentiation in Ethiopian indigenous chickens. Front. Genet. 12:723360. doi: 10.3389/fgene.2021.723360
Lara, L. J., and Rostagno, M. H. (2013). Impact of heat stress on poultry production. Animals 3, 356–369. doi: 10.3390/ani3020356
Lin, H., Jiao, H., Buyse, J., and Decuypere, E. (2006). Strategies for preventing heat stress in poultry. Worlds Poult. Sci. J. 62, 71–86. doi: 10.1079/WPS200585
Lozano Jaramillo, M., Bastiaansen, J., Dessie, T., and Komen, H. (2018). "Understanding the effect of the environmental conditions on the suitability of a breed for different agro-ecological zones."
Lozano-Jaramillo, M. (2019). Predicting breed by environment interaction using ecological modelling Droevendaalsesteeg, Wageningen University.
Lozano-Jaramillo, A., Alemu, S., Dessie, T., Komen, H., and Bastiaansen, J. (2019a). Using phenotypic distribution models to predict livestock performance. Sci. Rep. 9, 1–11. doi: 10.1038/s41598-019-51910-6
Lozano-Jaramillo, M., Bastiaansen, J., Dessie, T., and Komen, H. (2019b). Use of geographic information system tools to predict animal breed suitability for different agro-ecological zones. Animal 13, 1536–1543. doi: 10.1017/S1751731118003002
Marsden, A., and Morris, T. (1987). Quantitative review of the effects of environmental temperature on food intake, egg output and energy balance in laying pullets. Br. Poult. Sci. 28, 693–704. doi: 10.1080/00071668708417005
Michel, M. J., Chien, H., Beachum, C. E., Bennett, M. G., and Knouft, J. H. (2017). Climate change, hydrology, and fish morphology: predictions using phenotype-environment associations. Clim. Chang. 140, 563–576. doi: 10.1007/s10584-016-1856-1
Mirkena, T., Walelign, E., Tewolde, N., Gari, G., Abebe, G., and Newman, S. (2018). Camel production systems in Ethiopia: a review of literature with notes on MERS-CoV risk factors. Pastoralism 8:30. doi: 10.1186/s13570-018-0135-3
MoA, (1998). Agro-ecological zones of Ethiopia. N. R. M. R. Department. Ethiopia, Ministry of Agriculture. Natural Resources Management & Regulatory Department.
Muscarella, R., Galante, P. J., Soley-Guardia, M., Boria, R. A., Kass, J. M., Uriarte, M., et al. (2014). ENMeval: an R package for conducting spatially independent evaluations and estimating optimal model complexity forMaxentecological niche models. Methods Ecol. Evol. 5, 1198–1205. doi: 10.1111/2041-210X.12261
Nelder, J. A., and Wedderburn, R. W. (1972). Generalized linear models. J. R. Stat. Soc. Ser. A 135, 370–384. doi: 10.2307/2344614
Oddi, F. J., Miguez, F. E., Ghermandi, L., Bianchi, L. O., and Garibaldi, L. A. (2019). A nonlinear mixed-effects modeling approach for ecological data: using temporal dynamics of vegetation moisture as an example. Ecol. Evol. 9, 10225–10240. doi: 10.1002/ece3.5543
Olivoto, T., Lúcio, A. D., da Silva, J. A., Marchioro, V. S., de Souza, V. Q., and Jost, E. (2019). Mean performance and stability in multi-environment trials I: combining features of AMMI and BLUP techniques. Agron. J. 111, 2949–2960. doi: 10.2134/agronj2019.03.0220
Pebesma, E., Bivand, R., Pebesma, M. E., ColorBrewer, S. R., and Collate, A. (2012). Package ‘sp’. The Comprehensive R Archive Network.
Phillips, S. J., Anderson, R. P., Dudík, M., Schapire, R. E., and Blair, M. E. (2017). Opening the black box: an open-source release of Maxent. Ecography 40, 887–893. doi: 10.1111/ecog.03049
Phillips, S. J., and Dudík, M. (2008). Modeling of species distributions with Maxent: new extensions and a comprehensive evaluation. Ecography 31, 161–175. doi: 10.1111/j.0906-7590.2008.5203.x
Phillips, S. J., Dudík, M., Elith, J., Graham, C. H., Lehmann, A., Leathwick, J., et al. (2009). Sample selection bias and presence-only distribution models: implications for background and pseudo-absence data. Ecol. Appl. 19, 181–197. doi: 10.1890/07-2153.1
Piepho, H.-P. (1994). Best linear unbiased prediction (BLUP) for regional yield trials: a comparison to additive main effects and multiplicative interaction (AMMI) analysis. Theor. Appl. Genet. 89, 647–654. doi: 10.1007/BF00222462
Piepho, H., and Möhring, J. (2005). Best linear unbiased prediction of cultivar effects for subdivided target regions. Crop Sci. 45, 1151–1159. doi: 10.2135/cropsci2004.0398
Radosavljevic, A., and Anderson, R. P. (2014). Making better Maxent models of species distributions: complexity, overfitting and evaluation. J. Biogeogr. 41, 629–643. doi: 10.1111/jbi.12227
Raynor, E. J., Powell, L. A., and Schacht, W. H. (2018). Present and future thermal environments available to sharp-tailed grouse in an intact grassland. PLoS One 13:e0191233. doi: 10.1371/journal.pone.0191233
Rezaei, R., and Sengül, H. (2018). Development of generalized additive models (GAMs) for Salmo rizeensis endemic to north-eastern streams of Turkey. Turk. J. Fish. Aquat. Sci. 19, 29–39.
Sæbø, S., and Frigessi, A. (2004). A genetic and spatial Bayesian analysis of mastitis resistance. Genet. Sel. Evol. 36, 1–16.
Selle, M. L., Steinsland, I., Powell, O., Hickey, J. M., and Gorjanc, G. (2020). Spatial modelling improves genetic evaluation in smallholder breeding programs. Genet. Sel. Evol. 52, 1–17. doi: 10.1186/s12711-020-00588-w
Selmoni, O., Vajana, E., Guillaume, A., Rochat, E., and Joost, S. (2020). Sampling strategy optimization to increase statistical power in landscape genomics: a simulation-based approach. Mol. Ecol. Resour. 20, 154–169. doi: 10.1111/1755-0998.13095
Shane, S. M. (1988). Factors influencing health and performance of poultry in hot climates. Crit. Rev. Poul. Biol. 1, 247–267.
Shapiro, B. I., Gebru, G., Desta, S., Negassa, A., Negussie, K., Aboset, G., et al. (2015). "Ethiopia livestock master plan: roadmaps for growth and transformation."
Shlomo, Y. (2000). Domestic fowl-strategies to confront environmental conditions. Poul. Avian Biol. Rev. 11, 81–95.
Silverman, B. W. (1985). Some aspects of the spline smoothing approach to non-parametric regression curve fitting. J. R. Statis. Soc. Ser. B (Methodological) 47, 1–21.
Smith, A. B., Alsdurf, J., Knapp, M., Baer, S. G., and Johnson, L. C. (2017). Phenotypic distribution models corroborate species distribution models: a shift in the role and prevalence of a dominant prairie grass in response to climate change. Glob. Chang. Biol. 23, 4365–4375. doi: 10.1111/gcb.13666
Soberón, J. (2007). Grinnellian and Eltonian niches and geographic distributions of species. Ecol. Lett. 10, 1115–1123. doi: 10.1111/j.1461-0248.2007.01107.x
Soussana, J.-F., Tichit, M., Lecomte, P., and Dumont, B. (2015). Agroecology: Integration with livestock. Rome: FAO.
Tadesse Mulugeta, A. B., Gashaw, B., Tewodros, T., Jordan, C., and Todd, B. (2006). Atlas of the Ethiopian rural economy. Intl Food Policy Res Inst
Tibshirani, R. (1996). Regression shrinkage and selection via the lasso. J. R. Statist. Soc. Ser. B (Methodological) 58, 267–288.
Tiezzi, F., de Los Campos, G., Gaddis, K. P., and Maltecca, C. (2017). Genotype by environment (climate) interaction improves genomic prediction for production traits in US Holstein cattle. J. Dairy Sci. 100, 2042–2056. doi: 10.3168/jds.2016-11543
Tilahun, M., Mitiku, M., and Ayalew, W. (2022). Agroecology is Affecting Village chicken producers’ breeding objective in Ethiopia. Scientifica 2022, 1–12. doi: 10.1155/2022/9492912
Tilahun, H., and Schmidt, E. (2012). Spatial analysis of livestock production patterns in Ethiopia. Ethiopia Strategy Support Program II (ESSP II) Working Paper 44.
Trujillo, A. V., Kabede, A., Lozano-Jaramillo, M., Dessie, T., Smith, J., Hanotte, O., et al. (2022). Ecological niche modelling for delineating livestock ecotypes and exploring environmental genomic adaptation: the example of Ethiopian village chicken. Front. Ecol. Evol. 10, 1–21. doi: 10.3389/fevo.2022.866587
Vajana, E., Barbato, M., Colli, L., Milanesi, M., Rochat, E., Fabrizi, E., et al. (2018). Combining landscape genomics and ecological modelling to investigate local adaptation of indigenous Ugandan cattle to East Coast fever. Front. Genet. 9:385. doi: 10.3389/fgene.2018.00385
Vallejo-Trujillo, A., Kebede, A., Lozano, M., Dessie, T., Sparks, N., and Smith, J. (2018). Ecological niche modelling applies for the characterization of indigenous livestock species: the example of Ethiopian village chickens.
Van Eeuwijk, F. A., Bustos-Korts, D. V., and Malosetti, M. (2016). What should students in plant breeding know about the statistical aspects of genotype× environment interactions? Crop Sci. 56, 2119–2140. doi: 10.2135/cropsci2015.06.0375
Wahba, G. (1983). Bayesian “confidence intervals” for the cross-validated smoothing spline. J. R. Statist. Soc. Ser. B (Methodological) 45, 133–150.
Wiens, J. A., Stralberg, D., Jongsomjit, D., Howell, C. A., and Snyder, M. A. (2009). Niches, models, and climate change: assessing the assumptions and uncertainties. Proc. Natl. Acad. Sci. 106, 19729–19736. doi: 10.1073/pnas.0901639106
Wiley, M., and Wiley, J. F. (2019). Advanced R statistical programming and data models: analysis machine learning, and visualization New York: Apress.
Wisz, M. S., Hijmans, R., Li, J., Peterson, A. T., Graham, C., Guisan, A., et al. (2008). Effects of sample size on the performance of species distribution models. Divers. Distrib. 14, 763–773. doi: 10.1111/j.1472-4642.2008.00482.x
Wondmeneh, E., van Der Waaij, E., Tadelle, D., Udo, H., and Van Arendonk, J. (2014). Adoption of exotic chicken breeds by rural poultry keepers in Ethiopia. Acta Agric. Scand. A Anim. Sci. 64, 210–216. doi: 10.1080/09064702.2015.1005658
Wood, S. N., and Augustin, N. H. (2002). GAMs with integrated model selection using penalized regression splines and applications to environmental modelling. Ecol. Model. 157, 157–177. doi: 10.1016/S0304-3800(02)00193-X
Xiong, J., Thenkabail, P., Tilton, J., Gumma, M., Teluguntla, P., Congalton, R., et al. (2017). NASA making earth system data Records for use in research environments (MEaSUREs) global food security-support analysis data (GFSAD) cropland extent 2015 Africa 30 m V001.
Keywords: chicken breed, smallholder systems, species distribution models, genotype by environment interactions, generalized additive model
Citation: Kebede FG, Komen H, Dessie T, Hanotte O, Kemp S, Alemu SW and Bastiaansen JWM (2023) Agroecologies defined by species distribution models improve model fit of genotype by environment interactions to identify the best performing chicken breeds for smallholder systems. Front. Sustain. Food Syst. 7:1305799. doi: 10.3389/fsufs.2023.1305799
Edited by:
Brandy E. Phipps, Central State University, United StatesReviewed by:
Edward James Raynor, Colorado State University, United StatesFrancesco Tiezzi, University of Florence, Italy
Copyright © 2023 Kebede, Komen, Dessie, Hanotte, Kemp, Alemu and Bastiaansen. This is an open-access article distributed under the terms of the Creative Commons Attribution License (CC BY). The use, distribution or reproduction in other forums is permitted, provided the original author(s) and the copyright owner(s) are credited and that the original publication in this journal is cited, in accordance with accepted academic practice. No use, distribution or reproduction is permitted which does not comply with these terms.
*Correspondence: Fasil Getachew Kebede, ZmFzaWxnZXRhY2hldzdAZ21haWwuY29t