 Aditya Francis
 Sami Ghnimi
 Sergiy Smetana
- 1German Institute of Food Technologies—DIL e.V., Quakenbrück, Germany
- 2ISARA Lyon, Lyon, France
- 3Université Claude Bernard Lyon 1, CNRS, LAGEPP UMR 5007, Villeurbanne, France
- 4Institute of Food Quality and Food Safety, University of Veterinary Medicine Hannover, Foundation, Hannover, Germany
Accurate environmental analysis is central to addressing food product impacts, yet uncertainty shrouds the effectiveness of life cycle assessment (LCA) weighting methods, particularly for alternative protein foods and different countries. Our approach characterizes environmental impact weighting based on total or specific production impacts at the country level, facilitating relevance assessment. We have developed an innovated methodology to calculate weights for alternative foods such as crickets, mealworms, black soldier flies, cultured meat, Chlorella, and Spirulina. This method integrates their country-level eco-potential linked to environmental impacts, and addresses challenges in existing methodologies-policy changes, contextual adaptation, method specificity, intangible values. Relative impact weights, normalized by arable land and population, cover greenhouse gas emissions, land use, water use and energy use. Eco-potential points for alternative protein sources are derived by dividing their impact values by the relative country-level weights. In addition, eco-potential points for conventional protein sources are calculated for comparison, highlighting disparities. The results show a dynamic eco-potential influenced by evolving country-level per capita impacts that influence food product impacts. Comparison of literature based LCAs with our weighted country-level impacts highlights an alignment between absolute emissions and relative impact weightings in certain cases. Moreover, we have developed a parallel methodology to calculate eco-potential points for selected alternative food proteins based on protein supply in countries. This calculation is based on 17 years of data and multiplies the protein supply by the average environmental impact of selected sources (GHGE, water, land and energy use). This results in country-level weighted impacts (CWI), or eco-potential points that are aligned with protein supply. Combining the CWI from the four indicators gives the combined eco-potential values for selected alternative proteins.
The comparison of the product’s CWIs for GWP, WU, EU and LU showed that certain impact categories with higher CWI or eco-potential points can contribute to the higher combined eco-potential point. The eco-potential points of different impact categories also varied between countries.
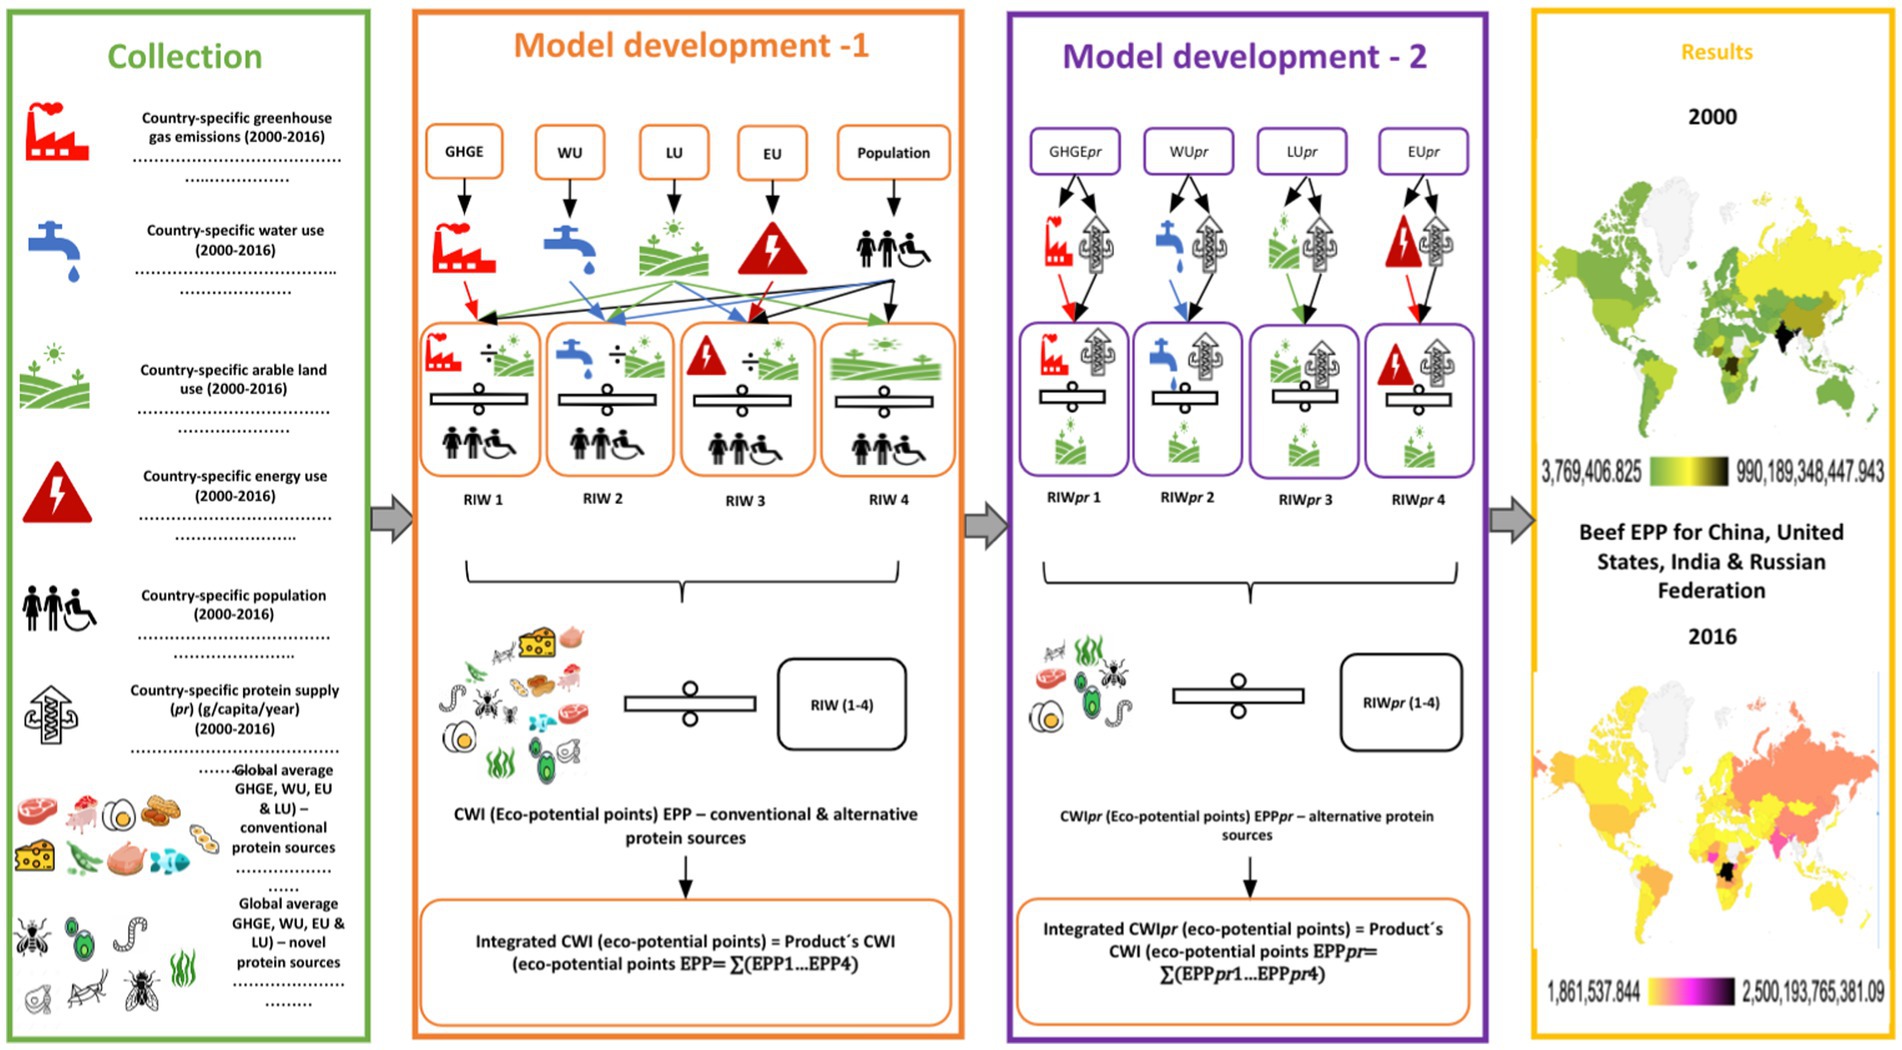
Graphical Abstract.
Highlights
• Country relative impact weights (RIWs) were shown to be dynamic over time with changes in factors such as total GHG, water use, arable land use, energy use and population.
• Product’s impact, weighted against the relative impact weights (RIWs) in selected impact categories was influenced by the dynamic changes in the RIWs over time.
• Product’s country weighted impacts (CWIs), when combined for the selected impact categories, reflected the combined potential for the increased impact in the selected categories and for the country of interest.
• Product’s absolute emissions or resources use could be higher, but its CWI or eco-potential could be lower in the same country, or they could be the same.
1 Introduction
Effective management and policy interventions in the field of climate change mitigation and environmental impact reduction require a reliable assessment system capable of reflecting the current state of the environment in a dynamic and regional perspective (Smetana et al., 2015; Beaussier et al., 2019). Assessments of food systems sustainability are crucial to address global challenges like climate change and environmental degradation. Studies like Vermeulen et al. (2012) highlights inefficiencies in the food supply chain. These assessments provide a comprehensive understanding of social, economic, and environmental factors, guiding evidence-based interventions for long-term sustainability (Willett et al., 2019).
Regionalization in life cycle assessment (LCA) is not new, thus approaches based on regionalized characterization factors (Frischknecht et al., 2018), assessment methods and databases combined with geoinformatics systems (Mutel et al., 2011), downscaling of input-output analysis to regional level (Smetana et al., 2015) have already established a solid basis. However, such approaches are not sensitive to year-to-year changes in economy, society or emissions. In addition, Life Cycle Impact Assessment (LCIA) methodologies are subject to uncertainty. For example, LC-IMPACT methodology has circumstantial uncertainty such as which time horizon to take into account and what is the degree of certainty of the consequences (Frischknecht et al., 2018). While dealing with uncertainty in how we measure environmental impacts, it’s important to also look at the effects of new products on the market. This shows that we need to use different methods when checking how these emerging products affect the environment.
Determining the environmental impacts of alternative and emerging products on the market is a complex and challenging task. Even ex-ante approaches in LCA (Cucurachi et al., 2018; Moni et al., 2019; Steubing and De Koning, 2021) do not assess the relevance of the environmental impacts of emerging products and technologies at the scale of producing regions and countries. Furthermore, alternative protein foods are characterized by limited data availability and potential variations in production practices and scales (Ververis et al., 2020). By definition alternative proteins are proteins which are derived from plants, animal cells, or fermentation, replicate or exceed the taste of traditional animal products with comparable or lower costs, requiring fewer resources and generating fewer negative environmental impacts. While plant-based and fermentation-derived options are available, cultivated meats are still in development (Good Food Institute, 2023).
Due to regional differences, the LCA at the production and the consumption stages vary considerably. The products consumed today have intercontinental environmental impacts as they are often produced in one country and delivered through global supply chains (Yang et al., 2019). Thus, LCA weighting results should represent the “price” of production in terms of country’s capacity. Such a weighting system is essential for policy and decision makers who want to interpret LCA results in terms of a country’s or region’s environmental awareness (Castellani et al., 2016). Regional weighting is an important issue in the LCA of the extended supply chains, as data on environmental impacts of regions and of regional production are not available (Itsubo et al., 2015). Examples of regionalized weighting methodologies with their characteristics and limitations are presented in Table 1.
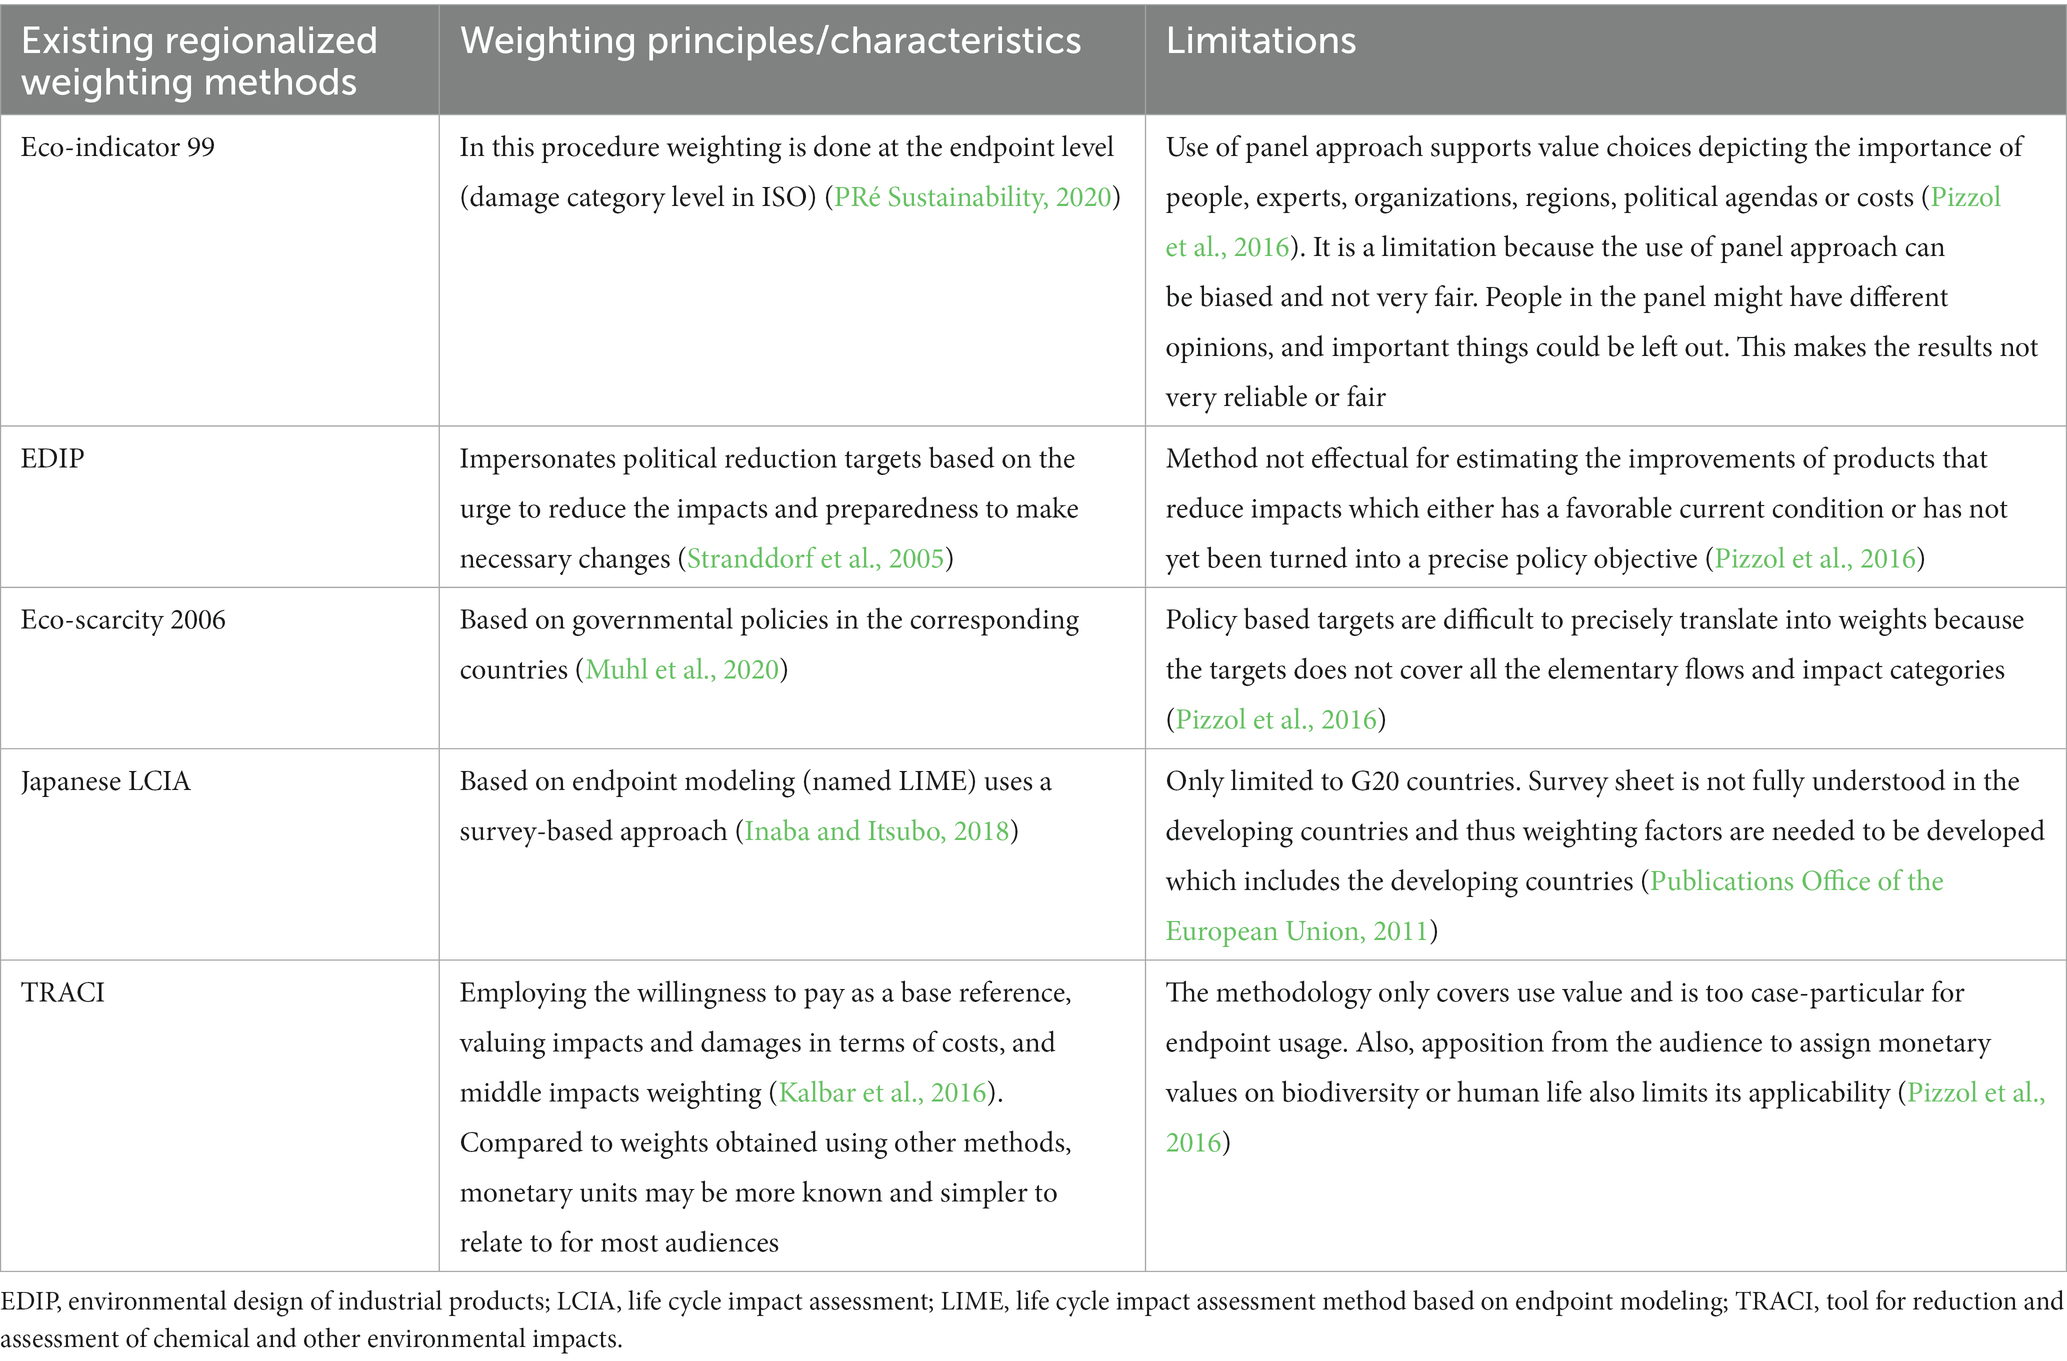
Table 1. Existing weighting methods and their associated principles/characteristics and their limitations.
Our work builds on existing regionalized and weighting methodologies such as Eco-indicator 99, EDIP, Eco-scarcity 2006, Japanese LCIA, TRACI, and extends them by developing a model to incorporate reference to population and environmental impacts and conditions into the weighting methodology of LCA. The incorporation of country based weighting factors, based on real environmental impact data from the countries, into the LCA should provide a solid basis for dynamic analysis of alternative or emerging products and technologies. In this study, we develop a methodological approach based on the eco-potential of conventional and alternative protein sources which discloses the additional environmental impacts in different countries. We have also delved into the crucial concept of the rebound effect, as outlined by Matraeva et al. (2022), which denotes an increase in overall resource consumption despite efforts to reduce individual usage, including the integration of ‘green’ technologies.
The term “eco-potential” is basically developed for this research work and is related to the original term “Ecopoints” or ecological scarcity LCIA method using midpoint approach (Sharaai, 2012). Eco-potential points are different from the already used LCIA eco-points in that they give us the high and low scores for the country-level environmental impacts of the product, with high scores representing the higher potential for lower impacts and low scores representing the higher probability of higher environmental impacts. The reason behind choosing the specific conventional protein sources was because of the data availability for its country-based impact from the study done by Poore and Nemecek (2018). The regionalized (country-based) environmental impacts from the study is a good base for comparing the results obtained from our methodology. Since we wanted to analyze the regional environmental impacts of future foods, the data for the future foods especially the (alternative protein sources) was gathered which was available from the study done by Parodi et al. (2018). Finally, we demonstrate the advantages and limitations of our approach to determining the relevance of the country-level and dynamic environmental impacts of alternative foods by analyzing the results and comparing them with other studies. In this study, we present a useful and promising weighting system for policy and decision makers to interpret LCA results related to protein sources in the context of a country’s environmental awareness. Our approach offers valuable insights that can enhance the applicability of LCA findings for informed decision-making.”
The study relied on a stepwise approach to calculate normalized values and impact weights according to the impact indicators relevant for the selected country (Table 1). Food production accounts for a significant share of environmental impacts in the developed countries (Nemecek et al., 2016). Indicators such as GHGEs, WU, ALU, and EU were chosen because they are directly related to agri-food systems and reflect the critical environmental parameters for food production. In fact, more than a quarter (26%) of the world’s GHGE come from food and agriculture (Poore and Nemecek, 2018). In particular, the consumption of proteins from animal sources leads to significant environmental impacts. The consumption of animal proteins is a well-known contributor to greenhouse gas emissions, water consumption, biodiversity loss, and impacts on nutrient cycling due to agricultural production (Ernstoff et al., 2019). Some environmental and demographic factors (country arable land, country population) were considered as normalization factors. The size of the human population and the rate of its growth are now contributing significantly to the extinction of biodiversity (Crist et al., 2017).
2 Methods
2.1 Model development
The first step was to calculate the relative impact weights (RIWs) by collecting the data for the country’s total GHGE, WU, EU, LU and population for a time scale of 17 years. The collected data is for calculating the relative impact weight (RIW) results for the environmental impact categories as mentioned above. In the second step, the CWIs or eco-potential points of the product were calculated by dividing the environmental impacts of the product (GHGE, WU, ALU, and EU) by the RIWs calculated in the first step. In the third and fourth step the same methodology for calculating the RIW, CWI and eco-points was applied to the environmental impacts of the protein supplies in the selected countries only. We then carry out an analysis of the eco-potential of nine conventional protein sources [i.e., peas, soybeans (tofu), groundnut, beef, cheese, pork, eggs, fish (farmed) and poultry meat] using the developed weighting methods according to geographical aspects (148 countries), resource (land, climate, water and energy uses), time scale (17 years) and population aspects. Next, we assess the applicability of the eco-potential weighting method to identify the additional potential environmental impact of alternative protein sources (i.e., crickets, mealworms, black soldier fly, housefly, cultured meat, Chlorella, and Spirulina) in relation to the aforementioned aspects and the impact of the current protein supply.
The relative environmental impacts and eco-potentials of the target products were calculated in four application steps as explained in the Table 2. In the first step (I), impact categories (country level, annual values) of arable land use, greenhouse gas emissions, water use, and energy use were selected. In the second step (II), normalized values of relative impact weights (RIW) are calculated in 4 sub-steps for the selected impact categories. In step (II), the four impact indicators (ALU, GHGE, WU, and EU) are normalized by the ALU and population in the selected countries (RIW1–4). Similarly, RIWpr1–4 (protein related) values are also calculated. For the calculation of the protein related RIW, in the first step (Ia), data on the dietary protein supply (g/capita/day) per country and the environmental impacts (GWP, WU, EU, and ALU) of the food protein sources were collected. An average of the selected protein sources was again calculated for the environmental impact indicators (GWP, WU, EU, and ALU). The average values of these impact indicators were then multiplied by the converted amount of protein supply (g/capita/year). In step (IIa), values for RIWpr1–4 are calculated by normalizing the protein-related impact indicators (ALUpr, GHGEpr, WUpr and EUpr) by ALU and population. In step (III), the eco-potential points (EPP1–4) for the target food products in the different countries are calculated by dividing the overall average environmental impacts of the product by the country’s total impact weights (RIW1–4) and similarly with the protein-related Relative impact weights (RIWpr1–4) in step (IIIa). Finally, in steps (IV and IVa) the product-specific eco-potential points (EPP1–4) were integrated by summing them to obtain the final result.
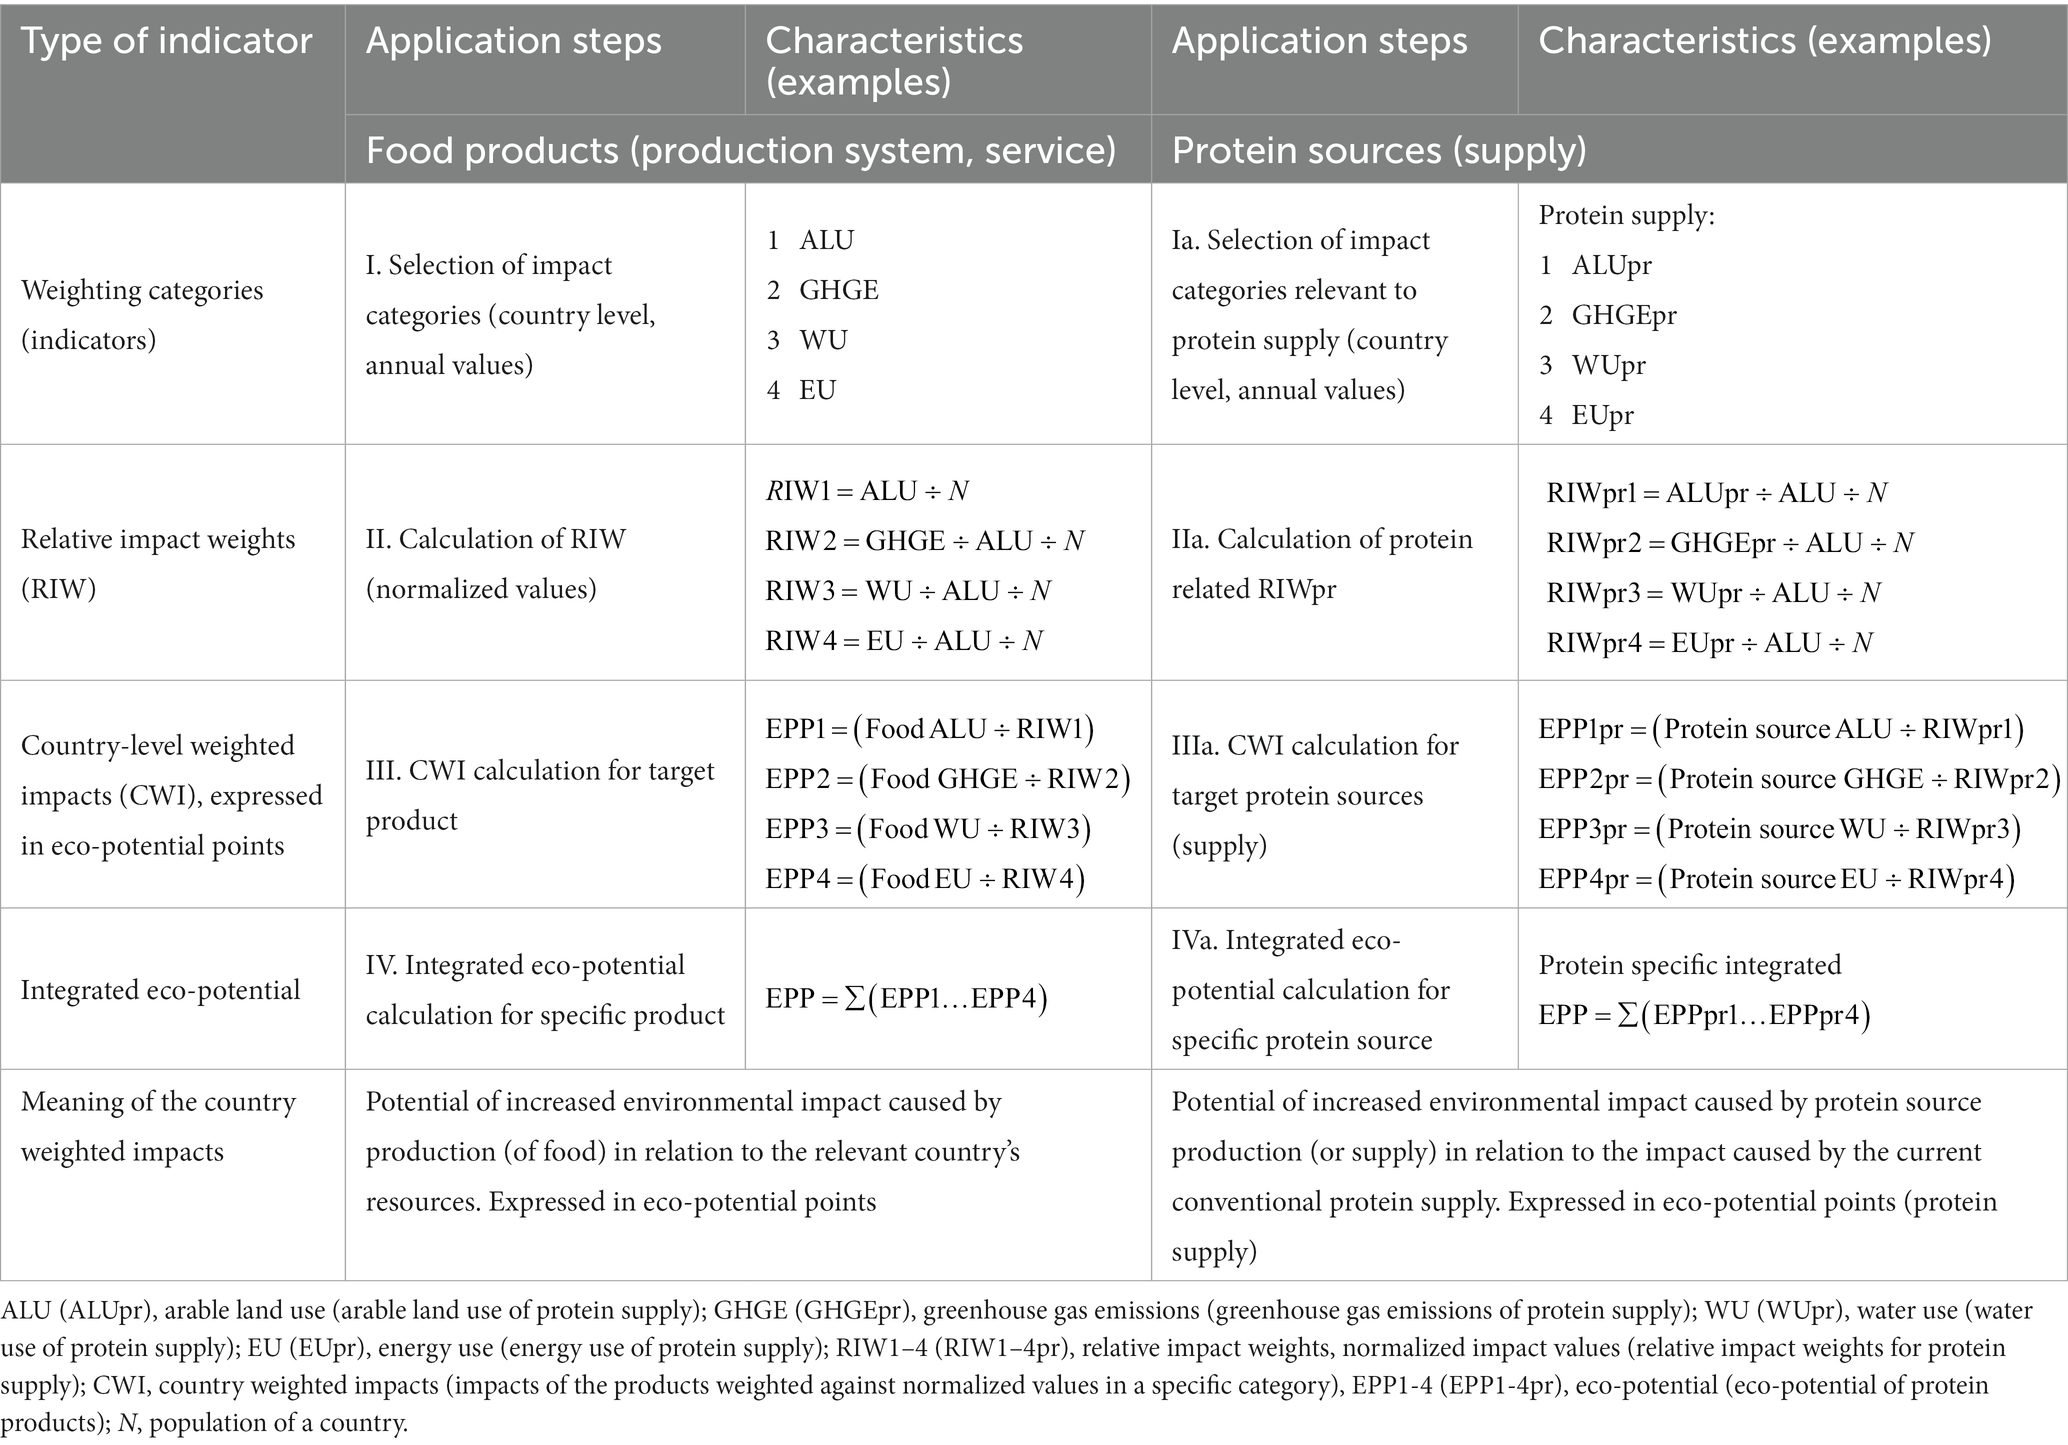
Table 2. Methodological framework for estimating the relative environmental impact and eco-potential of protein source production.
2.2 Data collection
First, data were collected for total GHGE, WU, EU, ALU and population for 148 countries (Supplementary Table S1). Data for resource use and GHGE were only available for 148 of the 195 countries. The weighting method is intended to be dynamic and should therefore reflect the variations in the annual environmental impacts and indicators used as weights. To determine the sensitivity of the proposed weights to annual variations, data were collected for from 2000 to 2016 (more recent data were not available). Data on the environmental impacts of conventional and alternative protein sources were also collected (Supplementary Table S1).
Data on environmental impact indicators of global warming, water use and land use for conventional protein sources were collected from Poore and Nemecek (2018), while data on the environmental impacts of alternative protein sources were collected from different sources (Supplementary Table S1). In addition, the original environmental impact data, expressed as total average yields for each product presented in the data source, expressed in terms of its 100 g nutritional units (NU), were converted to 1,000 g or 1 kg of protein per product. The calculations behind these conversions are presented in Supplementary Table S1. The data were converted to show the environmental impact of the global average yield of 1 kg of protein per product. The environmental impact values for conventional and alternative protein sources are presented below in Tables 2, 3.
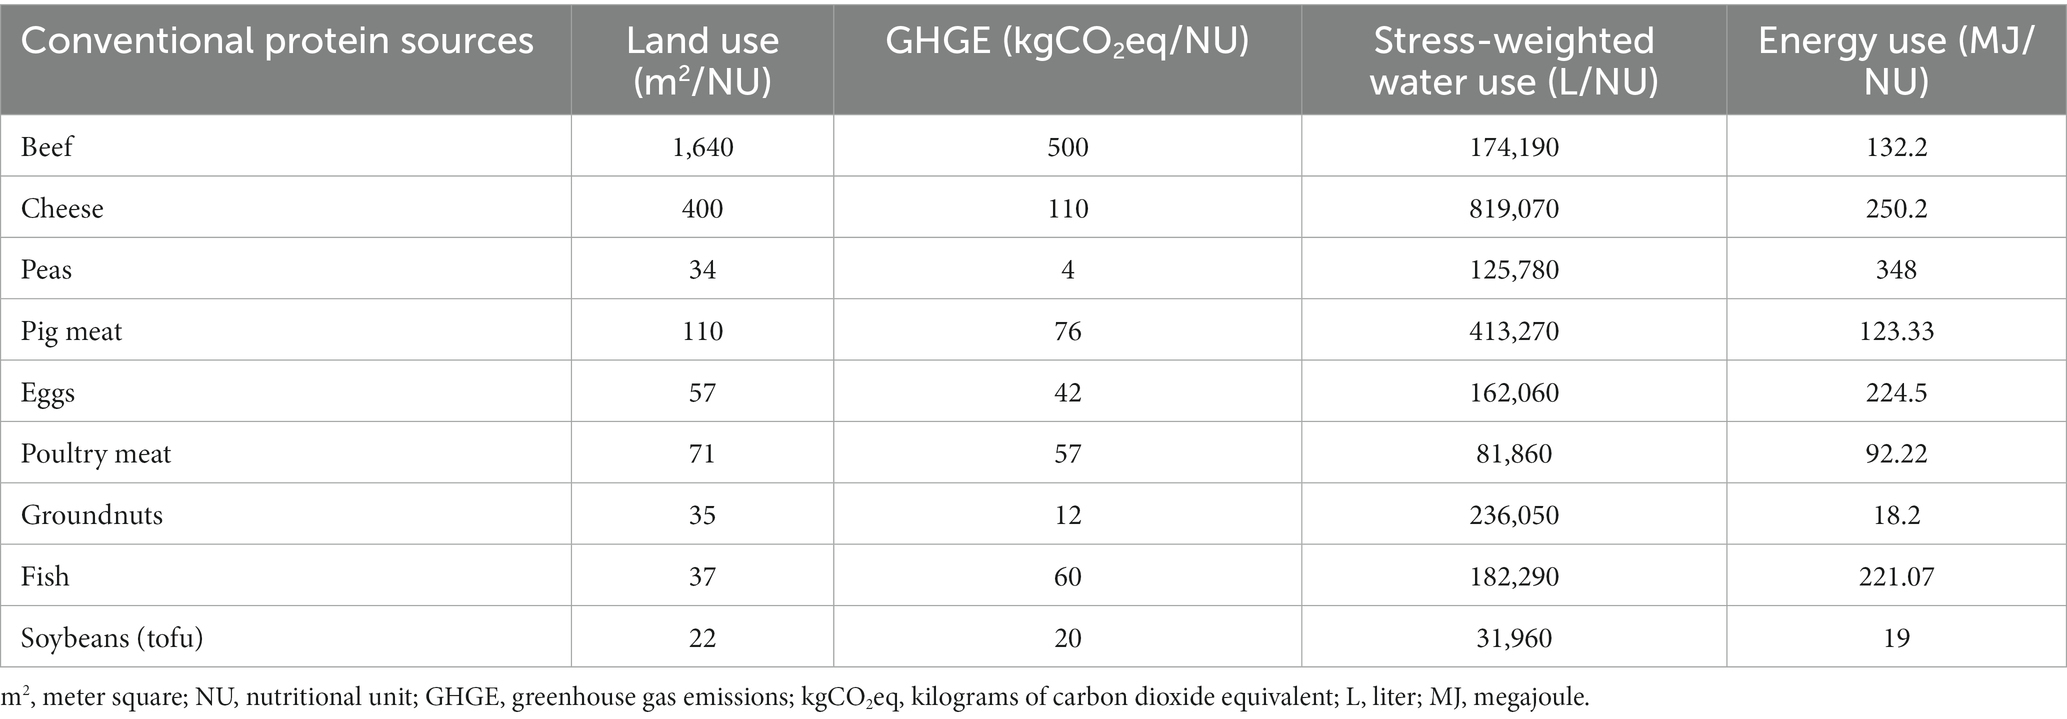
Table 3. Environmental impacts from conventional protein sources (Sources can be found in Supplementary Table S1).
3 Results
3.1 Analysis of relative impact weights
It’s clear from the results for the country specific RIWs, that they are dynamic over time. Many factors that change over time (e.g., GHGE, WU, ALU and EU) contribute to the temporal changes in the results. Only the factors GHGE, WU, EU, and ALU were selected because water-land-energy emissions are an important basis to reduce the GHGE from agricultural activities (Deng et al., 2021). For example, RIW2 for China reflects the dynamics associated with increasing GHG emissions and decreasing arable land (Figure 1). Similarly, the values of the other RIWs (1–4) depend on the initial impacts considered (arable land, GHGE, WU, and EU) and the values used for the normalization of the impacts (population and arable land). The dynamics of the indicated factors would also determine the dynamics of RIWs. RIWs calculated for 148 countries are included in Supplementary Table S1.
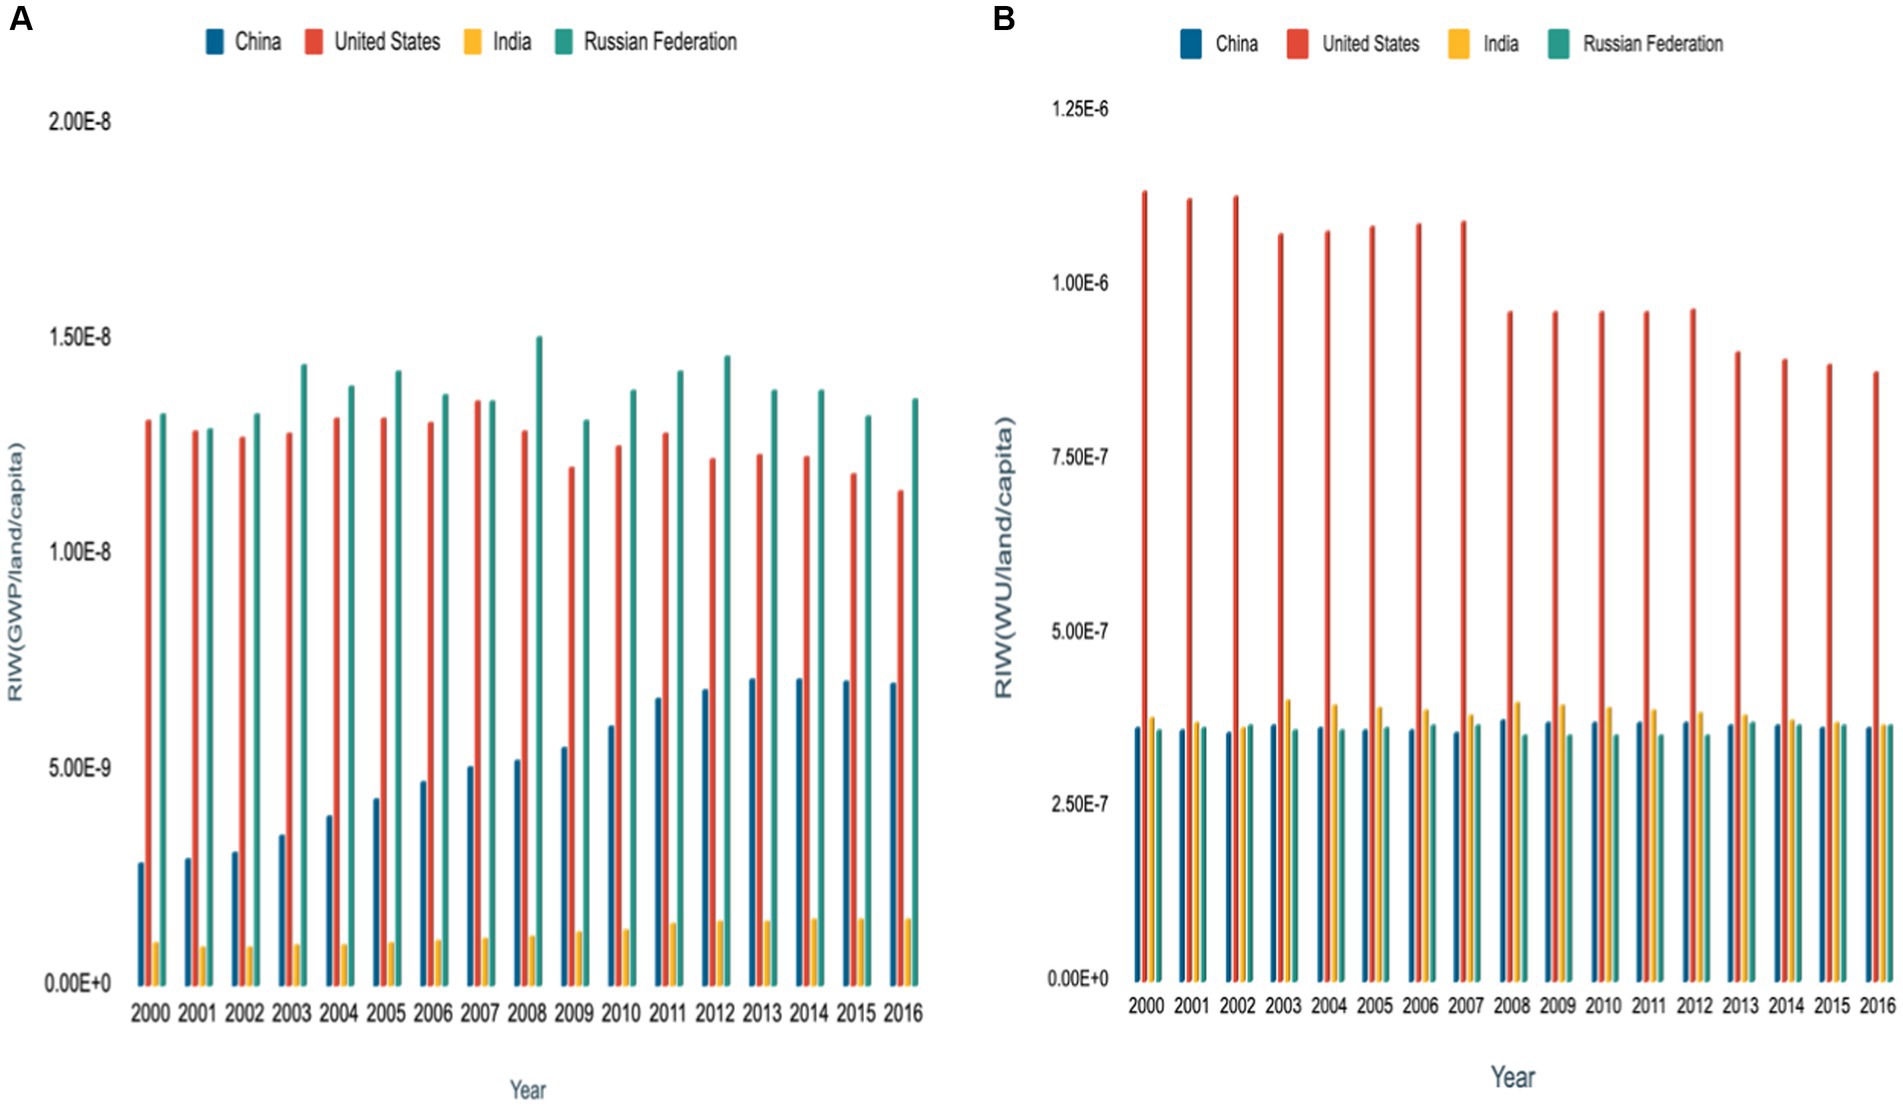
Figure 1. RIW2 and RIW3 relative impact weight based on (A) GHGE and (B) water use normalized by arable land and population for China, United States, India and Russian Federation (graphs has a factor of 10−9). RIW, relative impact weight; GHGE, greenhouse gas emissions.
3.2 Country-level weighted impact analysis for targeted products
Country weighted impacts represent the impact of a product in a selected impact category, weighted by the relevant relative impact weight (RIW). Temporal dynamic changes in the country weighted impacts (country-level eco-potential) are caused by the dynamic weights as discussed above (Figure 1), but also by changes in the impacts of the product in the same category (if the changes are known). By definition “temporal dynamic changes” means the changes in the relative impact weights (country’s eco-potential) triggered by the change in the country’s total environmental impacts throughout the year. The country weighted impact (CWI) from GHGE, based on 1 kg of beef production, is shown in Figure 2. The analysis shows that the eco-potential is highest in India and lowest in the United States and the Russian Federation. The values of the eco-potential for beef production is highest in India as the country’s relative impact weight (RIW) for GHGE is lowest (Figure 1) which means there is lesser burden on the environment when the country’s total GHGE were normalized by its arable land use and population. So, producing beef in the country would relatively have a lower additional impact when compared with the other chosen countries (China, United States, and Russia). Calculated CWIs for 148 countries are provided in Supplementary Table S1.
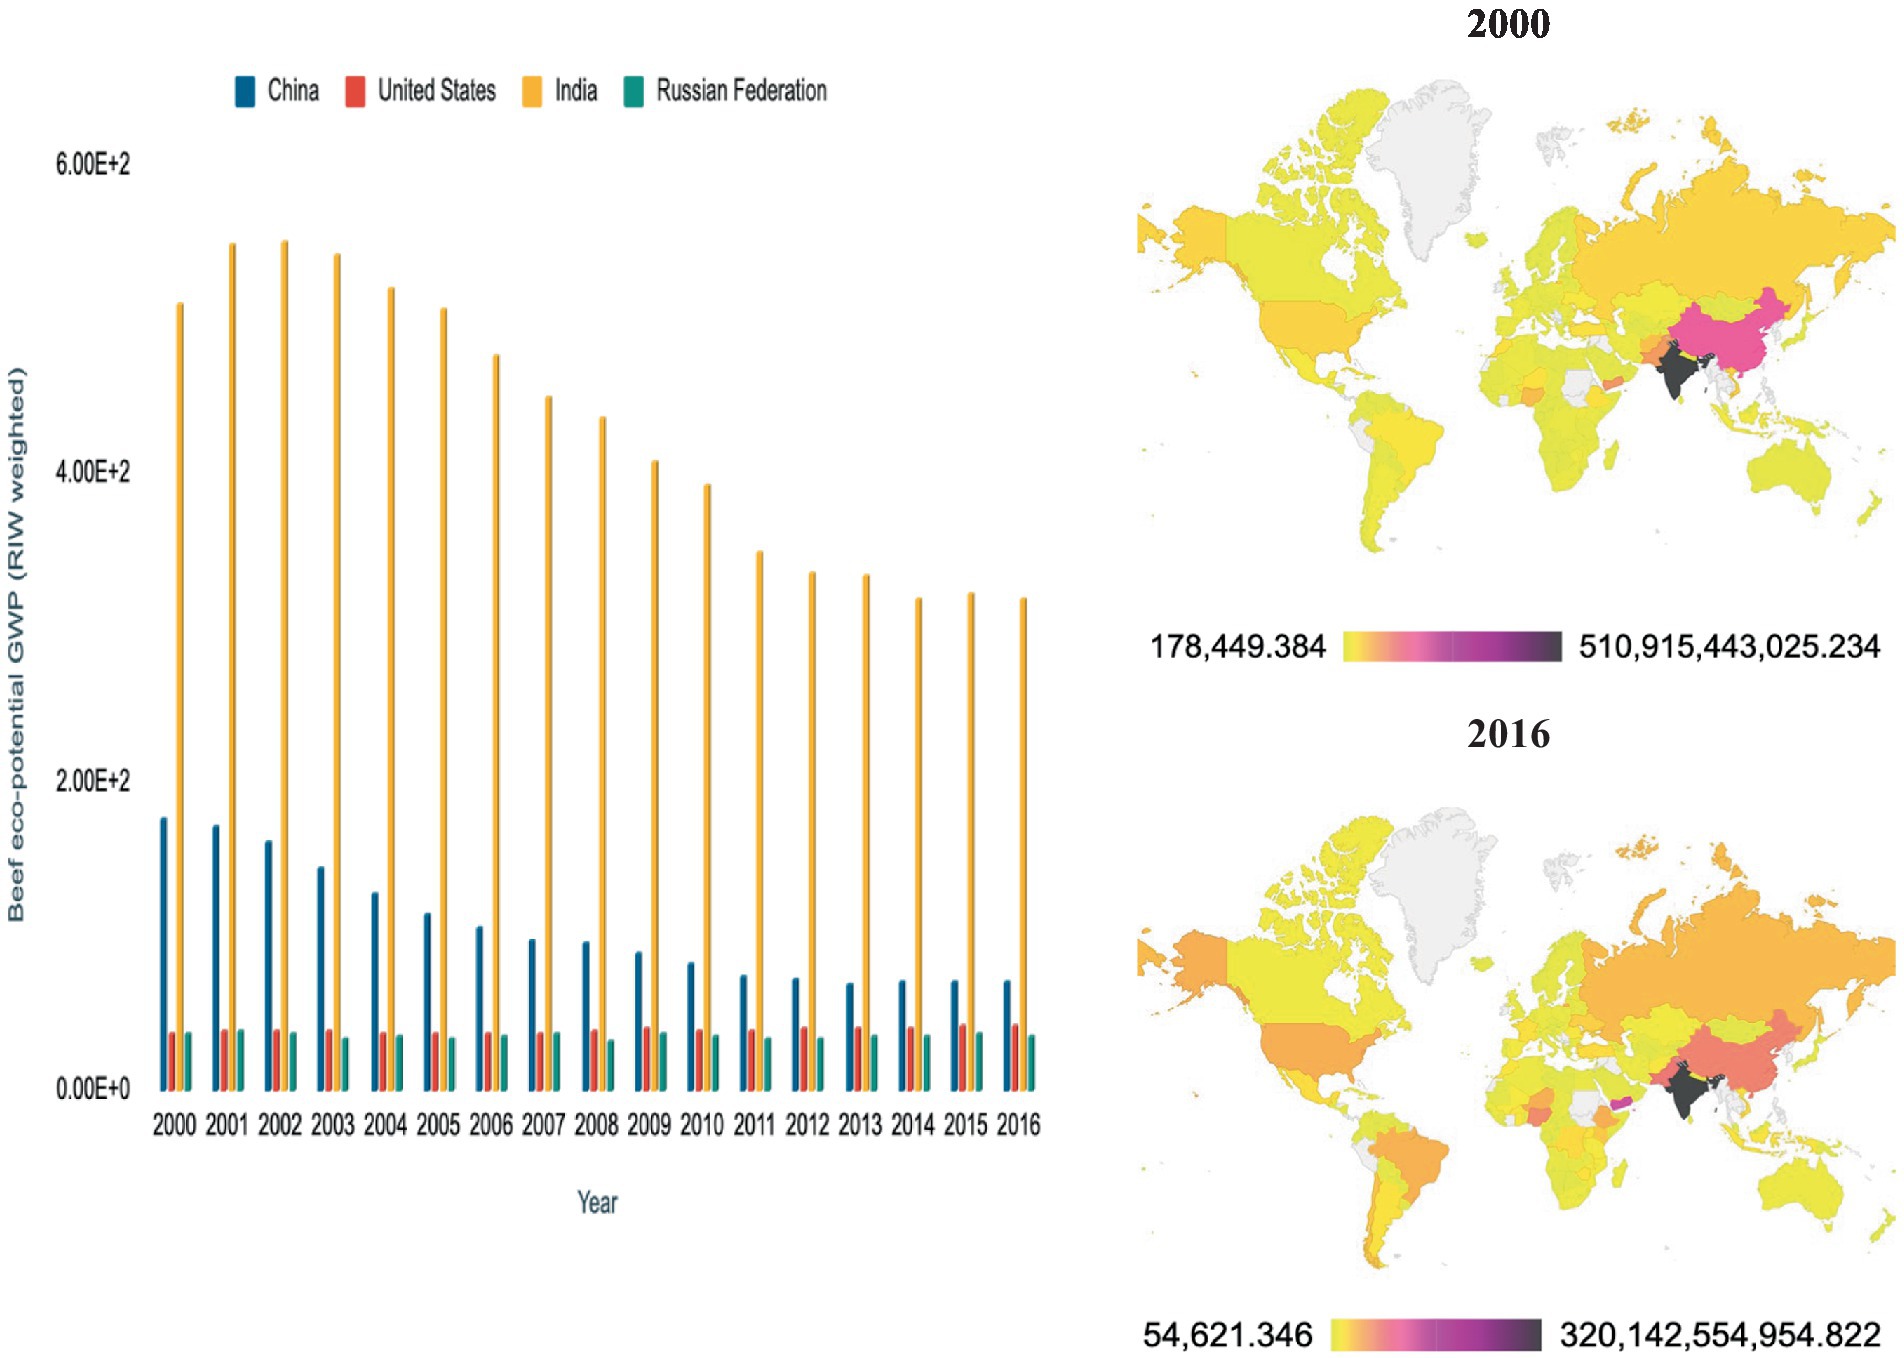
Figure 2. CWI weighted impact (GHGE based) for the production of 1 kg of beef (graph has a factor of 109). CWI, country-level weighted impact; GHGE, greenhouse gas emissions.
3.3 Integrated eco-potential analysis for conventional and alternative protein sources
The same normalization and weighting base defined for relative impact weights (RIW) and country weighted impacts (according to the methodological framework in Table 1) allows to obtain results in points that can be summarized to reflect the combined potential for the increased impact in the selected categories and for the country of interest. These combined eco-potential points obtained for food products or protein sources show the relative potential environmental impact of the production of the food products with respect to the country-specific situation, taking into account several impact categories (see Table 4).
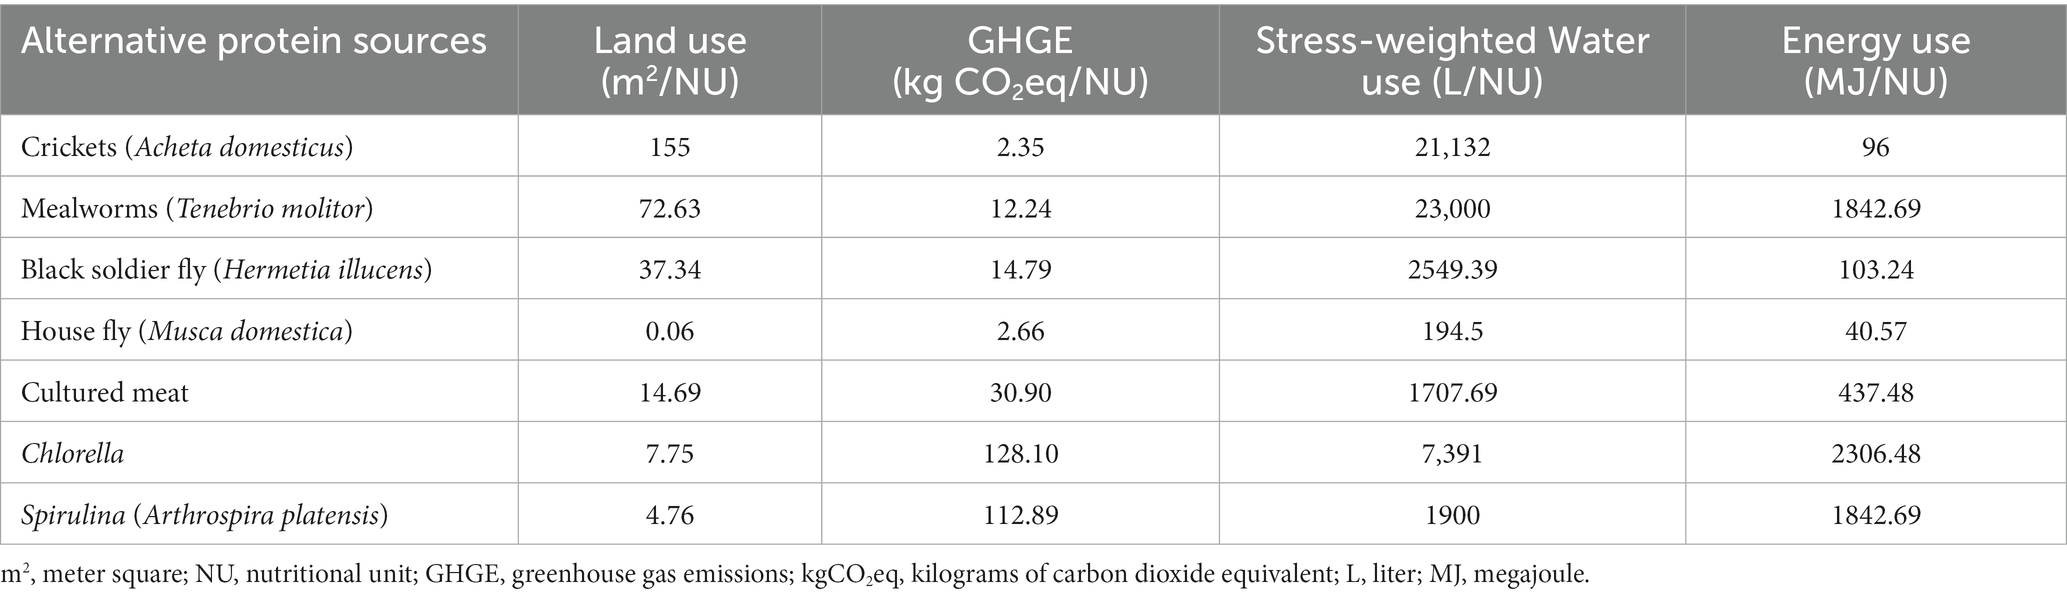
Table 4. Environmental impacts from alternative protein sources (Sources can be found in Supplementary Table S1).
The eco-potential of beef production (Figure 3) showed that, among comparable countries, India could be a representative country for beef production with the lowest incremental environmental impact. The incremental impact of beef production is much lower relative to the amount of resources normalized to population and available arable land (Figure 3). In contrast, the United States is the worst performing country, where the additional environmental impacts of one unit of beef production is associated with a higher additional environmental burden due to the country’s existing environmental impacts. Similar trends are observed for alternative protein products when the same weighting system is applied (Figure 4). Therefore, the application of higher integrated relative impact weights results in less beneficial eco-potential (potential for environmentally beneficial production of new products). The graphs for the other products can be found in Supplementary Table S1.
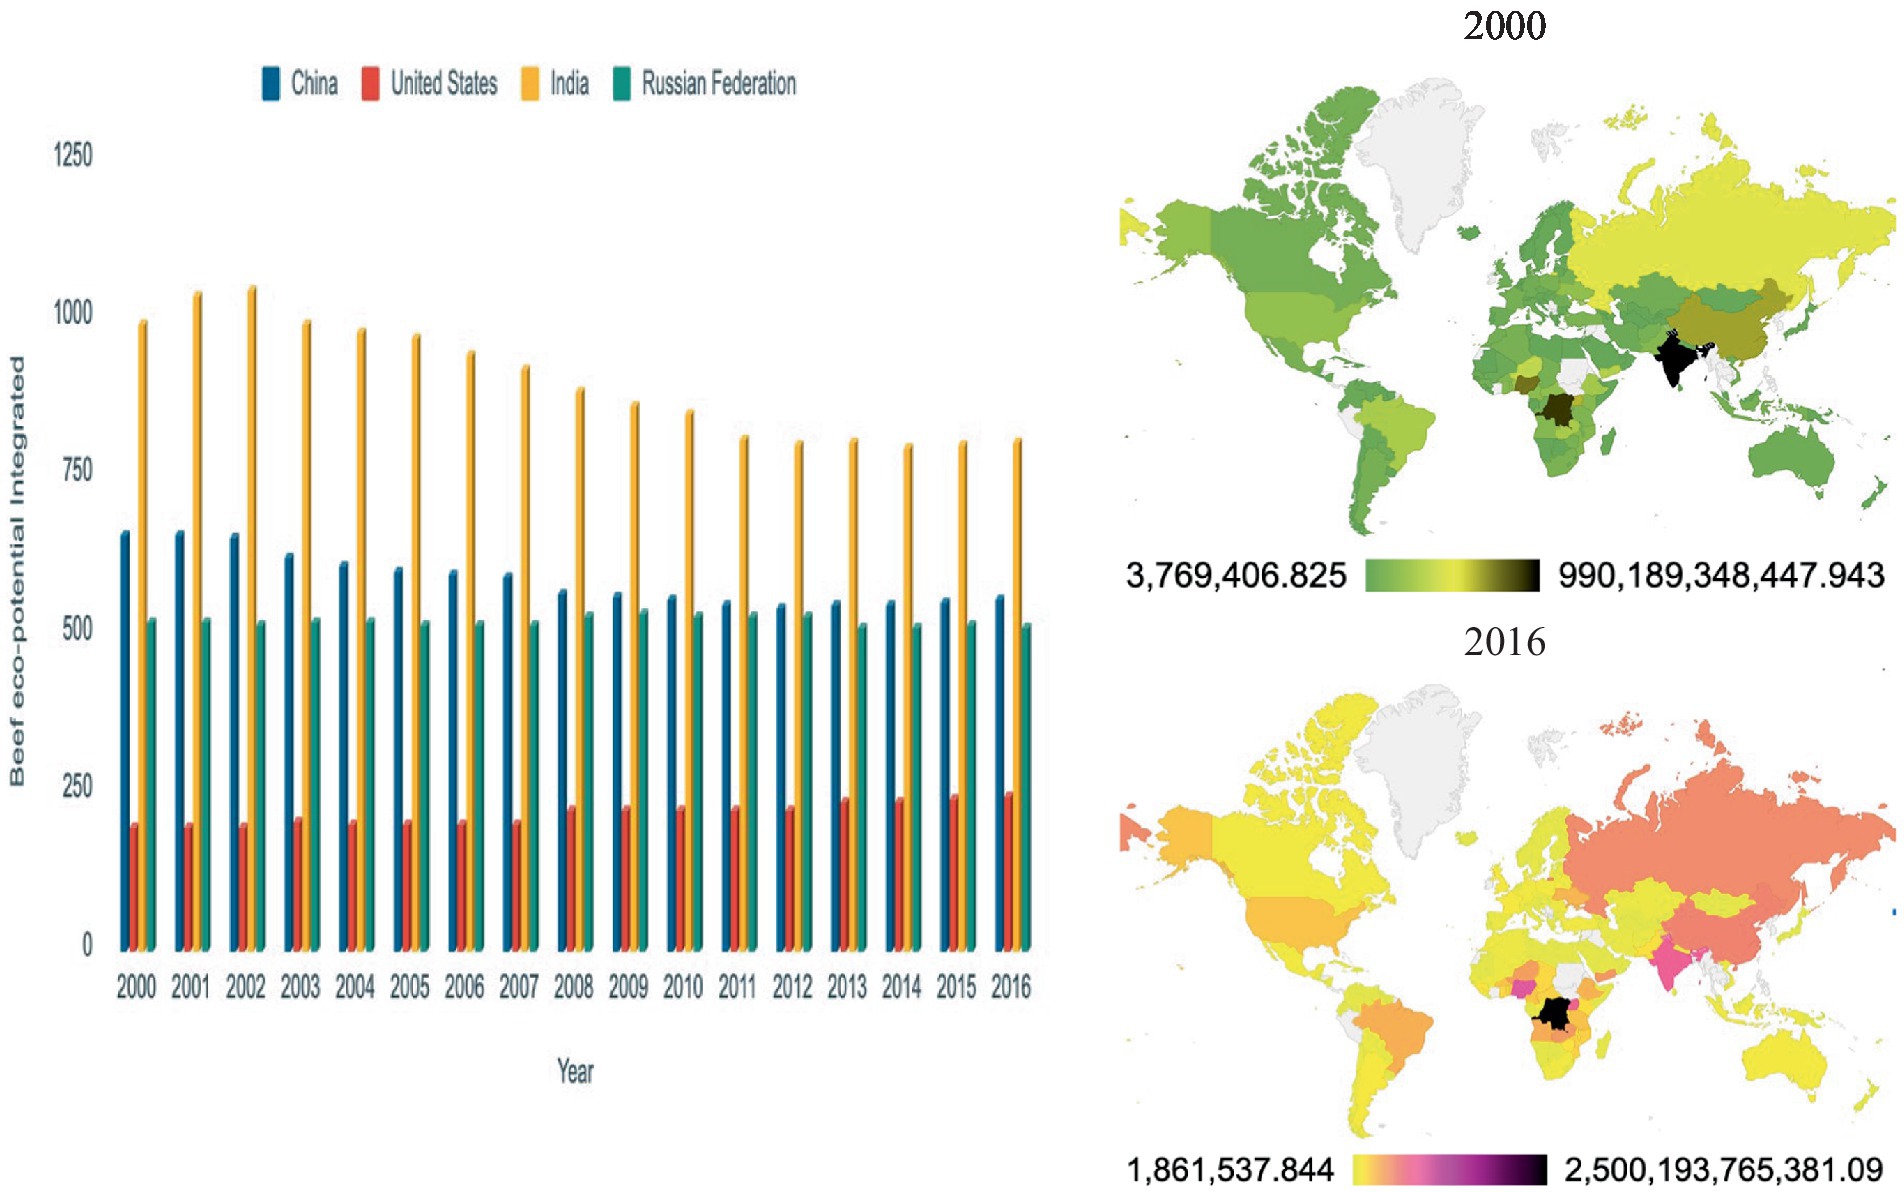
Figure 3. Eco-potential of beef production, values expressed in eco-potential points, values for impact of beef production are from Nemecek et al. (2016) and University of Warwick (2013) (graph has a factor of 109).
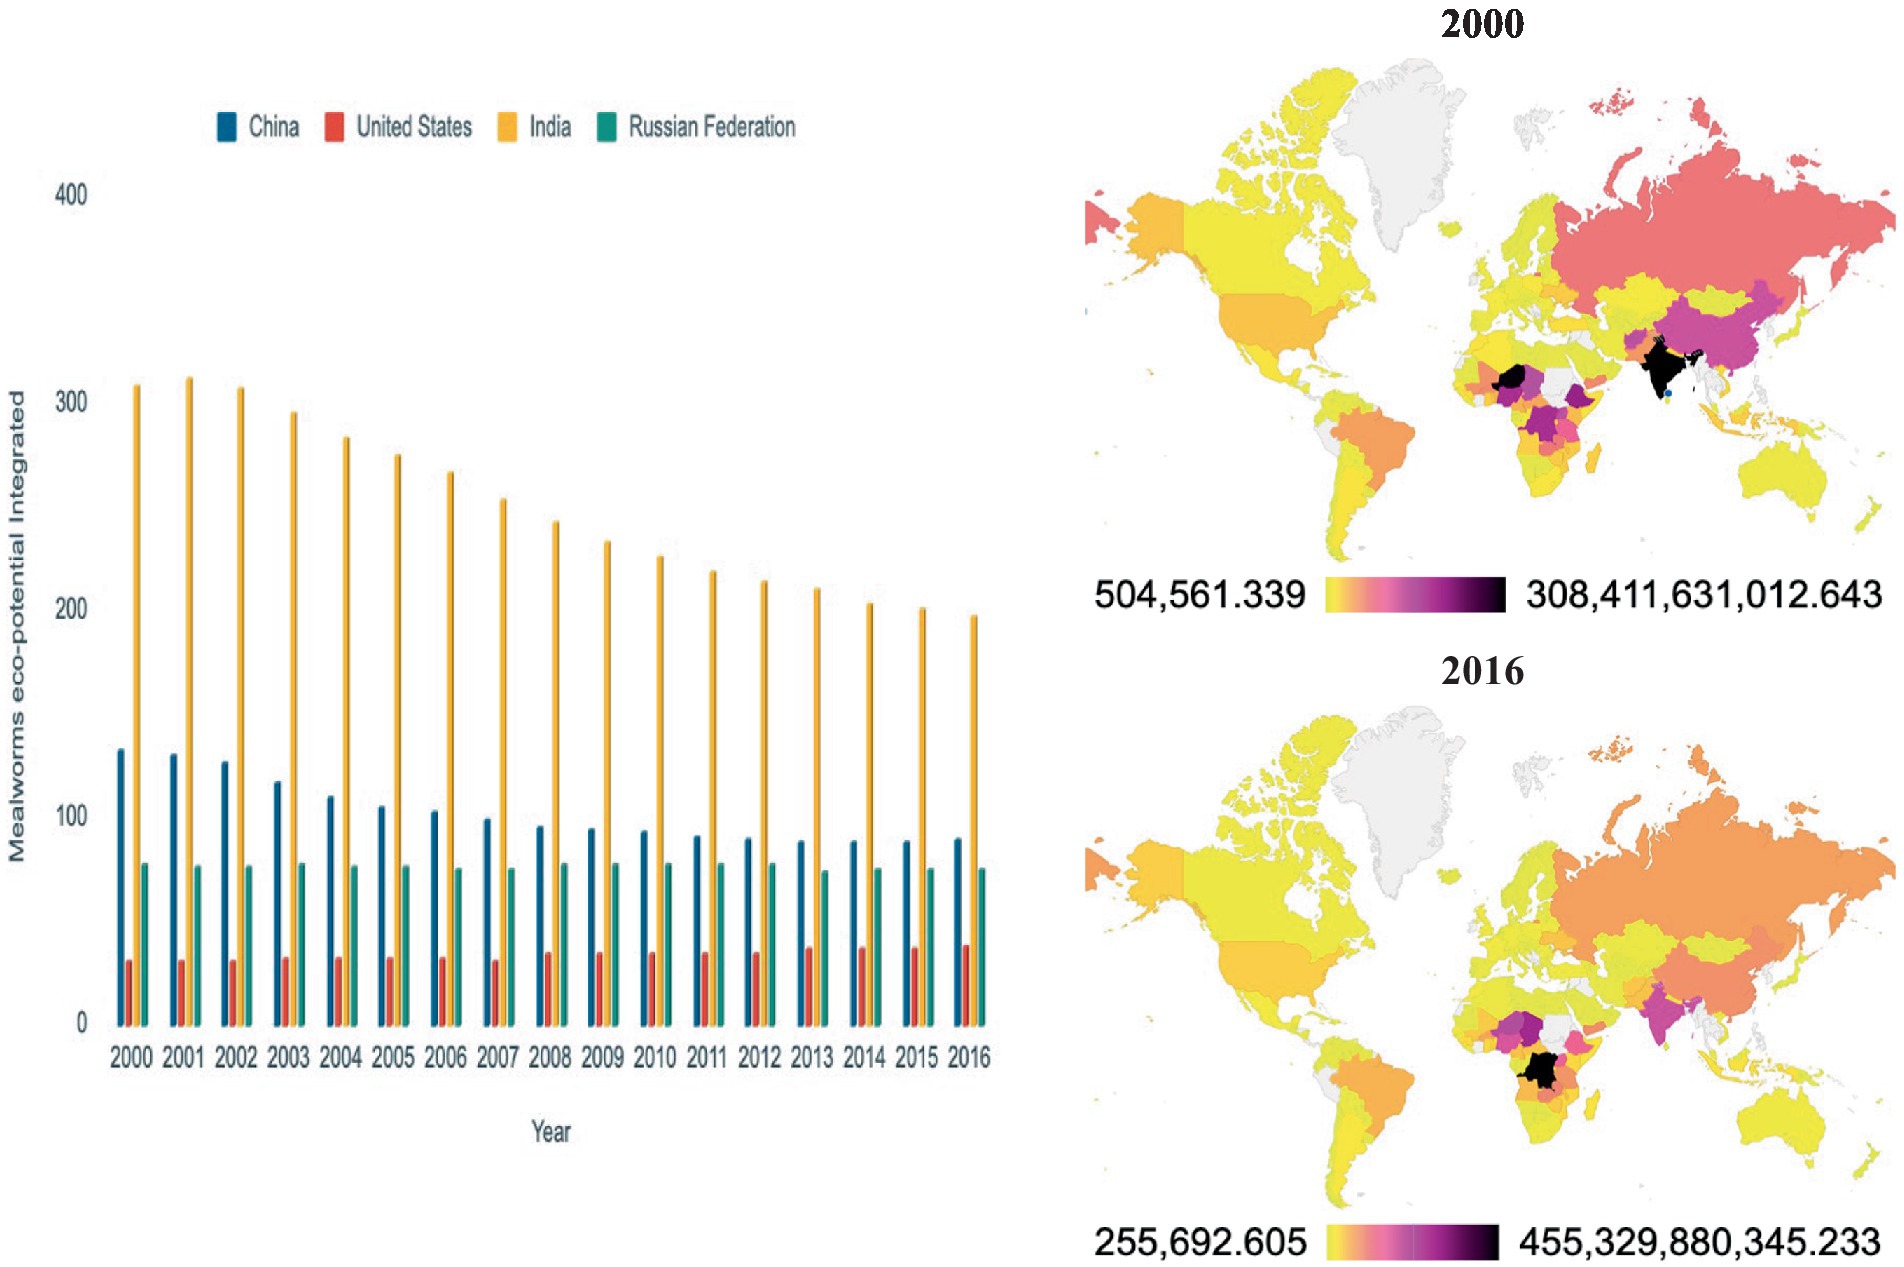
Figure 4. Eco-potential of Tenebrio molitor (mealworm) production, values expressed in eco-potential points, values for impact of mealworm production are from Parodi et al. (2018) and Miglietta et al. (2015) (graph has a factor of 109).
3.4 Relative impact weight analysis based on protein supply
the same methodology was used to calculate the RIWs. The main difference here is that it focuses only on the impacts of the level of protein supplies in the different countries. The results for the country specific RIWs show that they are dynamic over time. The average environmental impacts values of the selected alternative protein sources were calculated and multiplied by the amount of protein supplies in the countries. The average environmental impacts for the four environmental impact indicators of the protein supplies (g/capita/year) in the countries were divided by the arable land use per country. The results for the RIW of global warming according to the protein supplies from alternative protein sources in Figure 5, show that China and Russia have the highest weights for total GHGE according to protein supplies from alternative protein sources. Overall, the results show that the RIW for GHGE or resource use will be higher in those countries where the relative emissions or resource use is comparatively higher than their arable land use and population and vice versa.
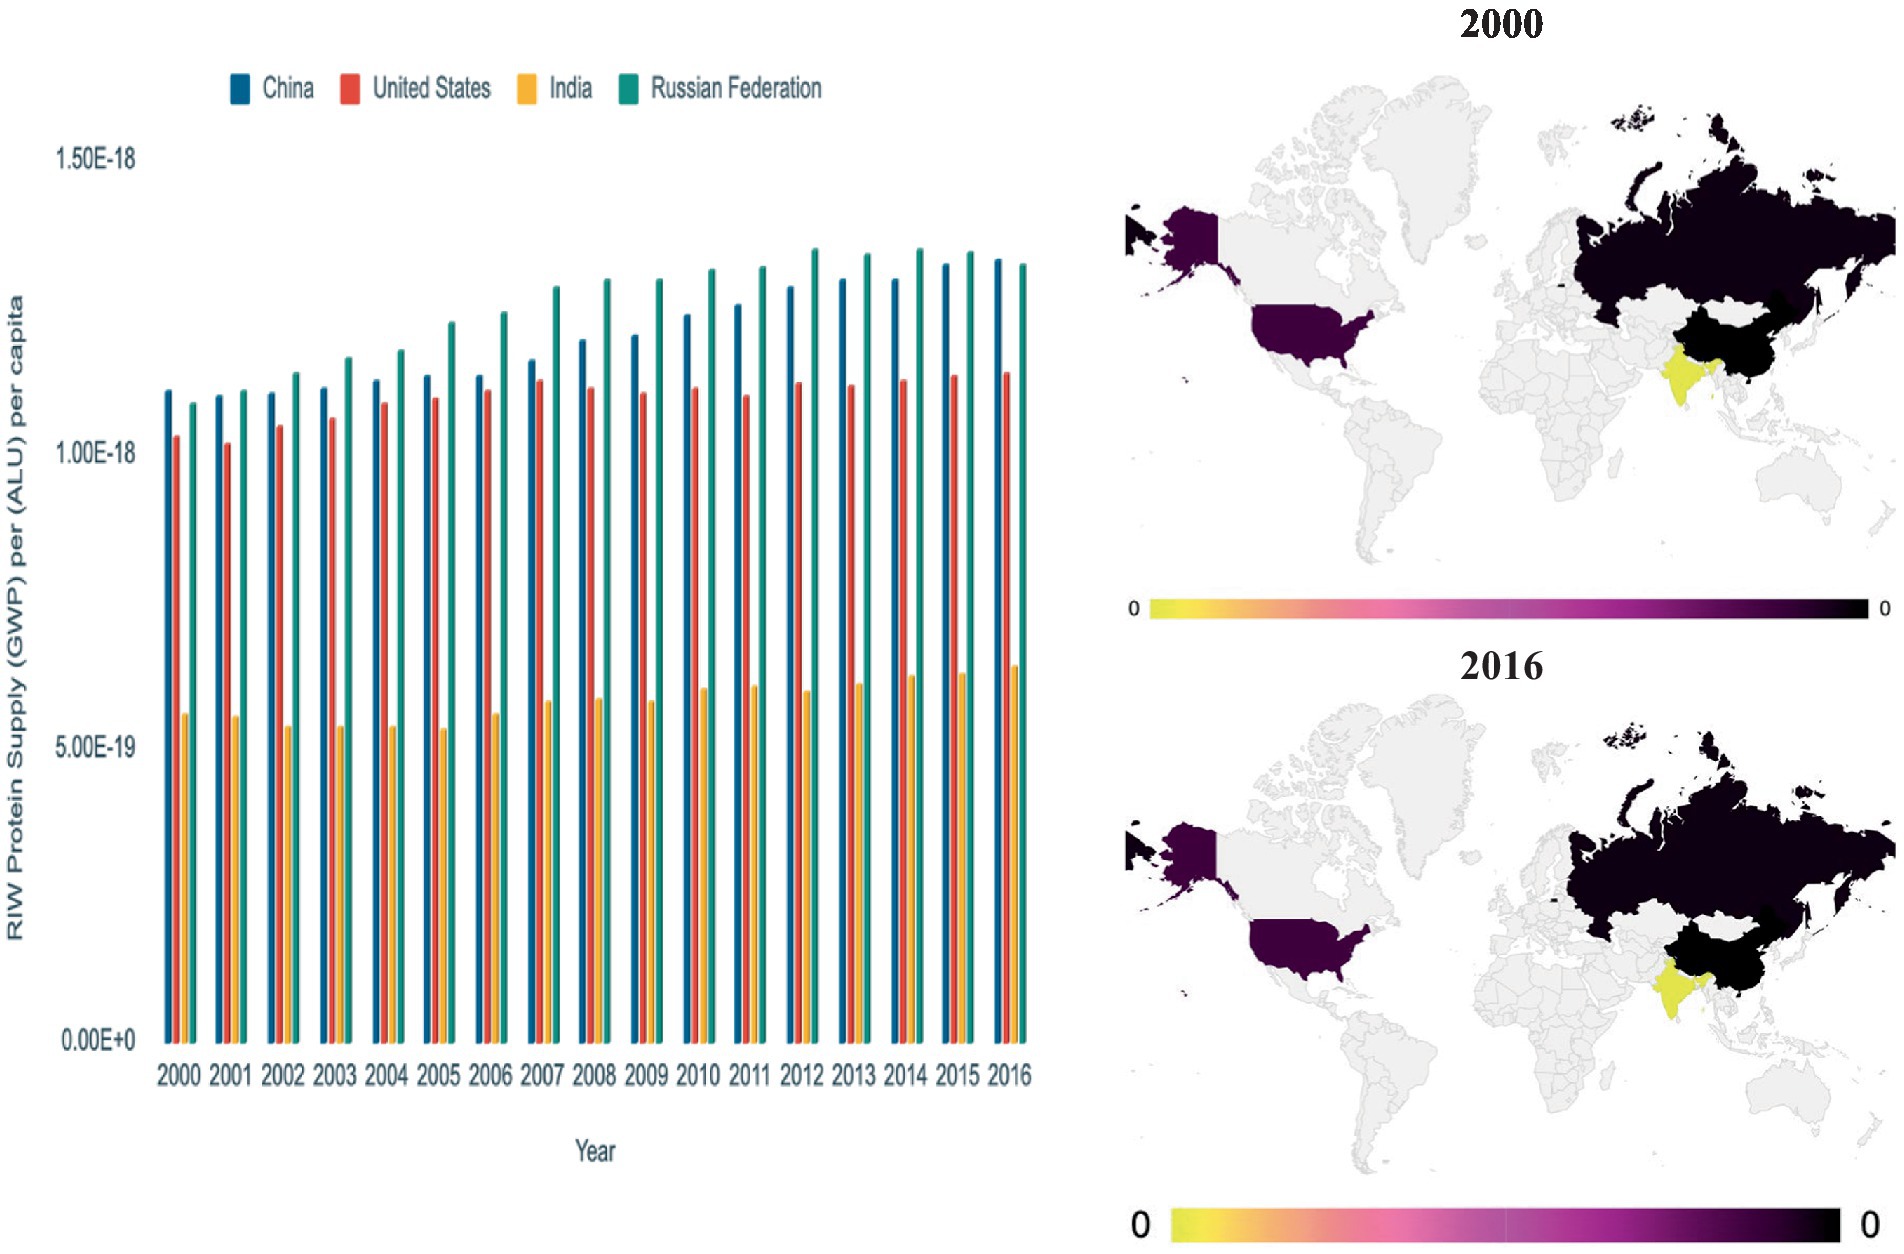
Figure 5. Relative impact weight (RIW)—protein supply (alternative protein sources) based on GHGE normalized to arable land and population (maps and graph has a factor of 10−9). RIW, relative impact weight; GHGE, greenhouse gas emissions.
3.5 Country-level weighted impact analysis of protein supply for target products
As calculated above, the country weighted impacts represent the impact of a product in a selected impact category, weighted by the relative impact weight (RIW). Dynamic changes over time in the country weighted impacts (country-level eco-potential) are caused by the dynamic weights as discussed above (Figure 5). In addition, changes in protein supply in countries over time also affect the eco-potential of the target product. The target product used as an example shown in Figure 6 is Tenebrio molitor (mealworm). The results show that the production of 1 kg of protein from mealworm has the highest GHG eco-potential in India compared to the other countries. A higher eco-potential indicates the highest potential for lower additional GHGE weighted by arable land per capita. Country-level weighted impacts (CWI) of a product indicates its eco-potential in a particular environmental impact category. The higher bars in Figure 6. Indicate that there is a higher probability of lower additional environmental impacts when compared with other countries.
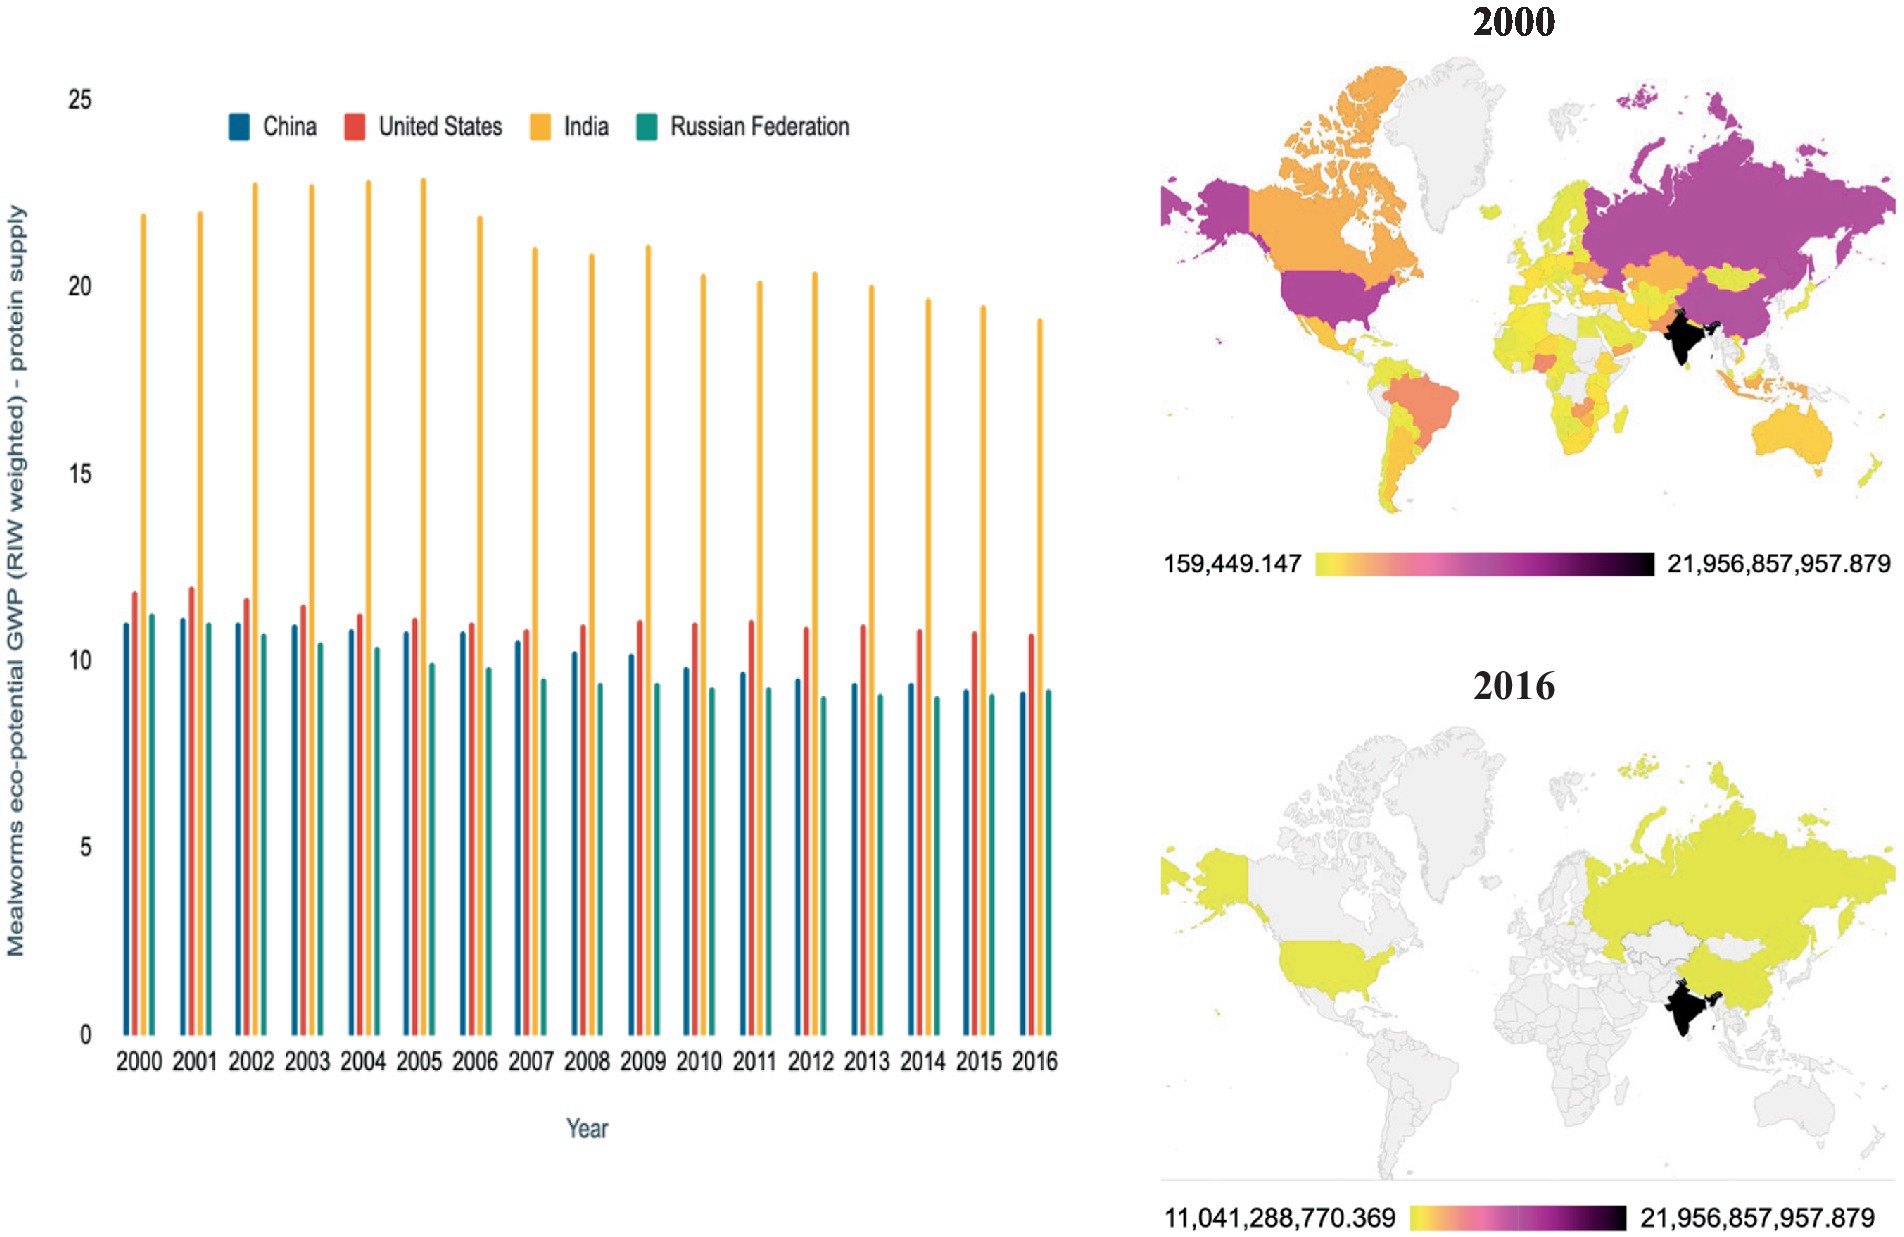
Figure 6. Country-level Weighted Impact CWI (GHGE based) by protein supplies to produce 1 kg of Tenebrio molitor (mealworm), (graph has a factor of 109). CWI, country weighted impact; GHGE, greenhouse gas emissions.
3.6 Analysis of integrated eco-potential of alternative protein sources according to country-specific protein supplies
The same methodology (according to the methodological framework in Table 1) as discussed above is applied here to obtain the combined eco-potential of the target product shown in Figure 7. The results show that the country weighted impacts (country-level eco-potential) (GHGE, EU, ALU and WU) from the total protein production of the alternative protein sources for mealworm alone, when integrated together, give India the highest eco-potential points when compared to other countries. The eco-potential of the mealworm alternative protein source showed that India could again be a representative country for the mealworm production, which would result in the lowest additional environmental impact. The additional impact of mealworm production will be much lower relative to the amount of resources normalized to population and available arable land (Figure 7). In contrast, Russia is the worst performing country, where the additional environmental impacts of one unit of mealworm production is associated with a higher additional environmental burden due to the existing environmental impacts from protein supply in the country. Graphs for the other products are presented in Supplementary Table S2.
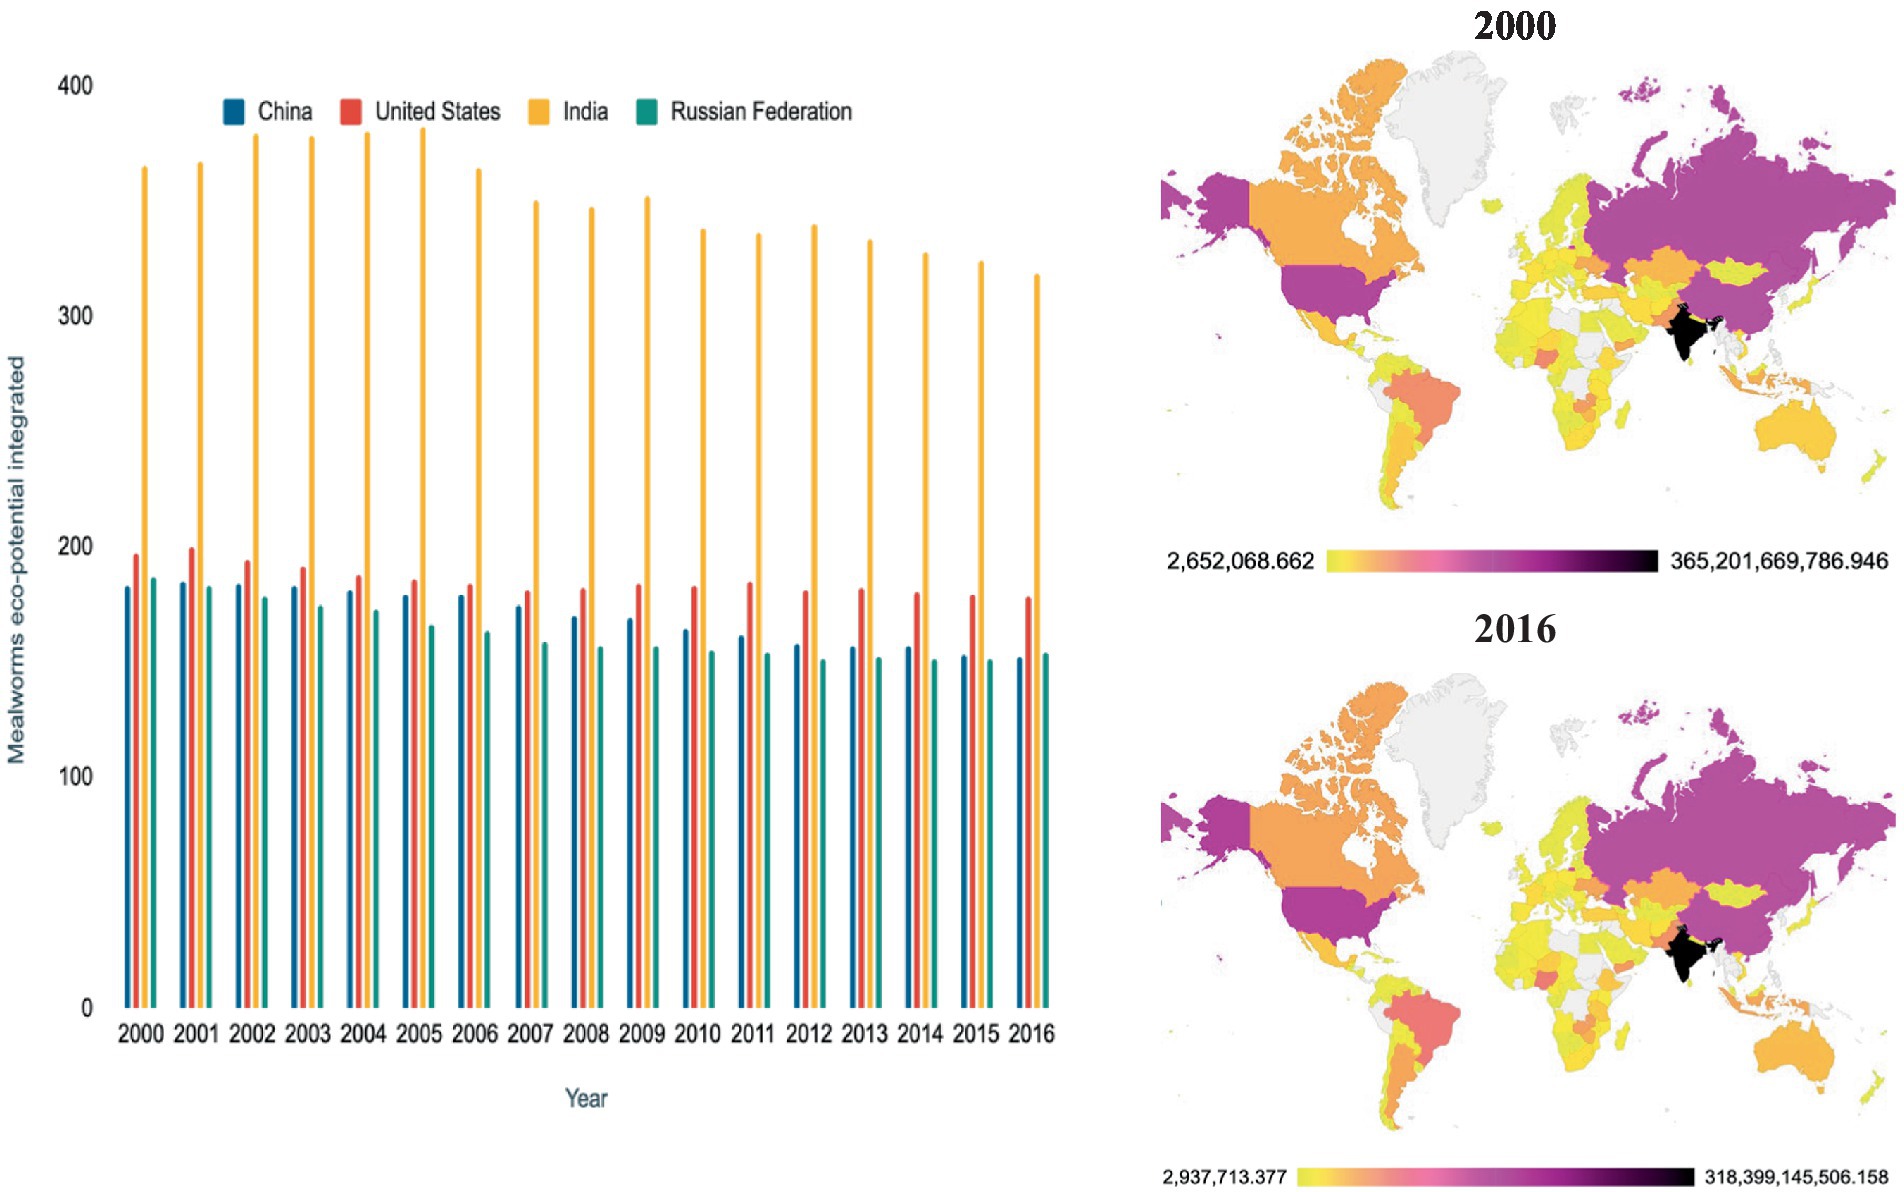
Figure 7. Eco-potential of T. molitor (mealworm) production according to protein supplies, values expressed in eco-potential points, values for the impact of T. molitor production are from Parodi et al. (2018) and Miglietta et al. (2015) (graph has a factor of 109).
3.7 Sensitivity analysis
CWIs for GWP, WU, EU and ALU are also compared with each other in order to show the dynamics between them. For example, below in Figure 8, CWIs (1–4) for 1 kg of beef are compared with each other. Analysis of the compared results shows differences in the range of eco-potential points between the selected environmental impact categories. The CWI (GWP) for 1 kg of beef is highest in India while the CWI (WU) is the second highest. CWI (EU and LU) shows the lowest eco-potential points. This shows that CWI (GWP) has a higher contribution to the cumulated eco-potential point when aggregated together with CWI (WU, EU, and LU). This means that the GWP of 1 kg of beef, normalized for arable land use and population, has the lowest environmental impact contribution when compared with water use, energy use and land use. While the CWI (WU) for 1 kg of beef is the highest in China, the United States and the Russian Federation and the CWI (GWP) is the second highest, this shows that the CWI (WU) has the highest contribution to the cumulated eco-potential point when aggregated with the CWI (GWP, EU, and ALU). This means that WU normalized by arable land use and population from 1 kg of beef has the lowest environmental impact contribution in China, the United States and the Russian Federation while CWI (GWP) has the second lowest environmental impact contribution. CWI (EU and ALU) had the lowest points in all countries, meaning that they have the most negative environmental impacts. When all the points are added up to cumulative eco-potential point, India shows the highest due to the higher contribution of CWI (GWP and WU) compared to other countries (Figure 9).
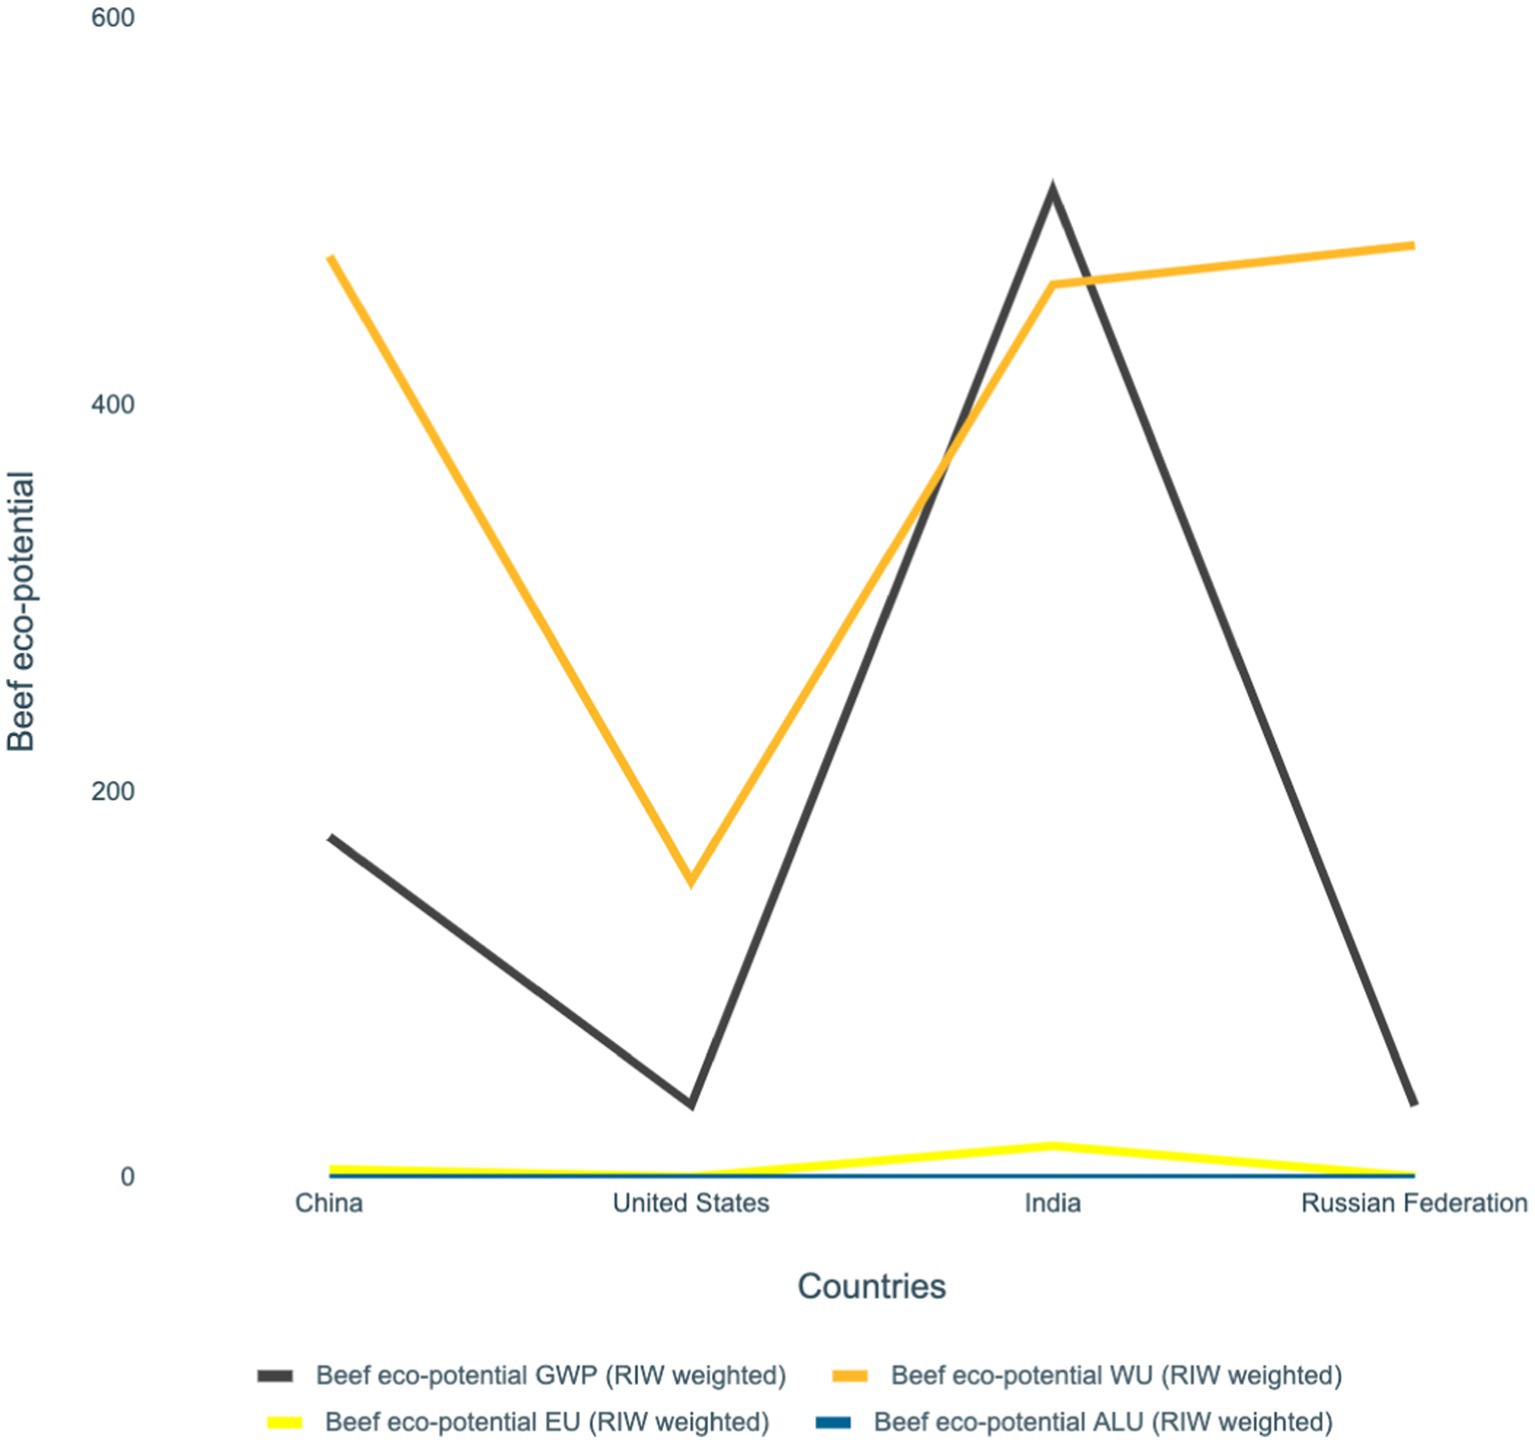
Figure 8. CWI (1–4) relative impact weights comparison for beef with considered parameters of GWP, WU, EU, and ALU (graph has a factor of 109). RIW, relative impact weight; GWP, global warming potential; WU, water use; EU, energy use; ALU, arable land use.
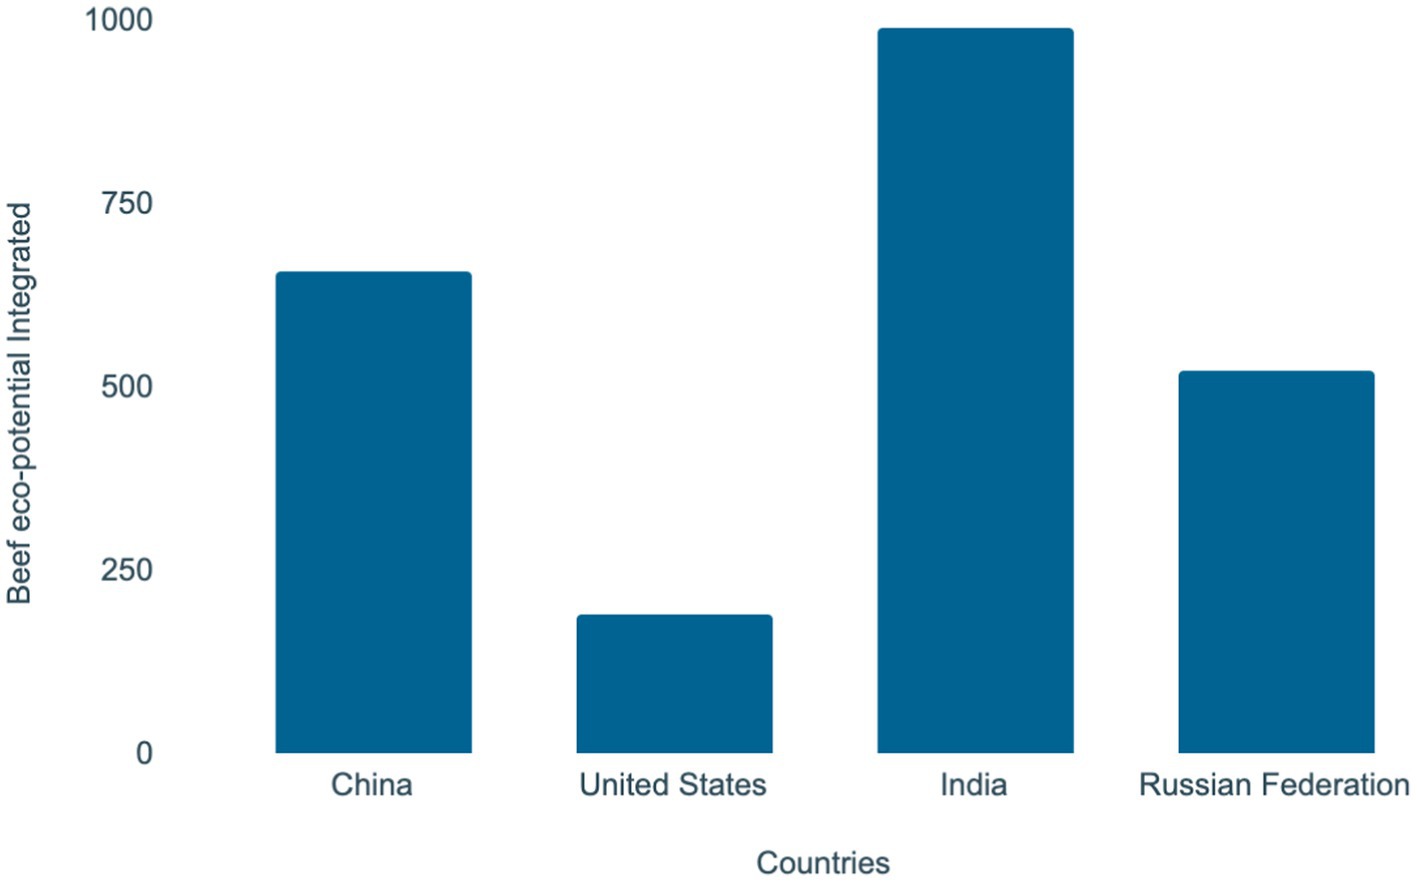
Figure 9. Cumulated beef eco potential points for the year 2000 (graph has a factor of 109).
4 Discussions
4.1 Limitations and assumptions
The results of this study for the Country Weighted Impacts (CWI) of conventional protein sources for the environmental impact categories of GWP, WU and ALU were compared with unweighted environmental impact values from the scientific literature (Poore and Nemecek, 2018). Comparisons were possible for the three environmental impact categories of GWP, WU and ALU. However, comparisons were not possible for all countries and energy use impact category due to a lack of data in the literature.
CWI values are dynamic and change annually. For the analysis of comparisons between CWI derived from conventional protein sources and their country-level absolute environmental impacts, an average CWI value from 2000 to 2016 was taken for each country, and the average value for the country-level absolute environmental impacts were taken from scientific literature.
It is important to note that the CWI indicates the eco-potential for the additional production of a unit in a particular impact category. Therefore, higher CWI values represent the better option for the production with a lower relative impact than the option with a lower CWI. The analysis shows that while the absolute emissions or resource use of the product may be higher in a given country, the CWI may be lower in the same country.
The analysis of the absolute impact values for the production of different protein sources and their weighted values showed that they vary. For example, based on the LCA results for GHGE (kgCO2eq) from soybean, India has the highest GHGE while the GHGE-related CWI is the highest in India compared to other countries. Therefore, the values are not contradictory, but rather complementary, the absolute values indicate the high absolute negative impact of production while the proposed CWI indicates a high relative eco-potential of production compared to existing resources and emissions (probability of lower relative impacts).
If we consider soybean production in Canada (which has the lowest GHGE per FU among compared countries), then the absolute impact of tofu production is low (could be related to the geographical suitability and advances in production technologies). At the same time, Canada’s CWI is low, indicating a low GHG related eco-potential. This implies that an additional unit of production would result in a relatively higher additional environmental burden in Canada. However, not all the impacts and their CWI are related in the same way. This shows that normalizing the impact values to the available resources and using the normalized values as weights it is possible to define the country-level eco-potential of a product that is not related to the absolute impact value of production.
4.2 Recommendations for enhanced application of LCA results
The proposed method for estimating the eco-potential of new products could be related to the eco-efficiency methods. While the concept of eco-efficiency reflects the current value of a product in relation to its function, it does not have a long-term strategy that can deal with rebound effects. Therefore, an increase in eco-efficiency may lead to an increase of consumption (rebound effect) and therefore a decrease in overall sustainability (Bjørn and Hauschild, 2012). Eco-efficiency focuses only on the resource consumption and waste emissions related to the current state of production, and rarely on the state required for long-term sustainability (Bjørn and Hauschild, 2012). Production may be considered eco-efficient in terms of the functional unit, but its relative impact in terms of the overall impact on the environment and available resources may be quite “costly.”
The proposed eco-potential weighting system offers the possibility of an additional indicator that defines the relationship between environmental impacts and the available capacity of the environment at the country level in a dynamic approach. It is not intended to replace the environmental impacts of midpoint impact categories, nor is it intended to act as a substitute for eco-efficiency indicators.
In our methodology, we are not mentioning that there is an additional burden due to the country’s existing environmental impacts. We normalize our results available arable land use per capita. So, the impact weights for country’s depend on various factors, not just the total emissions. When a country’s environmental impacts are higher than its current arable land use per capita, the burden shifts towards the impacts from food production/consumption. Even if a new product has a small impact, it adds to the burden per person’s available land. This means more land will be needed with additional production. This burden shift can happen within a country, not to other countries.
Our approach aims to provide complementary measurements that include the relationship with the country’s environment. For example, the production of a protein source is not beneficial to the ecosystem components, as all human activities are inherently harmful to the environment (considering only absolute impact values). On the other hand, country weighted eco-potential indicators can help to reduce environmental burden by shifting the perspective from product-based sustainability to ecological sustainability, thus contributing to a reduction in impacts relative to population, area and country-level impacts in a relevant category. In addition, countries with higher emissions and resource use defined per capita and arable land use can significantly reduce their environmental footprint by adopting alternative production systems (e.g., alternative proteins).
This study proposes a new methodology for calculating the eco-potential of alternative protein sources taking into account the environmental pillar of sustainability. Eco-potential is defined in the study as an additional environmental impact expressed relative to the existing environmental impact and the country’s environmental capacity. This methodology helps to identify the relative environmental impacts of alternative protein sources in different countries, according to the country’s total emissions and resource use (GHGE, WU, EU and ALU) per capita and on an annual basis.
The eco-potential scores for alternative protein sources varied over time and space. As the values for the relative impact weight (RIWs) based on GHGE normalized by population and arable land increased over time (2000–2016), so did the additional environmental impact burden of the alternative protein sources food products (expressed as CWI for 1 kg of beef) in Figure 2. This indicates the potential for the application of an eco-potential assessment methodology based on regional normalization and weighting factors. Comparison of the results with the scientific literature revealed inconsistencies in the representation of the results, which can be explained by the different assessment approaches.
Future studies should consider implementing the proposed weighting system for policy and decision makers, building on the concept of relative environmental sustainability (Bjørn and Hauschild, 2012). The eco-potential points obtained for the chosen protein sources could also further be used by the policy and decision makers when considering its production in a specific country based on its relative environmental impacts.
5 Conclusion
Overall, the proposed relative impact weights (RIW—specific category impact values normalized to population and available arable land area) could be used as indicators of the current state of environmental impact of a country in a specific impact category, eco-potential therefore represents a regionally relevant impact value of an individual product (whole production system) weighted by the existing level of impact and the regional carrying capacity.
Thus, depending on their relative sustainability in different countries, the developed eco-potential scores for food products can be linked to an overall goal of a state of absolute sustainability by maximizing benefits to ecological systems rather than focusing solely on the product-based eco-efficiency of reducing the damage. Producers should consider the relative environmental impacts of the available capacity of the productive land (arable land use) when considering the production of food products in a country. Considering both the absolute (food product’s individual environmental impacts in relation to their production/consumption) and relative environmental sustainability (impacts in relation to its regional environmental conditions) or eco-potentiality can contribute to a more sustainable food system.
Data availability statement
The original contributions presented in the study are included in the article/Supplementary material, further inquiries can be directed to the corresponding author.
Author contributions
AF: Data curation, Investigation, Methodology, Writing – original draft. SG: Methodology, Supervision, Writing – review & editing. SS: Conceptualization, Methodology, Supervision, Writing – review & editing.
Funding
The author(s) declare that no financial support was received for the research, authorship, and/or publication of this article.
Conflict of interest
The authors declare that the research was conducted in the absence of any commercial or financial relationships that could be construed as a potential conflict of interest.
The author(s) declared that they were an editorial board member of Frontiers, at the time of submission. This had no impact on the peer review process and the final decision.
Publisher’s note
All claims expressed in this article are solely those of the authors and do not necessarily represent those of their affiliated organizations, or those of the publisher, the editors and the reviewers. Any product that may be evaluated in this article, or claim that may be made by its manufacturer, is not guaranteed or endorsed by the publisher.
Supplementary material
The Supplementary material for this article can be found online at: https://www.frontiersin.org/articles/10.3389/fsufs.2024.1294390/full#supplementary-material
References
Beaussier, T., Caurla, S., Bellon-Maurel, V., and Loiseau, E. (2019). Coupling economic models and environmental assessment methods to support regional policies: a critical review. J. Clean. Prod. 216, 408–421. doi: 10.1016/j.jclepro.2019.01.020
Bjørn, A., and Hauschild, M. Z. (2012). Absolute versus relative environmental sustainability. J. Ind. Ecol. 17, 321–332. doi: 10.1111/j.1530-9290.2012.00520.x
Castellani, V., Benini, L., Sala, S., and Pant, R. (2016). A distance-to-target weighting method for Europe 2020. Int. J. Life Cycle Assess. 21, 1159–1169. doi: 10.1007/s11367-016-1079-8
Crist, E., Mora, C., and Engelman, R. (2017). The interaction of human population, food production, and biodiversity protection. Science 356, 260–264. doi: 10.1126/science.aal2011
Cucurachi, S., van der Giesen, C., and Guinée, J. B. (2018). Ex-ante LCA of emerging technologies. Procedia CIRP 69, 463–468. doi: 10.1016/j.procir.2017.11.005
Deng, C., Li, R., Xie, B., Wan, Y., Li, Z., and Liu, C. (2021). Impacts of the integrated pattern of water and land resources use on agricultural greenhouse gas emissions in China during 2006–2017: a water-land-energy-emissions nexus analysis. J. Clean. Prod. 308:127221. doi: 10.1016/j.jclepro.2021.127221
Ernstoff, A., Tu, Q., Faist, M., del Duce, A., Mandlebaum, S., and Dettling, J. (2019). Comparing the environmental impacts of meatless and meat-containing meals in the United States. Sustainability 11:6235. doi: 10.3390/su11226235
Frischknecht, R., Pfister, S., Bunsen, J., Haas, A., Känzig, J., Kilga, M., et al. (2018). Regionalization in LCA: current status in concepts, software and databases—69th LCA forum, Swiss Federal Institute of Technology, Zurich, 13 September, 2018. Int. J. Life Cycle Assess. 24, 364–369. doi: 10.1007/s11367-018-1559-0
Good Food Institute. (2023). Defining alternative protein. Available at: https://gfi.org/defining-alternative-protein/
Inaba, A., and Itsubo, N. (2018). Preface. Int. J. Life Cycle Assess. 23, 2271–2275. doi: 10.1007/s11367-018-1545-6
Itsubo, N., Murakami, K., Kuriyama, K., Yoshida, K., Tokimatsu, K., and Inaba, A. (2015). Development of weighting factors for G20 countries—explore the difference in environmental awareness between developed and emerging countries. Int. J. Life Cycle Assess. 23, 2311–2326. doi: 10.1007/s11367-015-0881-z
Kalbar, P. P., Birkved, M., Nygaard, S. E., and Hauschild, M. (2016). Weighting and aggregation in life cycle assessment: do present aggregated single scores provide correct decision support? J. Ind. Ecol. 21, 1591–1600. doi: 10.1111/jiec.12520
Matraeva, L. V., Vasiutina, E., Korolkova, N., Maloletko, A., and Kaurova, O. (2022). Identifying rebound effects and formulating more sustainable energy efficiency policy: a global review and framework. Energy Res. Soc. Sci. 85:102402. doi: 10.1016/j.erss.2021.102402
Miglietta, P. P., De Leo, F., Ruberti, M., and Massari, S. (2015). Mealworms for food: a water footprint perspective. Water 7, 6190–6203. doi: 10.3390/w7116190
Moni, S. M., Mahmud, R., High, K., and Carbajales-Dale, M. (2019). Life cycle assessment of emerging technologies: a review. J. Ind. Ecol. 24, 52–63. doi: 10.1111/jiec.12965
Muhl, M., Berger, M., and Finkbeiner, M. (2020). Distance-to-target weighting in LCA—a matter of perspective. Int. J. Life Cycle Assess. 26, 114–126. doi: 10.1007/s11367-020-01837-2
Mutel, C., Pfister, S., and Hellweg, S. (2011). GIS-based regionalized life cycle assessment: how big is small enough? Methodology and case study of electricity generation. Environ. Sci. Technol. 46, 1096–1103. doi: 10.1021/es203117z
Nemecek, T., Jungbluth, N., i Canals, L. M., and Schenck, R. (2016). Environmental impacts of food consumption and nutrition: where are we and what is next? Int. J. Life Cycle Assess. 21, 607–620. doi: 10.1007/s11367-016-1071-3
Parodi, A., Leip, A., de Boer, I. J. M., Slegers, P. M., Ziegler, F., Temme, E. H. M., et al. (2018). The potential of future foods for sustainable and healthy diets. Nat. Sustain. 1, 782–789. doi: 10.1038/s41893-018-0189-7
Pizzol, M., Laurent, A., Sala, S., Weidema, B., Verones, F., and Koffler, C. (2016). Normalization and weighting in life cycle assessment: quo vadis? Int. J. Life Cycle Assess. 22, 853–866. doi: 10.1007/s11367-016-1199-1
Poore, J., and Nemecek, T. (2018). Reducing food’s environmental impacts through producers and consumers. Science 360, 987–992. doi: 10.1126/science.aaq0216
PRé Sustainability (2020). SimaPro database manual methods library Available at: https://pre-sustainability.com/articles/eco-indicator-99-manuals/
Publications Office of the European Union (2011) Background review of existing weighting approaches in Life Cycle Impact Assessment (LCIA). Available at: https://op.europa.eu/en/publication-detail/-/publication/6aef92b9-6460-4f24-97f9-d0885e30840c/language-en
Sharaai, A. H. (2012). Life cycle impact assessment (LCIA) using the ecological scarcity (ecopoints) method: a potential impact analysis to potable water production. Afr. J. Biotechnol. 11, 1391–1402. doi: 10.5897/ajb11.428
Smetana, S., Tamásy, C., Mathys, A., and Heinz, V. (2015). Sustainability and regions: sustainability assessment in regional perspective. Reg. Sci. Policy Pract. 7, 163–186. doi: 10.1111/rsp3.12068
Steubing, B., and De Koning, D. (2021). Making the use of scenarios in LCA easier: the superstructure approach. Int. J. Life Cycle Assess. 26, 2248–2262. doi: 10.1007/s11367-021-01974-2
Stranddorf, H., Stranddorf, H. K., Hoffmann, L., and Schmidt, A.FORCE Technology (2005). Impact categories, normalization and weighting in LCA Tolderlundsvej 5, 5000 Odense, Denmark. Available at: https://eng.mst.dk/indenmark
University of Warwick (2013). Energy dependency and food chain security. Department for Environment Food & Rural Affairs Available at: https://sciencesearch.defra.gov.uk/ProjectDetails?ProjectId=16433.
Vermeulen, S. J., Campbell, B. M., and Ingram, J. S. I. (2012). Climate change and food systems. Annu. Rev. Environ. Resour. 37, 195–222. doi: 10.1146/annurev-environ-020411-130608
Ververis, E., Ackerl, R., Azzollini, D., Colombo, P. A., de Sesmaisons, A., Dumas, C., et al. (2020). Novel foods in the European Union: scientific requirements and challenges of the risk assessment process by the European food safety authority. Food Res. Int. 137:109515. doi: 10.1016/j.foodres.2020.109515
Willett, W. C., Rockström, J., Loken, B., Springmann, M., Lang, T., Vermeulen, S., et al. (2019). Food in the Anthropocene: the EAT–Lancet Commission on healthy diets from sustainable food systems. Lancet 393, 447–492. doi: 10.1016/s0140-6736(18)31788-4
Yang, Y., Pelton, R. E. O., Kim, T., and Smith, T. M. (2019). Effects of spatial scale on life cycle inventory results. Environ. Sci. Technol. 54, 1293–1303. doi: 10.1021/acs.est.9b03441
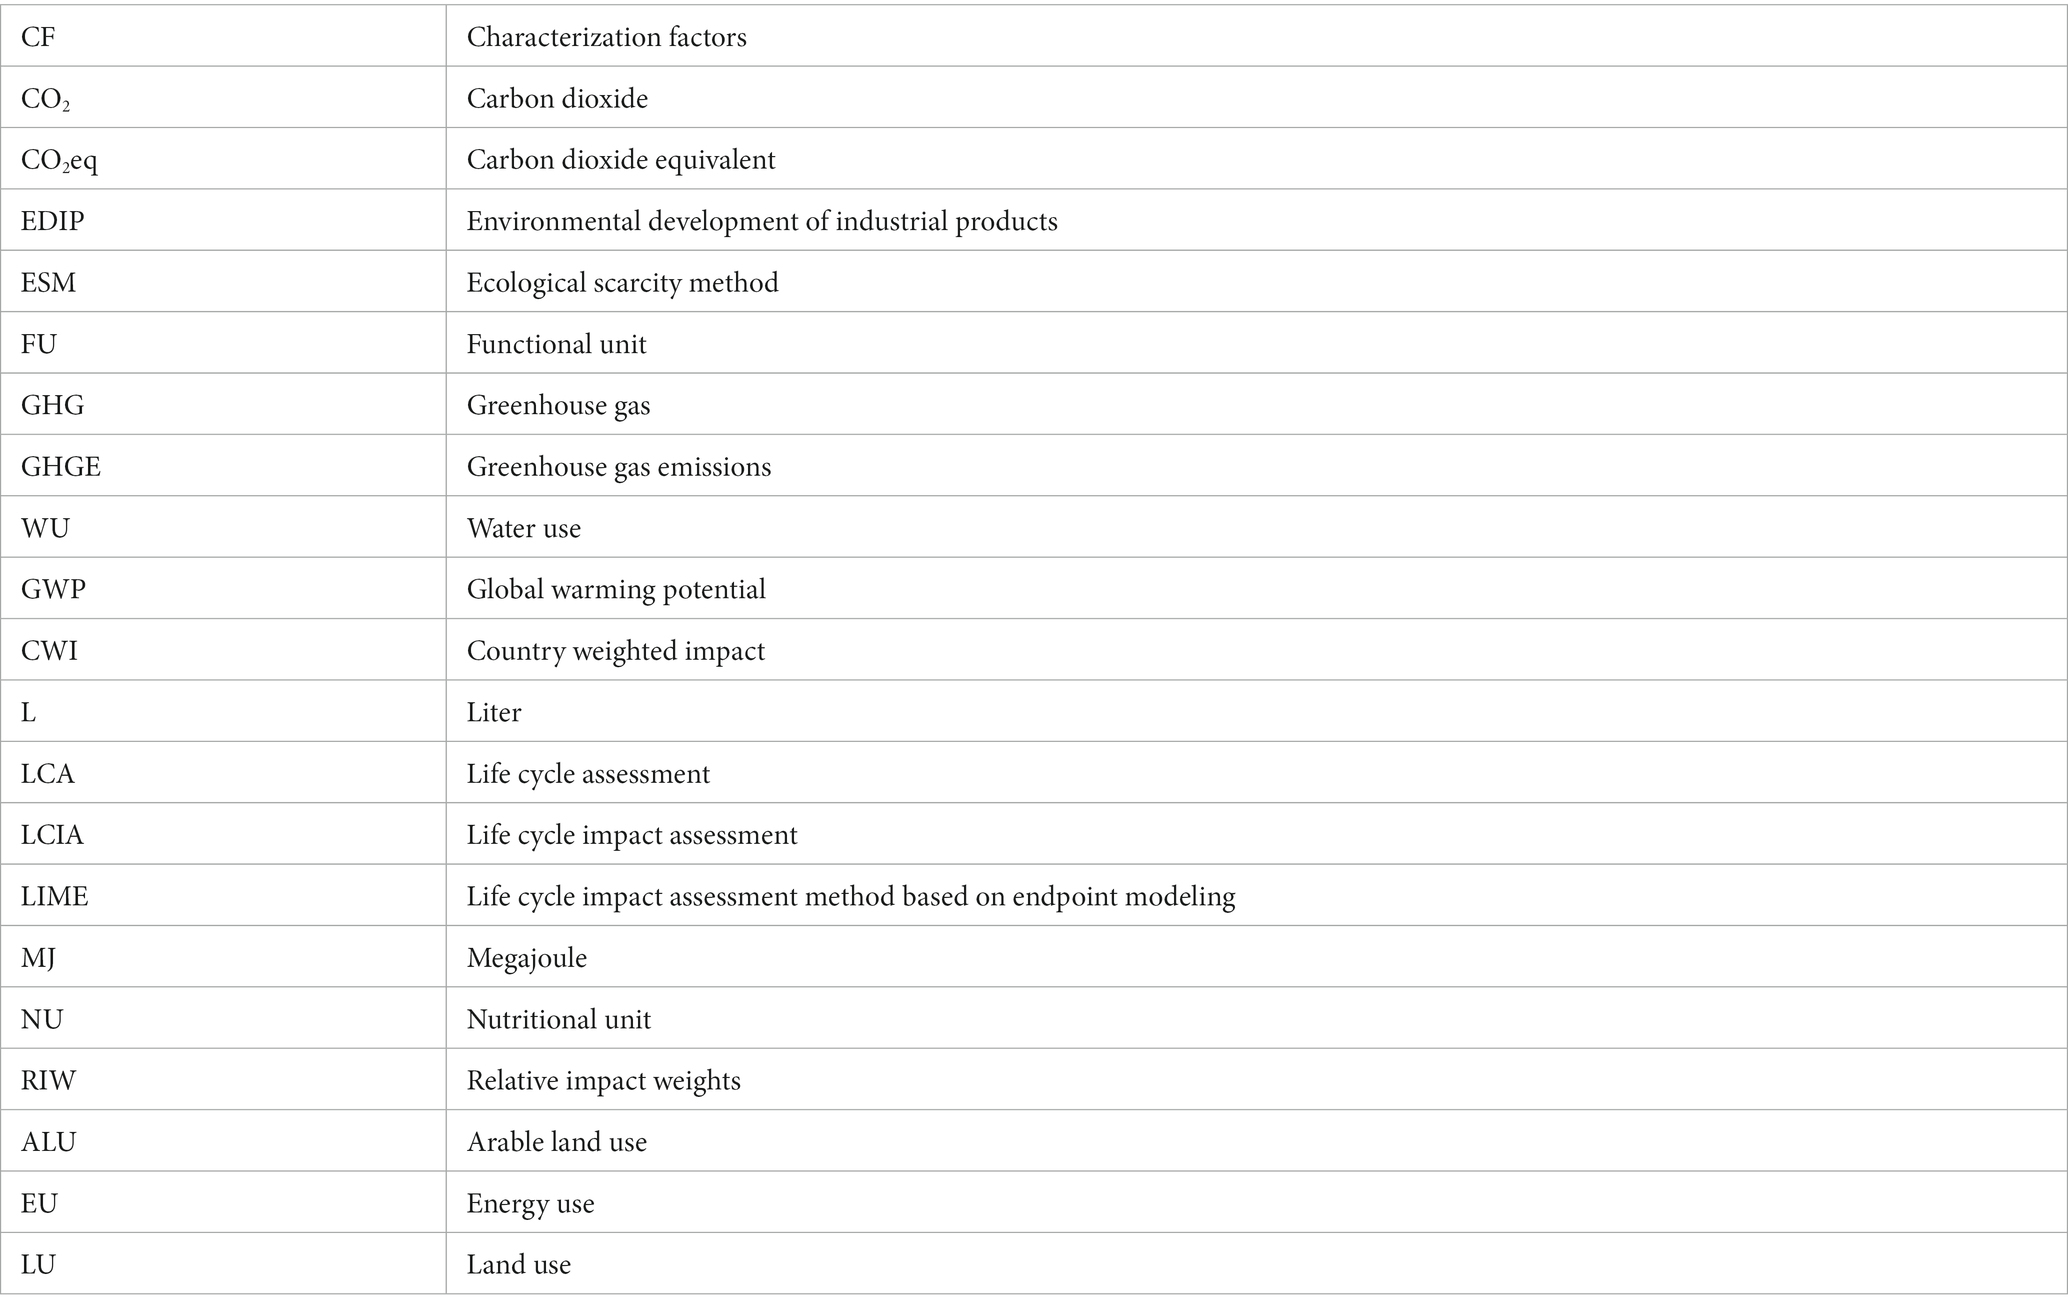
Glossary
Keywords: life cycle assessment, eco-potential points, relative impact weights, alternative protein sources, country weighted impact
Citation: Francis A, Ghnimi S and Smetana S (2024) Development of a regionalized dynamic weighting method for the environmental impact of alternative protein sources. Front. Sustain. Food Syst. 8:1294390. doi: 10.3389/fsufs.2024.1294390
Edited by:
Carla Cavallo, University of Naples Federico II, ItalyReviewed by:
Eleonora Crenna, Swiss Federal Laboratories for Materials Science and Technology, SwitzerlandRachel Mazac, Stockholm University, Sweden
Copyright © 2024 Francis, Ghnimi and Smetana. This is an open-access article distributed under the terms of the Creative Commons Attribution License (CC BY). The use, distribution or reproduction in other forums is permitted, provided the original author(s) and the copyright owner(s) are credited and that the original publication in this journal is cited, in accordance with accepted academic practice. No use, distribution or reproduction is permitted which does not comply with these terms.
*Correspondence: Aditya Francis, YS5mcmFuY2lzQGRpbC10ZWMuZGU=