 Yuqi Huang
 Jinjie Zhang
 Dalun Xu1*
 Wen Yang
 Jinyong Zhu
- 1School of Food Science and Engineering, Ningbo University, Ningbo, Zhejiang, China
- 2School of Marine Sciences, Ningbo University, Ningbo, Zhejiang, China
The environmental impact of increased eutrophication and frequent cyanobacterial blooms on the growth and reproduction of aquatic organisms has become increasingly prominent in recent years. Bellamya aeruginosa is a nutrient-rich aquatic snail consumed by humans, and environmental changes may decrease its meat quality. However, the specific characteristics of muscle metabolism and flavor quality in freshwater snails and their response patterns to bloom-forming cyanobacterial stress have not been reported. Therefore, in this study, alterations in metabolites in the snail muscle after following feeding on toxic Microcystis aeruginosa were investigated using untargeted metabolomics. A total of 1,128 metabolites were identified, and the metabolic pathways of unsaturated fatty acid biosynthesis and purine, glutathione, and glycerophospholipid metabolism in snails fed toxic cyanobacteria differed from those in snails fed Chlorella vulgaris. Quantitative analysis showed increased levels of bitter-free amino acids, such as tyrosine, phenylalanine, and histidine, after consuming toxic cyanobacteria for 42 d, whereas a relative decrease was observed in the levels of umami- and sweet-free amino acids, such as glutamic acid, aspartic acid, serine, threonine, and glicine. The muscles of snails fed toxic cyanobacteria exhibited higher hypoxanthine and hypoxanthine nucleoside and lower adenosine triphosphate, adenine nucleotide, adenine nucleoside diphosphate, and hypoxanthine nucleotide contents than those of snails fed C. vulgaris. Furthermore, increased metabolites, such as stearic acid, palmitic acid, and cytidine diphosphate choline, and decreased metabolites, such as docosapentaenoic acid, docosahexaenoic acid, adrenoic acid, and L-glutamic acid, reflect the harmful effects of toxic cyanobacteria on the nutritional value and flesh quality of B. aeruginosa. This study comprehensively evaluated the effects of cyanobacterial blooms on freshwater gastropods, providing an important theoretical basis for the quality, safety, and sustainable development of snails as food and related processing industries.
1 Introduction
Bellamya aeruginosa (Gastropoda: Probranchia), is a widespread viviparid freshwater snail species that is distributed across East Asia (Qiu et al., 2017). It is also invasive in other regions, such as Europe and South America (Ye et al., 2021). Because of its delicious meat and high nutritional value, B. aeruginosa has been consumed as a delicacy and medicinal food since ancient times (Mak Sau-Wa, 2022). Studies have shown that snail muscles are high in protein, are low in fat, and contain a high proportion (40%) of umami amino acids (Luo et al., 2022). The market for these snails has recently grown, boosted by the night market economy, snail rice noodle industry, and catering industry, which use snail meat as a primary ingredient. The sales volume of snail noodles alone was more than USD$7.9 billion in 2021 (Mak Sau-Wa, 2022). Snail meat is exported to more than 28 countries and regions worldwide, with the market growing annually (Zhang et al., 2023).
However, owing to the limitations of the scale and technical level of snail breeding, the yield of snails cannot meet the rapid growth in demand for snail meat in the processing industry. Thus, this industry remains highly dependent on wild-caught snails (Hu et al., 2021; Jin et al., 2022). The quality and safety of snail meat are difficult to ensure because of complex environmental conditions (Pissia et al., 2021). Polluted water bodies directly affect the healthy growth and nutrient metabolism of aquatic organisms (Hossain et al., 2023; Wang M. et al., 2023), and this effect has become more prominent owing to an increase in eutrophication and frequent cyanobacterial blooms. Studies have indicated that bloom-forming cyanobacteria reduce the palatability, nutritional value, and muscle quality of fish (Chen et al., 2021). Owing to the high spatiotemporal overlap between the cyanobacterial blooms and the growth and reproduction of gastropods (Lance et al., 2010), snail meat quality might be affected by cyanobacterial blooms. Numerous studies, including those on transcriptomics (Yang et al., 2023), metabolomics (Yang et al., 2022), biochemistry and histopathology (Zhu et al., 2011), community composition and function (Lyu et al., 2022), and coupled changes in co-metabolites (Ren et al., 2023) of freshwater snails have investigated their response to cyanobacterial blooms. However, to the best of our knowledge, the characteristics of muscle metabolism and flavor quality in freshwater gastropods and their response patterns to bloom-forming cyanobacterial stress have not been reported.
In this study, we identified the differentially expressed metabolites in muscles of the edible freshwater snail B. aeruginosa after feeding on different algae using non-targeted metabolism techniques. The effects of cyanobacteria on the muscle metabolism of B. aeruginosa were characterized using the quantitative analysis of free amino acids and flavor nucleotides. Overall, this study aimed to determine the changes and dynamic patterns in muscle metabolism and flavor quality after exposing the snail to toxic cyanobacteria and answer the following questions: Does the nutritional value and taste of the flesh of gastropods living under cyanobacterial blooms remain the same as those of gastropods living in a relatively clean environment? If not, how do these changes occur over time?
2 Materials and methods
2.1 Snail samples and algal cultivation
The materials used in the experiment were collected from a stream in Yinzhou Park (water temperature, 18.5°C) in Ningbo City, Zhejiang Province. To avoid confounding factors due to gender differences (Lei et al., 2017), only female snails with complete shells, shell length of 2.0 ± 0.1 cm, consistent in size, and good vitality were used for the experiments. After collection, attached organisms and dirt were removed from the snail’s body surface. The unicellular green algae Chlorella vulgaris (strain NMBlud2006-2, provided by the Aquatic Ecology Laboratory of Ningbo University, Ningbo, China) was cultured in NMB3 medium (100 mg·L−1 KNO3, 10 mg·L−1 KH2PO4, 2.5 mg·L−1 FeSO4·5H2O, 6 μg·L−1 VB1, and 0.05 μg·L−1 VB12) at an ambient temperature (25 ± 1°C) and in natural light. Microcystis aeruginosa (strain FACHB-905, provided by the Institute of Hydrobiology, Chinese Academy of Sciences, Wuhan, China) was cultured in sterile triangular conical flasks using BG-11 medium at 25 ± 1°C, with light exposure of approximately 36 μE·(m2·s)−1, and a light/dark cycle of 12 h/12 h.
2.2 Sample collection and experimental design
Before the feeding exposure test, B. aeruginosa was acclimated in an aquarium tank with aerated dechlorinated tap water for more than 48 h and fed a low concentration of C. vulgaris. The water was changed daily (water hardness of 75 mg·L−1 CaCO3, light/dark cycle of 8 h/16 h, and temperature of 24 ± 0.5°C). After 7 d of acclimation, the snails were randomly divided into treatment (snails fed toxic M. aeruginosa group, denoted as the T group) and control groups (snails fed C. vulgaris group, denoted as the G group). Each treatment comprised six replicates, which were equivalent to six glass containers per treatment. The experiment was conducted in 12 glass aquarium tanks (34 cm × 19 cm × 22 cm). Each container was initially equipped with 12 L of experimental algal solution, 60 female snails of the same size were placed in the containers, and the experiment was run for 42 d. Based on the cellular carbon content, the concentration of approximately 1.8 × 10⁷ cells·mL−1 M. aeruginosa was used, which is close to the peak density of cyanobacterial blooms; the corresponding concentration of C. vulgaris was approximately 2.5 × 10⁶ cells·mL−1 (Yang et al., 2023). Dechlorinated tap water was used for the experiment with 48 h explosion and was adjusted to optimum hardness (30 mg·L−1 Ca2+). Complete algal renewal and density adjustments were performed twice daily (08:00 and 20:00). The algal solution density was maintained at 300 mL per snail; thus, as the number of snails decreased, the algal suspension was reduced accordingly. The experimental conditions for the exposure period were the same as those for the acclimation period.
During the 42-d experimental period, two living snails were randomly collected as one sample from each container. Six samples (i.e., 12 snails) were collected on day 0, and one sample was collected per tank on days 14, 28, and 42, totaling 42 samples. After sampling, the muscle tissue of each snail was immediately dissected, frozen in liquid nitrogen, and stored at −80°C. The health status of the snails was examined every 8 h during the experiment, and dead individuals were immediately removed.
2.3 Metabolites extraction
The dissected tissue (100 mg) was ground, and the homogenate was resuspended in pre-chilled 80% methanol with a vortex. The samples were incubated for 5 min on ice and then centrifuged for 20 min at 15,000 × g at 4°C. Liquid chromatography-mass spectrometry (LC-MS)-grade water was used to dilute the supernatant to a final concentration of 53% methanol. The treatment samples were then centrifuged at 15,000 × g at 4°C for 20 min in new Eppendorf tubes. Finally, the supernatant was injected into the LC-MS/MS system for analysis.
2.4 Ultra-high performance liquid chromatography-mass spectrometry/mass spectrometry analysis
UHPLC-MS/MS analysis was performed using a Vanquish UHPLC system (Thermo Fisher Scientific, Germany) coupled with an Orbitrap Q Exactive HF mass spectrometer (Thermo Fisher Scientific, Germany) at Novogene Co., Ltd. (Beijing, China). Samples were injected into the apparatus for 12 min at a flow rate of 0.2 mL·min−1, passed through the Hypesil Gold column (100 × 2.1 mm, 1.9 μm). Eluent A (0.1% FA in water) and B (methanol); eluents A (5 mM ammonium acetate, pH 9.0) and B (methanol) corresponded to the eluents of positive and negative polarity modes, respectively. The solvent gradient was as follows: 2% B, 1.5 min; 2–85% B, 3 min; 85–100% B, 10 min; 100–2% B, 10.1 min; and 2% B, 12 min. The Q Exactive HF mass spectrometer was operated in positive/negative polarity mode with a spray voltage of 3.5 kV, capillary temperature of 320°C, sheath and aux gas flow rates of 35 psi and 10 L·min−1, respectively, S-lens RF level of 60, and aux gas heater temperature of 350°C.
2.5 Data processing and metabolite identification
The original data files were generated by UHPLC–MS/MS. Compound Discoverer 3.1 (CD3.1, Thermo Fisher) was used for peak alignment, peak selection, and metabolite quantitation. The primary parameters were as follows: retention time tolerance, 0.2 min; actual mass tolerance, 5 ppm; signal intensity tolerance, 30%; signal/noise ratio, 3; and minimum intensity, et al. Peak intensities were normalized to the total spectral intensity. After normalizing the data, the molecular formula was predicted according to the additional ions, molecular ion peaks and fragment ions. The peaks were then matched using the mzCloud,1 mzVault, and MassList databases to obtain accurate qualitative and quantitative results. Statistical analyses were performed using the R (version R4.3.1), Python (version 2.7.6), and CentOS (version 6.6). The area normalization method was used when the data was not normally distributed to achieve normal transformations.
2.6 Data and bioinformatic analysis
These metabolites were annotated using the KEGG database2 and HMDB databases.3
Multivariate statistical analyses included principal component analysis (PCA), orthogonal partial least squares discriminant analysis (OPLS-DA), and variable importance in the projection (VIP) analysis. Metabolomics is susceptible to external factors and rapidly changes. Therefore, data quality control was necessary to obtain stable and accurate metabolomics results. In metabolomic data analyses, unsupervised PCA is typically used to detect the similarities and differences between samples. The 95% confidence interval was determined based on Hotelling’s T-squared calculation. The distance between each sample point was proportionally determined by the similarity of metabolite composition between samples. The greater the difference in metabolite composition, the greater the distance. A plot based on the OPLS-DA analysis was used to determine the differences in metabolites between the groups. Model quality was evaluated using 200 response permutation testing to prevent model overfitting. The VIP obtained from the OPLS-DA model was used to rank the overall contribution of each variable to group discrimination. One-way analysis of variance (ANOVA) was further used to verify whether the differences in metabolites between groups were significant. The VIP value represented the significance of the differential expression; the larger the value, the more reliable the deferentially expressed metabolite was obtained from the screening. The selection criteria for differential metabolites were VIP > 1.0 and p < 0.05. Clustering results were presented as fractional graphs.
Enrichment analysis aims to identify biological pathways that play essential roles in biological processes, thereby revealing and allowing us to understand the underlying molecular mechanisms. Differential metabolites were substituted into the KEGG database to identify their KEGG IDs and pathways. The numbers of metabolites enriched in the corresponding pathways were also calculated. The Rich factor is the ratio of the number of deferentially expressed metabolites in a corresponding pathway to the total number of metabolites detected and annotated by the pathway. The larger the Rich factor, the higher the degree of metabolite enrichment. lg (p-value) was used to determine whether a pathway was enriched. The closer the p-value was to 0, the more significant the enrichment. In this study, KEGG pathways with the top 20 were only selected if the pathways were significantly (p < 0.05) enriched.
2.7 Determination of free amino acids
Muscle tissue samples (60 mg) collected on days 0 and 42 were weighed and homogenized with 50 μL water MP. After vortexing for 60 s, 400 μL methanol acetonitrile solution (1:1, v/v) and 50 μL 16 isotope internal standard mixed solution were added. The mixture was then vortexed for 60 s and sonicated at a low temperature for 30 min. This procedure was repeated twice. The samples were stored at −20°C for 1 h to precipitate the protein. Finally, the samples were centrifuged for 20 min at 14,000 × g and 4°C, and the supernatant was removed and stored at −80°C.
The Agilent 1290 Infinity UHPLC system was used for chromatographic separation, and the standard was placed in an automatic sampler at 4°C. The chromatographic conditions were as follows: column temperature, 35°C; flow rate, 300 μL·min−1; injection volume, 2 μL; mobile phase A, 25 mM ammonium formate and 0.1% formic acid aqueous solution; mobile phase B, 0.1% formic acid acetonitrile solution; and gradient elution program: 0–1 min, 85% B; 1–11 min, 50% B; 11.1–12 min, 40% B; 12–12.1 min, 75% B; and 12.1–19 min, 75% B.
Mass spectrometry analysis was performed using a 6500/5500 QTRAP mass spectrometer (SCIEX) in the positive ion mode. Mass spectrometry conditions were as follows: source temperature, 500°C; ion source Gas 1, 55; ion source Gas 2, 50; curtain gas, 30; and ion spray voltage floating, 4,500 V. The ion pairs were detected in the MRM mode, and the peak areas and retention times were extracted using the MultiQuant software (version 3.0.2). Metabolite identification was performed based on the corrected retention time of the target substance standard.
Data were processed using Duncan’s multiple comparisons and two-way ANOVA using the SPSS software (version 2) and plotted using the GraphPad Prism software (version 9.5).
2.8 Determination of flavor nucleotides
First, 5 g (accurate to 0.01 g) of dissected muscles collected on days 0 and 42 were weighed in 50 mL plastic centrifuge tubes. Then, 15 mL of pre-cooled (4°C) 10% perchloric acid was added to the mixture. The mixture was homogenized for 1 min at 12,000 rpm in an ice bath and then frozen and centrifuged at 4°C and 10,000 rpm for 10 min. The supernatant was then collected and stored at 4°C. The precipitate was added to 15 mL of precooled (4°C) 5% perchloric acid for repeated extraction. The resulting two supernatants were combined as extracts. The pH of the extraction solution was adjusted to approximately 5.0 with 10 mol·L−1 NaOH solution and then to 5.35 with 1.0 mol·L−1 NaOH solution. The volume was adjusted to 50 mL using a volumetric flask with ultrapure water. The solution rested at 4°C for 2 h and then underwent high-speed centrifugation at 10,000 rpm for 10 min. After resting, the clarified solution was filtered through a 0.22 μm water phase filter membrane and measured on the machine.
The standards were as follows: adenine nucleoside disodium triphosphate, adenine nucleoside diphosphate (ADP), adenine nucleotide (AMP), adenine nucleoside (AdR), adenine (Ad), hypoxanthine nucleotide (IMP), hypoxanthine nucleoside (HxR), hypoxanthine (Hx), xanthine (Xt), guanine nucleotide (GMP), uracil nucleotide (UMP), and cytosine nucleotide (CMP) (all purity ≥99%, Sigma-Aldrich, United States).
The HPLC conditions were as follows: instrument, Agilent 1260 HPLC (with photodiode array detector, DAD, Agilent Technologies, Inc., United States); column, Shimadzu Shim-pack Gis C18 250 mm × 4.6 mm × 5 μm; detection wavelength, 254 nm; column temperature, 30°C; flow rate, 1.0 mL·min−1; injection volume, 10 μL; mobile phase, A: methanol; B: 0.015 mol·L−1 K2HPO4 + 0.015 mol·L−1 KH2PO4 buffer (adjusted to pH 5.35 with H3PO4); Gradient elution program: 0–12 min, 100% B; 12.01–14 min, 97% B; 14.01–18 min, 94% B; 18.01–27 min, 85% B; 27.01–35 min, 70% B; and 35.01–40 min, 100% B.
Standards and the corresponding standard curves were used for qualitative and quantitative analyses. Data were processed using Duncan’s multiple comparisons and one-way ANOVA was performed using the SPSS software (version 24.0) and plotted using the Origin software (version 9.0).
3 Results
3.1 Qualitative and quantitative results
By combining the peaks detected in the samples, the relative values for metabolite quantification values represent the area of each characteristic peak. The total peak area represents the standardized metabolite quantification results. 769 and 359 ions were detected in the positive and negative ion modes, respectively.
3.2 Differential analysis of feeding different algal treatments
The PCA results (Figure 1) showed that the 95% confidence interval contained all samples (each point represents an independent sample), with no outlier points. For a PCA model that reflects the true sample distribution, all cumulative interpretation rates (R2X (CUM)) were ˃0.5 (Supplementary Table S1), when performing paired analysis. In addition, the difference between the initial state and the other days gradually increased with the accumulation of feeding time. At the beginning of the experiment, the aggregation between the two groups was more concentrated (Figure 1A). With the extension of the acclimation period, the G and T groups were gradually distributed on the left and right sides of the PCA score plot until day 42, with clear separation. This phenomenon suggests that the difference in metabolites between 14, 28, and 42 d gradually increased, indicating that the ingestion of M. aeruginosa significantly affected the metabolism of B. aeruginosa (Figures 1B–D).
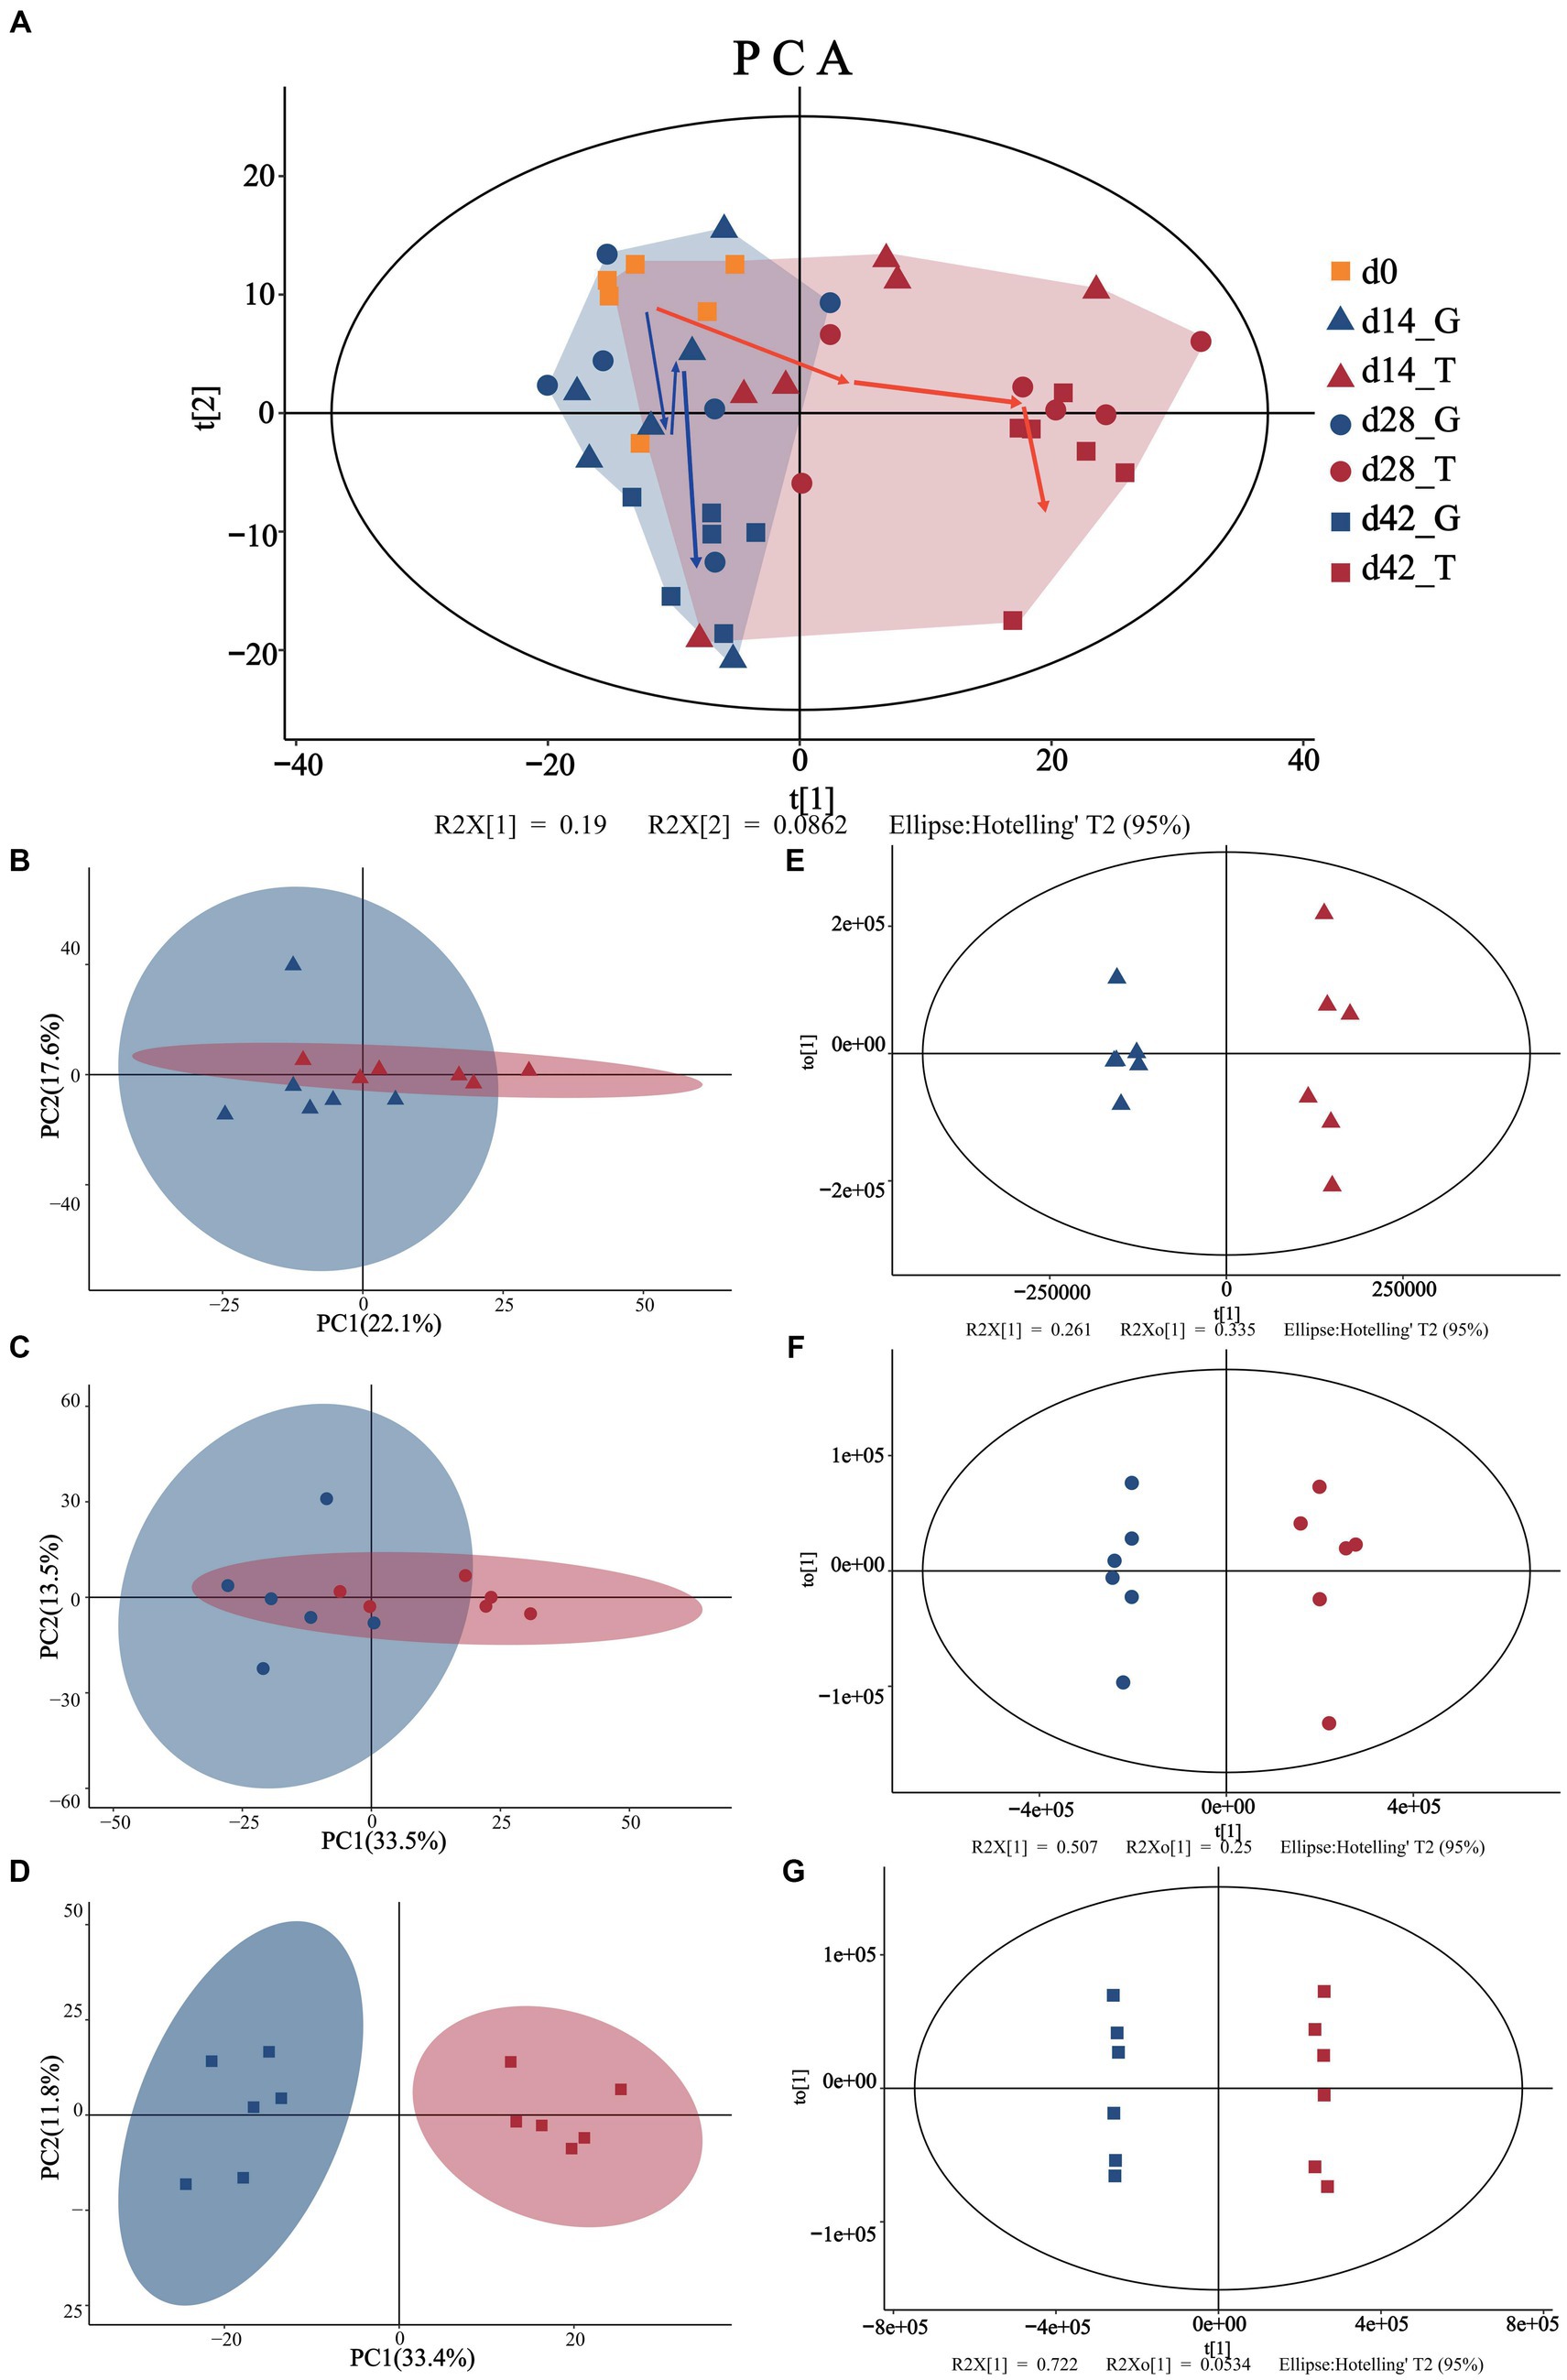
Figure 1. Multivariate statistical analyses of snail muscle samples. (A) Represents the PCA scores of the overall sample (day 0 are represented by the yellow squares). (B–D) Represent the PCA analyses for days 14 (triangles), 28 (circles), and 42 (squares), while (E–G) represent the OPLS-DA analyses for days 14 (triangles), 28 (circles), and 42 (squares). Where blue color is indicated with the control group (C. vulgaris group, denoted as the G group) and red color is indicated with the treatment group (toxic M. aeruginosa group, denoted as the T group). t[1] represents the principal component 1, to[1] represents the principal component 2, and the ellipse represents the 95% confidence interval.
To optimize the separation between the groups, they were further analyzed using OPLS-DA. Confidence intervals of 95% were included for all samples. As shown in Figures 1E–G, both the T and G groups exhibited a trend of internal concentration, but this differed between groups over time. The fitting test results of OPLS-DA are consistent with those of PCA (Supplementary Table S1), and the cross-validation lines with larger slopes in the 200 permutation tests also demonstrated no overfitting in the original model. In addition, the OPLS-DA model had good explanatory and predictive power, and the actual differences between different treatment groups implied that significantly different metabolites should exist between the subgroups. These results indicate that after 42 d of consuming M. aeruginosa, B. aeruginosa showed significant changes in muscle metabolites.
3.3 Screening for differential metabolites
A total of 115, 295, and 467 differential metabolites were identified based on p-value and fold-change values on days 14, 28, and 42, respectively. Notably, significant changes in muscle metabolite levels were observed in B. aeruginosa following the consumption of M. aeruginosa. These differences between the groups became more significant over time. In addition, 93 and 22 differential metabolites were upregulated and downregulated on day 14, respectively. On day 28, 250 and 45 differential metabolites were upregulated and downregulated, respectively, and on day 42, 408, and 59 differential metabolites were upregulated and downregulated, respectively (Supplementary Table S2). Most of these metabolites were lipids and lipid-like molecules, fatty acids and their derivatives, organic acids and their derivatives, organic heterocyclic compounds, nucleosides, nucleotides and analogs, amino acids and their derivatives, carbohydrates, benzenes, organic oxygen compounds, and a few unclassified compounds.
Based on OPLS-DA analysis, VIP > 1 and p < 0.05 were used as the criteria to determine the difference in metabolites between samples with feeding time. By integrating positive and negative ion patterns, we obtained comprehensive and accurate results for the replicated differential metabolites screened within groups. Compared to the between-group samples, the correlation coefficients for the within-group samples were positively correlated with the reliability of the differential metabolites obtained. As shown in the heatmap (Figure 2), 92 differential metabolites were screened at four sampling time points: 0, 14, 28, and 42 d. Excellent biological repeatability was observed within the same group. Compared with those in the control group, the significantly upregulated metabolites in the treatment group (T group) were 11(Z),14(Z)-eicosadienoic acid, docosatrienoic acid, 11(E)-eicosenoic acid, oleamide, octadec-9-ynoic acid, N-tetradecanamide, stearic acid, stearamide, oleoyl ethylamide, and hexadecanamide. The differential downregulated metabolites were tetranor-12(R)-HETE, 12,13-EODE, (+/−)12(13)-diHOME, (+)13-HODE, cis-4-hydroxy-D-proline, gamma-Glu-Leu, threonine, NSI-189, spermidine, linoleic acid, oleic acid, adenylosuccinic acid, 4-oxoproline, and valine.
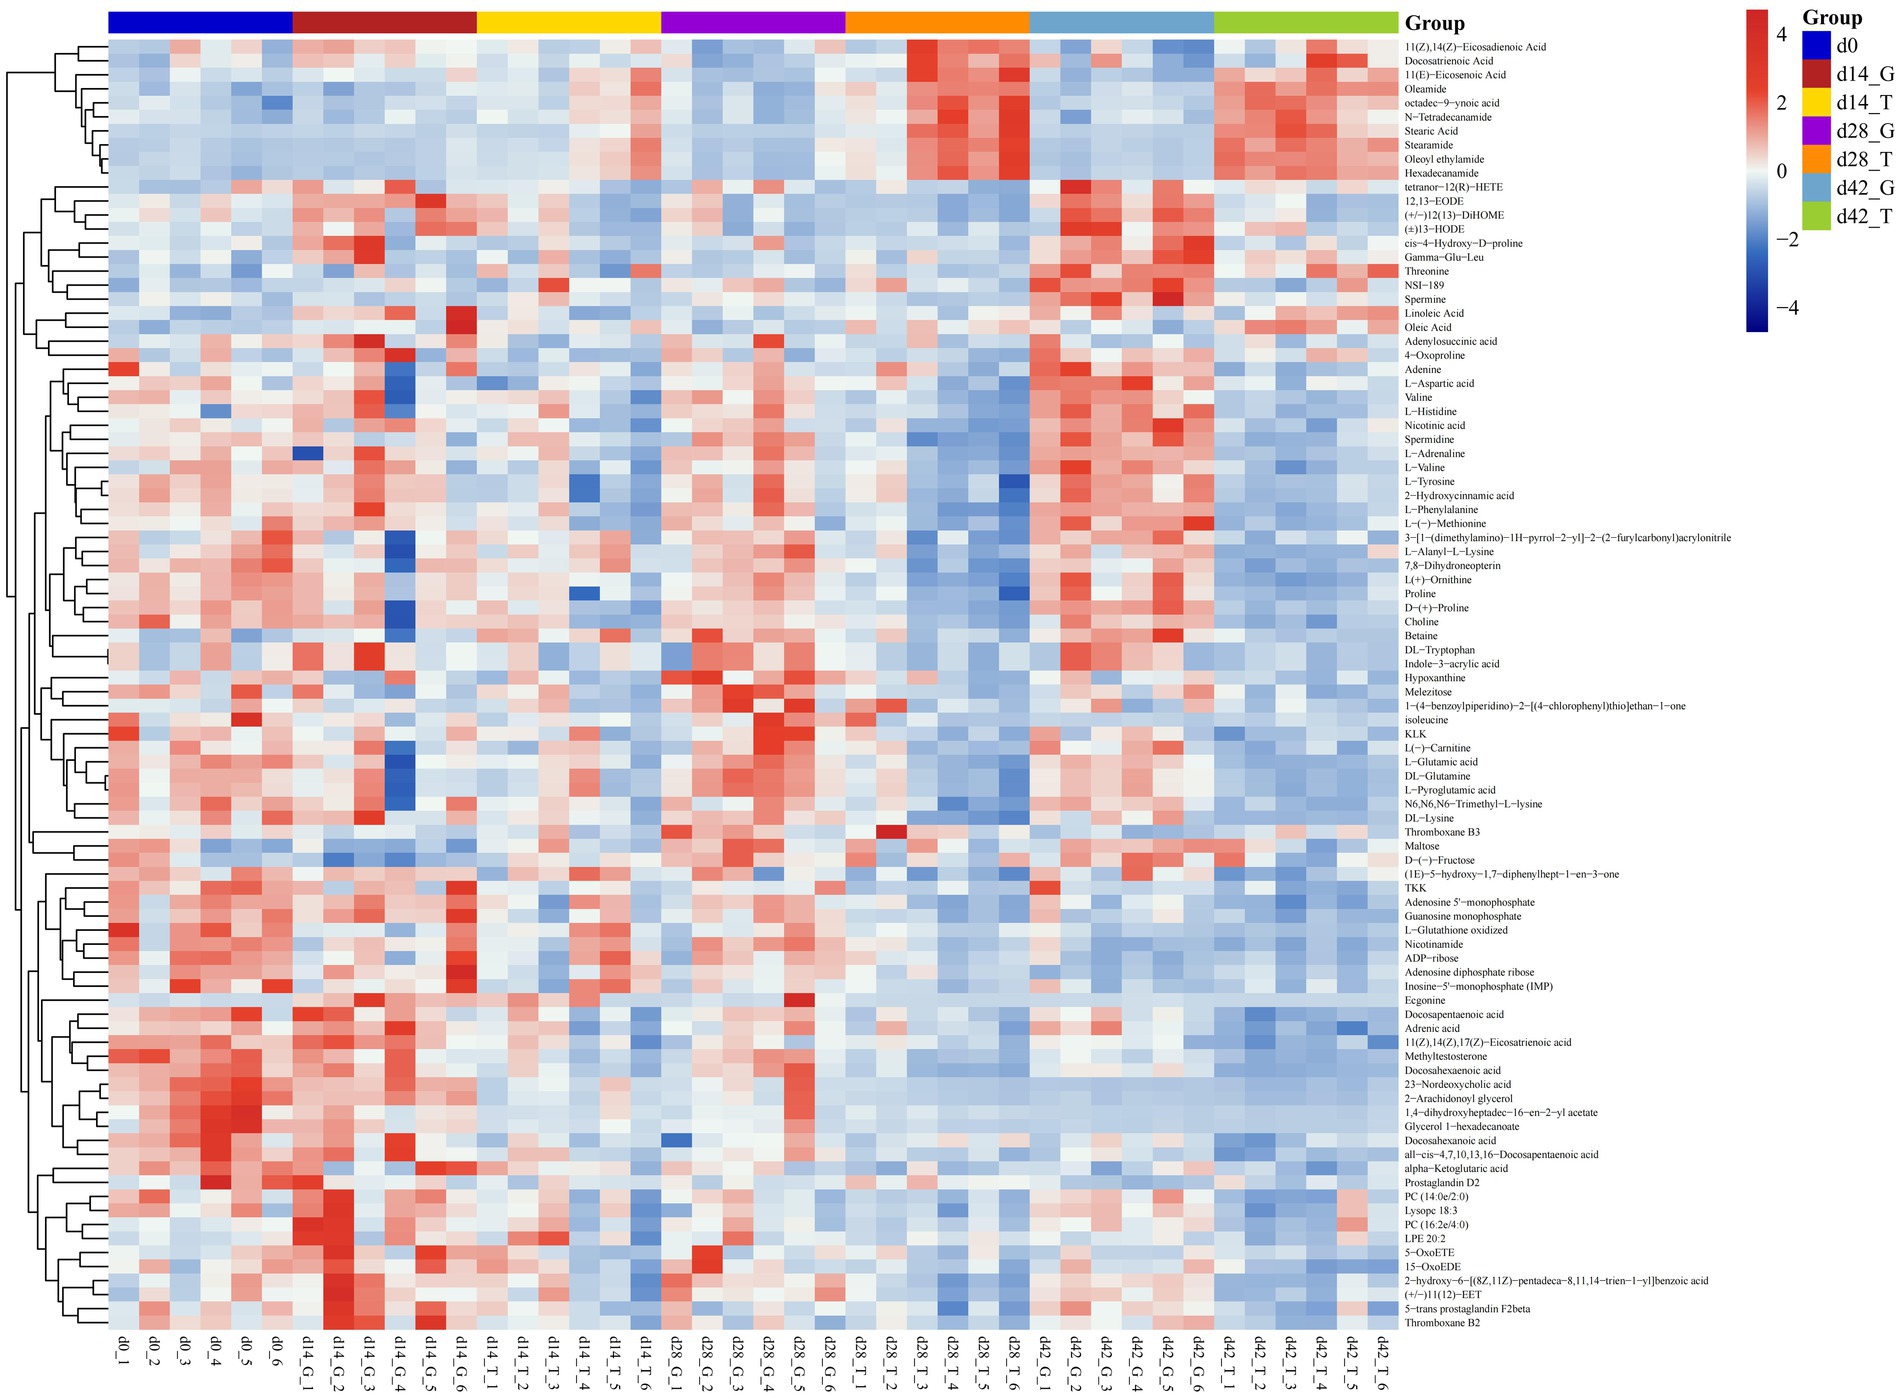
Figure 2. Cluster heatmap of all groups. Horizontal coordinate indicates the sample name, while the vertical coordinate represents the differential metabolite. Blue to red shows the expression abundance of metabolites from low to high, respectively.
Co-occurrence network analysis measures the correlation between significantly different metabolites to understand further the relationship between the muscle metabolites of B. aeruginosa and its change in feeding habits. The Spearman’s correlation analysis results are shown in Figure 3. Important topological parameters of the two groups were also determined (Table 1). The data revealed that the correlations between the differential metabolites were more complex in the T group than in the G group. This was also reflected in the key topological parameters. Compared to the G group, the T group had higher edge (1,278 and 226 edges in the T and G group, respectively), average degree (36.000 and 5.870), average weighted degree (26.789 and 4.407), average clustering coefficient (0.783 and 0.515), and density (0.514 and 0.077) values, and lower modularity (0.083 and 0.480), diameter (6 and 7), and average path length (1.676 and 3.071) values. These results indicate that the co-occurrence network of the T group was more complex than that of the G group. In particular, in the G group, we found positive correlations between adenosine 5′-monophosphate, inosine-5′-monophosphate, guanosine monophosphate, and adenosine diphosphate ribose, proline with choline, valine, L-histidine, and L-glutamic acid. Oleamide was negatively correlated with adenosine 5′-monophosphate, L-phenylalanine, valine, and hexadecanamide. In the T group, inosine-5′-monophosphate with adenylosuccinic acid, adenosine 5′-monophosphate, and adenosine diphosphate ribose, as well as hypoxanthine with L-tyrosine, L-phenylalanine, proline, L-valine, choline, L-histidine, and DL-lysine showed significant positive correlations. Negative correlations were observed between adenosine 5′-monophosphate, oleoyl ethylamide, hexadecanamide, and stearamide. The correlation analysis between metabolites with significant differences indicates that M. aeruginosa consumption significantly altered the muscle metabolites of B. aeruginosa.
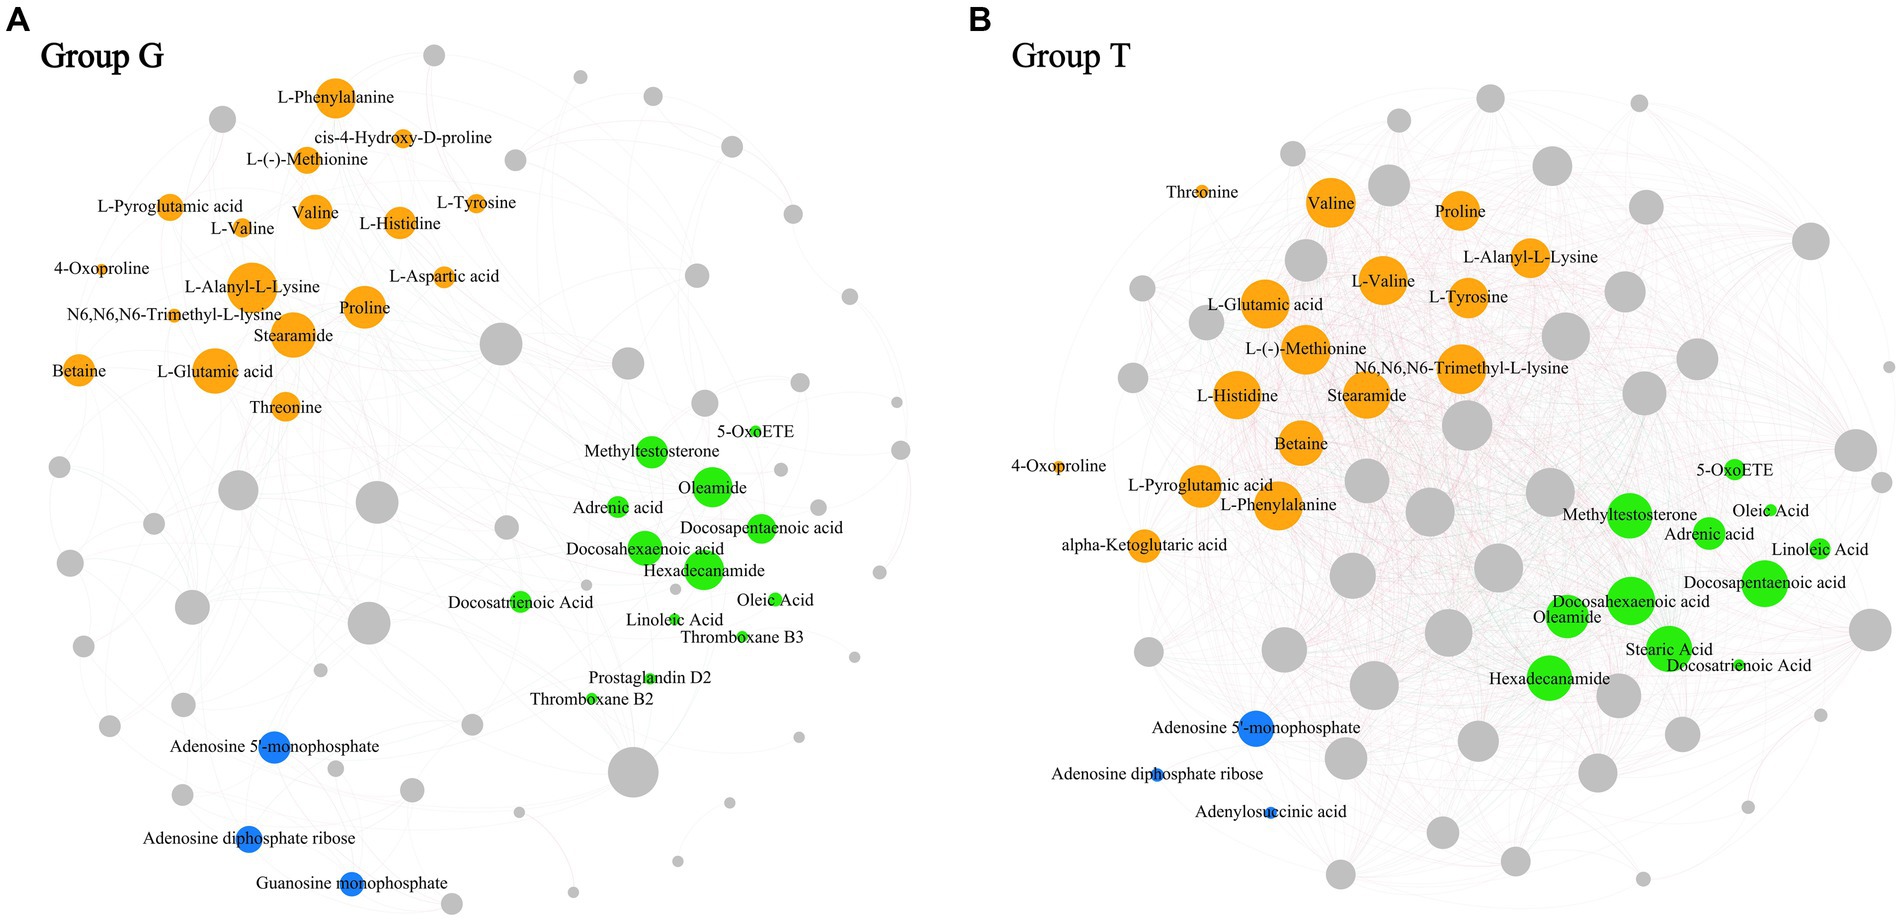
Figure 3. The co-occurrence network map between differential metabolites based on Spearman coefficient (p < 0.05, correlation > 0.6). (A) Correspond to the G group and (B) correspond to the T group. Organic acids and derivatives are colored in orange; Lipids and lipid-like molecules are colored in green; Nucleosides, nucleotides, and analogs are colored in bule; The remaining metabolites are colored in gray. The size of the nodes indicate the degree between metabolites. The thickness of the connecting lines represents the strength of correlation between different metabolites. Positive correlations are in red and negative correlations are in green.
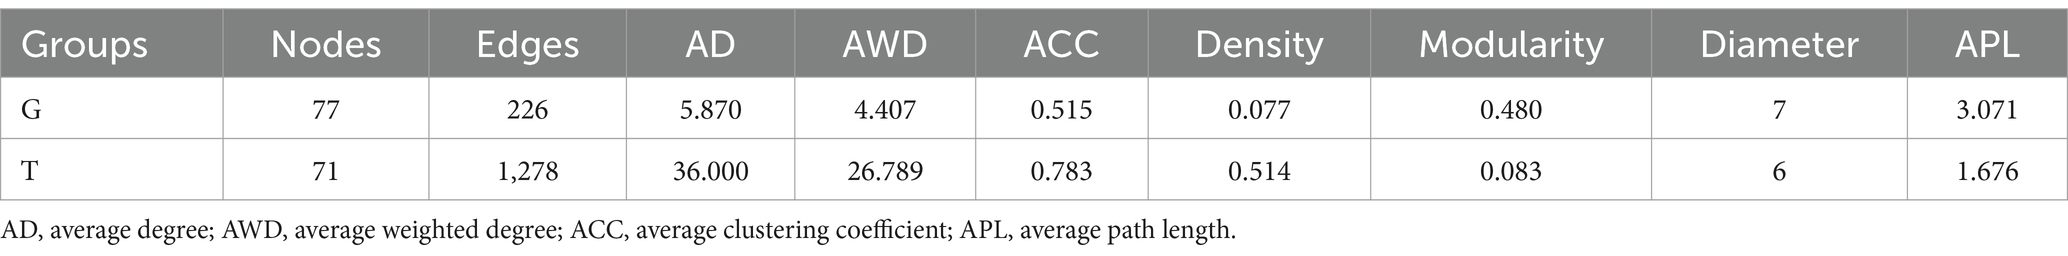
Table 1. Key topological parameters of the co-occurrence network of differential metabolites in each group.
3.4 Enrichment analysis of the differential metabolites
Related signal transduction and metabolic pathways can be expressed by the enrichment of differential metabolites in the KEGG pathway. The enrichment and analysis of metabolic pathways of differential metabolites in this study referenced the KEGG database, which assisted in further understanding the effect of M. aeruginosa on the muscle metabolites of B. aeruginosa.
Table 2 shows the differentially expressed metabolites in these pathways (VIP > 1.0, p < 0.05). Functional annotation showed that 44 upregulated and 0 downregulated metabolic pathways were integrated over 14 d, covering 11 metabolites. At 28 d, 89 upregulated and 7 downregulated metabolic pathways were integrated, covering 19 metabolites. Finally, at 42 d, 109 upregulated and 7 downregulated metabolic pathways were integrated, covering 25 metabolites. The significantly enriched pathways (top 20) were selected for the bubble diagram analysis (Figure 4).
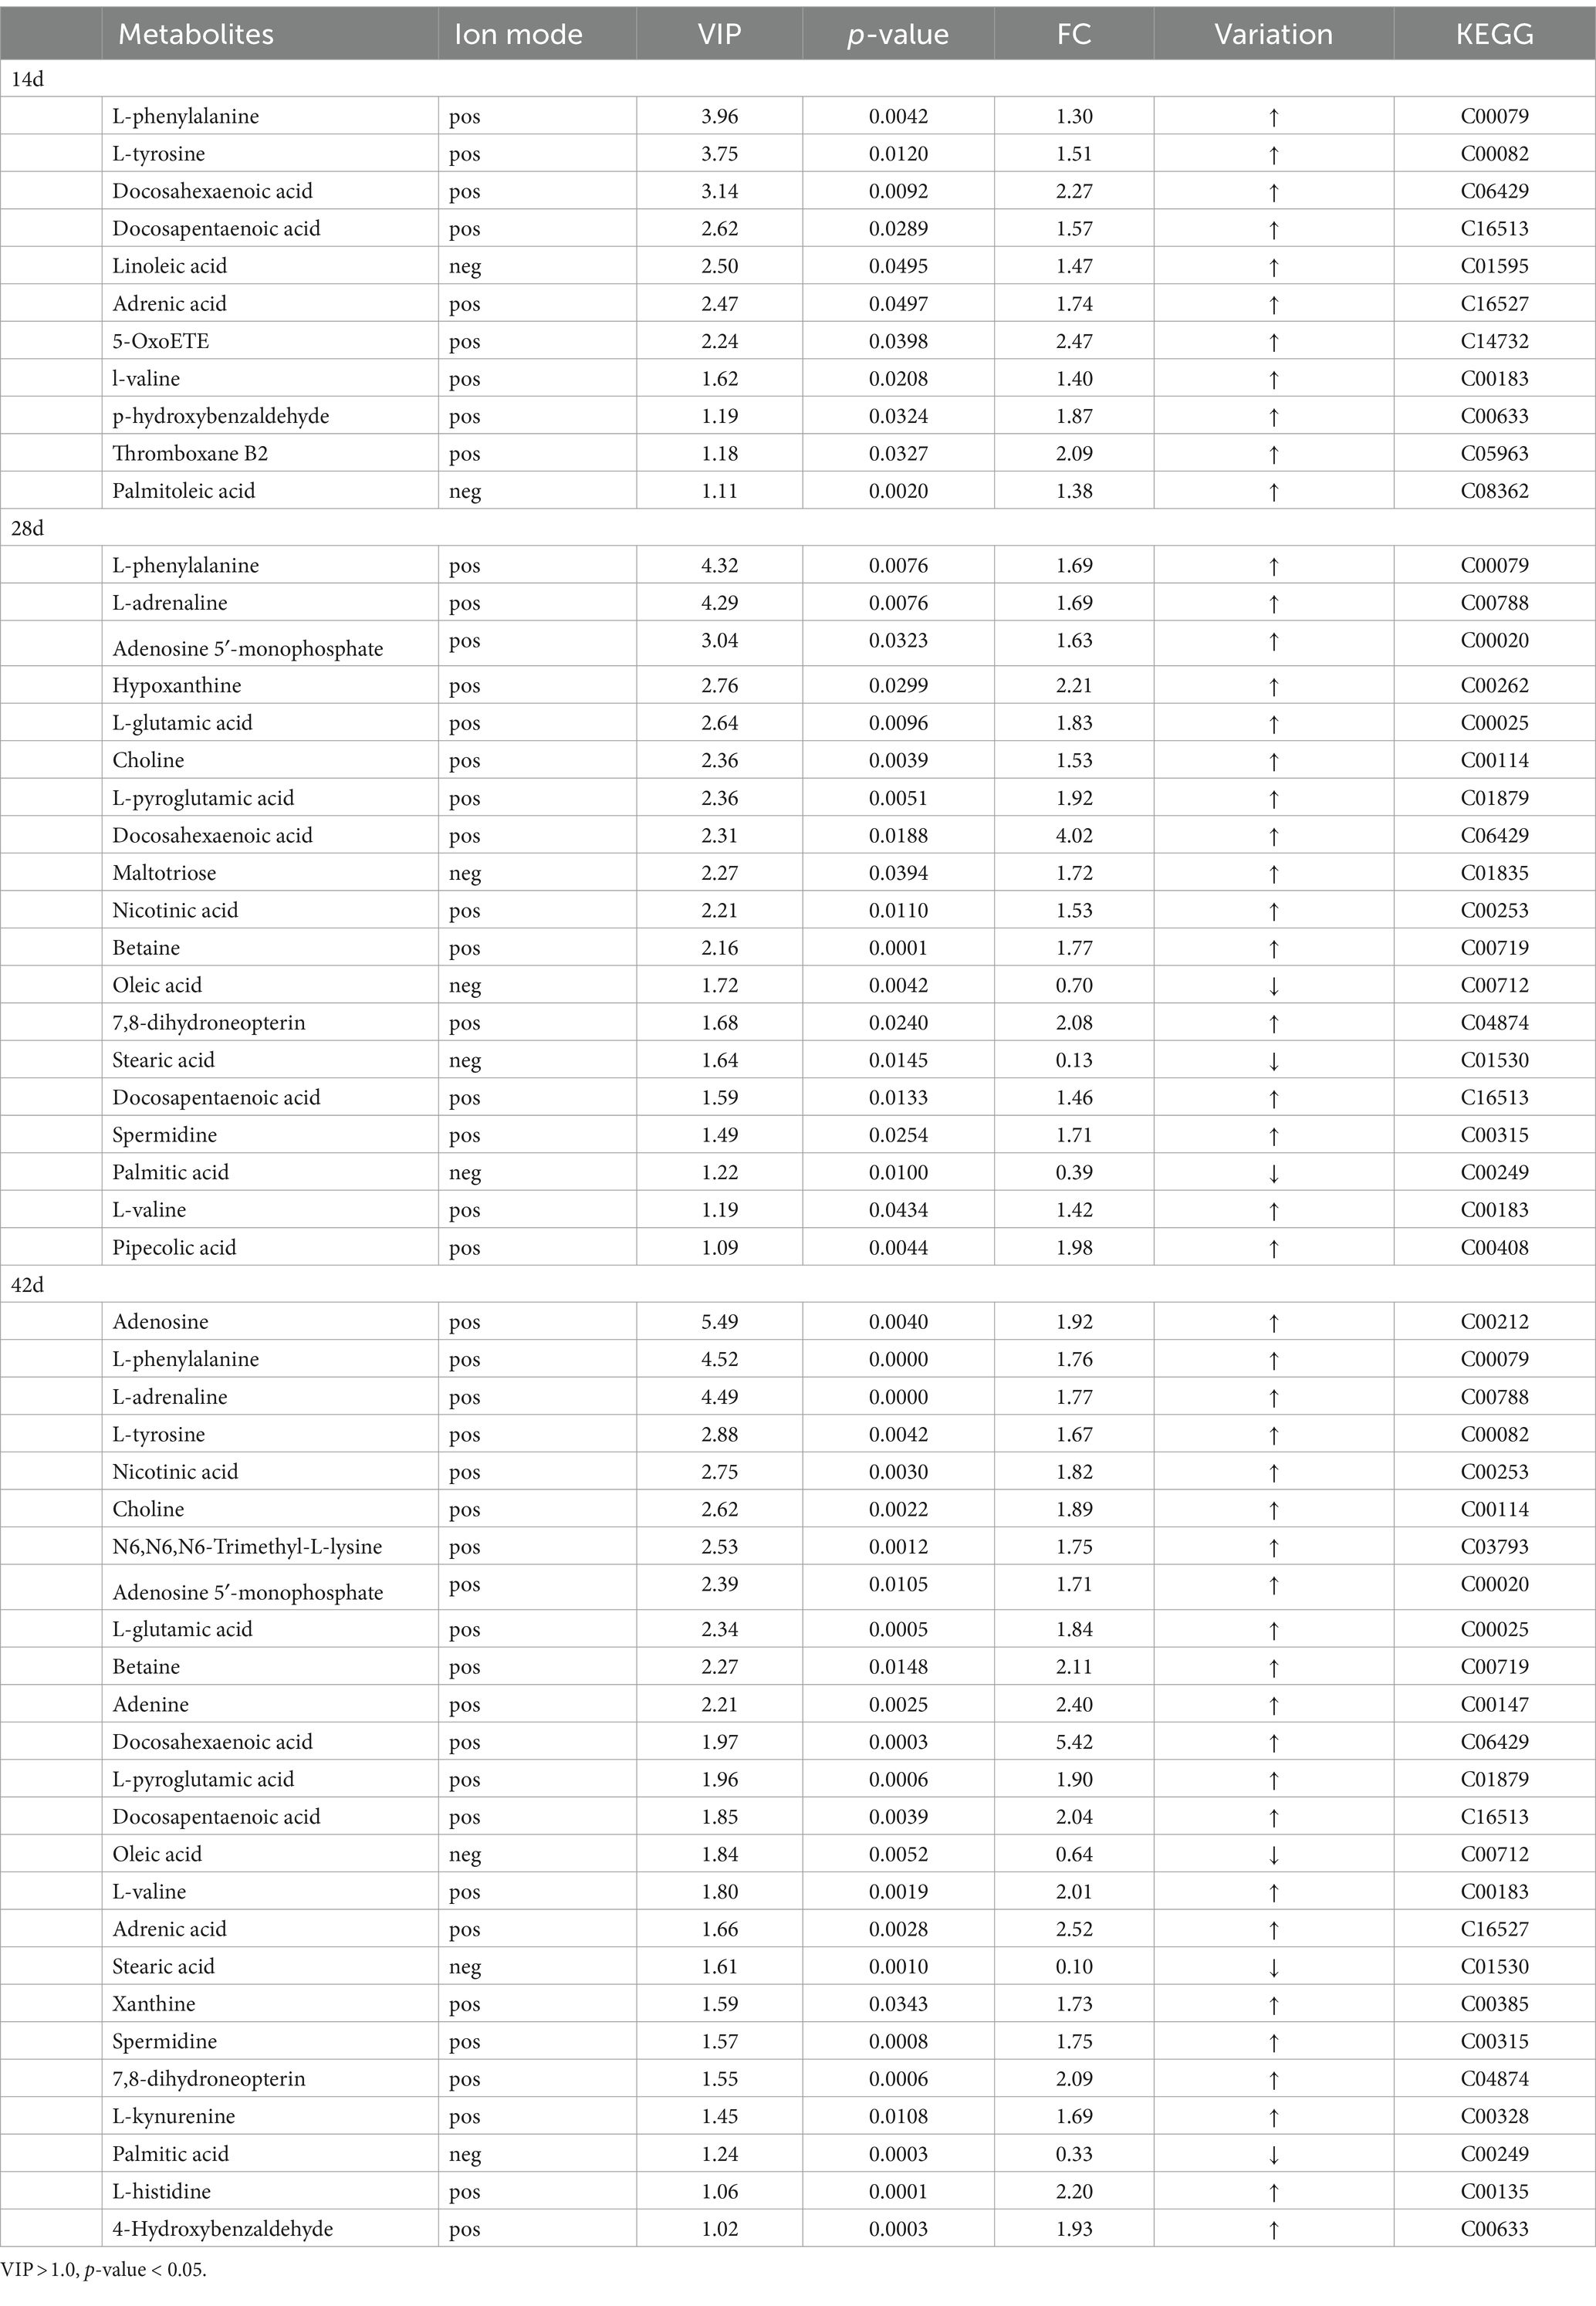
Table 2. Differential metabolites enriched into the pathway using KEGG.
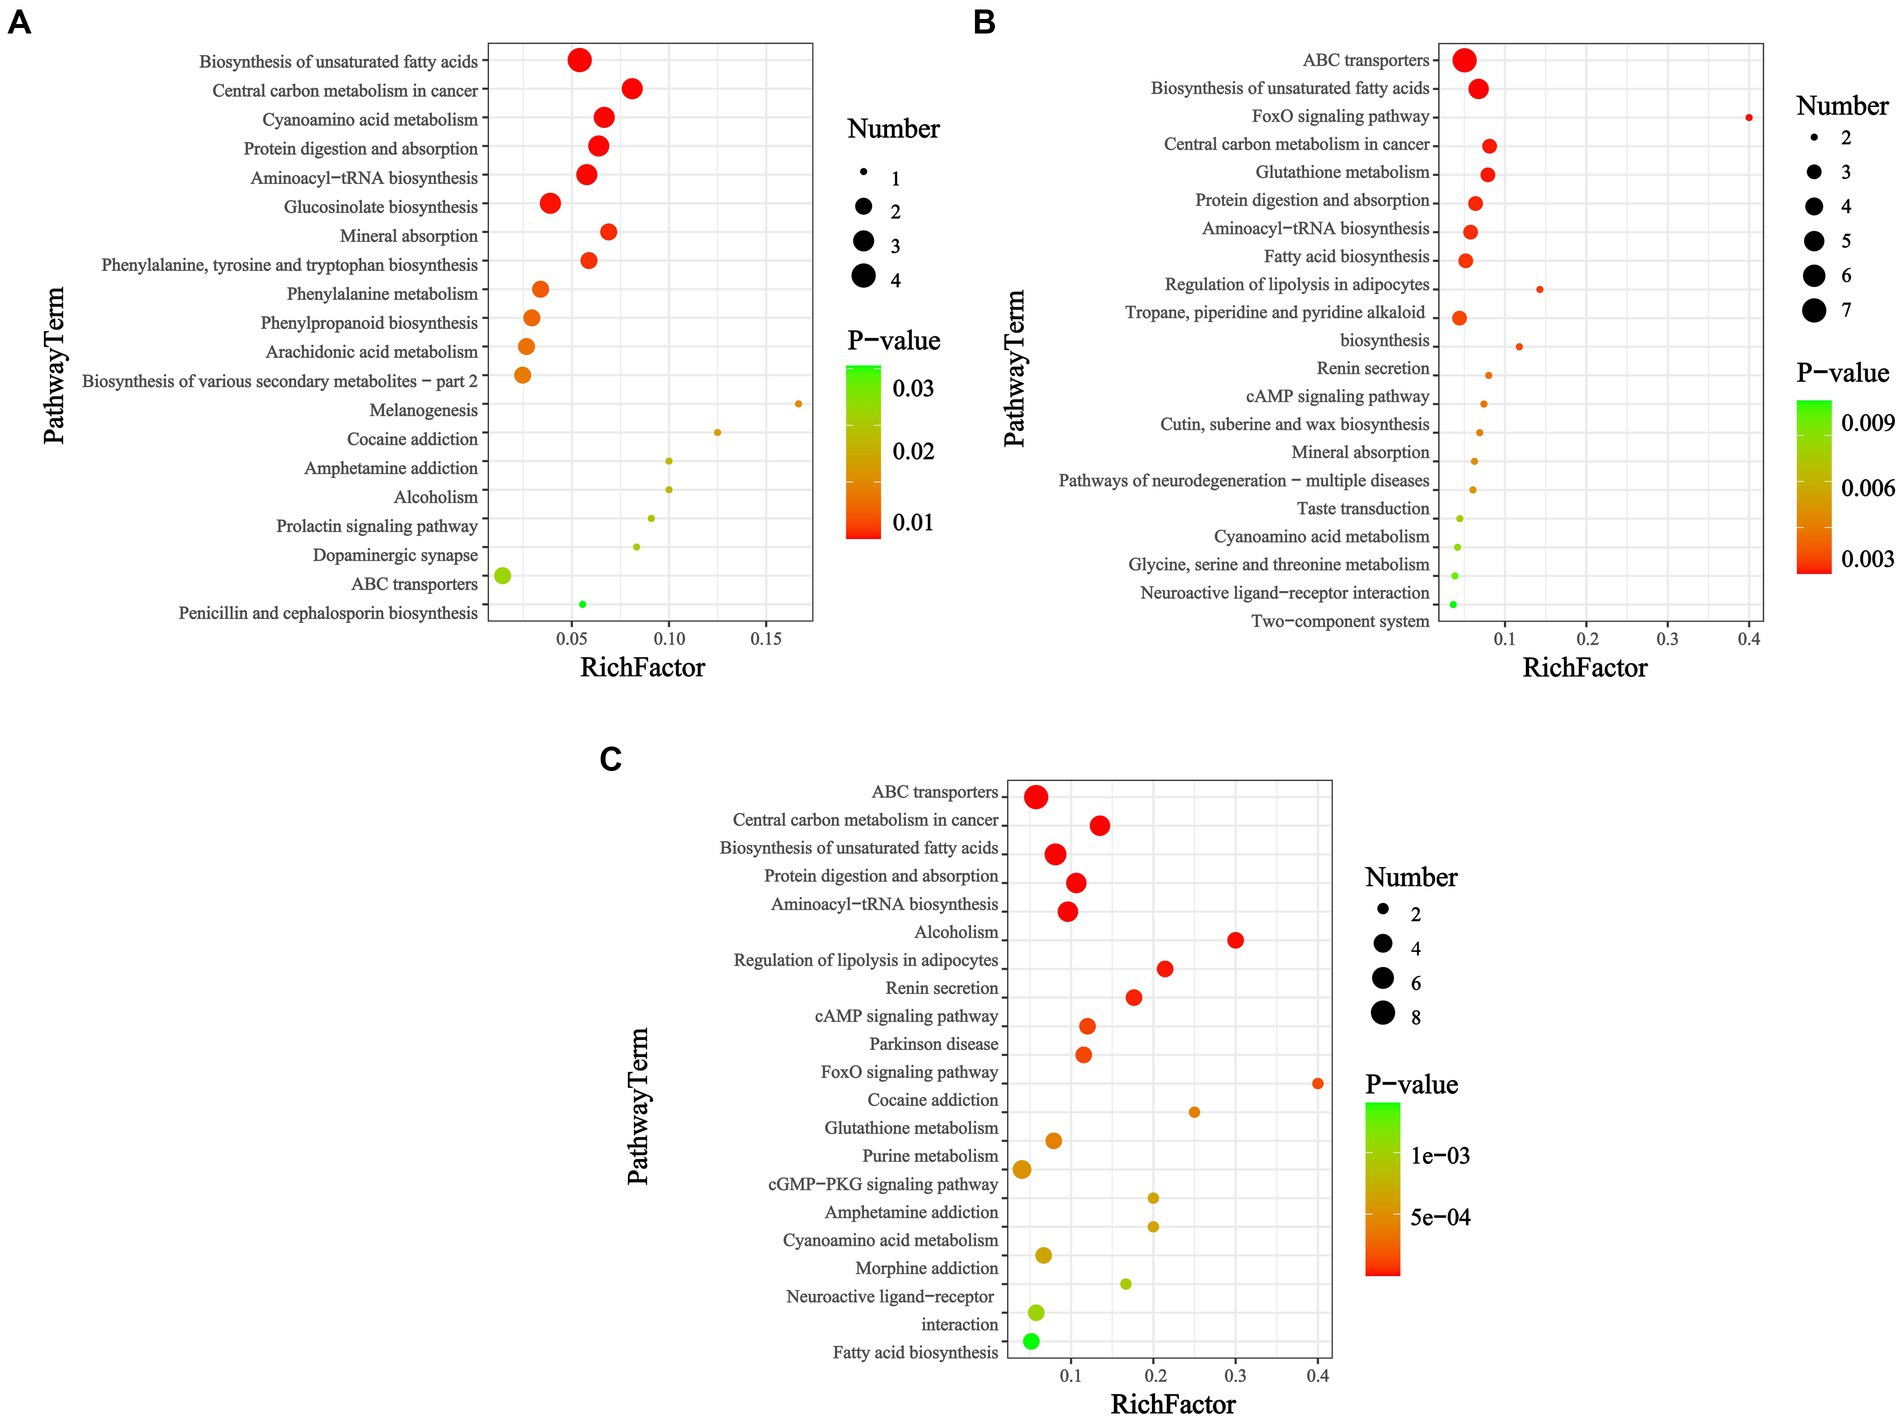
Figure 4. KEGG enrichment map of differential metabolites among groups (p < 0.05). Days (A) 14, (B) 28, and (C) 42. In the bubble diagram, each bubble represents a metabolic pathway. The larger the bubble, the greater the impact factor; the darker the bubble, the more significant the degree of enrichment.
KEGG pathways can be annotated into six categories: cellular processes, drug development, environmental information processing, genetic information processing, metabolism, and organic systems. Notably, among the metabolic categories, and in addition to the global and overview maps, a subset of KEGG classifications, such as lipid, amino acid, and carbohydrate metabolism, and the metabolism of cofactors and vitamins and xenobiotics biodegradation and metabolism were predominant. Among the organic system categories, the most involved pathways were those related to the digestive, endocrine, and nervous systems. Pathway enrichment analysis revealed that the biosynthesis of unsaturated fatty acids, fatty acid biosynthesis, purine metabolism, central carbon metabolism in cancer, protein digestion and absorption, aminoacyl-tRNA biosynthesis, ABC transporters, and glutathione metabolism were susceptible to disruption after feeding with M. aeruginosa.
3.5 Analysis of free amino acids
Free amino acids are important flavoring substances found in aquatic products. The classification and statistics of free amino acids with different flavor characteristics are shown in Figure 5. After 42 d, the Glu and Asp contents in the T group were significantly lower than those in the G group, however the umami amino acid levels in the G group were significantly higher than those in the initial group. Ser, Thr, and Gly were the most prominent contributors to sweetness in B. aeruginosa, and there was a considerable difference in these contributors between the two groups after 42 d. Compared to those at day 0, the sweet-tasting amino acid contents of the G group slightly increased, while that of the T group showed a considerable negative trend, with one amino acid, Ala, minimally changing over time. Among bitter-free amino acids, His was the most abundant, with a modest increase in levels in the G group and a highly significant increase in levels in the T group. In addition, the contents of Tyr and Phe also increased dramatically in the T group, whereas no discernible difference was observed for Met, Ile, Pro, and Leu. Overall, there was little change in the bitterness of the G group, whereas the quantity of bitter compounds in B. aeruginosa significantly increased after feeding with M. aeruginosa.
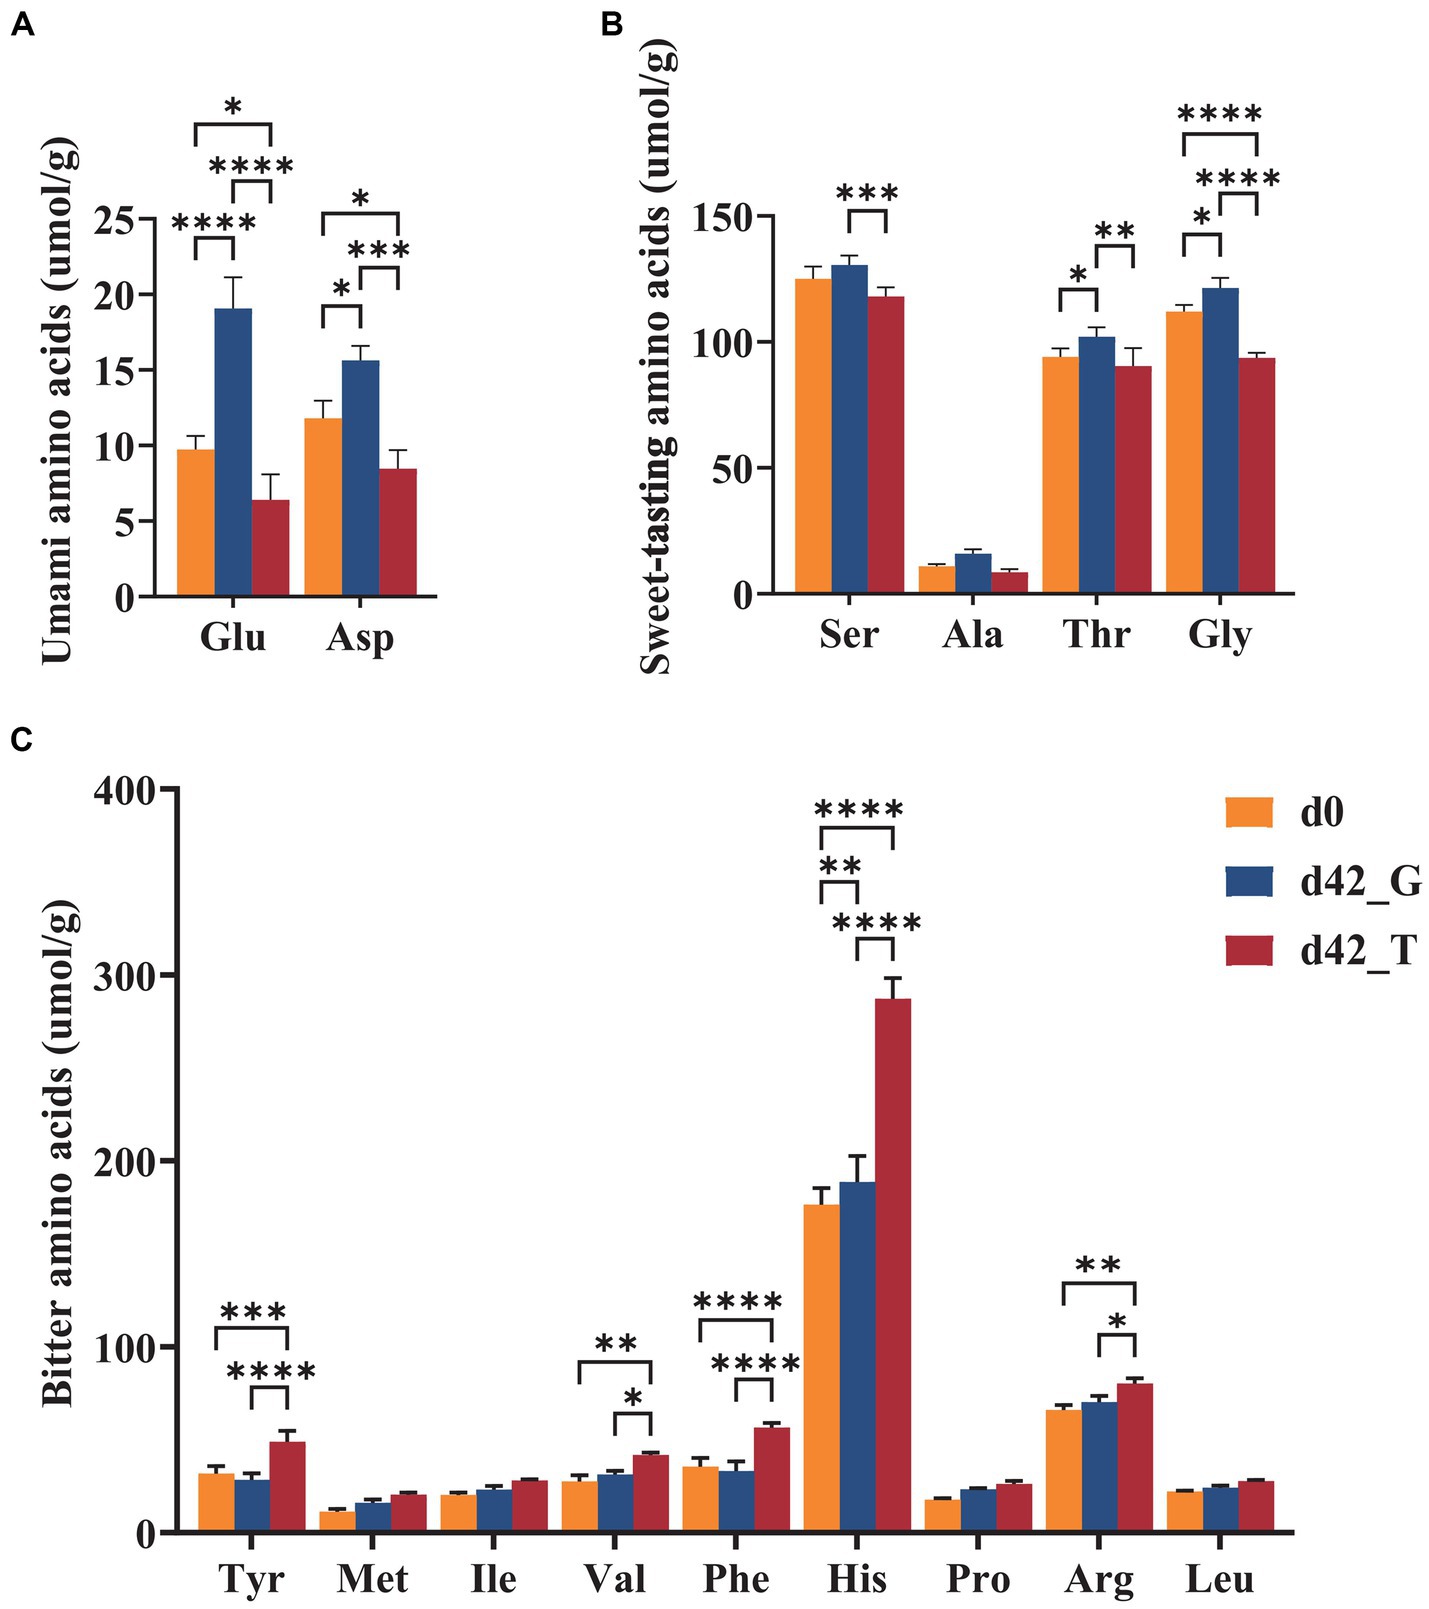
Figure 5. Contents of (A) umami, (B) sweet-tasting, and (C) bitter amino acids on days 0 and days 42 under the feeding of toxic M. aeruginosa or non-toxic C. vulgaris group (*p < 0.05, **p < 0.005, ***p < 0.001). Glu, glutamic acid; Asp., aspartic acid; Ser, serine; Ala, alanine; Thr, threonine; Gly, glicine; Tyr, tyrosine; Met, methionine; Ile, isoleucine; Val, valine; Phe, phenylalanine; His, histidine; Pro, proline; Arg, arginine; Leu, leucine.
3.6 Analysis of adenosine triphosphate and its related compounds
HPLC was used to separate and detect ATP and its related compounds in the snail muscles on days 0 and 42. Twelve ATP-associated products were effectively separated under the present chromatographic conditions within 35 min. As shown in Figure 6, after 42 days of feeding with M. aeruginosa, the ATP, ADP, AMP, IMP, HxR, and Hx contents were significantly changed (p < 0.05). Among these, ATP, ADP, AMP, and IMP contents were significantly reduced in group T, with averages of 1045.322, 1563.610, 217.270, and 1.573 mg/kg, respectively. Conversely, the contents of HxR and Hx were significantly higher, averaging 35.480 and 29.684 mg/kg, respectively. The levels of other ATP-associated substances (GMP, CMP, UMP, Xt, AdR, and Ad) did not significantly change.
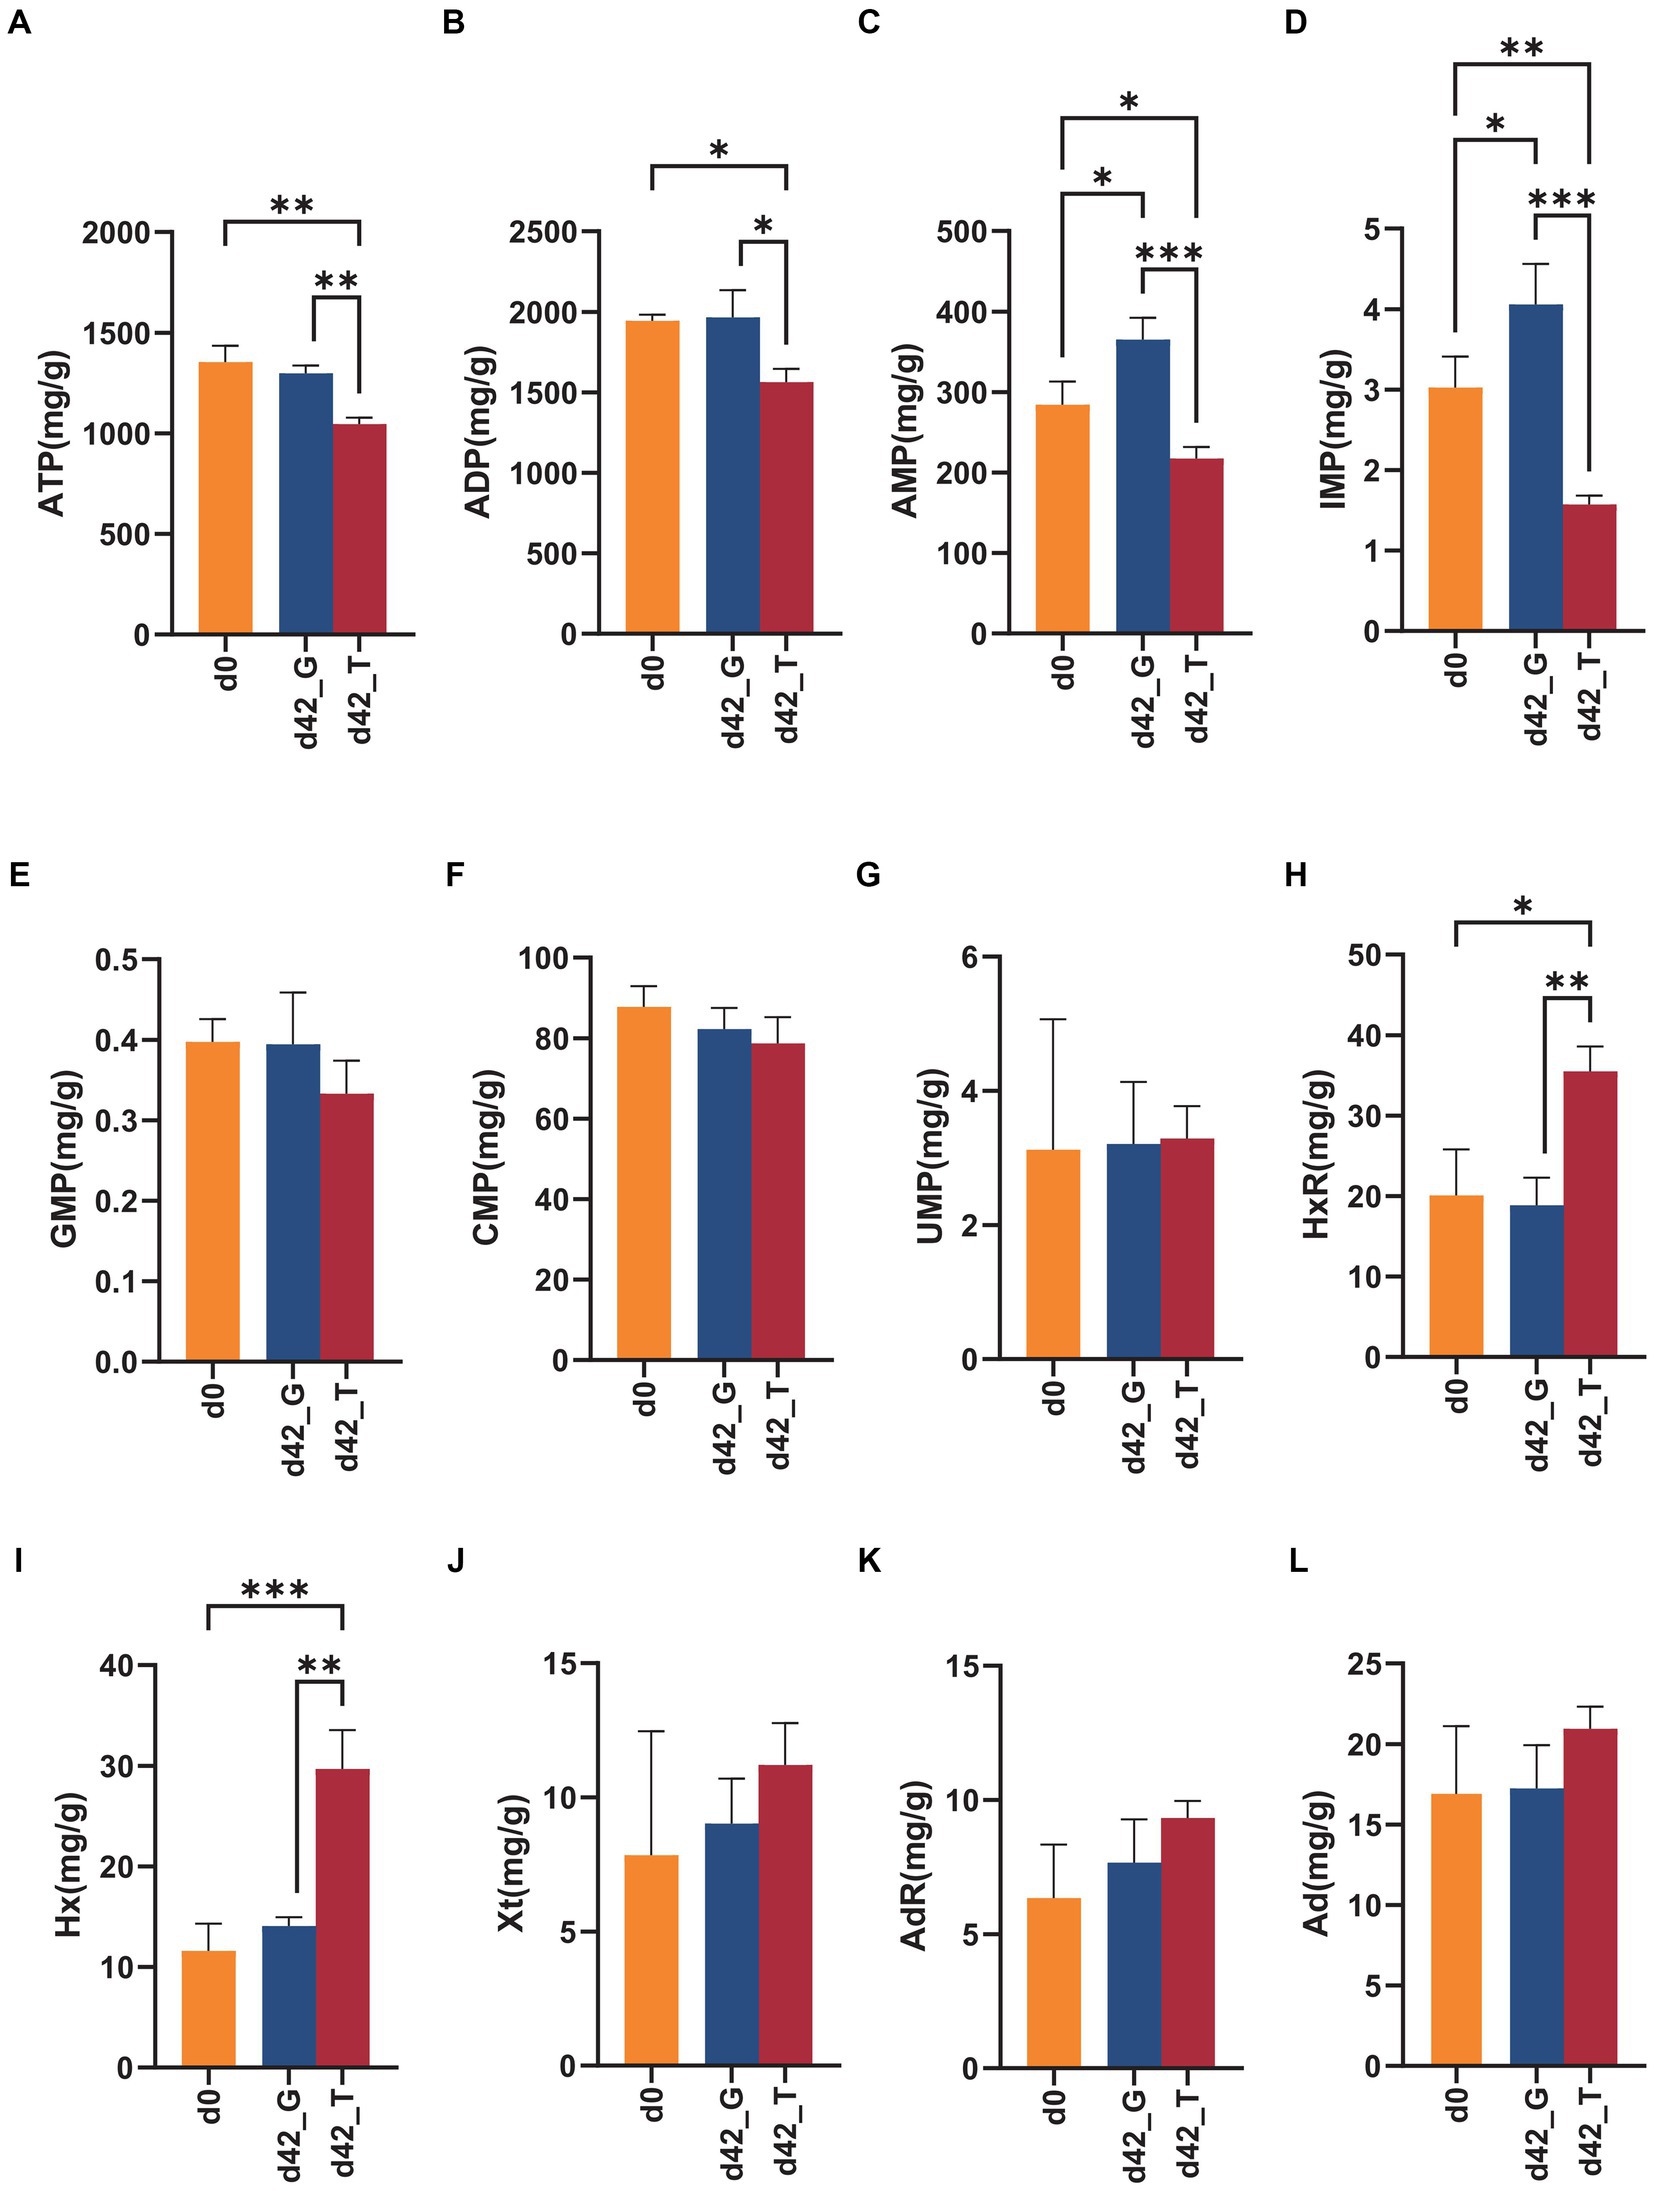
Figure 6. Changes in ATP and its related compounds on days 0 and days 42 under the feeding of toxic M. aeruginosa or non-toxic C. vulgaris group (*p < 0.05, **p < 0.005, ***p < 0.001). (A–L) represents the content of ATP, ADP, AMP, IMP, GMP, CMP, UMP, HxR, Hx, Xt, AdR and Ad in the two groups on days 0 and days 42, respectively.
4 Discussion
The relationship between toxic cyanobacteria and snail meat quality was investigated from multiple perspectives in this study (Figure 7). Non-targeted metabolomics analysis revealed changes in the relative levels of several metabolites, including stearic acid, docosapentaenoic acid (DPA), docosahexaenoic acid (DHA), adrenoic acid, choline, and L-Glu, which may affect biological pathways responsible for regulating meat flavor, such as unsaturated fatty acid biosynthesis, glutathione metabolism, and glycerophospholipid metabolism. However, combined with the quantitative detection of free amino acids and flavor nucleotides in the main edible parts, it was found that the concentration of umami and sweet substances such as Glu, Asp., Ser, Thr, Gly, ATP, AMP, and ADP significantly decreased in the cyanobacteria group, while that of bitter substances such as His, Tyr, Phe HxR, and Hx increased, revealing the adverse effects of cyanobacteria on the overall flavor and muscle quality of B. aeruginosa.
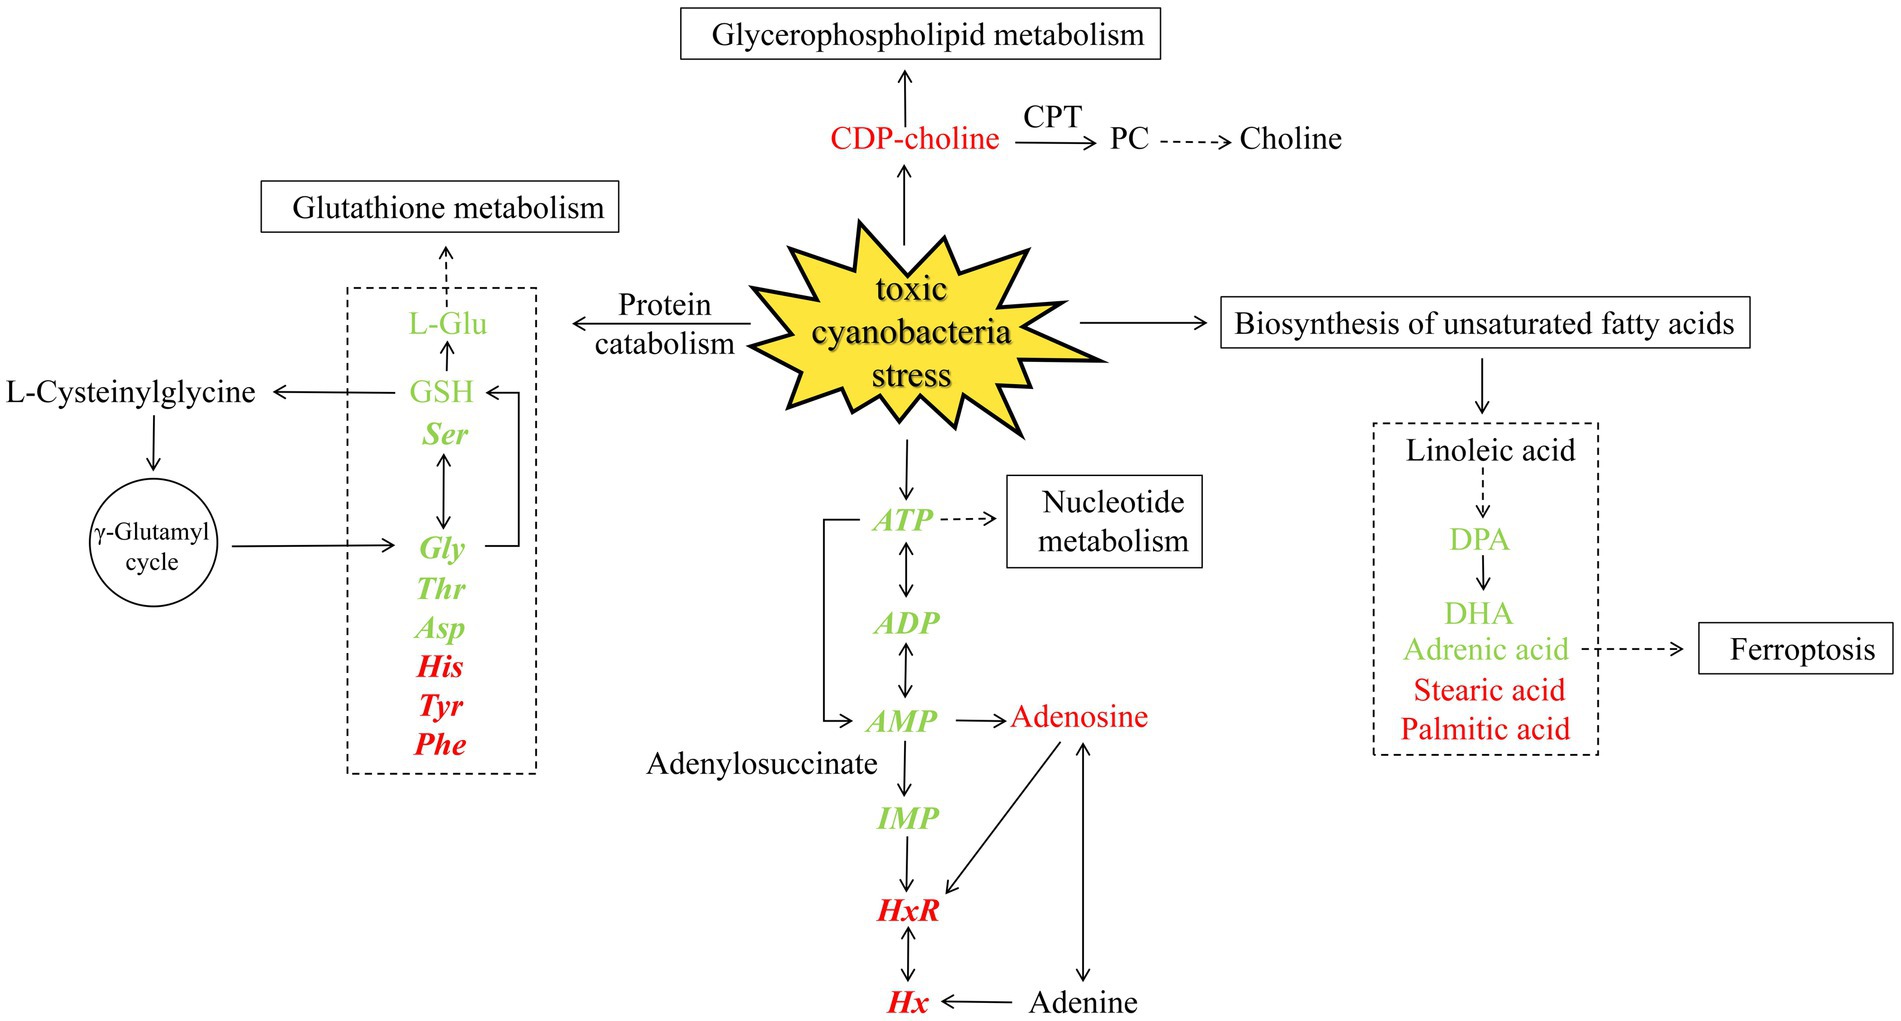
Figure 7. Metabolic pathways affected under toxic cyanobacteria stress. The color indicates increased (red) or decreased (green) metabolites. Quantitatively determined substances are shown in bold italics.
4.1 Differential metabolites associated with lipids, fatty acids, and derivatives
Mollusks typically contain a considerable proportion of n-3 (Omega-3) long-chain polyunsaturated fatty acids, such as eicosapentaenoic acid (EPA, C20:5) and DHA (C22:6) (Hernando et al., 2021; Ma et al., 2022). Similar results were observed in this study. Several studies have shown that lipid composition is closely related to the nutritional value, muscle quality, and taste characteristics of aquatic products (Yang et al., 2019; Liu X. W. et al., 2020; Liu Y. et al., 2020; Cheng et al., 2022). In the unsaturated fatty acid biosynthesis pathway, the DPA, DHA, and adrenoic acid contents in the G group were significantly higher than those in the T group on day 42, while the relative contents of stearic acid and palmitic acid in the T group were significantly higher than those in the G group (Supplementary Figure S1). The content of stearic acid (C18:0) is negatively correlated with flavor (Kimata, 2001), which may be due to the lack of stearoyl-CoA desaturase (SCD), an enzyme that plays a regulatory role in lipid metabolism and fatty acid synthesis. SCD could facilitate the biosynthesis of unsaturated fatty acids by co-conjugating palmitic acid (16:0) and stearic acid (18:0) to palmitoleic acid (16:1) and oleic acid (18:1) (Miyazaki et al., 2005; Piccinin et al., 2019). An SCD deficiency leads to the accumulation of C18:0 and an increase in fatty acid oxidation, affects the expression of anaerobic and anaerobic peptide genes, and inhibits feeding behavior and food intake (Wu et al., 2023), thereby negatively affecting the flavor quality of B. aeruginosa negatively. Additionally, in the glycerophospholipid metabolism, choline and choline phosphate contents in the G group were relatively higher than those in the T group on day 14, while on day 42, cytidine diphosphate choline (CDP-choline) and ethanolamine phosphate levels were noticeably increased in the T group. CDP-choline could react to form phosphatidylcholine (PC) through the action of cholinephosphotransferase (CPT). PCs seem to play a key role in the formation of volatile flavor compounds in meat, and the difference in lipid composition may be the cause of species-specific differences in meat flavor (Man et al., 2023), which may affect aromatic characteristics by influencing muscle phospholipid content and fat deposition levels (Cheng et al., 2024).
4.2 Differential metabolites associated with amino acids
After consuming M. aeruginosa, the concentrations of umami and sweet amino acids such as Glu, Asp., Ser, Thr, and Gly in B. aeruginosa obviously decreased, whereas those of bitter amino acids such as His, Tyr, and Phe increased in the T group. This change in amino acid content is consistent with the decreased palatability observed in fish and shrimp (Zhang et al., 2019; Cheng et al., 2021). On day 42, the T group showed a downregulation of L-Glu compared to the G group, which may have resulted in a decrease in glutathione (GSH) levels (Supplementary Figure S2). The exposure of snails to toxic cyanobacteria also resulted in decreased GSH levels (Zhu et al., 2011). As a primary flavoring agent in food, a decrease in GSH levels can result in poor taste. Glu and Gly are essential components in the synthesis of GSH, and their downregulation can suppress sweetness and umami, negatively affecting the flavor of meat (Zhang et al., 2022). After consuming cyanobacteria, the GSH content in aquatic animals often shows a downward trend (Yuan et al., 2016; Gavrilović et al., 2020; Wang Z. et al., 2023). Thus, we can use the dynamic changes of GSH as a potential indicator of M. aeruginosa affecting the flavor of B. aeruginosa. However, further research is required to determine the specific association between cyanobacteria and the mechanism underlying flavor production in B. aeruginosa.
Furthermore, decreased GSH levels may be a significant indicator of a decline in meat quality caused by ferroptosis (Liu et al., 2023). Toxic cyanobacterial exposure can cause ferroptosis in fish, affecting glutathione peroxidase activity (GPx4) and GSH content (Zhang et al., 2021). The expression of specific proteins related to ferroptosis, such as Slc7a11, Acsl4, and gpx4, was reduced following exposure to toxic cyanobacteria (unpublished data). The current study also revealed significant changes in the level of adrenic acid (AdA), a key upstream substance associated with ferroptosis (Supplementary Figure S3). The increase in AdA makes cells sensitive to ferroptosis (Lee et al., 2020), which may be a potential cause of reduced meat quality. Ferroptosis causes massive depletion of GSH, inhibiting the GPx4–GSH antioxidant system and further leading to the loss of endogenous cellular antioxidant capacity, thereby accelerating the process of fatty acid peroxidation (Stockwell, 2018). As the rate of apoptosis increases, the network structure becomes more disrupted, increasing water loss and decreasing fat content, which further changes meat quality characteristics (Hou et al., 2020).
4.3 Differential metabolites associated with nucleosides, nucleotides, and analogs
IMP, GMP, and AMP are the three primary flavor nucleotides and are crucial factors in the production of umami flavor, which is generally produced by the degradation of ATP (Yu et al., 2018). The nucleosides, nucleotides, and analogs detected in this study are mainly involved in nucleotide, purine, and glycerophospholipid metabolism. During nucleotide metabolism (Supplementary Figure S4), Hx, adenosine diphosphate ribose, and Xt contents showed a significant upward trend with increasing acclimation time in the T group. IMP and its decomposition products, Hx and HxR, are generally regarded as the primary biomarkers for meat quality, which help evaluate the differences in fresh meat quality, flavor, nutritional values, and functions (Hong et al., 2017; Wang et al., 2020; Cai et al., 2023). The rapid accumulation of Hx and HxR, the major contributors to off-flavor, can cause an unpleasant bitterness in meat, and their concentrations are negatively correlated with meat freshness (Özogul et al., 2010; Yu et al., 2018). In this study, the decrease in content of flavor substances, such as ATP, AMP, and ADP, and the increase in content of bitter purine analogs, such as HxR and Hx, produced by IMP degradation further confirmed the adverse effects of M. aeruginosa feeding on the overall flavor and muscle quality of B. aeruginosa, thereby reducing umami and deteriorating flavor. Furthermore, IMP may affect muscle fat deposition by regulating the expression of specific genes associated with lipid metabolism, thereby affecting the overall flavor of farmed animals (Gandemer, 2002). IMP impacts the AMP/ATP ratio and affects the fatty acid synthesis substrate levels and expression level of inflammatory cytokines (Cai et al., 2022).
5 Conclusion
In this study, we investigated the effect of M. aeruginosa on muscle metabolism in B. aeruginosa. UHPLC/MS untargeted metabolomics analysis revealed that toxic cyanobacteria stress significantly affected the composition of muscle fatty acids, amino acids, nucleotides, and related biological pathways. Notably, the adverse effects of cyanobacteria on the edible flavor and quality of snail muscle metabolites were confirmed via quantitative analysis of free amino acids and flavor nucleotides. In summary, we screened the differential muscle metabolites using omics techniques to reveal the relationship between muscle metabolic profiles and flavor quality of freshwater gastropods after consuming toxic cyanobacteria. In the future, we will further explore the molecular mechanism underlying these changes and improve the detection of additional food quality indices and sensory evaluations. This would help enrich our understanding of the nutritional value, flavor, and sensory quality of freshwater gastropods in response to different algae.
Data availability statement
The raw data supporting the conclusions of this article will be made available by the authors, without undue reservation.
Ethics statement
Ethical approval was not required for the study involving animals in accordance with the local legislation and institutional requirements because ethical review and approval was not required for the animal study because no endangered or protected marine species were involved. The studies were conducted in accordance with the local legislation and institutional requirements.
Author contributions
YH: Data curation, Investigation, Visualization, Writing – original draft. JZha: Writing – review & editing, Data curation, Funding acquisition. DX: Data curation, Writing – review & editing. XR: Writing – review & editing, Software, Validation. WY: Writing – review & editing, Methodology. KL: Methodology, Writing – review & editing. JZhu: Writing – review & editing, Conceptualization, Funding acquisition, Project administration, Supervision.
Funding
The author(s) declare that financial support was received for the research, authorship, and/or publication of this article. This research was funded by National Natural Science Foundation of China (42077219); Ningbo Jiangbei Public Welfare Technology Application Research Project (Grant No. 2023B04, 2022S209); Fujian Province – Indonesia Marine Food Joint Research and Development Center’ Research Project (Grant No. Y1-KF2205); and Key Laboratory of Marine Fishery Resources Exploitment and Utilization of Zhejiang Province (Grant No. SL2022007).
Conflict of interest
The authors declare that the research was conducted in the absence of any commercial or financial relationships that could be construed as a potential conflict of interest.
Publisher's note
All claims expressed in this article are solely those of the authors and do not necessarily represent those of their affiliated organizations, or those of the publisher, the editors and the reviewers. Any product that may be evaluated in this article, or claim that may be made by its manufacturer, is not guaranteed or endorsed by the publisher.
Supplementary material
The Supplementary material for this article can be found online at: https://www.frontiersin.org/articles/10.3389/fsufs.2024.1379140/full#supplementary-material
Footnotes
References
Cai, W., Fu, L., Liu, C., He, L., Liu, H., Han, D., et al. (2023). Dietary ribose supplementation improves flesh quality through purine metabolism in gibel carp (Carassius auratus gibelio). Anim. Nutr. 13, 50–63. doi: 10.1016/j.aninu.2022.12.006
Cai, W., Liu, H., Fu, L., Han, D., Zhu, X., Jin, J., et al. (2022). Dietary inosine monophosphate improved liver health and flesh quality of gibel carp (Carassius auratus gibelio) via activating AMPK signalling pathway and enhancing the contents of muscle fat and flavour substance. Front. Mar. Sci. 9:940732. doi: 10.3389/fmars.2022.940732
Chen, L., Giesy, J. P., Adamovsky, O., Svirčev, Z., Meriluoto, J., Codd, G. A., et al. (2021). Challenges of using blooms of Microcystis spp. in animal feeds: a comprehensive review of nutritional, toxicological and microbial health evaluation. Sci. Total Environ. 764:142319. doi: 10.1016/j.scitotenv.2020.142319
Cheng, X., Li, M., Leng, X., Wen, H., Wu, F., Yu, L., et al. (2021). Creatine improves the flesh quality of Pacific white shrimp (Litopenaeus vannamei) reared in freshwater. Food Chem. 354:129498. doi: 10.1016/j.foodchem.2021.129498
Cheng, K., Liu, T., Yang, C., Yang, H., and Liu, D. (2024). Relationship between phospholipid molecules species and volatile compounds in grilled lambs during the heating process. Food Chem. X 21:101113. doi: 10.1016/j.fochx.2023.101113
Cheng, Y., Zhao, J., Ayisi, C. L., and Cao, X. (2022). Effects of salinity and alkalinity on fatty acids, free amino acids and related substance anabolic metabolism of Nile tilapia. Aquacult. Fish. 7, 389–395. doi: 10.1016/j.aaf.2020.06.005
Gandemer, G. (2002). Lipids in muscles and adipose tissues, changes during processing and sensory properties of meat products. Meat Sci. 62, 309–321. doi: 10.1016/S0309-1740(02)00128-6
Gavrilović, B. R., Prokić, M. D., Petrović, T. G., Despotović, S. G., Radovanović, T. B., Krizmanić, I. I., et al. (2020). Biochemical parameters in skin and muscle of Pelophylax kl. Esculentus frogs: influence of a cyanobacterial bloom in situ. Aquat. Toxicol. 220:105399. doi: 10.1016/j.aquatox.2019.105399
Hernando, M., De Troch, M., de la Rosa, F., and Giannuzzi, L. (2021). Fatty acid response of the invasive bivalve Limnoperna fortunei fed with Microcystis aeruginosa exposed to high temperature. Comp. Biochem. Physiol. C Toxicol. Pharmacol. 240:108925. doi: 10.1016/j.cbpc.2020.108925
Hong, H., Regenstein, J. M., and Luo, Y. (2017). The importance of ATP-related compounds for the freshness and flavor of post-mortem fish and shellfish muscle: a review. Crit. Rev. Food Sci. Nutr. 57, 1787–1798. doi: 10.1080/10408398.2014.1001489
Hossain, S., Shukri, Z. N. A., Waiho, K., Ibrahim, Y. S., Minhaz, T. M., Kamaruzzan, A. S., et al. (2023). Microplastics pollution in mud crab (Scylla sp.) aquaculture system: first investigation and evidence. Environ. Pollut. 329:121697. doi: 10.1016/j.envpol.2023.121697
Hou, X., Liu, Q., Meng, Q., Wang, L., Yan, H., Zhang, L., et al. (2020). TMT-based quantitative proteomic analysis of porcine muscle associated with postmortem meat quality. Food Chem. 328:127133. doi: 10.1016/j.foodchem.2020.127133
Hu, F., Zhong, H., Wu, C., Wang, S., Guo, Z., Tao, M., et al. (2021). Development of fisheries in China. Reprod. Breed. 1, 64–79. doi: 10.1016/j.repbre.2021.03.003
Jin, W., Cao, X. J., Ma, X. Y., Lv, G. H., Xu, G. C., Xu, P., et al. (2022). Chromosome-level genome assembly of the freshwater snail Bellamya purificata (Caenogastropoda). Zool. Res. 43, 683–686. doi: 10.24272/j.issn.2095-8137.2022.118
Kimata, M. (2001). Studies on relationship between sensory evaluation and chemical composition in various breed of pork. Japanese J. Swine Sci. 38, 45–51. doi: 10.5938/youton.38.45
Lance, E., Brient, L., Carpentier, A., Acou, A., Marion, L., Bormans, M., et al. (2010). Impact of toxic cyanobacteria on gastropods and microcystin accumulation in a eutrophic lake (grand-lieu, France) with special reference to Physa (= Physella) acuta. Sci. Total Environ. 408, 3560–3568. doi: 10.1016/j.scitotenv.2010.04.050
Lee, J. Y., Nam, M., Son, H. Y., Hyun, K., Jang, S. Y., Kim, J. W., et al. (2020). Polyunsaturated fatty acid biosynthesis pathway determines ferroptosis sensitivity in gastric cancer. Proc. Natl. Acad. Sci. 117, 32433–32442. doi: 10.1073/pnas.2006828117
Lei, K., Qiao, F., Liu, Q., Wei, Z., An, L., Qi, H., et al. (2017). Preliminary evidence for snail deformation from a eutrophic lake. Environ. Toxicol. Pharmacol. 53, 219–226. doi: 10.1016/j.etap.2017.06.019
Liu, X. W., Feng, L., Jiang, W. D., Wu, P., Jiang, J., Yang, D. M., et al. (2020). (2-Carboxyethyl) dimethylsulfonium bromide (Br-DMPT) improves muscle flesh quality and antioxidant status of on-growing grass carp (Ctenopharyngodon idella) fed non-fish meal diets. Aquaculture 521:735065. doi: 10.1016/j.aquaculture.2020.735065
Liu, J., Hu, Z., Liu, D., Zheng, A., and Ma, Q. (2023). Glutathione metabolism-mediated ferroptosis reduces water-holding capacity in beef during cold storage. Food Chem. 398:133903. doi: 10.1016/j.foodchem.2022.133903
Liu, Y., Yang, M., Zheng, L., Nguyen, H., Ni, L., Song, S., et al. (2020). Antioxidant responses of triangle sail mussel Hyriopsis cumingii exposed to toxic Microcystis aeruginosa and thermal stress. Sci. Total Environ. 743:140754. doi: 10.1016/j.scitotenv.2020.140754
Luo, H., Chen, L., Jing, T., Sun, W., Li, Z., Zhou, M., et al. (2022). Muscle nutrition analysis of four snail species of Viviparidae. J. Fish. China 46, 2177–2185. doi: 10.11964/jfc.20210312705
Lyu, T., Zhu, J., Yang, X., Yang, W., and Zheng, Z. (2022). Responses of gut microbial community composition and function of the freshwater gastropod Bellamya aeruginosa to cyanobacterial bloom. Front. Microbiol. 13:906278. doi: 10.3389/fmicb.2022.906278
Ma, L. X., Huang, X. H., Zheng, J., Dong, L., Chen, J. N., Dong, X. P., et al. (2022). Free amino acid, 5′-nucleotide, and lipid distribution in different tissues of blue mussel (Mytilis edulis L.) determined by mass spectrometry based metabolomics. Food Chem. 373:131435. doi: 10.1016/j.foodchem.2021.131435
Mak Sau-Wa, V. (2022). “The Stinkier the better!”—a case study on the reinvention of river snail noodles and the transformation of taste in China. Glob. Food Hist., 1–21. doi: 10.1080/20549547.2022.2061816
Man, L., Ren, W., Qin, H., Sun, M., Yuan, S., Zhu, M., et al. (2023). Characterization of the relationship between lipids and volatile compounds in donkey, bovine, and sheep meat by UHPLC–ESI–MS and SPME–GC–MS. LWT 175:114426. doi: 10.1016/j.lwt.2023.114426
Miyazaki, M., Dobrzyn, A., Elias, P. M., and Ntambi, J. M. (2005). Stearoyl-CoA desaturase-2 gene expression is required for lipid synthesis during early skin and liver development. Proc. Natl. Acad. Sci. 102, 12501–12506. doi: 10.1073/pnas.0503132102
Özogul, F., Özden, Ö., Özoğul, Y., and Erkan, N. (2010). The effects of gamma-irradiation on the nucleotide degradation compounds in sea bass (Dicentrarchus labrax) stored in ice. Food Chem. 122, 789–794. doi: 10.1016/j.foodchem.2010.03.054
Piccinin, E., Cariello, M., De Santis, S., Ducheix, S., Sabbà, C., Ntambi, J. M., et al. (2019). Role of oleic acid in the gut-liver axis: from diet to the regulation of its synthesis via stearoyl-CoA desaturase 1 (SCD1). Nutrients 11:2283. doi: 10.3390/nu11102283
Pissia, M. Α., Matsakidou, A., and Kiosseoglou, V. (2021). Raw materials from snails for food preparation. Future Foods 3:100034. doi: 10.1016/j.fufo.2021.100034
Qiu, H., Lu, K., Zheng, Z., Wang, J., and Zhu, J. (2017). Blooms of toxic cyanobacteria cause the gastropod Bellamya aeruginosa to shift its diet from planktic to benthic material. Int. Rev. Hydrobiol. 102, 90–99. doi: 10.1002/iroh.201601859
Ren, X., Zhang, J., Huang, Y., Yang, W., Lu, K., and Zhu, J. (2023). Toxic cyanobacteria induce coupled changes in gut microbiota and co-metabolite of freshwater gastropods. Environ. Pollut. 338:122651. doi: 10.1016/j.envpol.2023.122651
Stockwell, B. R. (2018). Ferroptosis: death by lipid peroxidation. Free Radic. Biol. Med. 120:S7. doi: 10.1016/j.freeradbiomed.2018.04.034
Wang, Z., Guan, Y., Wang, Y., Zhu, S., Cui, C., and Wang, X. (2023). Transcriptome and histopathology analyses of the gills of Eriocheir sinensis provide novel insights into the molecular mechanism of Pb stress. Aquac. Int. 31, 3329–3344. doi: 10.1007/s10499-023-01126-3
Wang, M., Qiu, Y., Zhang, Z., Chen, Y., Qin, W., Guan, W., et al. (2023). Dual characteristics of Bellamya aeruginosa encountering Microcystis aeruginosa: algal control and toxin depuration. Ecotoxicol. Environ. Saf. 252:114596. doi: 10.1016/j.ecoenv.2023.114596
Wang, G., Sun, J., Yao, Y., An, X., Zhang, H., Chu, G., et al. (2020). Detection of inosine monophosphate (IMP) in meat using double-enzyme sensor. Food Anal. Methods 13, 420–432. doi: 10.1007/s12161-019-01652-y
Wu, W., Sun, B., He, H., Cao, X., and Gao, J. (2023). Scd knockout activates β-oxidation of fatty acids via accumulating stearic acid (18: 0) and induces anorexia in zebrafish. Gene 871:147431. doi: 10.1016/j.gene.2023.147431
Yang, B., Jiang, W. D., Wu, P., Liu, Y., Zeng, Y. Y., Jiang, J., et al. (2019). Soybean isoflavones improve the health benefits, flavour quality indicators and physical properties of grass carp (Ctenopharygodon idella). PLoS One 14:e0209570. doi: 10.1371/journal.pone.0209570
Yang, W., Ye, Y., Lu, K., Zheng, Z., and Zhu, J. (2022). NMR-based metabolomic responses of freshwater gastropod Bellamya aeruginosa to MC-producing and non MC-producing Microcystis aeruginosa. J. Oceanol. Limnol. 40, 260–272. doi: 10.1007/s00343-021-0336-2
Yang, X., Zhu, J., Hu, C., Yang, W., and Zheng, Z. (2023). Integration of transcriptomics and Microbiomics reveals the responses of Bellamya aeruginosa to toxic Cyanobacteria. Toxins 15:119. doi: 10.3390/toxins15020119
Ye, B., Hirano, T., Saito, T., Dong, Z., Do, V. T., and Chiba, S. (2021). Molecular and morphological evidence for a unified, inclusive Sinotaia quadrata (Caenogastropoda: Viviparidae: Bellamyinae). J. Molluscan Stud. 87:eyab013. doi: 10.1093/mollus/eyab013
Yu, D., Xu, Y., Regenstein, J. M., Xia, W., Yang, F., Jiang, Q., et al. (2018). The effects of edible chitosan-based coatings on flavor quality of raw grass carp (Ctenopharyngodon idellus) fillets during refrigerated storage. Food Chem. 242, 412–420. doi: 10.1016/j.foodchem.2017.09.037
Yuan, J., Gu, Z., Zheng, Y., Zhang, Y., Gao, J., Chen, S., et al. (2016). Accumulation and detoxification dynamics of microcystin-LR and antioxidant responses in male red swamp crayfish Procambarus clarkii. Aquat. Toxicol. 177, 8–18. doi: 10.1016/j.aquatox.2016.05.004
Zhang, X., Han, L., Hou, S., Raza, S. H. A., Wang, Z., Yang, B., et al. (2022). Effects of different feeding regimes on muscle metabolism and its association with meat quality of Tibetan sheep. Food Chem. 374:131611. doi: 10.1016/j.foodchem.2021.131611
Zhang, N., Wang, W., Li, B., and Liu, Y. (2019). Non-volatile taste active compounds and umami evaluation in two aquacultured pufferfish (Takifugu obscurus and Takifugu rubripes). Food Biosci. 32:100468. doi: 10.1016/j.fbio.2019.100468
Zhang, X., Wang, A., Yao, H., Zhou, W., Wang, M., Liang, B., et al. (2023). Research advancements on the flavor compounds formation mechanism of pickled bamboo shoots in river snails rice noodles. LWT 186:115226. doi: 10.1016/j.lwt.2023.115226
Zhang, Y., Wu, D., Fan, Z., Li, J., Gao, L., Wang, Y. E., et al. (2021). Microcystin-LR induces ferroptosis in intestine of common carp (Cyprinus carpio). Ecotoxicol. Environ. Saf. 223:112610. doi: 10.1016/j.ecoenv.2021.112610
Keywords: Bellamya aeruginosa, Microcystis aeruginosa, cyanobacterial bloom, muscle metabolism, free amino acids, nucleotides, flavor quality
Citation: Huang Y, Zhang J, Xu D, Ren X, Yang W, Lu K and Zhu J (2024) Metabolomics revealed that toxic cyanobacteria stress reduced the flavor quality of Bellamya aeruginosa. Front. Sustain. Food Syst. 8:1379140. doi: 10.3389/fsufs.2024.1379140
Edited by:
Roberto Anedda, Parco Scientifico e Tecnologico della Sardegna, ItalyReviewed by:
Da Sun, Wenzhou University, ChinaCao Rong, Chinese Academy of Fishery Sciences (CAFS), China
Datao Lin, Sun Yat-sen University, China
Copyright © 2024 Huang, Zhang, Xu, Ren, Yang, Lu and Zhu. This is an open-access article distributed under the terms of the Creative Commons Attribution License (CC BY). The use, distribution or reproduction in other forums is permitted, provided the original author(s) and the copyright owner(s) are credited and that the original publication in this journal is cited, in accordance with accepted academic practice. No use, distribution or reproduction is permitted which does not comply with these terms.
*Correspondence: Dalun Xu, eHVkYWx1bkBuYnUuZWR1LmNu; Jinyong Zhu, emh1amlueW9uZ0BuYnUuZWR1LmNu