 Qingbin Wang
 Emmanuel Owoicho Abah
 Mark Cannella
- University of Vermont, Burlington, VT, United States
While maple syrup as an iconic sweetener predominantly produced in Canada and the United States has experienced significant growth in the past four decades, the industry faces many climate, economic, and policy challenges. This study reviews the industry’s development, analyzes the major challenges faced by the industry, and derives recommendations for addressing such challenges and moving towards more sustainable development. Specifically, data from Canadian and U.S. government agencies and other sources is used to trace the industry’s development, examine the correlation between U.S. and Canadian maple syrup production and producer prices, assess the market impacts of Quebec’s production quota system, and discuss potential strategies. Historical data indicates that the maple syrup industry in both nations has experienced significant growth in production since the early 1980s but also increased volatility in both sap yield and maple syrup output, downward trends in producer prices, rising production costs, and increasing impacts of trade disputes and retaliations. Empirical analysis suggests that the production quota system in Quebec started in 2004 has limited the region’s production growth as compared to other major production regions, stabilized its producer prices around a level that is lower than the prices received in the late 2000s, and likely affected the prices received by U.S. maple syrup producers. Major recommendations from this study include shifting the focus from supply-side interventions to include more demand-side enhancement, increasing investment in technical innovation and climate mitigation, developing more value-added maple syrup products, and strengthening the marketing and promotion efforts to increase the demand for maple syrup in the domestic and foreign markets.
1 Introduction
As a natural sweetener derived from boiling and condensing the sap of certain maple trees, maple syrup has been predominantly produced in Eastern Canada and the Northeastern United States for centuries. It has been an iconic symbol of this region’s agriculture, food, community, landscape, culture, and trade (Hinrichs, 1998; Houle and Duchesne, 2020; Murphy et al., 2012). Europeans documented the tapping of sugar maple trees, collection of sap and production of sweeteners by native people roughly 500 years ago as Europeans began their settlement in North America (Massachusetts Maple Producers Association, 2024; Peters et al., 2020). While maple syrup is a characteristic product of maple sap’s thermal processing (boiling and evaporation) (Hopkins, 2017; Randall et al., 2006), it has been progressively transformed from a local sweetener into a globally recognized product with remarkable economic contributions (Bal et al., 2015; Bishop et al., 2015; Farrell and Chabot, 2012; McConnell and Graham, 2016; Taylor, 1965). For example, the maple syrup industry provided 12,582 full-time jobs, contributed 1.13 billion Canadian dollars (C$) to the Canadian GDP, and generated C$235 million in tax revenue in 2022 (QMSP, 2024). In the United States, although the annual production value of maple syrup has been around only $150–210 million in recent years, it has been a vital economic sector in the Northeastern states and provided a significant source of employment and income for many rural communities through direct, indirect and induced contributions (Becot et al., 2015; Gabe, 2014; Hershberger et al., 2024; Murphy et al., 2012; Taylor, 1965; Whitney and Upmeyer, 2004). For example, Becot et al. (2015) estimated the maple industry’s total economic contribution in the state of Vermont to be $330 million in 2013, with the direct, indirect, and induced contributions to be $222 million, $61 million, and $47 million, respectively. With a total population of only around 626,000 in 2013, the industry’s economic contribution was $527 per capita in Vermont. The same study also reported that the maple syrup industry provided about 4,520 jobs in Vermont in 2013. With maple syrup as its second largest agricultural commodity behind dairy products, Vermont has been the largest maple syrup producer in the United States and has accounted for about 54% of the U.S. production in recent years (USDA NASS, 2024).
The history of maple sugaring has spanned centuries and intertwined the traditions of native people with European settlers in North America (Huron, 2014). Native Americans are often credited as the earliest practitioners of harvesting maple sap for sugar and syrup production. Spencer (1913) suggested that native people were the first to process maple sap into granular sugar and liquid sweeteners, and Pendergast (1982) stated that the traditional knowledge of native people was foundational to their cultures and economies related to maple sugaring. European settlers in North America also played significant roles in transitioning maple sugaring with different technologies and toward commercial production. Schuette and Idhe (1946) also noted this exchange of knowledge and practices between native peoples and Europeans in the development of maple syrup production in North America. Early commercial maple syrup production initially centered in the United States, but most of the production gradually shifted northward to Quebec in the early 19th century (Farrell and Chabot, 2012). Canada surpassed the United States in maple syrup production around 1940 and has remained the world’s largest producer and exporter of maple products ever since (Farrell and Chabot, 2012; Huron, 2014). The production techniques and cultural significance surrounding maple sugaring have evolved over time, reflecting a blend of native traditions and European influences that continues to shape the maple industry today (Huron, 2014).
As shown in Figure 1, maple syrup production in Canada fluctuated around 3.0 million gallons (in U.S. gallons, 1 Canadian or imperial gallon is equal to 1.2 U.S. gallons) from 1924 to 1990 and has grown significantly since the early 1990s. It reached a record high of 23.88 million gallons in 2024. While USDA NASS has published data on U.S. maple syrup production for only the years since 1975, the production was around 1.2 million gallons from 1975 to 2005 but has increased significantly since 2005 and reached a record high of 6.0 million gallons in 2022 and a slightly lower level of 5.86 million gallons in 2024 (USDA NASS, 2024). A correlation analysis of maple syrup productions in the two countries from 1976 to 2024 yielded a correlation coefficient of 0.934, suggesting that the Canadian and U.S. maple syrup productions are strongly and positively correlated over time.
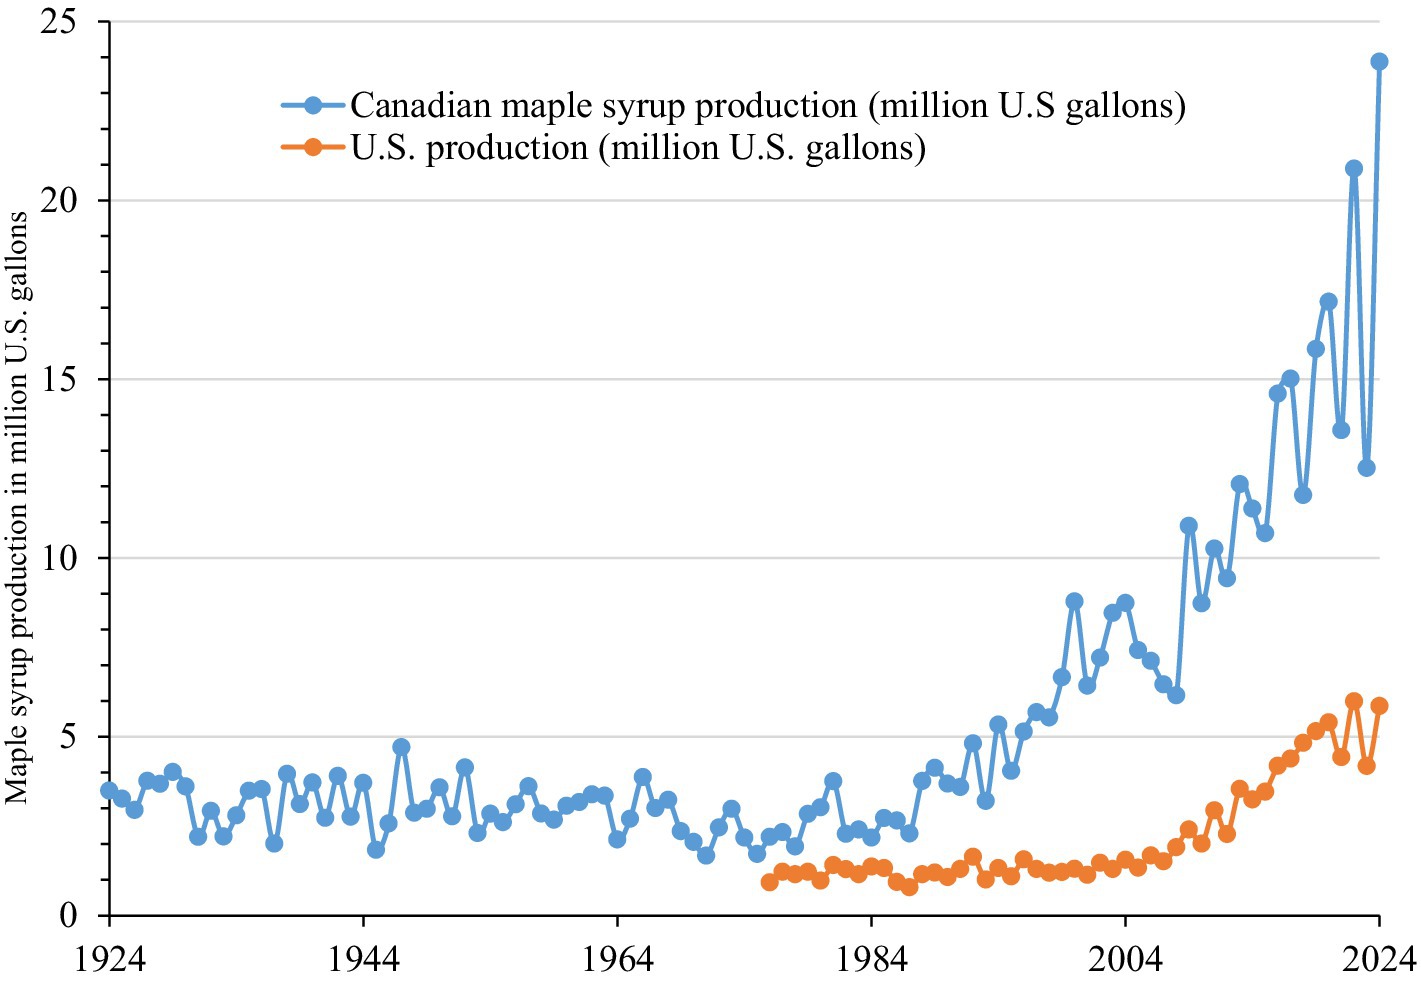
Figure 1. Canadian and U.S. maple syrup production (million U.S. gallons). Data sources: Statistics Canada (2024) and USDA NASS (2024).
Maple syrup has emerged from a local sweetener in Eastern Canada and the Northeastern United States into a globally recognized commodity and its trade in both domestic and foreign markets has increased rapidly in the past three decades (Wang et al., 2024). Canada has been the world’s largest maple syrup exporter since the early 1980s, accounting for about 75% of the global exports in terms of both quantity and value (United Nations Comtrade Database (UNCD), 2024). On the other hand, the United States has been the largest maple syrup importer in the world for decades. For example, in 2023, Canada exported 12.96 million gallons of maple syrup, which amounted to C$615 million and accounted for about 62% of its total production (Statistics Canada, 2024). The United States, in the same year, imported 8.07 million gallons or $278 million of maple syrup, equivalent to about 80% of its domestic production or 43% of its total domestic consumption (USDA NASS, 2024; UNCD, 2024).
When maple syrup transitioned from a sweetener predominantly produced for local consumption to a large commodity traded in local, regional, national, and international markets, various government regulations were developed and implemented for its production, grading, quality standards, inspection, storage, and transportation, particularly in Quebec. For example, as the largest maple producer association with about 7,300 members, QMSP has played very important roles in Quebec’s maple syrup industry and significantly impacted the maple syrup markets in Quebec, Canada, the United States, and worldwide. Because both Quebec and Canadian governments have granted QMSP certain legal power of supply control and management, QMSP has set mandatory production quotas for its members, managed the world’s only maple syrup reserve, invested in market development, patrolled producers and potential buyers in Quebec, and issued fines or even seized maple syrup from members who violated the quota regulations (Austen, 2015).
While the market impacts and legal debate about QMSP’s quota system have been reported by the media (e.g., Austen, 2015; Kuitenbrouwer, 2023; Metraux, 2022; Moreau, 2018), there are very limited empirical studies on the market impacts of Quebec’s maple syrup production quota system. This study will address research questions about the production quota system’s market impacts through data analysis later in this paper.
The unique characteristics of maple syrup, such as its production concentration in only Eastern Canada and the Northeastern United States and Quebec’s production quota system implemented since 2004, may provide excellent cases for studying economic and legal issues of food commodities. However, there are very limited academic studies on this iconic product in the literature, especially empirical studies based on data analysis. There is a growing need for empirical studies to address important issues that have been widely reported by the media (e.g., Austen, 2015; Kuitenbrouwer, 2023; Metraux, 2022; Moreau, 2018). The major purpose of this study is to review the maple syrup industry’s development, examine its major climate, economic and legal challenges, and derive policy recommendations for addressing such challenges and moving towards more sustainable development. Specifically, data from USDA NASS, Statistics Canada, and other sources are used to trace the industry’s development, examine the correlation between U.S. and Canadian maple syrup production and producer prices, assess the market impacts of Quebec’s production quota system, and derive policy recommendations. The specific research questions to be addressed in this study include: (1) What are the development and trends of maple syrup production and producer prices in Canada and the United States? (2) what are the major challenges faced by the maple syrup industry in the two countries? (3) how has Quebec’s production quota system started in 2004 affected the maple syrup production and price in Quebec, Canada, and the United States? (4) what are the correlations between U.S. and Canadian maple syrup production and producer prices? and (5) what are some strategies for the industry to address the challenges and move towards more sustainable development?
In the rest of this paper, Section 2 introduces the data sources and analysis methods, Section 3 discusses the major challenges faced by the maple syrup industry, Section 4 presents empirical analysis results regarding our research questions, Section 5 discusses potential strategies and actions for the industry to consider, and Section 6 summarizes the major conclusions and recommendations.
2 Data sources and methods of analysis
The primary data sources for this study are USDA NASS and Statistics Canada. Both government agencies have published significant amounts of time-series data on maple syrup as a significant agricultural commodity in the United States and Canada. For example, Statistics Canada has published maple syrup output and value since 1924 at the national level, as well as for Quebec and other major production provinces (Statistics Canada, 2024). Great efforts have been made to check data consistency from alternative government publications and websites. For example, the annual data published by USDA NASS every June in recent years has been updated and corrected in the following year’s publication, and such updates and corrections have been incorporated into the data used in this study (USDA NASS, 2024). Also, the different units used in the two nations have been converted to be the same for comparing the production and producer prices between Canada and the United States. For example, Canada uses “imperial gallon” and one imperial gallon is equal to 1.2 U.S. gallons. The production quantity used in this paper is in U.S. gallons for both the United States and Canada. Also, when the U.S. producer price is compared to the Canadian producer price, the official exchange rate between the U.S. dollar ($) and C$ is used to convert the Canadian price into the unit of $ per gallon. In addition to data from USDA NASS and Statistics Canada, data from QMSP and several previous studies was also collected and used in this study, principally for crosschecking purposes.
The above data has been analyzed to address the research questions listed in the introduction through graphical, correlation, and regression analyses. While graphical analysis is used to trace the trends of maple syrup production and producer prices in both Canada and the United States, correlation analysis is conducted to assess the relationship between Canadian and U.S. producer prices. Also, to examine the marginal impacts of Canadian producer price and Quebec’s production quota system implemented since 2004 on U. S. producer price, a regression model is estimated using the time-series data from 1983 to 2021.
3 Climate, economic and policy challenges of the maple syrup industry
Maple syrup production in both Canada and the United States has grown significantly since the early 1980s (see Figure 1) due to increasing demand in North America and around the world, technical progress in the sugaring process and efficiency, and increased investment in production, research, and Extension (Farrell and Chabot, 2012; Whitney and Upmeyer, 2004). The adoption of new technologies, such as reverse osmosis machines, plastic tubing, vacuum systems, and more efficient evaporators, has significantly increased maple syrup production and yield. For example, the reverse osmosis machine, based on a combination of fine and semi-permeable membranes and an electronic pump system, can separate water from sugar, minerals, and other suspended solids in maple sap and allows maple producers to reduce the amount of water that must be evaporated from the sap to concentrate the maple syrup to its final density. Cotnoir (2021) reported that reverse osmosis machines could reduce the boiling time and thus energy expenditure by 60–70% based on brix concentration (i.e., the amount of dissolved solids, like sucrose, in the sap). As another example, the wide adoption of plastic tubing in maple sap collection has significantly increased maple syrup production and yield in both Canada and the United States (Thomas, 2021).
Similar to many other agricultural sectors that are highly affected by weather conditions, market forces, and government policies, the maple syrup industry faces many climate, economic, and policy challenges. First, maple sap harvest and the resulting syrup production are hypersensitive to many weather and climate variables that include daily low temperature, daily high temperature, barometric pressure, duration of below or above freezing temperatures, magnitude and duration of extreme warming days, depth of snowpack, and precipitation patterns (Duchesne and Houle, 2014; Cotnoir, 2021). Maple sap and syrup production is also affected by tree physiology and forest parcel variables such as sap sugar content, internal tree pressure, tap hole “drying,” and forest slope directional orientations (Perkins et al., 2022).
A warming climate presents the challenges of less predictable sugaring season length, increased invasive tree pest pressure, and even reducing the concentration of sucrose in maple sap (Cotnoir, 2021; Hopkins, 2017; Randall et al., 2006; Wang et al., 2025). For example, while Cotnoir (2021) summarized that climate change would affect where, when, and how maple syrup will be produced, Wang et al. (2025) presented a comprehensive review on how weather and climate factors likely affect sap and maple syrup production. However, there are still many unanswered questions and a great need for research on the potential impacts of climate change on the maple syrup industry and how to enhance the industry’s resilience to climate change (Caughron et al., 2021; Wang et al., 2025).
Second, the economic viability of maple syrup as a food commodity that has been heavily traded in regional, national, and international markets has been highly affected by many economic, financial, market, and geopolitical factors. For example, the maple syrup industry in both Canada and the United States faces limited workforce availability, increased environmental regulations, and increasing labor and other production costs but, on the other hand, the average maple syrup prices received by producers have shown downtrends since mid-1980s in both countries. The trends of both nominal and real maple syrup producer prices since 1983 will be analyzed in the next section.
Canada accounts for about 70% of the global production of maple syrup and Quebec has contributed to about 90% of Canada’s production and more than 60% of the global production (Statistics Canada, 2024; USDA NASS, 2024). QMSP as the world’s largest producer and exporter of maple syrup has played a very important role in determining the global price through its production quota, reserve systems, and market development efforts. The organization has the objective of stabilizing producer prices, increasing investment in the maple industry, and maintaining the number of maple syrup enterprises in production (QMSP, 2024). QMSP has implemented its production quota system since 2004 but the system has been the subject of legal debates and media reports in recent years (Austen, 2015; Kuitenbrouwer, 2023; Metraux, 2022; Moreau, 2018). For example, QMSP has been previously called a “cartel” or “monopoly,” implying its supermarket power and bad reputation for keeping the market price at a level above the equilibrium price and hurting consumers. There have been court cases related to QMSP’s mandatory production quota system and punishments for producers who violated the quota regulations (Austen, 2015; Kuitenbrouwer, 2023; Metraux, 2022; Moreau, 2018). Some reporters and legal scholars have also questioned the legality of QMSP’s production quota systems in the face of antimonopoly laws in Canada and the United States (Gagné, 2015). More recently, QMSP (2024) has stated that 75% of its members are happy about its regulations and performance, despite earlier reports that some members were concerned with the payment schedule for their product and policies against over-quota production. According to Gagné (2015), some Quebec producers have expressed reservations about the current QMSP quota system and asserted that it violated their rights and freedoms. Some of them have also considered the production quota system a barrier that disadvantaged them in production growth compared to their counterparts in other Canadian provinces and U.S. states (Gagné, 2015).
On the other hand, QMSP’s production quota and reserve systems have been credited for their role in stabilizing market supply and price. For example, Gehrke (2022) highlighted QMSP’s role in stabilizing maple syrup producer prices and market supplies in recent years, especially during the Covid-19 pandemic. It may not be fair to compare QMSP with the monopoly or cartel markets of industrial products due to maple syrup’s unique characteristics community importance, and long history of legally enabled collective agricultural regulations. U.S. and Canadian laws have adopted specific regulations that enable agricultural associations to collectively organize, when approved, to develop product standards, manage marketing and promotion efforts, and support research. For example, the United States has developed many market interventions for major agricultural commodities like milk and sugar. While the history of QMSP and details about its production quota system are well documented, its potential impacts on the growth of Quebec’s maple syrup production as well as U.S. maple syrup producer price will be assessed through empirical analysis in the next section.
Third, the recent changes in trade relations between the United States and Canada as well as many other countries are expected to have a direct impact on the trade flow of maple syrup, its producer prices in both countries, and retail price in every market. For example, the U.S. federal government has recently laid out an aggressive import tariff plan in early 2025. This is a clear shift away from the established United States-Mexico-Canada Agreement (USMCA) that went into effect in 2020 and could have significant impacts on the trade of maple syrup and the whole industry in both Canada and the United States. The ongoing changes in U.S. trade policy and potential retaliations from Canada have brought about concerns for many maple syrup producers in the United States because the majority of specialized syrup processing equipment and hardware for sap collection systems are imported from Canada and their planned investments, major repairs or expansion could come at higher costs under the proposed tariffs.
4 Empirical findings
This section reports our empirical findings in addressing some of the key research questions listed in the introduction, and such findings are expected to contribute to the literature with quantitative evidence.
4.1 What are the trends of maple syrup producer prices in Canada and the United States?
While a maple syrup producer’s accounting profit is the difference between her or his total revenue (TR) and total cost (TC) and the TR is equal to the price (P) multiplied by the quantity (Q) sold in the market (i.e., TR = P*Q), the price received by maple syrup producers is one of the most important factors or indicators of their business performance. This study has collected time-series data on the average prices received by maple syrup producers in Canada and the United States since 1983. The annual nominal prices in the two nations have also been converted into real prices in 2008 U.S. dollars (USD) and 2008 Canadian dollars (CAD), respectively, using the official consumer price index (CPI) data published by the U.S. and Canadian governments.
The price data presented in Figure 2 suggests four major findings: First, the nominal prices received by producers in both Canada and the United States increased steadily from 1983 to 1987, dropped significantly in the next 4 years, showed an upward trend in Canada from 1983 to 2009 and in the United States from 1983 to 2008, and then a downward trend thereafter in both countries. Second, when the inflation is adjusted using the CPI, the downward trend in producer prices is more obvious since 2008 in the United States and since 2009 in Canada. Also, the real prices in the mid-and late 1980s were among the highest levels, and they never reached that level again over the period. Third, the volatility of nominal prices seemed to be lower since the late 2000s as compared to that in the previous periods in both nations and the volatility in Canada seemed to be smaller than that in the United States during the later period since 2008. This could be a result of Quebec’s production quota system which has been in effect since 2004. Fourth, both the nominal and real producer prices in the United States were higher than the corresponding prices in Canada over the period, except in 2019 and 2020. This difference was likely either missed or underestimated in many media reports because Canadian producer price has been reported in the unit of Canadian dollars per imperial gallon, but U.S. producer price has always been reported in the unit of U.S. dollars per U.S. gallon.
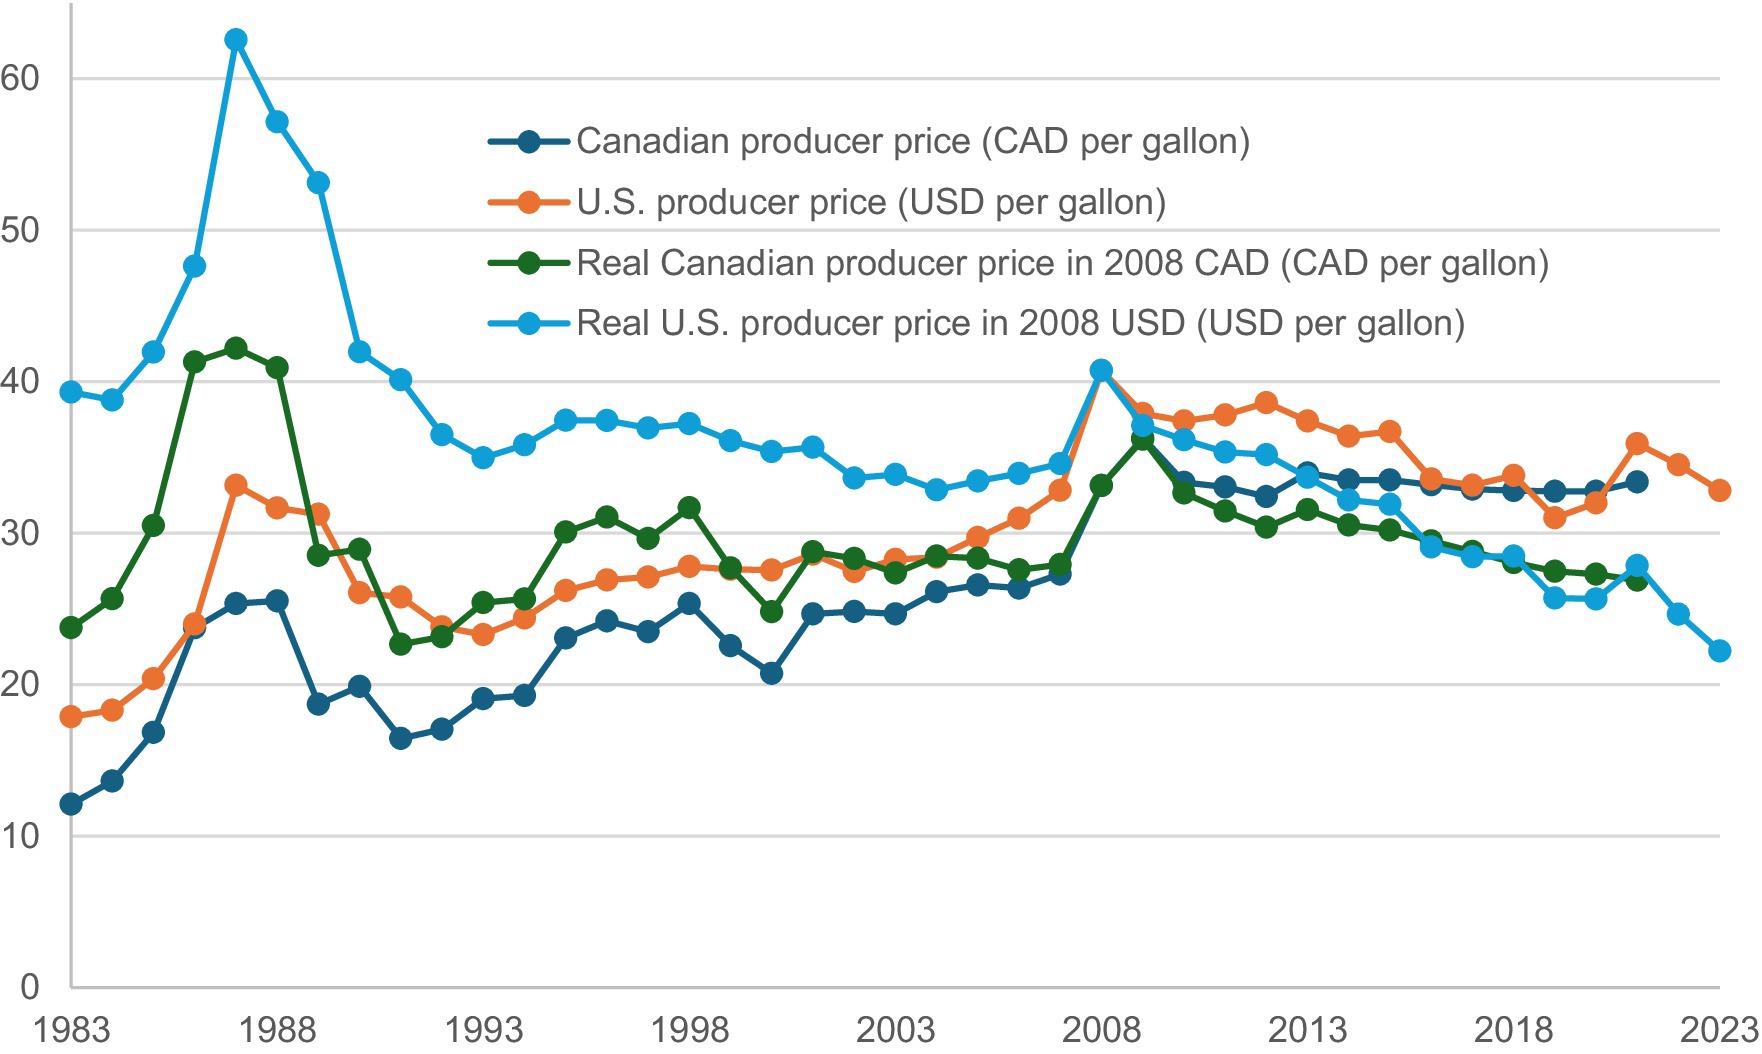
Figure 2. Canadian and U.S. nominal and real maple syrup producer prices, 1983–2023. Data sources: Statistics Canada (2024) and USDA NASS (2024).
Findings from Figure 2 suggest that the downward trend in producer prices, especially in real prices, since the late 2000s has presented economic challenges for the maple syrup industry in both countries. With increasing labor, energy, and other production costs, the decreasing producer price has significantly reduced the profit margin of many producers, especially small ones. Also, while Quebec’s production quota system implemented in 2004 may be credited for the reduction in price volatility in Canada since the late 2000s, the average Canadian producer price has fluctuated around a level that is significantly lower than that in 2009 in nominal terms and even lower than that in the later 1990s in real terms. In the United States, the downward trend in maple producer prices has been similar to that in Canada although the U.S. producer prices have been higher than the Canadian producer prices for most of the years. One major economic challenge for the maple industry in both nations is how to increase producer prices to match the increasing production costs.
4.2 How has Quebec’s production quota system affected its production growth?
While some media reports have stated that Quebec’s production quota system has hurt its producers and helped its competitors (e.g., Metraux, 2022; Moreau, 2018; Valiante, 2018), most of these media reports have a lack of supporting data and analysis. To assess the impact of Quebec’s production quota system implemented in 2004 on its production growth in comparison with that in other major production regions in Canada and the United States, the average three-year production was calculated for 2001–2003 and 2021–2023 for each of the major production provinces in Canada and states in the United States, respectively, using data from Statistics Canada (2024) and USDA NASS (2024), and the growth rate from 2001–2023 to 2021–2023 was then calculated for each province and state. Note that 2001 to 2003 were the three years before the implementation of Quebec’s quota system in 2004, and 2021–2023 were the most recent years with available data. Three-year averages were used to reduce the impact of production volatility over the years. The calculated growth rates, reported in Figure 3, demonstrate significant variations in production growth across regions. Quebec experienced the lowest growth rate of only 104.40% albeit at much higher volumes, from 2001–2003 to 2021–2023, as compared to 573.99% in Wisconsin, 498.10% in Vermont, 451.69% in New Brunswick, 224.78% in New York, 132.29% in Ontario, and 115.15% in Maine over the same period. Compared to the average growth rate of 271.98% in the United States, Canada achieved a growth rate of 112.51% over the same period, largely due to Quebec’s low growth rate and large share in Canada’s production. Data presented in Figure 3 provides clear evidence that, as compared to the production growth in other major production regions, Quebec’s production quota system has limited the growth in maple syrup production in Quebec as well as in Canada since its implementation in 2004.
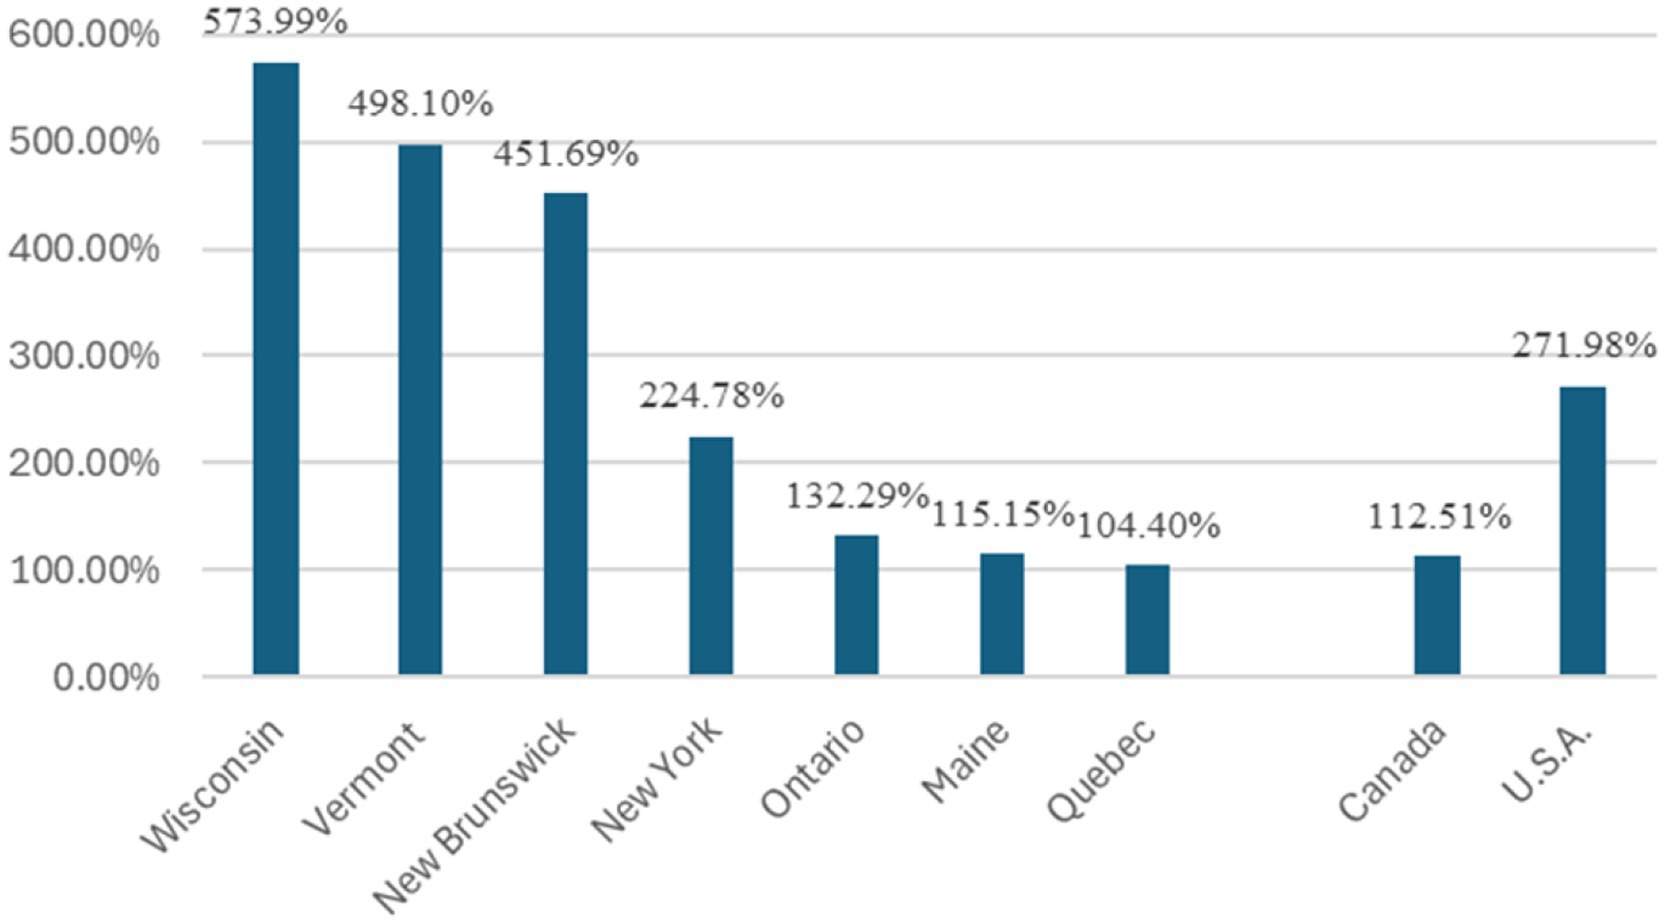
Figure 3. Growth rate of maple syrup production from 2001–2003 to 2021–2023. Data sources: Calculated by the authors using data from USDA NASS (2024) and Statistics Canada (2024).
Data presented in Figure 4 suggests that the percentage share of Quebec’s maple syrup production in Canada’s total production reduced by about three percentage points, from around 93% in 1997–2005 to around 90% in 2006–2023. Also, Quebec’s share of the total production in Canada and the United States dropped from around 80% in 1999–2005 to around 71% in 2006–2022 and reached a record low of 64.74% in 2023. This decline is largely due to the rapid growth in maple syrup production in Wisconsin, Vermont, and New York and relatively slow growth in Quebec reported in Figure 3.
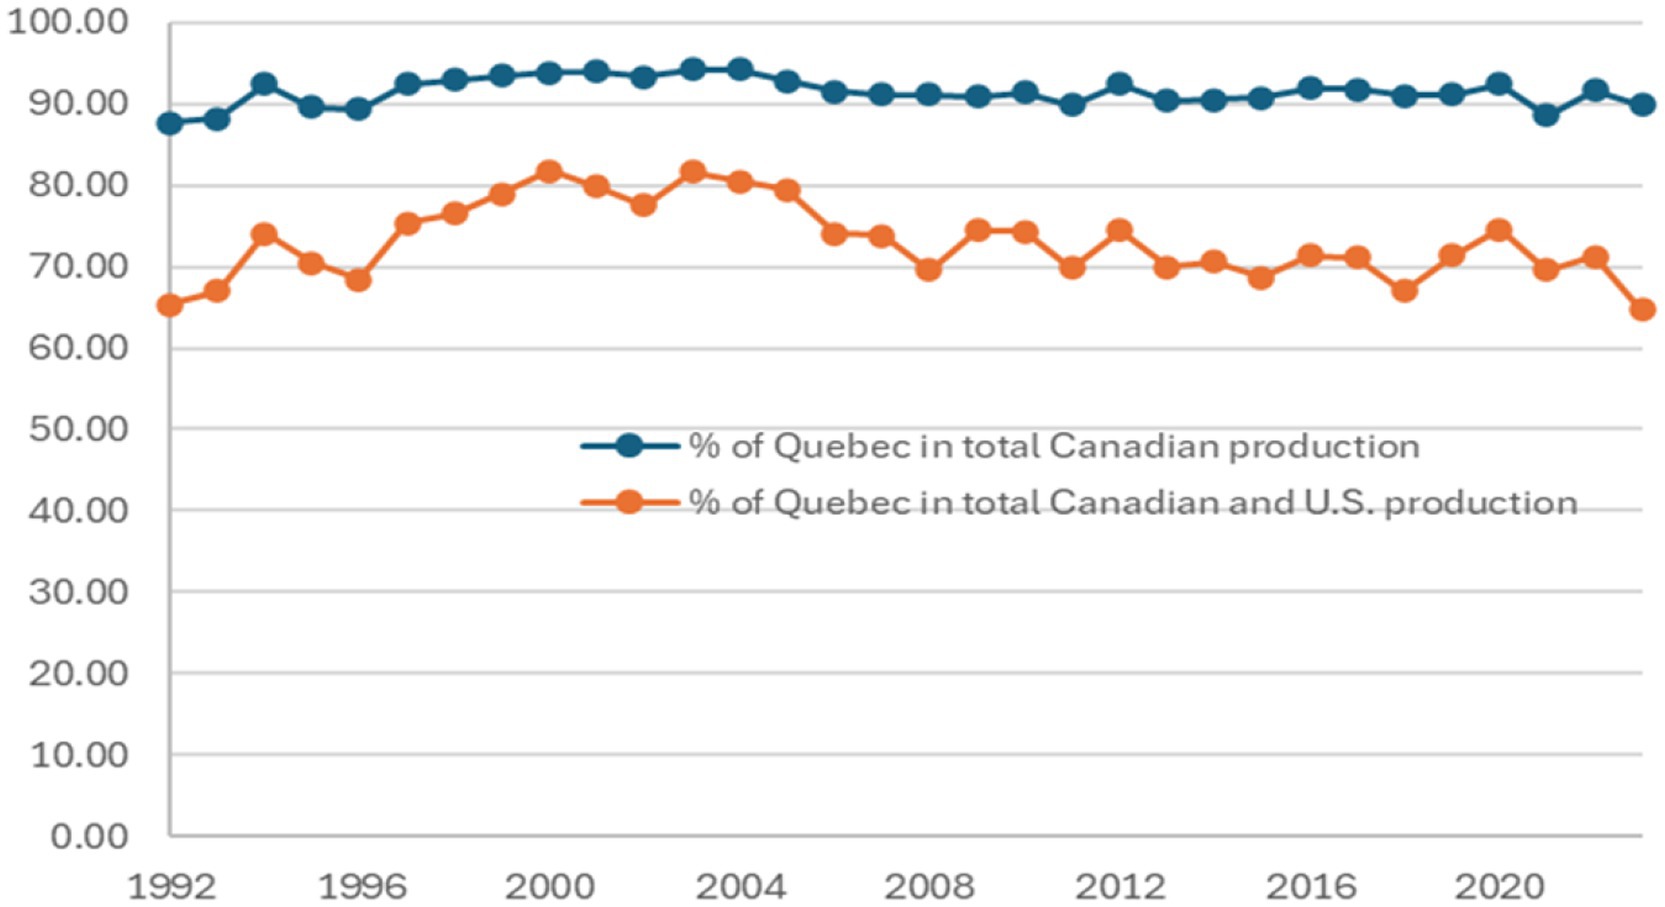
Figure 4. Quebec’s shares of maple syrup production in Canada and North America, 1992–2023. Data sources: Calculated by the authors using data from USDA NASS (2024) and Statistics Canada (2024).
While Figure 4 shows the changes in Quebec’s contribution to the production of Canada and the total production of Canada and the United States, Figure 5 presents data on maple syrup production in Canada and the United States as well as the share of the United States in the total production from 1992 to 2023. Figure 5 suggests two findings: First, the share of U.S. production in the total production of Canada and the United States declined steadily from 1992 to 2000 but has shown an upward trend since 2000 and reached a record high of 27.91% in 2023. Second, maple syrup production in both Canada and the United States has experienced significant growth but also increasing volatility since 1992. This highlights the sensitivity of maple syrup production to climate conditions during the sugaring seasons and similar changes in climate conditions in Eastern Canada and the Northeastern United States.
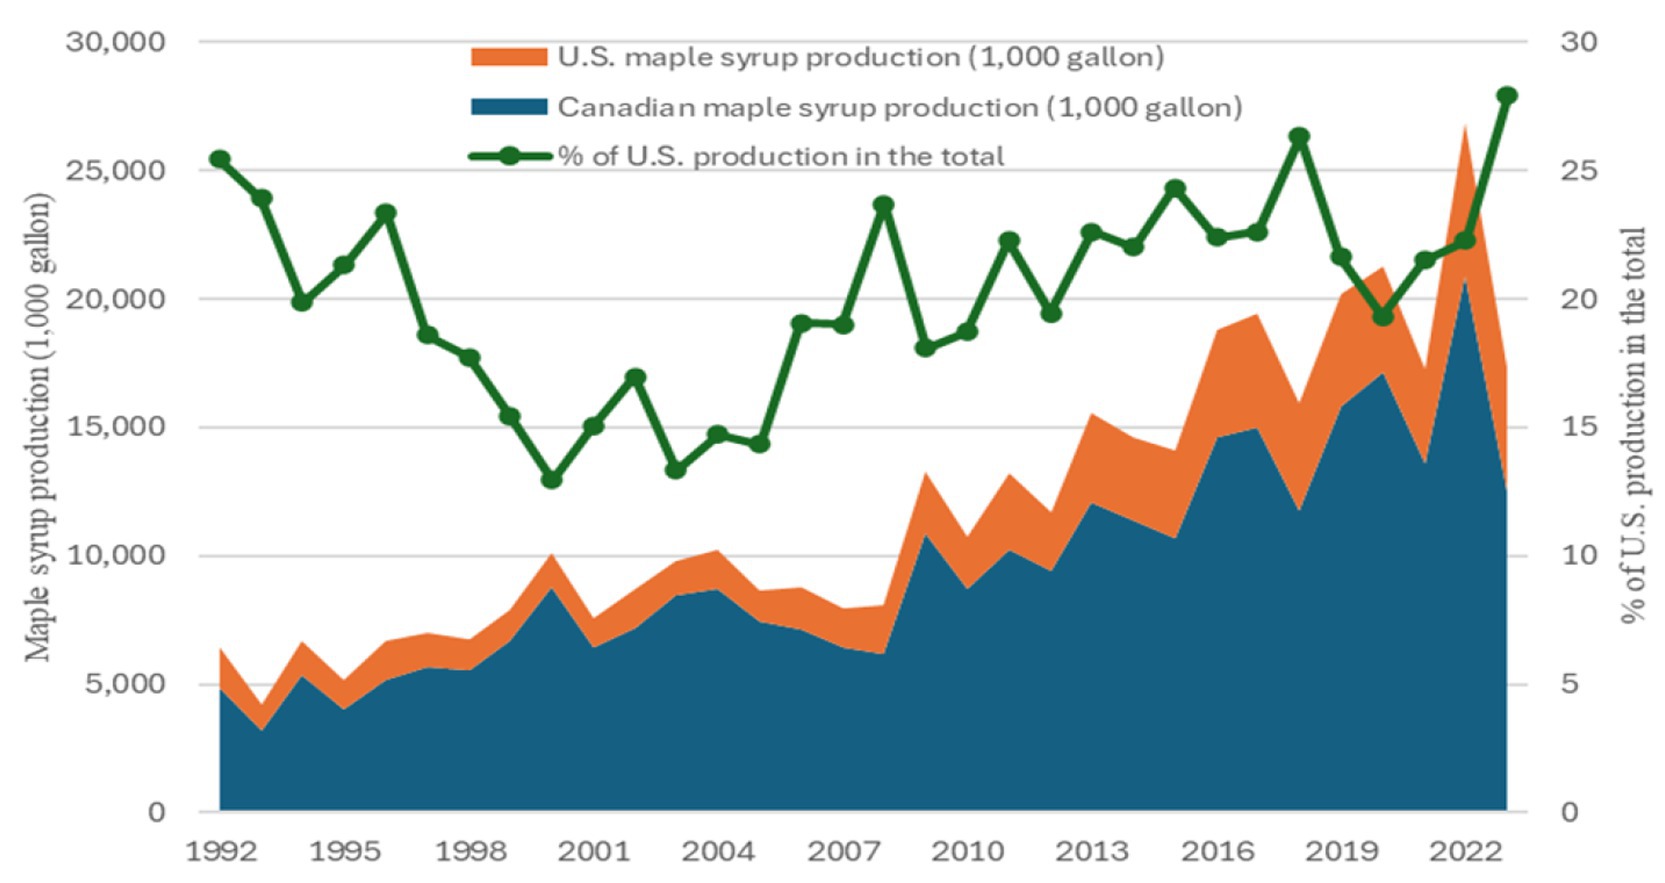
Figure 5. Maple syrup production in Canada and the United States, 1992–2023. Data sources: USDA NASS (2024) and Statistics Canada (2024). The percentage share of the United Sates is calculated by the authors.
The significant drops in maple syrup production in 2001, 2007, and 2008 offer a good example of the weather-sensitive nature of maple sap harvests and maple syrup production. While the changes in the number of taps from year to year are generally limited, the key factor for the changes in the sap collection and maple syrup production over time is the weather variability. For example, from 2000 to 2021, maple syrup production in Vermont, the largest producer in the United States, dropped about 40% and the U.S. total production decreased about 15% due to the abnormally cold temperatures in Vermont and other production regions (USDA NASS, 2024).
4.3 What is the correlation between Canadian and U.S. maple syrup producer prices?
While Canada and the United States are the only two large maple syrup producers in the world and Canada also exports a large proportion of its production to the United States, it is important to examine how maple syrup producer prices in the two nations are correlated. The correlation matrix in Table 1, calculated from the time-series data from 1983 to 2021, suggests two major findings: First, the Canadian producer price in CAD per gallon and the U.S. producer price in USD per gallon is highly correlated with an estimated correlation coefficient of 0.91. Second, the correlation between U.S. producer price in USD per gallon and Canadian producer in USD per gallon, converted using the official exchange rate between USD and CAD, is significantly stronger, with an estimated correlation coefficient of 0.93. This finding suggests that the exchange rate did play an important role in affecting the relationship in producer prices between the two nations.
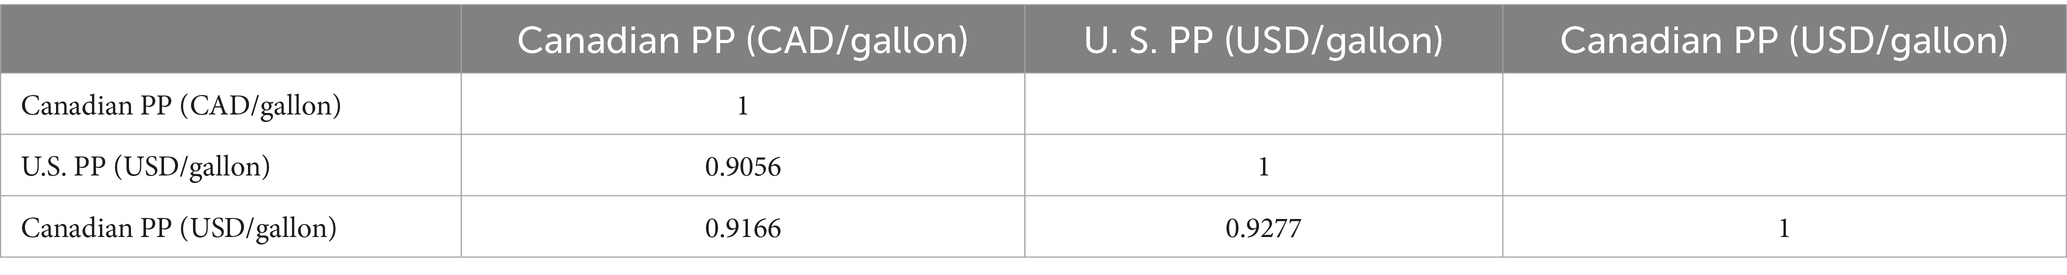
Table 1. Correlation coefficients of Canadian and U.S. producer prices (PP).
4.4 How has Quebec’s production quota system affected U.S. maple syrup producer price?
While Canada has dominated the global maple syrup production and QMSP, the largest maple syrup producer in the world, has made significant market interventions through its production quota and strategic reserve systems to stabilize producer prices, it is interesting to examine how Canadian producer price and Quebec’s production quota system might have affected the U.S. producer price since 1983. For this purpose, the following regression model is estimated using the data from 1983 to 2021:
where Pus is the U.S. producer price, Pc is the Canadian producer price, T is a time variable with the value of 1 for 1983, 2 for 1984, 3 for 1985, and so on, D is a dummy variable for the production quota system in Quebec with D = 0 for 1983 to 2003 and D = 1 for 2004 to 2021, and e is the error term. The time variable is included to capture the effect of time-related factors, such as technical progress and increased consumer income over time.
The estimated regression model with statistics measuring the goodness of fit, reported in Table 2, suggests four empirical findings: First, the estimated model fits the data very well and explains 86.74% of the variation in U.S. producer price as the dependent variable over the period. This is also confirmed by the F-statistic and its significance level. Second, all three independent variables significantly impacted the dependent variable at the 0.10 significance level or below. Third, the U.S. producer price is positively and significantly affected by the Canadian producer price and the time variable over the period, with the numerical interpretations that the U.S. producer prices increased $0.11 per year and $0.85 when the Canadian producer price increased by 1 dollar, respectively. Fourth, the implementation of the production quota system in Quebec in 2004 has had a negative impact of $3.50 per gallon on the U.S. producer price when the Canadian price and the time variable are controlled. The mechanism behind these impacts is likely that Quebec, as the largest and most well-organized producer through QMSP, has had the market power to set the producer price each year. Large maple syrup purchasers in the United States often use the producer price in Quebec as the reference price in making purchase decisions. Because there is no producer association like QMSP in the United States, U.S. maple syrup producers have had very limited market power in negotiating for better prices when they sell their products, especially to large processors.
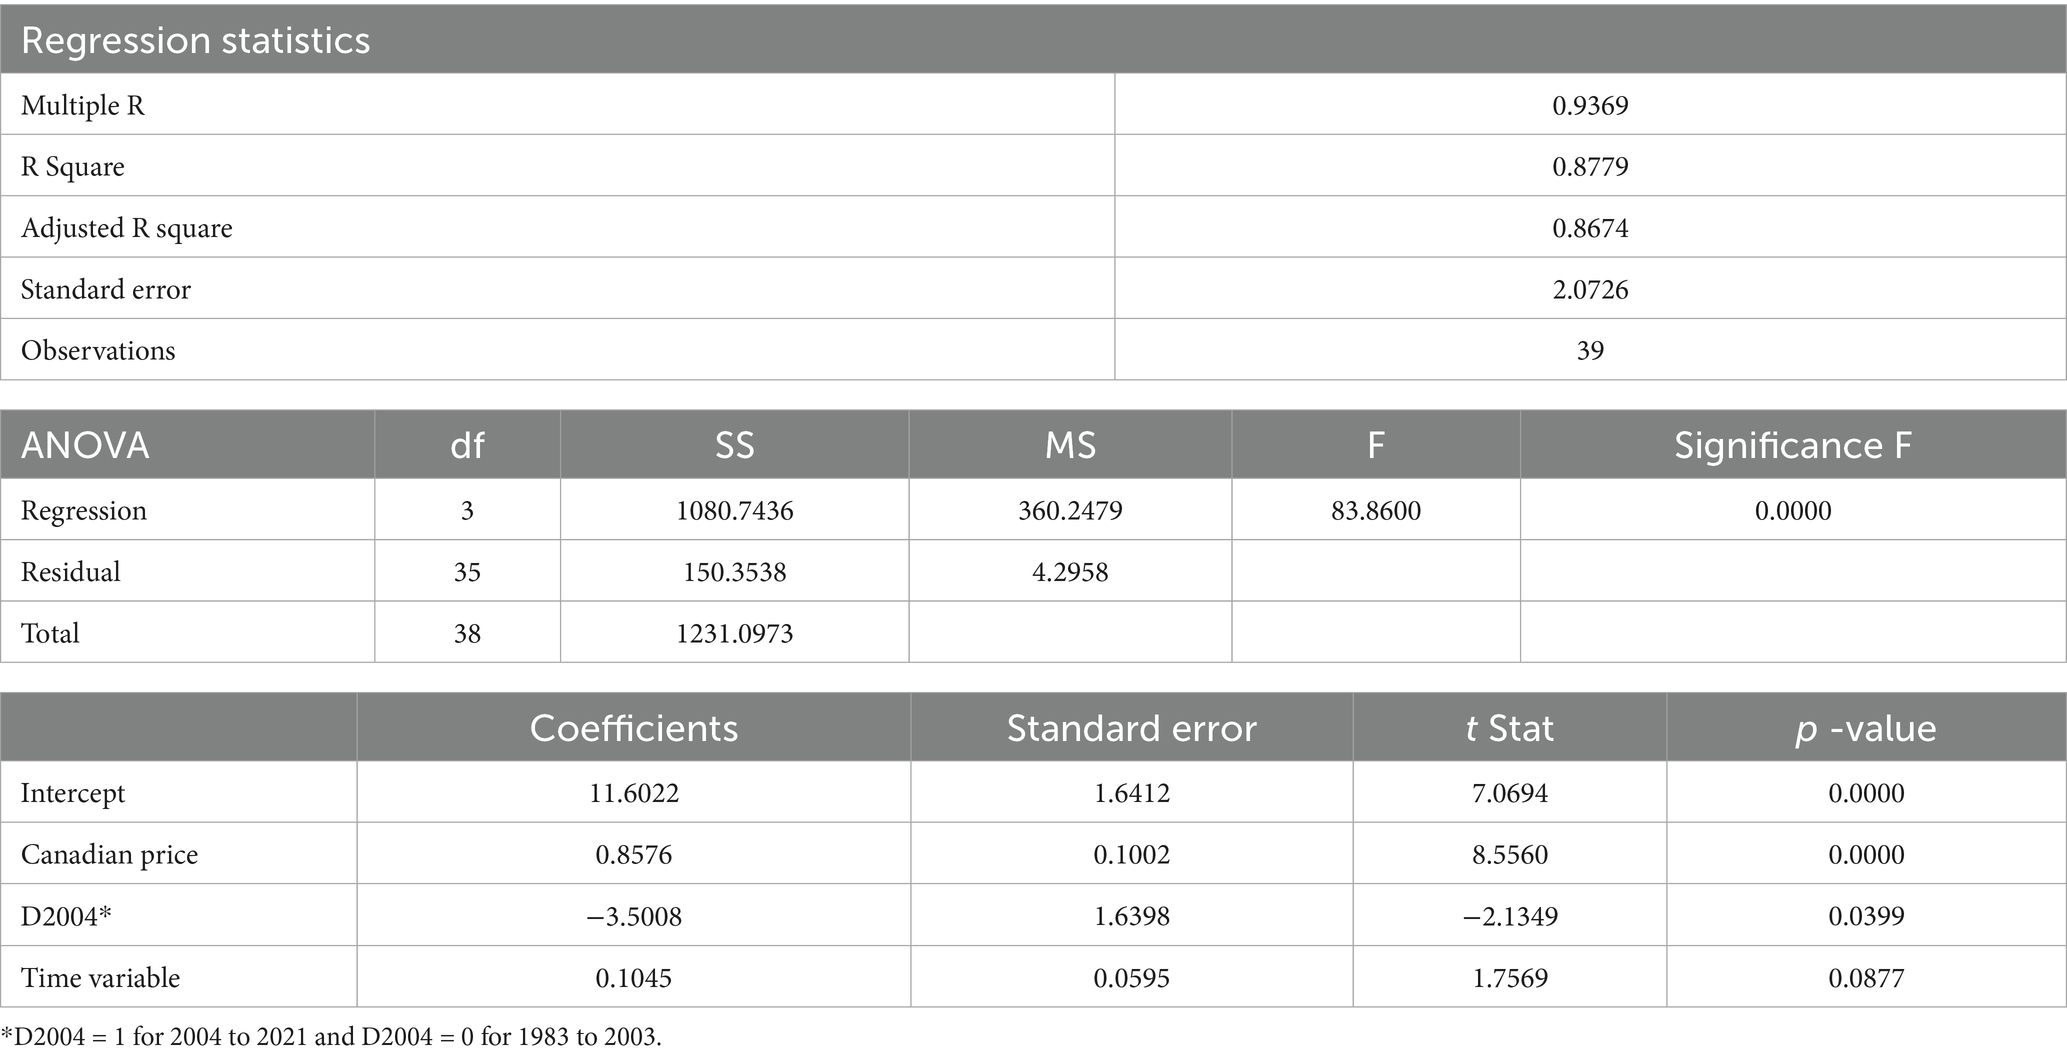
Table 2. Regression results of the U.S. maple syrup producer price.
5 Discussion of potential opportunities and strategies
Our review of previous studies and analysis of available data, presented in the previous sections, suggest that the maple syrup industry in both Canada and the United States has experienced significant growth in production since the early 1980s but is also facing the challenges of increasing volatility in both sap yield and maple syrup output, a downward trend in producer prices since the late 1980s, especially since 2008, rising production costs, and increasing impacts of trade disputes and retaliations. The maple syrup industry needs innovative strategies to address these challenges and move towards more sustainable development. As a production system that highly depends on weather conditions and the health of sugarbushes over many years, sustainable development for the maple syrup industry means that the needs of the present are met without compromising the ability of future generations to meet their needs as well. It is based on a long-term perspective that considers the environmental, social, and economic dimensions of development to be inseparable (QMSP, 2024).
This study suggests four major recommendations: First, the maple syrup industry needs to shift its focus from supply-side management to both supply and demand strategies. For example, the major reason for the downward trend in producer prices in Canada and the United States since the late 2000s is that the production growth has been more than the growth in demand. Under this situation, the effectiveness of the supply-side strategies and interventions have served certain objectives but not all. Quebec’s production quota has enabled measured growth and the reserve system has moderated market wide supply shortages that have prevented major price shocks but have not delivered stabilized or increased real prices to producers. Unfortunately, many other agricultural sectors, such as dairy in the United States and Canada, face similar challenges due to the lack of matching growth in market demand and decreasing prices received by producers. Quebec has advanced some demand-side strategies, but the maple syrup industry could benefit from additional resources and strategies for addressing both supply and demand problems.
Second, in addition to the traditional markets for maple syrup, the maple syrup industry needs to introduce and promote maple syrup in new geographic regions domestically and internationally. For example, in the United States, per capita consumption of maple syrup in the western and southern states like California and Texas has been significantly lower than that in the northeastern states. Geographic specific promotion programs are needed in the western and southern U.S. states. Also, maple syrup as a special natural sweetener produced in Eastern Canada and Northeastern United States has shown great potentials in some foreign countries such as Japan and China. For example, Wang et al. (2024) reported that China’s maple syrup imports increased steadily from 2.85 metric tons in 2009 to 219.96 metric tons in 2020 and then dropped to 157.01 metric tons in 2022. Both Canada and the United States have made efforts to increase their maple syrup exports in recent years. For example, the Canadian government provided $2.2 million to help maple syrup producers in the province of Quebec expand and diversify their exports to the United States, United Kingdom, Germany, Japan, and China (Desjardins, 2019). In the United States, the USDA has funded a significant number of educational, research, and Extension projects for promoting the maple syrup industry and exploring new market opportunities for U.S. maple syrup in the United States and abroad. Although there is great potential in many foreign markets, the industry needs to make more efforts and investments to first introduce maple syrup to foreign consumers who have not heard of or tried the sweetener and then make the product available in the foreign markets.
Third, while pure fluid maple syrup has traditionally been consumed with breakfast meals such as pancakes and waffles, there is a great need for developing new products such as sports drinks and functional food products with maple syrup as a major ingredient. As consumer preferences are significantly difference across regions, cultures, and sociodemographic groups and are changing over time, the maple syrup industry needs to conduct more research to understand consumer preferences and culturally appropriate applications in either food at home or food away from home settings.
Fourth, as Canada and the United States are the two largest maple syrup producers in the world and the United States has been the largest importer of maple syrup, the maple syrup industries in the two nations have been competing in the U.S. market and major foreign markets like Japan and China. There are potential opportunities for the maple syrup industries in the two nations to work together to enhance the demand, develop new technologies, and improve the distribution of maple syrup. The effort of the International Maple Syrup Institute to update the pure maple syrup standard of identity through collaboration with the Codex Alimentarius Commission is a good example of strategic market enhancement to benefit maple syrup producers in both Canada and the United States. One new recommendation is to expand research on various elements of product distribution. For example, innovations in maple syrup packaging materials and logistics could enhance the distribution efficiency and reduce the environmental footprint associated with expanding sales and long-distance shipping. Another recommendation is to conduct more technical and market research related to the shared challenges of climate and market changes. Further research into climate impacts of maple production and environmental services of perennial forest cover would, again, inform pre-competitive promotion for the entire product category in North American and global markets. Such research is essential in order to know how the maple industry may need to moderate existing environmental impacts or amplify messaging about verified environmental benefits.
Because the maple syrup industries in the two countries face very similar climate and economic challenges, more collaboration in market research, new product development, and market development and promotion in new markets can create win-win outcomes and benefit the whole maple syrup industry in North America.
6 Concluding remarks
While there are very limited academic studies on the maple syrup industry in literature, especially empirical studies on the climate, economic, and policy challenges faced by the industry, this study is expected to contribute to the literature with a comprehensive review of the industry’s development, an analysis of its major challenges, and a discussion of potential strategies for the industry to address the challenges and move towards a more sustainable development. As growth alone cannot be the sole indicator of the industry’s sustainable development, the complexity of climate, market, economic, policy, and geopolitical factors requires strategies and solutions from not only individual businesses, but also the unified strength of broader coalitions and collaborations of the stakeholders of the industry.
This study suggests three major conclusions: First, the maple syrup industry in both Canada and the United States is facing climate, economic, and policy challenges. Climate change will continue to affect where, when, and how to produce maple syrup, and the changing conditions in the domestic and foreign markets and increasing trade disputes and retaliations have also made it increasingly difficult for maple syrup producers, processors, and other enterprises to stay economically viable. Government policies and legal foundations behind industrial regulations such as Quebec’s production quota system and the absence of similar institutions in the United States are likely to draw attention in the face of differing interests and geopolitical challenges.
Second, the downward trend in maple syrup producer prices in both Canada and the United States since the late 2000s has emerged as a pressing challenge for the industry. With increasing production costs over time, many maple syrup producers, especially small ones, are struggling to stay in business. The maple syrup industry needs to first address the implications of stagnant or declining prices, and then make strategic decisions to support a mix of differentiation, product innovation, and broader geographic distribution that can enhance domestic and foreign market demand for maple syrup products.
Third, there is quantitative evidence that Quebec’s production quota system has limited its production growth compared to other major production regions. This finding is consistent with that of Gehrke (2022). Although the system has played an important role in stabilizing producer prices in Quebec and moderating supply risks in the markets, it has shown a limited impact on increasing producer prices since the late 2000s. While supply and demand together determine market equilibrium price and quantity, the effectiveness of the supply-side interventions alone is limited in the long run. Although the Canadian and U.S. governments, QMSP, and many other industrial organizations have made significant efforts to increase consumer demand in recent years, more coordinated efforts and investments are needed to enhance market demand for maple syrup and its value-added products.
As discussed in the previous section, major recommendations from this study include shifting the focus from supply-side interventions to more demand-side enhancement, promoting consumer demand for maple syrup in the emerging markets like Japan and China, developing more value-added maple syrup products based on market research, increasing both private and public investment in technical innovation and climate mitigation, and enhancing the collaboration, including international collaboration, in research, education, market development and promotion.
This study is completed with known data limitations and some results should be interpreted with caution. For example, the lack of data does not allow us to quantify the impacts of many important factors such as weather, climate, and technology variables on maple sap and syrup production. Also, while maple syrup producers sell their maple syrup through alternative markets such as the bulk market, farmers’ markets, institutional markets, and online sales, the U.S. producer prices used in our analysis were the average prices reported by USDA NASS and the Canadian producer prices were the average unit values derived from the total sales revenue and quantity reported by Statistics Canada. Furthermore, although there are many maple syrup producers and wholesalers in every major production region, a small number of large producers and wholesalers often play a dominant role in each major production state in the United States and each province in Canada, except Quebec in which QMSP governs the producers association, but there are very limited data about the operation and decision making of these large producers and wholesalers.
Data availability statement
The raw data supporting the conclusions of this article will be made available by the authors, without undue reservation.
Author contributions
QW: Conceptualization, Data curation, Formal analysis, Funding acquisition, Investigation, Methodology, Resources, Validation, Writing – original draft, Writing – review & editing. EA: Data curation, Investigation, Methodology, Validation, Writing – review & editing. MC: Conceptualization, Data curation, Investigation, Resources, Validation, Visualization, Writing – review & editing.
Funding
The author(s) declare that financial support was received for the research and/or publication of this article. This work was supported by the U.S. Department of Agriculture (USDA) Agricultural Research Service and the University of Vermont (UVM) Food Systems Research Center (Grant award AWD00001102) and Vermont Agricultural Experiment Station at UVM (Grant award VT-H02908) and the USDA Agricultural Marketing Service (Grant awards 23ACERVT1024-00 and 23ACERVT1030-00).
Acknowledgments
The authors would like to thank the editors and three reviewers for their valuable comments and suggestions. We also would like to thank Amrita Shore for her assistance in data collection, and Avery Anderson and Jana Murphy for proofreading the manuscript.
Conflict of interest
The authors declare that the research was conducted in the absence of any commercial or financial relationships that could be construed as a potential conflict of interest.
Generative AI statement
The authors declare that no Gen AI was used in the creation of this manuscript.
Publisher’s note
All claims expressed in this article are solely those of the authors and do not necessarily represent those of their affiliated organizations, or those of the publisher, the editors and the reviewers. Any product that may be evaluated in this article, or claim that may be made by its manufacturer, is not guaranteed or endorsed by the publisher.
References
Austen, I. (2015). Canadian maple syrup ‘rebels’ clash with law. New York, NY, U.S.A.: The New York Times. Available at: https://www.nytimes.com/2015/08/23/business/international/canadian-maple-syrup-producers-clash-with-law.html (Accessed May 1, 2025).
Bal, T. L., Storer, A. J., Jurgensen, M. F., Doskey, P. V., and Amacher, M. C. (2015). Nutrient stress predisposes and contributes to sugar maple dieback across its northern range: a review. Forestry 88, 64–83. doi: 10.1093/forestry/cpu051
Becot, F., Kolodinsky, J., and Conner, D. (2015). The economic contribution of the Vermont maple industry. Burlington, VT, U.S.A.: University of Vermont Center for Rural Studies. Available at: https://www.uvm.edu/sites/default/files/media/Maple_Industry_Economic_Contribution_ Report_final.pdf (Accessed May 1, 2025).
Bishop, D. A., Beier, C. M., Pederson, N., Lawrence, G. B., Stella, J. C., and Sullivan, T. J. (2015). Regional growth decline of sugar maple (Acer saccharum) and its potential causes. Ecosphere 6, 1–14. doi: 10.1890/ES15-00260.1
Caughron, A., Legault, S., Haut, C., Houle, D., and Reynolds, T. (2021). A changing climate in the maple syrup industry: variation in Canadian and U.S.A. producers’ climate risk perceptions and willingness to adapt across scales of production. Small Scale For. 20, 73–95. doi: 10.1007/s11842-020-09457-2
Cotnoir, A. (2021). The end of maple? Maple sugaring amid a changing climate. Available online at: https://vt.audubon.org/news/end-maple-maple-sugaring-amid-changing-climate (Accessed May 1, 2025).
Desjardins, L. (2019) Funding will boost maple syrup exports. Available online at: https://www.rcinet.ca/en/2019/04/12/canada-market-maple-syrup-boost/ (Accessed May 1, 2025).
Duchesne, L., and Houle, D. (2014). Interannual and spatial variability of maple syrup yield as related to climatic factors. Peer J. 2:e428. doi: 10.7717/peerj.428
Farrell, M. L., and Chabot, B. F. (2012). Assessing the growth potential and economic impact of the U.S. maple syrup industry. J. Agric. Food Syst. Community Dev. 2, 11–27. doi: 10.5304/jafscd.2012.022.009
Gabe, T. (2014) Economic impact of Maine's maple industry, School of Economics, University of Maine. Staff Paper 614. Available online at: https://core.ac.uk/download/pdf/213974968.pdf (Accessed May 1, 2025).
Gagné, F. (2015) Pour une industrie acéricole forte et compétitive. Available online at: https://numerique.banq.qc.ca/patrimoine/details/52327/2552563 (Accessed May 1, 2025).
Gehrke, B. (2022) Tapping Québec’s strategic reserve… or we’ve got your pancakes covered. United States international trade commission, executive briefings on trade. Available online at: https://www.usitc.gov/publications/332/executive_briefings/ebot_tapping_quebecs_strategic_reserve.pdf (Accessed May 1, 2025).
Hershberger, S., Shaw, B., Gorby, T. A., Solin, J., Robinson, P., Tiles, K., et al. (2024). Comparing motivations, learning interests, and barriers to expansion among non-commercial and commercial maple syrup producers in Wisconsin. Small Scale For. 23, 127–157. doi: 10.1007/s11842-023-09557-9
Hinrichs, C. C. (1998). Sideline and lifeline: the cultural economy of maple syrup production. Rural. Sociol. 63, 507–532. doi: 10.1111/j.1549-0831.1998.tb00690.x
Hopkins, K. (2017). Maple syrup quality control manual. Bangor, ME, U.S.A.: University of Maine Cooperative Extension. Available at: https://extension.umaine.edu/publications/7038e/
Houle, D., and Duchesne, L. (2020). The “sweet spot” for maple syrup production proposed by is not that sweet. For. Ecol. Manag. 458:117662. doi: 10.1016/j.foreco.2019.117662
Huron, R. (2014) Historical roots of Canadian aboriginal and non-aboriginal maple practices. Available online at: https://scholars.wlu.ca/ges_mrp/3/ (Accessed May 1, 2025).
Kuitenbrouwer, P. (2023). Sticky business: Quebec's maple syrup farmers struggle with drop in global demand. Available online at: https://financialpost.com/feature/quebec-maple-syrup-farmers-struggle-drop-global-demand (Accessed May 1, 2025).
Massachusetts Maple Producers Association (2024) Maple history. Available online at: https://www.massmaple.org/about-maple-syrup/maple-history/#:~:text=The%20Native%20Americans%20had%20been,sugar%20as%20early%20as%201609 (Accessed May 1, 2025).
McConnell, T. E., and Graham, G. W. (2016). History of northeastern US maple syrup price trends. For. Prod. J. 66, 106–112. doi: 10.13073/FPJ-D-14-00088
Metraux, J. (2022) Maple syrup monopolies are a sticky business. Dame Magazine. Available online at: https://www.damemagazine.com/2022/08/03/maple-syrup-monopolies-are-a-sticky-business/ (Accessed May 1, 2025).
Moreau, A. (2018). Maple syrup: Quebec is hurting its producers and encouraging its competitors. Montreal, Quebec, Canada: Montreal Economic Institute. Available at: https://www.iedm.org/sites/default/files/web/pub_files/lepoint0418_en.pdf (Accessed May 1, 2025).
Murphy, B. L., Chretien, A. R., and Brown, L. J. (2012). Non-timber forest products, maple syrup and climate change. J. Rural Community Dev. 7. Available at: https://journals.brandonu.ca/jrcd/article/download/601/131 (Accessed May 1, 2025).
Perkins, T. D., Heiligmann, R. B., Koelling, M. R., and van den Berg, A. K. (2022). North American maple syrup producers manual. 3rd Edn. Burlington, VT, U.S.A.: University of Vermont. Available at: https://scholarworks.uvm.edu/calsfac/194/ (Accessed May 1, 2025).
Peters, J., Huish, R., Taylor, D., and Munson, B. (2020). Comparative analysis of four maple species for syrup production in south-central Appalachia. J. Agric. Food Syst. Community Dev. 9, 267–276. doi: 10.5304/jafscd.2020.092.015
Quebec Maple Syrup Producers (QMSP). (2024). Available online at: https://ppaq.ca/en (Accessed May 1, 2025).
Randall, H. B., Koelling, M. R., and Perkins, T. D. (2006). North American maple syrup producer’s manual. 2nd Edn. Columbus, Ohio, U.S.A.: Ohio State University Extension & the North American Maple Syrup Council.
Schuette, H. A., and Idhe, A. J. (1946). Maple sugar: A bibliography of early records. Madison, WI, U.S.A: University of Wisconsin.
Spencer, J. B. (1913). The maple sugar industry in Canada. Ottawa, Canada: Department of Agriculture.
Statistics Canada (2024). Table 32-10-0354-01 production and value of maple products. Available online at: https://www150.statcan.gc.ca/t1/tbl1/en/tv.action?pid=3210035401 (Accessed May 1, 2025).
Taylor, R. D. (1965). Characteristics of the United States producer maple syrup markets (order no. 6604864). Available online at: https://login.ezproxy.uvm.edu/login?url=https://www.proquest.com/dissertations-theses/characteristics-united-states-producer-maple/docview/302187507/se-2 (Accessed May 1, 2025).
Thomas, M. M. (2021). From pails to pipelines: the origins and early adoption of plastic tubing in the maple syrup industry. Vt. Hist. 89, 52–78. Available at: https://maplesyruphistory.com/wp-content/uploads/2021/09/2021-Vermont-History- From-Pails-To-Pipelines.pdf (Accessed May 1, 2025).
United Nations Comtrade Database (UNCD) (2024). Available online at: https://comtradeplus.un.org/ (Accessed May 1, 2025).
USDA NASS. (2024). Available online at: https://www.nass.usda.gov/ (Accessed May 1, 2025).
Valiante, G. (2018). “Quebec’s maple syrup producers losing ground as U.S. imports rise: report ”. The Canadian Press. Available at: https://halifax.citynews.ca/2018/03/09/quebecs-maple-syrup-producers-losing-ground-as-u-s-imports-rise-report/ (Accessed May 1, 2025).
Wang, Q., Abah, E., and Cannella, M. (2025). Sweet liquid gold facing climate change and sour market conditions: a strengths, weaknesses, opportunities, and threats (SWOT) analysis of the United States maple syrup sector. Sustain. 17:4101. doi: 10.3390/su17094101
Wang, Q., Cannella, M., and Zou, Y. (2024). China’s emerging market for maple syrup: opportunities and challenges for U.S. exports. J. Food Distrib. Res. 55, 46–61. Available at: https://www.fdrsinc.org/wp-content/uploads/2024/05/JFDR55.1_4_Wang.pdf (Accessed May 1, 2025).
Keywords: Maple syrup, Quebec Maple Syrup Producers (QMSP), climate change, production quota, trade policy, producer prices, Canada, the United States
Citation: Wang Q, Abah EO and Cannella M (2025) The maple syrup industry in Canada and the United States: challenges and potential strategies towards a more sustainable development. Front. Sustain. Food Syst. 9:1562645. doi: 10.3389/fsufs.2025.1562645
Edited by:
Giovanna Ferrari, University of Salerno, ItalyReviewed by:
Francesco Donsi’, University of Salerno, ItalyHang Ma, University of Rhode Island, United States
Copyright © 2025 Wang, Abah and Cannella. This is an open-access article distributed under the terms of the Creative Commons Attribution License (CC BY). The use, distribution or reproduction in other forums is permitted, provided the original author(s) and the copyright owner(s) are credited and that the original publication in this journal is cited, in accordance with accepted academic practice. No use, distribution or reproduction is permitted which does not comply with these terms.
*Correspondence: Qingbin Wang, cXdhbmdAdXZtLmVkdQ==