- 1International Maize and Wheat Improvement Center (CIMMYT)-Borlaug Institute for South Asia (BISA), Samastipur, Bihar, India
- 2Indian Council of Agricultural Research (ICAR)-Indian Agricultural Research Institute, Regional Station, Samastipur, Bihar, India
- 3Bihar Agricultural University, Bhagalpur, Bihar, India
- 4Dr. Rajendra Prasad Central Agricultural University, Samastipur, Bihar, India
- 5Indian Council of Agricultural Research (ICAR)-Research Complex for Eastern Region, Patna, Bihar, India
- 6Indian Council of Agricultural Research (ICAR)-Agricultural Technology Application Research Institute (Zone – IV), Garbhuchak, Bihar, India
- 7Krishi Vigyan Kendra, Banka, Bihar, India
- 8Veer Kunwar Singh College of Agriculture, Bihar Agricultural University, Bhagalpur, Bihar, India
- 9Krishi Vigyan Kendra, Bhagalpur, Bihar, India
- 10Krishi Vigyan Kendra, Gaya, Bihar, India
- 11Krishi Vigyan Kendra, Khagaria, Bihar, India
- 12Krishi Vigyan Kendra, Madhubani, Bihar, India
- 13Krishi Vigyan Kendra, Munger, Bihar, India
- 14Krishi Vigyan Kendra, Nalanda, Bihar, India
- 15Krishi Vigyan Kendra, Nawada, Bihar, India
- 16Indian Council of Agricultural Research (ICAR)-National Research Centre on Pomegranate, Solapur, Maharashtra, India
- 17Bhola Paswan Shastri Agricultural College, Purnea, Bihar Agricultural University (BAU), Sabour, Bihar, India
- 18Acharya Narendra Deva University of Agriculture and Technology, Ayodhya, UP, India
- 19Council of Scientific and Industrial Research (CSIR)-Central Mechanical Engineering Research Institute, Durgapur, India
- 20Department of Agriculture, Government of Bihar, Patna, Bihar, India
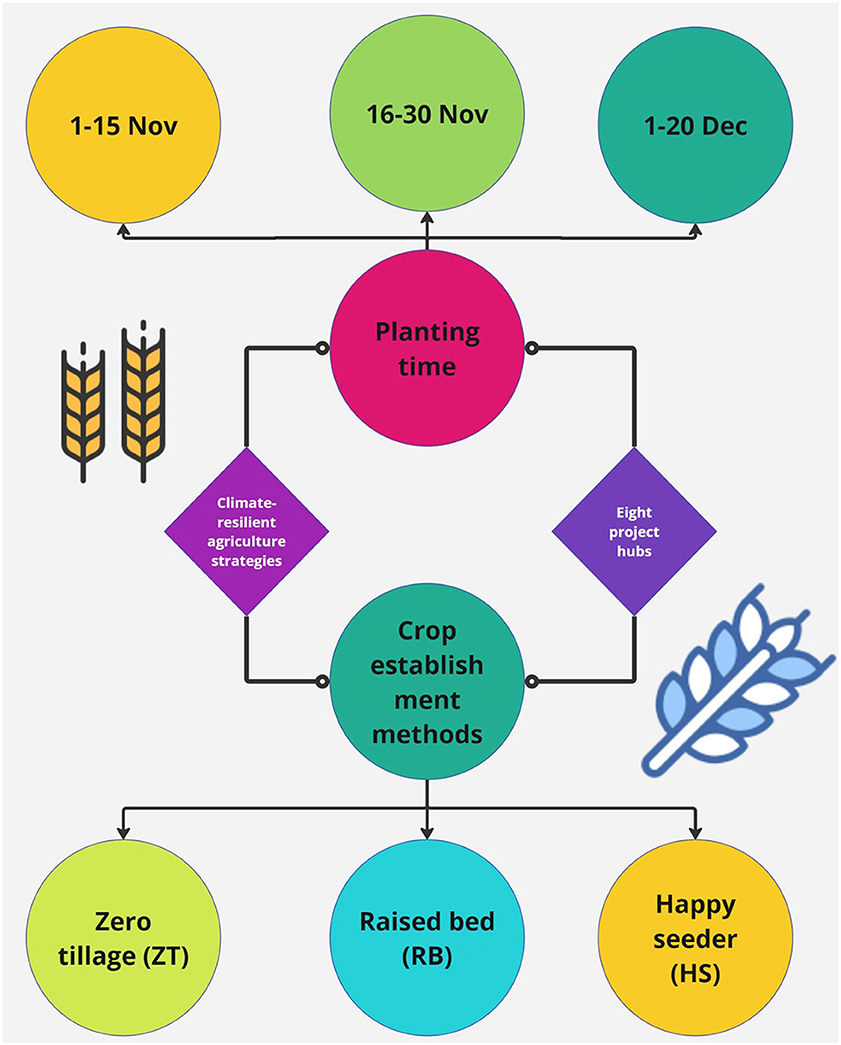
This study builds upon existing knowledge to quantify the extent of on-farm yield gaps and identify the most effective climate-resilient strategies (CRSs) to bridge them. By addressing these objectives, the study seeks to enhance wheat yield and resilience in the adverse climatic conditions. Productivity and adoption of CRSs are key indicators to monitor the progress toward more resilient production systems. Total eight project hubs were identified across Bihar (Banka, Bhagalpur, Gaya, Khagaria, Madhubani, Munger, Nalanda, and Nawada) for farmers-field experiment-cum-demonstration during rabi season (2019–2020). Three climate-resilient technologies (i) zero tillage (ZT), (ii) raised bed (RB), and (iii) happy seeder (HS) were evaluated across varying planting times from November 13 to December 31. Field experiments-cum-demonstrations conducted across 566 hectares involving 980 farmers in eight districts of Bihar revealed that early wheat planting (13–30 November) significantly enhanced grain productivity (up to 4.96 t/ha) and profitability (net returns up to $863/ha, B:C ratio 1.92), while delayed sowing (post–mid-December) led to yield reductions of up to 57%. Among crop establishment methods, happy seeder (HS) and zero tillage (ZT) consistently outperformed conventional farmer-managed practices, achieving 12.6–14.5% higher net returns and benefit-cost ratios up to 2.02, underscoring the agronomic and economic advantages of timely planting and resource-conserving technologies. The study concludes that sowing wheat in the second week of November using the Happy Seeder (HS) significantly boosts productivity and profitability. These results offer robust evidence to refine regional planting advisories and promote climate-resilient practices for enhancing wheat adaptation across subtropical India.
1 Introduction
Wheat (Triticum aestivum L.), the world's most extensively cultivated food crop, is a cornerstone of global agri-food security. According to the Food and Agriculture Organization of the United Nations (FAO) (2021), wheat supplies about 20% of daily protein and caloric intake for nearly 4.5 billion people, accounting for 40% of the global population (Singh et al., 2023). This staple crop's importance will only grow as the world population, projected to reach nine billion by 2050, drives a 60% increase in food production demand (Nelson et al., 2010). Amidst this backdrop, climate change and a burgeoning population present formidable challenges to agri-food and nutritional security in the 21st century (Rogelj et al., 2016; Ito et al., 2018). To find the way these challenges, innovative climate-resilient strategies (CRSs) and robust adaptation measures are essential to ensure the sustainable wheat production (Giraldo et al., 2019; Ben Hassen and El Bilali, 2022; Rahbari et al., 2023; Hasanain et al., 2025; Jat et al., 2025a; Meena et al., 2024).
Unfavorable climatic scenario, increasing trend of temperatures at key developmental stages shock wheat production, potentially important to crop failure/reduced yields (Shahid et al., 2024). Wheat is highly sensitive to temperature (Arshad et al., 2017), with optimal temperatures for various developmental stages noted as heading (16 ± 2.3°C), anthesis (23 ± 1.75°C), and grain filling (26 ± 1.53°C) (Khan et al., 2021). Research indicates that each Celsius degree increase during grain filling can reduce yield by 3–17% in South Asia (Ortiz et al., 2008; Lobell et al., 2011; Asseng et al., 2015; Pask et al., 2014).
Indian agriculture is highly vulnerable to climate change, facing risks from floods, droughts, and heat waves, which have increased in recent decades (Rao et al., 2016; Dhankher and Foyer, 2018; Elahi et al., 2019). Yield losses reached 5.2% from 1981 to 2009 due to global warming, despite adaptation efforts (Gupta et al., 2017). The adaptation of CRSs for addressing climate change challenges (i) climate-resilient varieties, and (ii) innovative agriculture management practices will improve the wheat productivity (Jardón et al., 2023; Jiang et al., 2023). A study in China (1981–2018) highlighted that climate warming impacts wheat phenology more than agricultural practices (Tao et al., 2022). Delayed sowing of winter wheat reduces yield (Wang et al., 2023), while timely planting increases yields and water efficiency (Islam et al., 2022; Jalota et al., 2013). Adopting heat-tolerant wheat varieties and CRSs can mitigate climate impacts (Jat et al., 2019, 2020). Climate-resilient agriculture (CRA) aims to revolutionize agricultural development amidst climate change challenges, prioritizing resilience and sustainability over mere production increases (Jat et al., 2025b).
In Bihar, a program seeks evidence-based strategies to combat climate threats and enhance staple crop systems. Little is known about wheat crop performance with planting windows spanning from first week of November to late December, and various establishment methods (zero tillage-ZT, raised bed-RB, happy seeder-HS) in subtropical agroecological landscape of India. This study investigates productivity and profitability implications, hypothesizing that delayed wheat planting and different establishment methods reduce farmer profitability in the Eastern Indo-Gangetic Plains (EIGP). Key objectives include (i) assessing productivity changes with planting times, (ii) identifying optimal establishment methods, and (iii) determining effective combinations of climate-resilient strategies (CRSs) for wheat sustainability.
2 Materials and methods
2.1 Site description
Eight project hubs were established in 2019–2020 to implement CRSs in different agroecological landscapes of Bihar (Figure 1). These sites include Bhagalpur (25° 35′ N, 86° 98′ E), Banka (24° 89′ N, 86° 92′ E), Gaya (24° 72′ N, 84° 86′ E) Khagaria (25° 48′ N, 86° 70′ E), Madhubani (26° 46′ N, 86° 18′ E), Nawada (24° 88′ N, 85° 54′ E), Nalanda (25° 26′ N, 85° 47′ E), and Munger (25° 37′ N, 86° 47′ E) initiated field demonstrations from the Rabi season of 2019–2020 (Figure 2; Supplementary Table S1). Field experiments-cum-demonstrations (one acre per farmer) were conducted on farmers' fields across the eight designated project hubs, with one village selected from each of the identified districts (Supplementary Table S1).
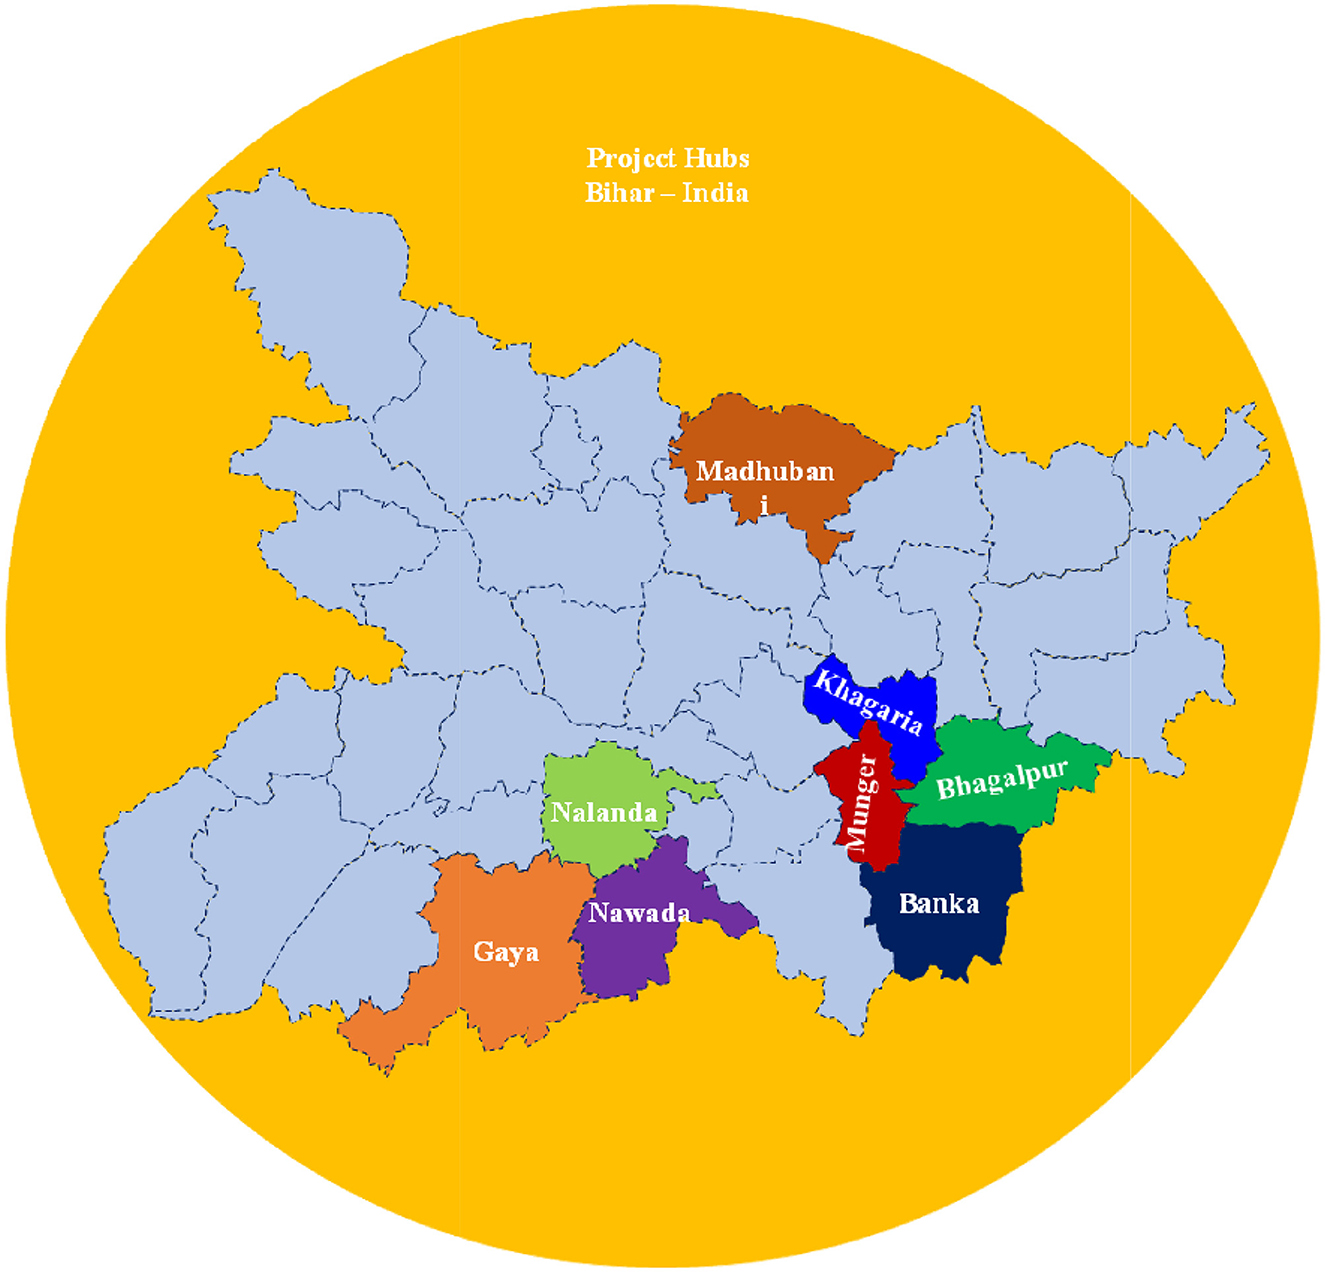
Figure 1. Locations of eight district experimental hubs in Bihar state of India (Banka, Bhagalpur, Gaya, Khagaria, Madhubani, Munger, Nalanda, and Nawada).
The project hubs exhibit diverse soil types: Banka has sandy loam, Bhagalpur clay loam, Gaya silty loam, and Khagaria loamy soils. Madhubani and Munger feature fertile alluvial soils, while Nalanda and Nawada range from old alluvium to sandy loam and red soils, aiding varied crop potential. These regions, influenced by rivers like the Ganga and Kosi, feature varying fertility, infiltration, and erosion levels, shaping distinct agricultural conditions. This study was conducted collaboratively with the Borlaug Institute for South Asia (BISA), Dr. Rajendra Prasad Central Agricultural University (RPCAU), ICAR-Research Complex for Eastern Region (ICAR-RCER), and Bihar Agricultural University (BAU) with help of Krishi Vigyan Kendra (Bhagalpur, Banka, Gaya, Khagaria, Madhubani, Nawada, Nalanda and Munger). It was part of the “Climate Resilient Agriculture Programme” funded by the Bihar State Government.
2.2 Experimental details
A total of 220 field experiments-cum-demonstrations (Figure 3) were conducted at different 980 farmers' fields, in 566 hectare area under different planting time (13 November to 31 December) and three climate resilient strategies [zero tillage (ZT), raised bed (RB) and happy seeder (HS)] were used (Supplementary Table S2).
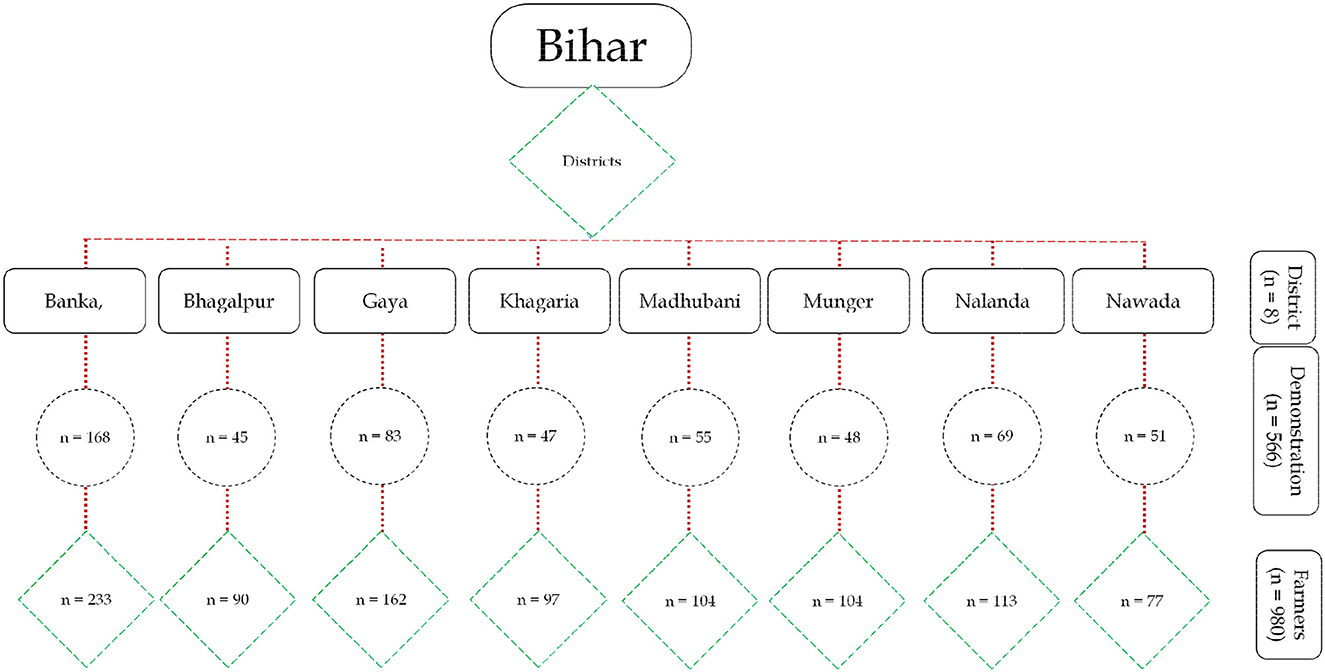
Figure 3. Description of number of field demonstrations across eight project hubs (Banka, Bhagalpur, Gaya, Khagaria, Madhubani, Munger, Nalanda, and Nawada).
2.3 Fertilizer management and planting machinery
A standardized fertilizer regimen included 150 kg of nitrogen (N), 26 kg of phosphorus (P), and 50 kg of potassium (K) per hectare for all planting methods. Initially, 50 kg of N along with full doses of P and K were applied at a 10 cm depth using a ZT seed-cum-fertilizer drill or HS during planting (Hasanain et al., 2024; Jat et al., 2025a). The remaining 100 kg of N was split equally at crown root initiation (CRI), maximum tillering, and booting stages, coinciding with the first and third irrigations. Top dressing involved broadcasting fertilizers, primarily targeting crop rows.
2.4 Crop management
The widely grown wheat cultivar HD2967 was planted in rows 20 cm apart using ZT seed-cum-fertilizer drill, HS, and RBP from November 13 to December 31 across eight districts under the climate resilient agriculture (CRA) program. Pre-seeding application of Glyphosate (0.9 kg/ha) effectively controlled existing weeds. Post-emergence weed management through herbicides include Ally (Metsulfuron-methyl, 4–6 g/ha) for broadleaf weeds, Leader/Total (Sulfosulfuron, 25 g/ha) for grassy weeds, and Total Gold (Sulfosulfuron + Metsulfuron, 32 g/ha) for mixed weed populations. These are best applied between 25 and 30 days after sowing (DAS) for effective control (Supplementary Table S3).
2.5 Measurement of yields and labor use
Wheat grain and straw yields were measured in the central net plot area (20 × 10 m), excluding one-meter border rows on all sides. Harvesting involved manual reaping with a reaper set ~10 cm above ground level, conducted in randomly selected quadrates (10 replications). Grain yields were reported at 12% moisture content. Labor was employed for various field operations such as tillage, seeding, irrigation, fertilization, pest control, weeding, monitoring, and harvesting. According to the Government of India's labor commission, 8 hours of manual labor constituted one person-day equivalent.
2.6 Economic analysis
The cost incurred from sowing to harvest, including threshing, cleaning and transportation is called the cost of cultivation. It includes human labor, machine hiring cost, seeds, insecticides, land rent, interest on working capital, etc. This cost of cultivation is common to all treatments except fertilizer cost because it varies from treatment to treatment.
2.7 Statistical analysis
Data were statistically analyzed to assess differences in crop yields and establishment methods using Analysis of Variance (ANOVA) in Microsoft Excel. Standard errors of the treatment means were calculated to facilitate comparison among treatments. Statistical significance was evaluated at the 5% probability level (p < 0.05) (Snedecor and Cochran, 1989). Where significant differences were observed, post-hoc comparisons (e.g., LSD test) were conducted to distinguish treatment effects more precisely.
3 Results
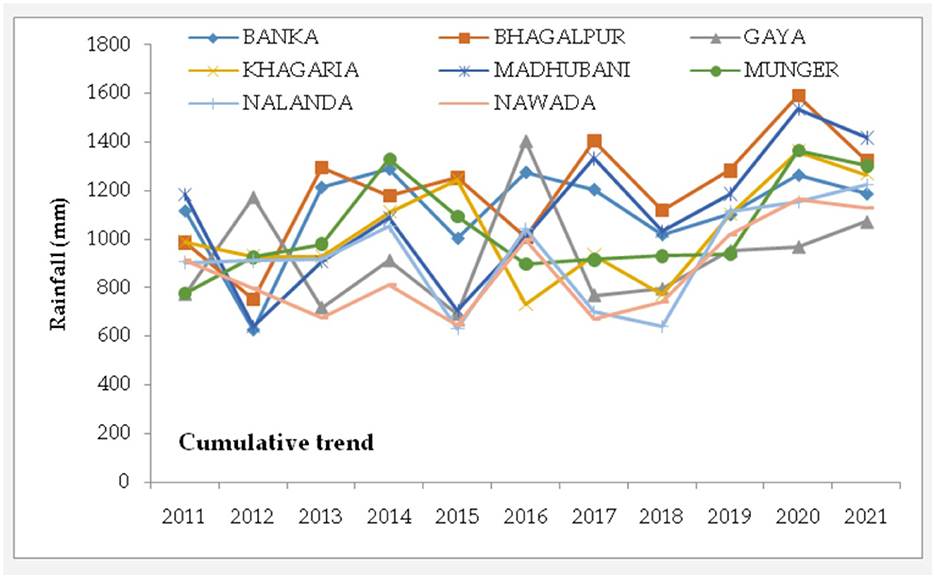
3.1 Rainfall trends (2011–2021)
3.1.1 Banka project hub
Data showed that a 10 year of rainfall trend of Banka project hub (Figures 4, 5). Rainfall significantly varied (627.5–1,290.5 mm), maximum reported in the year 2014 and lowest was in 2012. Results showed that and percentage change from the base year (2011) it was (−43.94%) at 2012, (+8.77%) at 2013, (+15.53%) at 2014, (−10.16%) at 2015, (+14.18%) at 2016, (+7.87%) at 2017, (−8.80%) at 2018, (−1.43%) at 2019, (+13.16%) at 2020, and (+6.26%) at 2021.
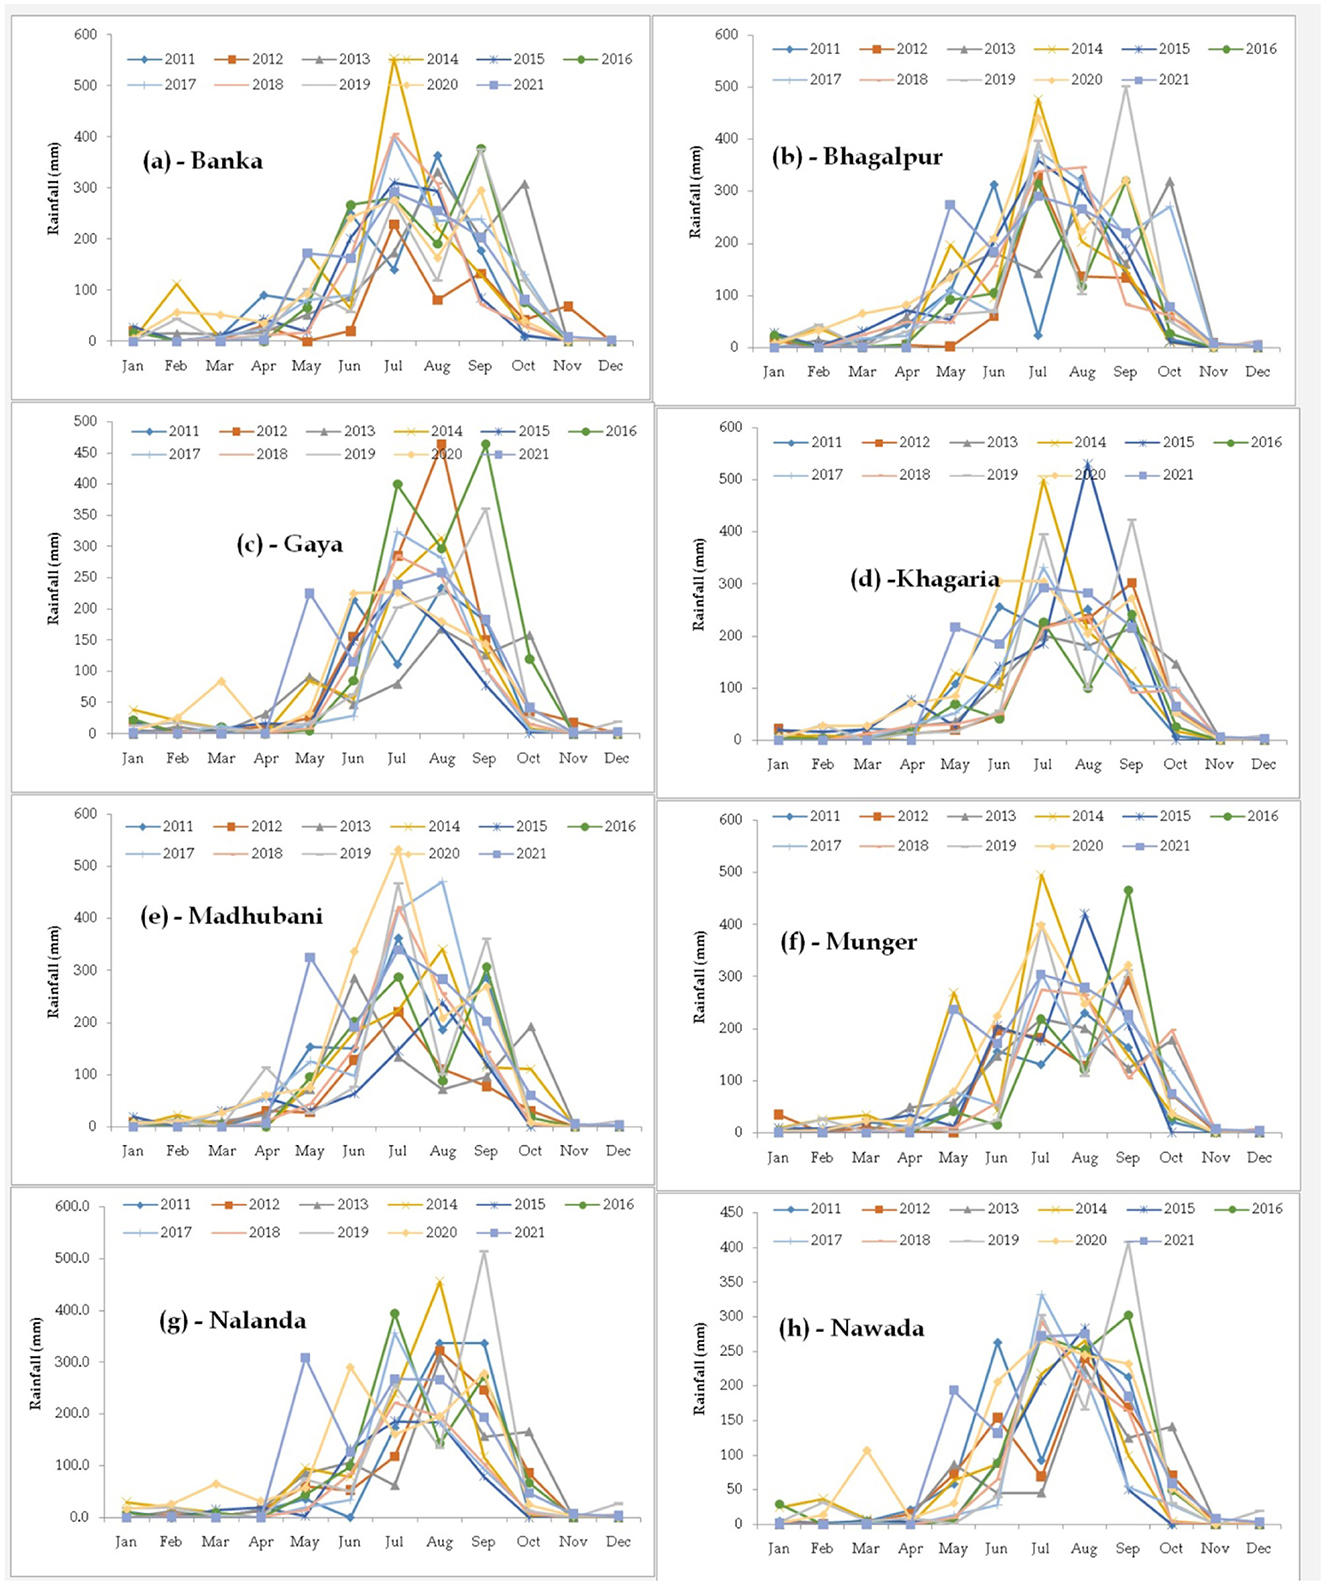
Figure 4. Month wise rainfall trends (10-yrs) of eight project hubs. (a) Banka, (b) Bhagalpur, (c) Gaya, (d) Khagaria, (e) Madhubani, (f) Munger, (g) Nalanda, and (h) Nawada.
3.1.2 Bhagalpur project hub
Results of 10-year trend and percentage change from the base year (2011) for the district of Bhagalpur (Figures 4, 5). Maximum (1,591.8 mm) rainfall was reported in 2020, and minimum (752.6 mm) in 2012. While percentage change over the period was (−23.73%) in 2012, (+31.23) in 2013, (+19.46%) in 2014, (+27.05%) in 2015, (+2.25%) in 2016, (+42.64%) at 2017, (+13.54%) at 2018, (+30.12%) at 2019, (+61.32%) at 2020, and (+34.49%) at 2021.
3.1.3 Gaya project hub
Data showed that 10-year rainfall trend and percentage change from the base year (2011) significantly varied for the district of Gaya (Figures 4, 5). The highest rainfall (1,404.8 mm) was reported in 2016 and lowest was (690.5 mm) in 2015. Meanwhile, the percentage change was (+51.63%) in 2012, (−7.21%) in 2013, (+17.94%) in 2014, (−10.70%) in 2015, (+81.66%) in 2016, (−0.63%) in 2017, (+2.78%) in 2018, (+23%) in 2019, (+25.10%) in 2020, and (+38.48%) in 2021.
3.1.4 Khagaria project hub
Ten-year rainfall trend and percentage change from the base year (2011) significantly varied for the district of Khagaria (Figures 4, 5). Data showed that maximum (1,361.5 mm) rainfall in 2020 and lowest (731 mm) with 2016. The percentage change from the base year was (−6.08%) in 2012, (−6.11%) in 2013, (+12.50%) in 2014, (+25.92%) in 2015, (−26.00%) at 2016, (−5.50%) at 2017, (−21.85%) at 2018, (+11.41%) at 2019, (+37.85%) at 2020, and (+28.23%) at 2021.
3.1.5 Madhubani project hub
Data showed that 10-year rainfall trend and percentage change significantly varied from the base year (2011) for the district of Madhubani (Figures 4, 5). The highest (1,536.2 mm) rainfall was reported in 2020 and lowest (641.8 mm) was in 2012. The pattern of percentage change from the base year was (−45.79%) in 2012, (−23.31%) in 2013, (−8.17%) at 2014, (−40.28%) at 2015, (−14.89%) at 2016, (+12.66%) at 2017, (−12.81%) at 2018, (+0.25%) at 2019, (+29.78%) at 2020, and (+19.88%) at 2021.
3.1.6 Munger project hub
Results of 10-year rainfall trend analysis and percentage change varied from the base year (2011) for the district of Munger (Figures 4, 5). Significantly maximum (1,364.3 mm) was noticed at 2020 and lowest (927.2 mm) was reported at 2012. While percentage change from base year was (+18.95%) at 2012, (+25.98%) at 2013, (+70.49%) at 2014, (+40.41%) at 2015, (+15.33%) at 2016, (+17.70%) at 2017, (+19.61%) at 2018, (+20.68%) at 2019, (+74.99%) at 2020, and (+67.12%) at 2021.
3.1.7 Nalanda project hub
Results of 10-year trend analysis of rainfall and percentage change from the base year (2011) for the district of Nalanda (Figures 4, 5). Significant variations in rainfall were noticed across the years, with the highest recorded at 1,222.3 mm in 2021 and the lowest at 630.7 mm in 2015. The change in pattern from the base year was (+0.65%) in 2012, (+1.29%) at 2013, (+16.56%) at 2014, (−30.23%) at 2015, (+15.05%) at 2016, (−22.51%) at 2017, (−29.31%) at 2018, (+23.20%) at 2019, (+27.38%) at 2020, and (+35.20%) at 2021.
3.1.8 Nawada project hub
Data showed that 10-year rainfall trend and percentage change from the base year (2011) for the district of Nawada (Figures 4, 5). Significant variations in rainfall were noticed across the years, with the highest recorded at 1,163.6 mm in 2020 and the lowest at 680.0 mm in 2013. The change in pattern from the base year was (−12.72%) in 2012, (−25.50%) at 2013, (−11.01%) at 2014, (−28.88%) at 2015, (+9.52%) at 2016, (−26.30%) at 2017, (−18.38%) at 2018, (+11.52%) at 2019, (+27.50%) at 2020, and (+23.89%) at 2021.
3.1.9 Cumulative of eight project hubs
Figure 5 presents the 10-year rainfall trend analysis and the percentage change from the base year (2011) across all project hubs (Banka, Bhagalpur, Gaya, Khagaria, Madhubani, Munger, Nalanda, and Nawada). Significant variations in rainfall were noticed across the years, with the highest recorded at 1,306.775 mm in 2020 and the lowest at 841.225 mm in 2012. Percentage change from the base year (2011) for each subsequent year (2012–2021), it was (-11.20%) at 2012, (−1.95%) at 2013, (+16.67%) at 2014, (−2.92%) at 2015, (+10.01%) at 2016, (+6.67%) at 2017, (−5.16%) at 2018, (+15.79%) at 2019, (+37.81%) at 2020, and (+30.01%) at 2021.
3.2 Planting time
Data from the wheat experiments-cum-demonstrations area spanning ~566 hectares across 980 smallholding agroecological landscape of the Bihar revealed notable trends (Figure 6). Data showed that during the winter wheat season 2019–2020, most of the crop was planted from 13 November to 31 December 2019 in all eight district hubs (Banka, Bhagalpur, Gaya, Khagaria, Madhubani, Munger, Nalanda, and Nawada). In this region early planting of wheat was started from 13 November in Nalanda district hub followed by Banka and delayed (19–31 December) planted in Khagaria hub.
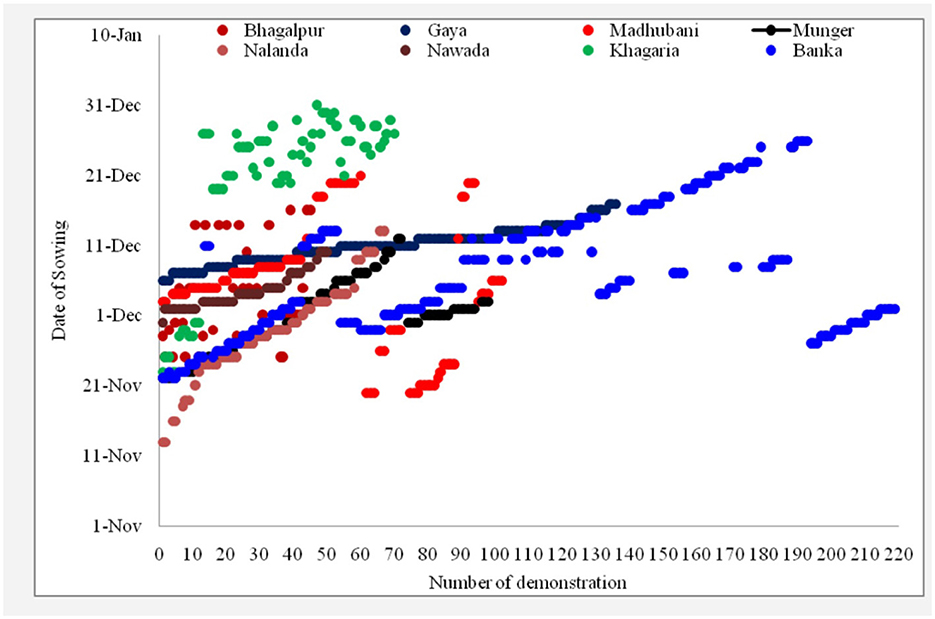
Figure 6. Different planting dates for the rabi season and number of field demonstrations across eight project hubs (Banka, Bhagalpur, Gaya, Khagaria, Madhubani, Munger, Nalanda, and Nawada).
Farmers in this region predominantly cultivate the winter wheat (HD2967) crop from mid-November to the end of December. Analysis of around 220 combined experiments-cum-demonstrations indicated that planting dates across all locations extended over a planting window of more than 1 month. The peak planting period, observed across most districts in Bihar, occurred from the last week of November to the second week of December (Figure 6).
3.3 Impact of planting date on productivity and profitability
3.3.1 Banka project hub
The experiment was conducted in 168 ha area at 233 farmers field (Supplementary Table S2). In Banka project hub, wheat planting was started on 21 November and completed on 12 December with above mentioned planting methods. The productivity varied from 3.89 to 4.26 t/ha for different planting dates (Figure 7a). The highest productivity (4.26 t/ha) was observed with 21 November planting date followed by the next planting date. However, the lowest (3.89 t/ha) was reported with 12 December 9% lower than 21 November planting (Figure 7a). It was observed that the delaying of the wheat planting reduced the yield as compared to early sowing of wheat crop in Banka demonstration hub (Figure 7a).
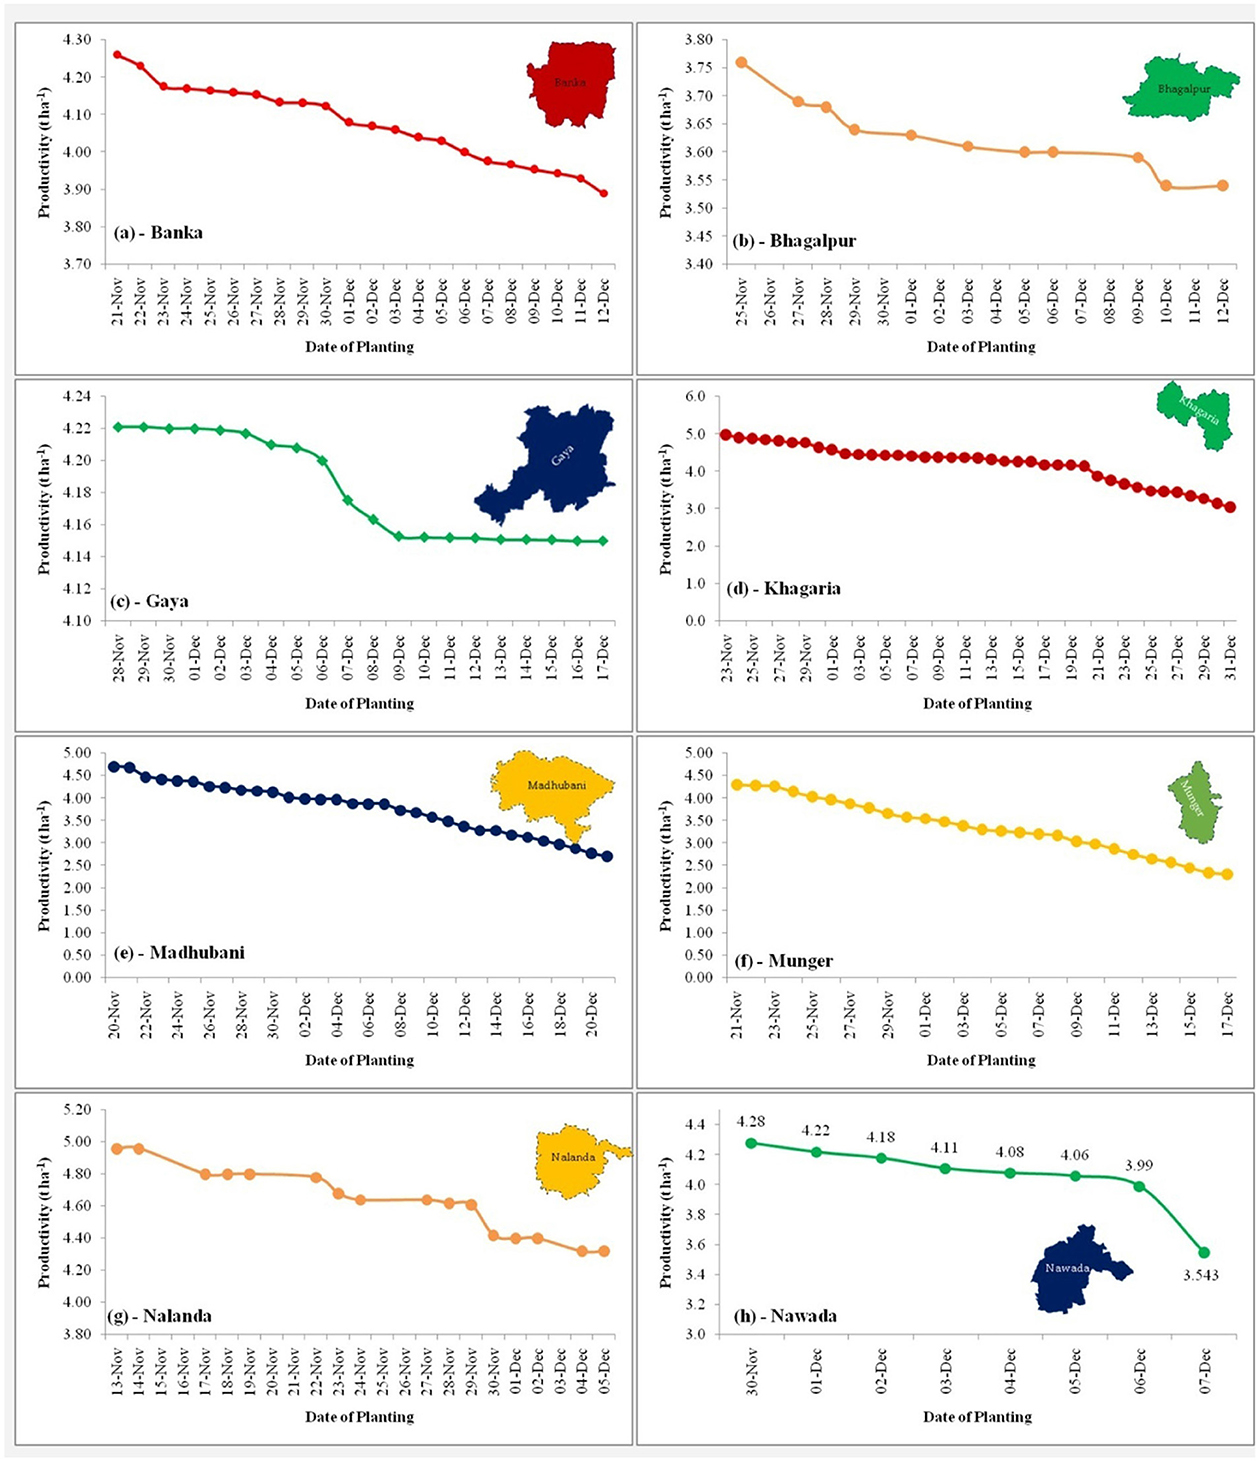
Figure 7. Effect of planting time on wheat productivity across eight project hubs. (a) Banka, (b) Bhagalpur, (c) Gaya, (d) Khagaria, (e) Madhubani, (f) Munger, (g) Nalanda, and (h) Nawada.
The average cost of cultivation, gross return, and net return were ~$417, $1,047, and $630/ha, respectively. However, the benefit-to-cost ratio was 1.54 for the Banka project hub, the figures remained consistent, and indicating a robust economic outcome for the wheat cultivation practices implemented (Table 1).
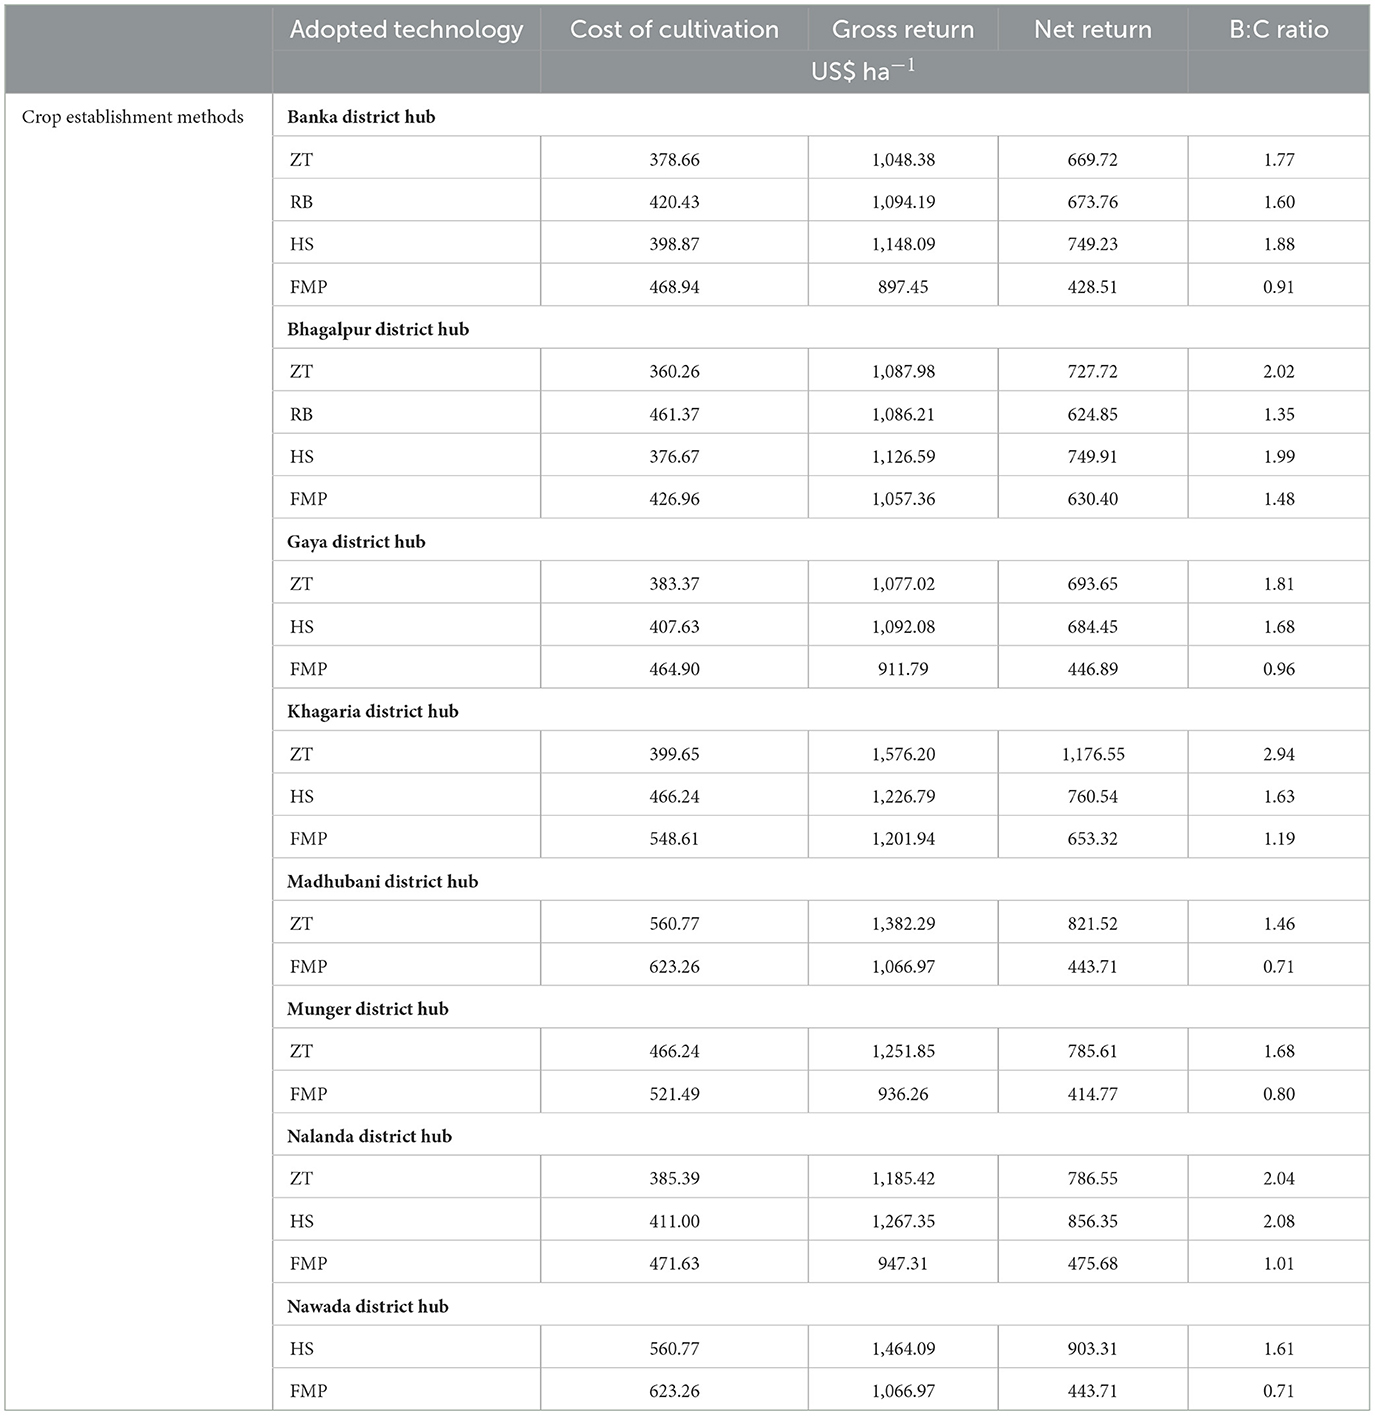
Table 1. Effect of different crop establishment technologies on wheat profitability across all locations (Banka, Bhagalpur, Gaya, Khagaria, Madhubani, Munger, Nalanda, and Nawada).
3.3.2 Bhagalpur project hub
Field experiments-cum-demonstrations was conducted in 45 ha land at 90 farmers field (Supplementary Table S1). In Bhagalpur project hub wheat planting was started on 25 November and completed on 12 December. The productivity varied from 3.54 to 3.76 t/ha under different dates of planting (Figure 7b). The highest productivity (3.76 t/ha) of wheat was observed with 25 November planted wheat followed by the rest of the planting dates. However, the lowest (3.54 t/ha) was reported on 12 December, 5.85% lower than 25 November planting (Figure 7b).
The average cost of cultivation, gross return, and net return were ~$406, $1,090, and $683/ha, respectively, with a benefit-to-cost ratio of 1.71. For farmer management practices, these values were $427, $1057, and $630/ha, respectively. The benefit-to-cost ratio was 1.48. For the Bhagalpur project hub, the figures remained consistent, indicating a robust economic outcome for the wheat cultivation practices implemented (Table 1).
3.3.3 Gaya project hub
A total 83 ha field experiments-cum-demonstrations was conducted at 162 farmers field (Supplementary Table S1). In Gaya project hub wheat planting was started on 28 November and completed on 17 December. The productivity was varied from 4.15-to-4.22 t/ha under different dates of planting (Figure 7c). The highest productivity (4.22 t/ha) of wheat was observed with 28 November planted wheat followed by the rest of the planting dates. However, the lowest (4.15 t/ha) was reported with 17 December ~2% lower than 28 November planting (Figure 7c).
The average cost of cultivation, gross return, and net return were ~$419, $1,027, and $608/ha, respectively, with a benefit-to-cost ratio of 1.48. For farmer management practices, these values were $465, $912, and $447/ha, respectively. The benefit-to-cost ratio was 0.96. For the Gaya project hub, these figures remained consistent, indicating a robust economic outcome for the wheat cultivation practices implemented (Table 1).
3.3.4 Khagaria project hub
A total of 47 ha land was covered for the field experiments-cum-demonstrations at 97 farmer's fields (Supplementary Table S1). In Khagaria project hub, wheat planting was started on 23 November and completed on 31 December. The productivity varied from 3.04 to 4.99 t/ha under different dates of planting (Figure 7d). The highest productivity (4.99 t/ha) of wheat was observed with 23 November planted wheat followed by the rest of the planting dates. However, the lowest (3.04 t/ha) was reported with 31 December lower (39%) than the 23 November planting (Figure 7d).
The average cost of cultivation, gross return, and net return were ~$472, $1,335, and $863/ha, respectively, with a benefit-to-cost ratio of 1.92. Under farmer management practices, these values were $549, $1,202, and $653 per hectare, respectively, with a benefit-to-cost ratio of 1.19 (Table 1).
3.3.5 Madhubani project hub
A total of 55 ha field experiments-cum-demonstrations was conducted at 104 farmers field (Supplementary Table S1). In Madhubani project hub, wheat planting was started on 20 November and completed on 20 December. The productivity varied from 2.71 to 4.77 t/ha under different dates of planting (Figure 7e). The highest productivity (4.77 t/ha) of wheat was observed with 20 November planted wheat followed by rest of the planting dates. However, the lowest (2.71 t/ha) was reported with 20 December ~42% lower than 20 November planting (Figure 7e). Meanwhile, reduced yields are reported from plots where sowing took place in November and beyond first week of December.
The average cost of cultivation, gross return, and net return were $592, $1,225, and $633/ha, respectively, with a benefit-to-cost ratio of 1.09. For farmer management practices, these figures were $623, $1,067, and $444/ha, with a benefit-to-cost ratio of 0.71 (Table 1).
3.3.6 Munger project hub
A total 48 ha field experiments-cum-demonstrations was conducted at 104 farmers field (Supplementary Table S1). In Munger project hub wheat planting was started on 21 November and completed on 17 December. The productivity varied from 2.30 to 4.30 t/ha under different dates of planting (Figure 7f). The highest productivity (4.30 t/ha) of wheat was observed with 21 November planted wheat followed by the rest of the planting dates. However, the lowest (2.30 t/ha) was reported with 17 December ~47% lower than 21 November planting (Figure 7f). Meanwhile, reduced yields are reported from plots where sowing took place in November and beyond the first week of December.
Average cost of cultivation, gross return, and net return were approximately $494, $1,096, and $600/ha, respectively, with a benefit-to-cost ratio of 1.24. For farmer management practices, these values were $522, $936, and $415/ha, respectively, with a benefit-to-cost ratio of 0.80 (Table 1).
3.3.7 Nalanda project hub
A total 69 ha field experiments-cum-demonstrations has been conducted at 113 farmers field (Supplementary Table S1). In Nalanda project hub wheat planting started on 13 November and completed on 5 December. Results showed that the wheat productivity varied from 4.32 to 4.96 t/ha under different dates of planting (Figure 7g). The trend line showed that there is a clear decreasing trend in yield as sowing proceeds from 13 November to 5 December. The highest productivity (4.96 t/ha) of wheat was observed with 13 November planted wheat followed by the rest of the planting dates. However, the lowest (4.32 t/ha) was reported with 5 December ~13% lower than 13 November planting (Figure 7g). The average cost of cultivation, gross return, and net return were approximately $423, $1,133, and $706/ha, respectively, resulting in a benefit-to-cost ratio of 1.71. For farmer management practices, the values were $471, $947, and $476/ha, with a benefit-to-cost ratio of 1.01 (Table 1).
3.3.8 Nawada project hub
A total 51 ha field experiments-cum-demonstrations has been conducted at 77 farmers field (Supplementary Table S1) planting started on 30 November and continued till 7 December. Results showed that the wheat productivity varied from 3.54-to-4.28 t/ha under different dates of planting (Figure 7h). The trend line showed that there is a clear decreasing trend in yield as sowing proceeds from 30 November to 7 December. The highest productivity (4.28 t/ha) of wheat was observed with 30 November planted wheat followed by rest of the planting dates. However, the lowest (3.54 t/ha) was reported with 7 December ~18% lower than 30 November planting (Figure 7h).
The average cost of cultivation, gross return, and net return were ~$592, $1,266, and $674/ha, respectively, with a benefit-to-cost ratio of 1.16. For farmer management practices, these values were $623, $1,167, and $444/ha, resulting in a benefit-to-cost ratio of 0.71 (Table 1).
3.3.9 Cumulative of eight project hubs
A total of 220 field experiments-cum-demonstrations were conducted at 566 ha land of 980 farmers (Supplementary Table S1). Maximum area covered (30%) by Banka followed by Gaya (15%), Nalanda (12%), Madhubani (10%), Nawada (9%) and lowest area covered by Bhagalpur, Khagaria and Munger (8% each) (Supplementary Figure S2a). Meanwhile, in the case of the number of farmers covered, the maximum covered Banka (24%), followed by Gaya (16%), Madhubani, Munger and Nalanda (11% each), Khagaria (10%), Bhagalpur (9%), and lowest was covered by 8% Nalanda (Supplementary Figure S1a, b). All project hubs (Banka, Bhagalpur, Gaya, Khagaria, Madhubani, Munger, Nalanda, and Nawada) planting was started on 13 November and completed on 31 December. Results reflect the variation in wheat productivity (2.14-to-4.96 t/ha) under different dates of planting (Figure 8).
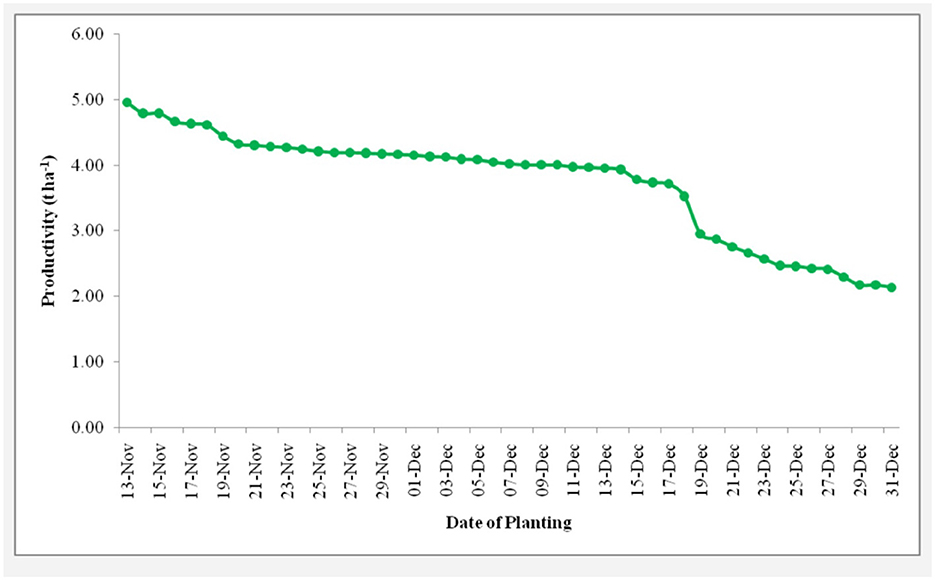
Figure 8. Effect of planting time on average wheat productivity across all experimental sites (Banka, Bhagalpur, Gaya, Khagaria, Madhubani, Munger, Nalanda, and Nawada).
The trend line showed that there is a clear decreasing trend in yield as sowing proceeds from 13 November to 31 December. The highest productivity (4.96 t/ha) of wheat was observed with 13 November planted wheat followed by the rest of the planting dates (Figure 8). However, the lowest (2.14 t/ha) was reported with 31 December ~57% lower than 13 November planting (Figure 8; Table 1).
3.3 Impact of crop establishment methods on productivity and profitability
3.3.1 Banka project hub
Results showed that all three planting technologies (ZT, RB, and HS) achieved higher grain yields compared to FMP (Table 2). The average wheat grain yield was 3.89 t/ha and straw yield was 5.81 t/ha. In contrast, under FMP, the grain yield was 3.33 t/ha and straw yield was 4.98 t/ha. The HS method produced the highest grain yield of 4.26 t/ha, followed by RB at 4.06 t/ha, while the lowest yield was recorded at ZT (3.89 t/ha). For straw yield, HS also resulted in the highest yield of 6.26 t/ha, followed by RBP at 6.02 t/ha and ZT at 5.96 t/ha (Table 2).

Table 2. Effect of different crop establishment technologies on wheat productivity across all locations (Banka, Bhagalpur, Gaya, Khagaria, Madhubani, Munger, Nalanda, and Nawada).
Regarding profitability, the average values were $417, $1,047, and $630/ha for cost of cultivation, gross return, and net return, respectively, with a benefit-to-cost ratio of 1.54 (Table 1). However, the maximum profitability was observed with the HS method, with values of $399, $1,148, and $749/ha for cost of cultivation, gross return, and net return, respectively, and a benefit-to-cost ratio of 1.88. Meanwhile, the lowest benefit-to-cost ratio (0.91) was recorded with FMP (Table 1).
3.3.2 Bhagalpur project hub
The average wheat grain yield was 3.62 t/ha and straw yield was 4.87 t/ha. Under FMP, the grain yield was 3.47 t/ha and straw yield was 4.86 t/ha. HS method achieved the highest grain and straw yields of 3.74 and 5.01 t/ha, followed by RB at 3.65 and 4.72 t/ha, with the lowest yields recorded with ZT at 3.60 and 4.89 t/ha, respectively (Table 2).
In terms of profitability, the average values were $406, $1,090, and $683/ha for cost of cultivation, gross return, and net return, respectively, with a benefit-to-cost ratio of 1.71 (Table 1). The highest profitability was observed with the ZT method, with values of $360, $1,088, and $728/ha for cost of cultivation, gross return, and net return, respectively, and a benefit-to-cost ratio of 2.02. This was followed by the HS and RB methods (Table 1).
3.3.3 Gaya project hub
Date showed that the average wheat grain yield was 3.96 t/ha and straw yield was 5.50 t/ha. In contrast, under FMP, the grain yield was 3.52 t/ha and straw yield was 5.57 t/ha. HS produced the highest grain and straw yields of 4.21 and 5.63 t/ha, respectively, while ZT yielded 4.15 and 5.31 t/ha, respectively (Table 2).
Regarding profitability, the average values were $419, $1,027, and $608/ha for cost of cultivation, gross return, and net return, respectively, with a benefit-to-cost ratio of 1.48 (Table 1). However, the maximum profitability was achieved with the ZT method, with values of $383, $1,077, and $694/ha for cost of cultivation, gross return, and net return, respectively, and a benefit-to-cost ratio of 1.81. This was followed by HS, while the lowest profitability was reported with FMP (Table 1). On average, wheat grain yield increased by 19.4% with HS and 17.6% with ZT, compared to FMP.
Data showed that profitability (Table 1), adopting these technologies resulted in higher economic returns. The average net return increased by 12.6% with HS and 14.5% with ZT compared to the overall average. Specifically, the highest profitability was observed with ZT, which recorded a net return increase of 14.5%, with a benefit-to-cost ratio of 1.81. HS followed closely with a 12.6% net return increase and a benefit-to-cost ratio of 1.68 (Table 1).
3.3.4 Khagaria project hub
Results indicated that both ZT and HS achieved significantly higher grain yields compared to FMP (Table 2). The average wheat grain yield was 4.34 t/ha and straw yield was 4.33 t/ha. In contrast, under FMP, the grain yield was 3.04 t/ha and straw yield was 3.35 t/ha. HS produced the highest grain yield of 4.99 t/ha and straw yield of 4.81 t/ha, while ZT also yielded 4.99 and 4.81 t/ha for grain and straw, respectively (Table 2).
Meanwhile, profitability, the average values were $472, $1,335, and $863/ha for cost of cultivation, gross return, and net return, respectively, with a benefit-to-cost ratio of 1.92 (Table 1). The maximum profitability was observed with the ZT method, yielding $400, $1,576, and $1,177/ha for cost of cultivation, gross return, and net return, respectively, and a benefit-to-cost ratio of 2.94. HS followed closely in profitability. In contrast, FMP reported the lowest profitability with a benefit-to-cost ratio of 1.19 (Table 1). Additionally, the percentage increase in grain yield with HS compared to FM was approximately 64.8%, while with (64.8%) at ZT (Table 1).
3.3.5 Madhubani project hub
Results demonstrate that ZT significantly increases wheat yields compared to FMP (Table 2). The average wheat grain yield was 3.71 t/ha and straw yield was 3.76 t/ha. In contrast, under FMP, the grain yield was 2.71 t/ha and straw yield was 2.84 t/ha. ZTP resulted in the highest grain yield of 4.71 t/ha and straw yield of 4.68 t/ha (Table 2), showcasing substantial improvements in productivity. Grain yield was 73.4% higher with ZT compared to FMP, while straw yield showed a 65.5% increase with ZT.
Data showed that profitability (Table 1), the average values were $592, $1,225, and $633/ha for cost of cultivation, gross return, and net return, respectively, with a benefit-to-cost ratio of 1.09 (Table 1) However, ZT exhibited the highest profitability, with values of $561, $1,382, and $822/ha for cost of cultivation, gross return, and net return, respectively, and a benefit-to-cost ratio of 1.46 (Table 1). ZT had +29.8% higher net returns compared to average. In contrast, FMP reported the lowest profitability, underscoring the economic advantages of adopting ZT in wheat cultivation practices (Table 1).
3.3.6 Munger project hub
Data showed that adopting ZT significantly enhances wheat yields compared to FMP (Table 2). The average wheat grain yield was 3.30 t/ha and straw yield was 3.79 t/ha. In contrast, under FMP, the grain yield was 2.30 t/ha and straw yield was 2.79 t/ha. ZT achieved the highest grain yield of 4.30 t/ha and straw yield of 4.78 t/ha (Table 2), demonstrating substantial increases in productivity. ZT outperformed FMP with a remarkable 86.9% increase in grain yield and a substantial 71.3% increase in straw yield.
Results showed that profitability (Table 1), the average values were $494, $1,094, and $600/ha for cost of cultivation, gross return, and net return, respectively, with a benefit-to-cost ratio of 1.24. However, ZT exhibited the highest profitability, with values of $466, $1,252, and $786/ha for cost of cultivation, gross return, and net return, respectively, and a benefit-to-cost ratio of 1.69 (Table 1). ZT showed a significant 31.0% increase in net return compared to the average, highlighting its economic advantage over other practices (Table 1).
3.3.7 Nalanda project hub
Data showed that both ZT and HS significantly outperformed FMP in terms of wheat yields (Table 2). The average wheat grain yield was 4.47 t/ha and straw yield was 5.57 t/ha. In contrast, under FMP, the grain yield was 3.82 t/ha and straw yield was 3.46 t/ha. HS achieved the highest grain yield of 4.95 t/ha and straw yield of 6.75 t/ha, while ZT recorded 4.63 t/ha for grain and 6.50 t/ha for straw yield (Table 2), indicating substantial improvements in productivity. HS achieved 29.3% higher grain yield, and 94.8% higher straw yield compared to FMP. ZT also showed increases of 21.1% in grain yield and 87.3% in straw yield over FMP.
Regarding profitability (Table 1), the average values were $423, $1,133, and $706/ha for cost of cultivation, gross return, and net return, respectively, with a benefit-to-cost ratio of 1.71. However, HS showed the maximum profitability, with values of $411, $1,267, and $856/ha for cost of cultivation, gross return, and net return, respectively, and a benefit-to-cost ratio of 2.08 (Table 1). HS showed a 21.1% increase in net return compared to the average. Conversely, FMP reported the lowest profitability, highlighting the economic advantages of adopting ZT and HS in wheat cultivation practices (Table 1).
3.3.8 Nawada project hub
Results indicated that adopting HS significantly increased grain yields compared to FMP (Table 2). The average wheat grain yield was 4.04 t/ha, and straw yield was 5.84 t/ha. In contrast, under FMP, the grain yield was 3.46 t/ha, and straw yield was 4.99 t/ha. HS achieved the highest grain yield of 4.61 t/ha and straw yield of 6.68 t/ha (Table 2), highlighting substantial improvements in productivity. HS exhibited 33.5% higher grain yield and 34.7% higher straw yield compared to FMP.
Meanwhile, average profitability (Table 1) was recorded at $592, $1,266, and $674/ha for cost of cultivation, gross return, and net return, respectively, with a benefit-to-cost ratio of 1.16. However, HS exhibited maximum profitability, with values of $561, $1,464, and $903/ha for cost of cultivation, gross return, and net return, respectively, and a benefit-to-cost ratio of 1.61 (Table 1). HS showed a 33.7% increase in net return compared to the average. Conversely, FMP reported the lowest profitability, emphasizing the economic advantages of adopting HS in wheat cultivation practices (Table 1).
3.3.9 Cumulative of eight project hubs
Results showed that the method of crop establishment significantly varied (3.45-to-4.29 t/ha) wheat productivity (Figure 9). The highest 4.29 t/ha (+20%) wheat productivity was observed with HS method, followed by ZT method 4.11 t/ha (+16), RB 3.86 t/ha (+11%) and compared with FMP 3.45 t/ha (Figure 9).
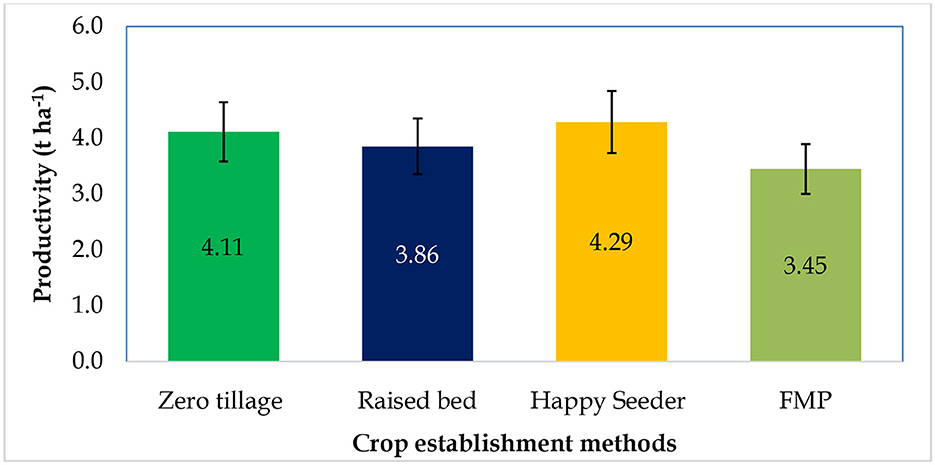
Figure 9. Effect of different crop establishment technologies on average wheat productivity: mean data from 980 farmers across 566 ha of field experiments in eight district Hubs (Banka, Bhagalpur, Gaya, Khagaria, Madhubani, Munger, Nalanda, and Nawada).
Mean profitability ranges $480-to-760/ha among the different planting techniques (Figure 10a). The highest $760/ha (+37%) wheat profitability was observed with the HS method, followed by ZT method $730/ha (+34), RB $649/ha (+26%) and lowest was reported with FMP $480/ha (Figure 10a).
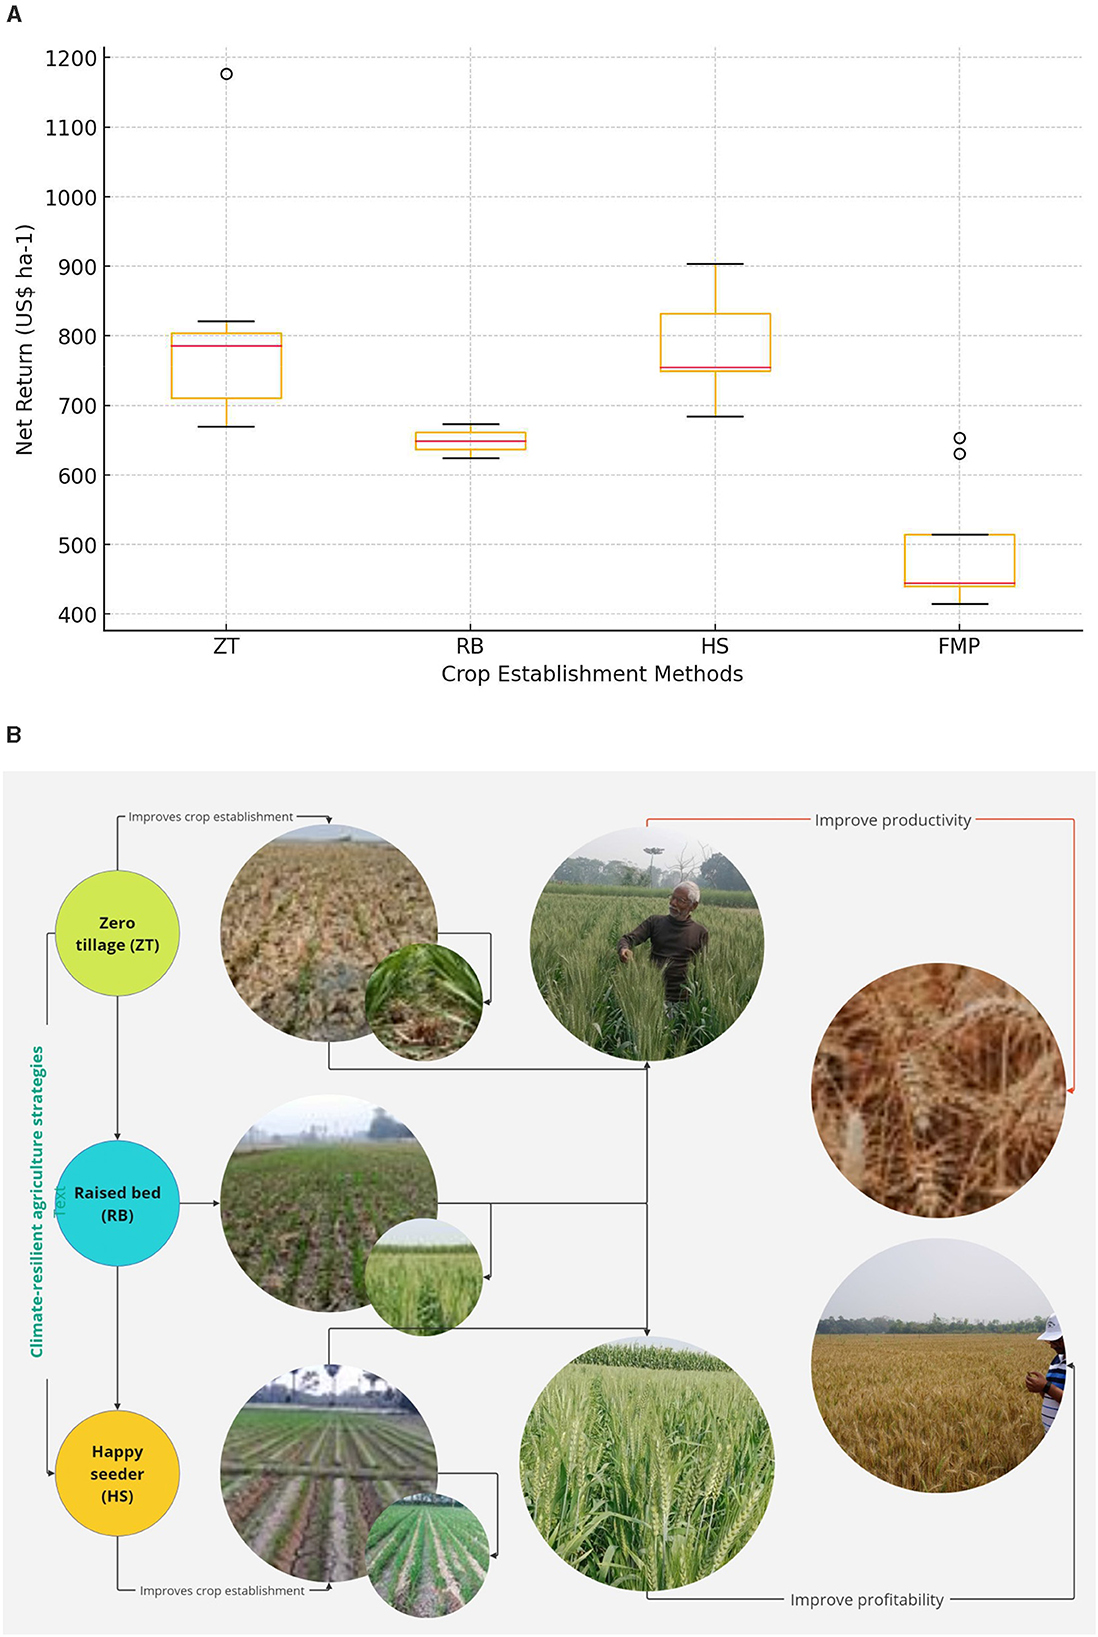
Figure 10. (a) Effect of different crop establishment technologies on wheat profitability: mean data from 980 farmers across 566 ha of field experiments in eight district hubs (Banka, Bhagalpur, Gaya, Khagaria, Madhubani, Munger, Nalanda, and Nawada). (b) Different stages of crop establishment technologies.
4 Discussion
4.1 Planting time
Wheat is one the most sensitive crop to the temperature among all the major cereals (Arshad et al., 2017), thus planting time of the wheat plays a crucial role in wheat productivity (Bhatt et al., 2021; Fu et al., 2025), where high temperature during planting influences the germination and early growth stages, whereas terminal heat, affects reproductive stage (Akter and Islam, 2017; McDonald et al., 2022). Selected areas in the current study belong to Eastern Indo-Gangetic planes (E-IGP) where the climatic conditions are humid and subtropical type. These sites i.e., Bhagalpur, Banka, Gaya, Khagaria, Madhubani, Nawada, Nalanda, and Munger, represent different agro-climatic conditions (Figure 3). Data showed that wheat plating started on 13 November to avoid the effect of high temperature on critical flowering and grain filling periods, and continued it till December 31, to study the adverse effect of high temp on net yield. During the 48-day planting window for field experiments-cum-demonstrations, over 566 hectares were covered across 980 farmers' fields (Supplementary Figures S1a, b). Earlier studies also suggest the wheat planting 15 days earlier than the usual date (Jalota et al., 2013; Islam et al., 2022; Ray et al., 2019). Interestingly, the selected sites show up to 4°C temperature difference during wheat crop season where minimum temperature ranges 8–12°C while the maximum ranges 31–35°C (Supplementary Table S1).
Based on temperature differences, early sowing of wheat started from 13th November in Nalanda, followed by Banka, whereas in Khagaria, sowing was delayed until 19th to 31st December (Figure 3). This wide sowing window facilitated the analysis of yield variation across different planting dates. The yield advantage in early sowing can be attributed to optimal temperature during the critical growth stages (tillering and grain filling), reduced biotic and abiotic stress pressure, and longer duration for crop maturity. In contrast, late sowing exposed the crop to terminal heat stress during grain filling, which is known to accelerate senescence and reduce grain weight (Sattar et al., 2023; Wen et al., 2023)
Rainfall distribution varied considerably across districts and years, with peak rainfall concentrated between June and September. This seasonal variability influenced soil moisture availability during the sowing window (Patel et al., 2024). Delayed sowing beyond late November consistently reduced wheat productivity across all districts. Together, these findings emphasize the need to align sowing dates with residual soil moisture conditions and avoid exposure to terminal heat, reinforcing the importance of timely planting as a climate-resilient strategy (Chhokar et al., 2023; Hussain et al., 2018).
4.2 Impact of planting time on productivity and profitability
Major objectives of the study were to evaluate the impact of planting time on wheat yield across various agro-climatic zones of Bihar. To achieve this, the planting window was extended to 48 days, spanning from November 13 to December 31 (Figure 4). Timely planting of wheat optimizes growing conditions, enhancing establishment, growth, and yield potential (Jalota et al., 2013; Islam et al., 2022; Lobell et al., 2008; Demyanyuk et al., 2023). Conversely, late planting, often due to delayed rice harvesting, exposes wheat crops to high temperature stress during grain filling, leading to terminal heat stress and significant yield reductions (20–30%). Rainfall variability across districts also played a critical role in influencing the sowing window. Inconsistent post-monsoon rainfall impacted soil moisture availability for early planting, especially in years with below-average rainfall, leading to delayed sowing in some locations. This further increased exposure to terminal heat stress, compounding the yield penalty from late planting (Gupta et al., 2019; Rehman et al., 2021; Nagar et al., 2015; Sharma and Majumder, 2017; Agarwal et al., 2021; Rohini et al., 2016). Similar outcomes were observed in the previous year's Rabi season 2019–2020 (Table 2). Analysis of the yield from all eight locations well explained the effectiveness of timely planting of wheat in these agro-climatic zones (Figures 4–11). Traditionally, farmers in Bihar start wheat planting in late November, continue till end of the December resulting, an average of 2.9 t/ha of wheat yield significantly below the average yield in India i.e., 3.4 t/ha, almost 15% less than the national average. The same was reflected in our results, where we observed the fall in wheat yield, ranging from 3.2 to 56.85%, starting from 15 November to 31 December (Figure 9). Combined data from all locations clearly indicates the reduction (~1.18%) yield on each day delay in the wheat planting (Figures 10a, b). An average of 6.2% yield reduction was observed on December 1st planting. Our findings suggest the planting of wheat during November 10 to 20 could be suitable in these regions to save from the yield penalty due to the terminal heat. Earlier studies, Jalota et al. (2013), also suggest, sifting the planting 15 days earlier can reduce 4% of yield loss, also Dubey et al. (2020) argues, 10 days earlier from recommended sowing date. In context to Bihar, (McDonald et al., 2022), predicted an increase production up to 69% with achievable adjustments to wheat sowing dates in Mid-November.
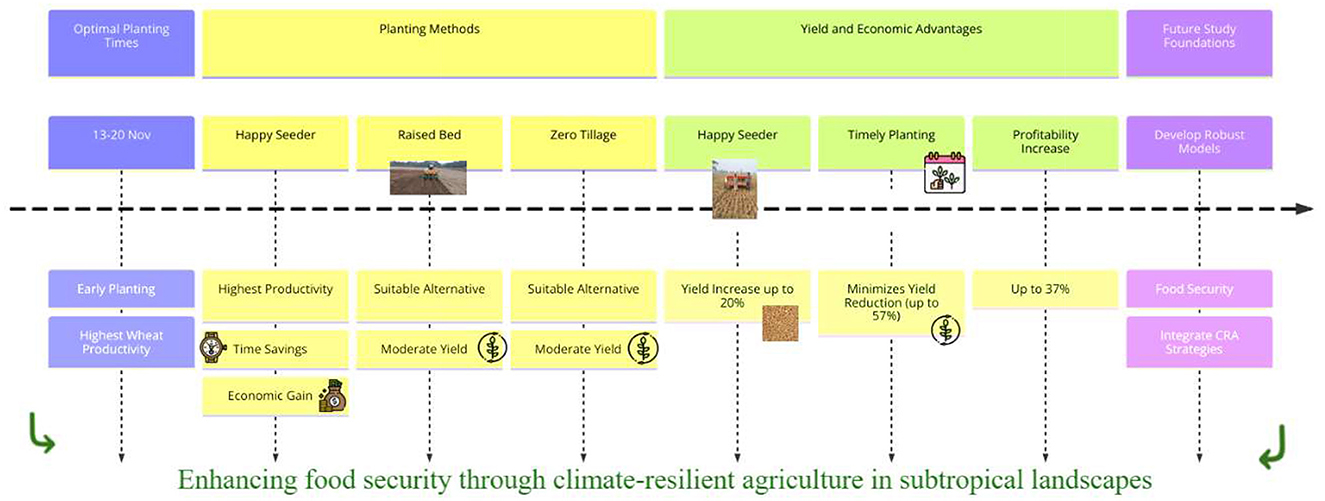
Figure 11. Flowchart illustrating strategies for enhancing food security through climate-resilient agriculture in subtropical landscapes. Sections include optimal planting times, planting methods, and yield advantages, with steps from early planting to profitability increase. Key elements involve the use of a Happy Seeder, raised bed, and zero tillage. Focus areas include economic gain, yield increase, and minimizing yield reduction. Future study foundations and robust model development are emphasized. Strategies for maximizing wheat productivity while minimizing climate impact.
The profitability is negatively correlated with cost of cultivation whereas positively with productivity and price of the crop. The cost of cultivation includes costs of seeds, human labor, service provider cost, irrigation, Agro-chemicals and other operational cost (Shirsath et al., 2017; Hasanain et al., 2024). However, FMP productivity plays a crucial role in net profitability as the price of the grain and cost of cultivation increases parallelly. The benefit-to-cost ratio for our study was 1.60 under the FMP; however, this could increase to 1.83 or higher with the adoption of timely or early planting practices (Table 1). Timely planting induced yield benefit may lead to the economic gain of $10/ha by every 1% increased yield. Recent studies emphasize integrated approaches: conservation agriculture (Jat et al., 2025a; Dubey et al., 2020), long-term fertilization (Panday et al., 2024), and precise nutrient-tillage-residue management (Hasanain et al., 2025) as key to boosting wheat productivity. These sustainable strategies enhance soil quality (Jat et al., 2025a), improve water-use efficiency (Panday et al., 2024), and buffer wheat systems against climate stress across diverse agro-ecologies (Meena et al., 2024).
4.3 Impact of crop establishment methods on productivity and profitability
The analysis of the data from all project sites confirms the significant impact of different wheat planting methods on the productivity and profitability (Keil et al., 2015; Ahmed et al., 2024). Specially, the HS gave significantly higher yield among all the technologies followed by ZT and RB (Figure 9). Similar observation was recorded in earlier studies by Jat et al. (2019), Thind et al. (2023), and Chaudhary et al. (2023). In context to Bihar, data also reflects +19% higher yield using HS technology, followed by ZT (+16%) and RBP (+10%), as compared to traditional FMP, which could increase the income of every household up to $140/h. However, HS and ZT system allows farmers to plant directly into untilled soil which help to reduce the cost of cultivation, save time and resources in field preparation (Jat et al., 2022; Kumar et al., 2024). A study in south-eastern Punjab, Keil et al. (2020), suggests the significant saving in wheat production cost (~$2/100 kg of wheat) using HS. Interestingly, our results also revealed that the FMP was significantly more expensive than the other technologies: ~15% more than ZT, and 17% and 25% more than HS and HS, respectively.
5 Conclusions
The study identifies optimal planting times and techniques for wheat in Bihar, India, emphasizing the role in enhancing food security and farm income. Demonstrations across 566 ha showed that early planting (13–20 Nov) maximizes wheat productivity. Adoption of climate-resilient agriculture strategies, particularly using suitable planting times and techniques like HS, RB, and ZT offers potential to mitigate climate risks and improve economic outcomes for farmers in diverse landscapes of Bihar (Figure 11). Conclusions are:
(a) Optimal planting times: Large-scale field data from 980 demonstrations across eight project sites indicated that early planting (13-to-20 Nov) resulted in the highest wheat productivity.
(b) Optimal planting methods: Most suitable planting method identified was HS for wheat, followed by RB and ZT.
(c) Time advantage: HS and ZT methods provide a time advantage by allowing wheat planting to be advanced by 10–15 days, thereby saving on land preparation time.
(d) Yield advantages: HS planting can maximize yields by up to 20%, while timely wheat planting can minimize yield reductions by up to 57%, particularly by avoiding terminal heat stress during crucial stages like heading and grain filling.
(e) Economic advantage: +37% increases in profitability can be achieved with timely planting and using the HS for wheat cultivation.
Future studies should focus on integrating climate-resilient agriculture strategies to meet global food demand amidst challenging climatic conditions in subtropical agroecological landscapes. Overall, adopting and integrating the different climate-resilient agriculture (CRA) strategies with advanced technological interventions to achieve global food demand and mitigate the adverse climatic conditions.
Data availability statement
The original contributions presented in the study are included in the article/Supplementary material, further inquiries can be directed to the corresponding authors.
Ethics statement
Written informed consent was obtained from the individual(s) for the publication of any potentially identifiable images or data included in this article.
Author contributions
VM: Conceptualization, Methodology, Visualization, Writing – original draft, Writing – review & editing. RajK: Conceptualization, Supervision, Writing – review & editing. SD: Conceptualization, Formal analysis, Methodology, Writing – review & editing. SuK: Conceptualization, Investigation, Writing – review & editing. RSo: Investigation, Methodology, Supervision, Writing – review & editing. RJ: Conceptualization, Methodology, Project administration, Writing – review & editing. AbK: Funding acquisition, Investigation, Project administration, Writing – review & editing. UK: Conceptualization, Investigation, Project administration, Writing – review & editing. AnjK: Conceptualization, Supervision, Writing – review & editing. RNS: Formal analysis, Investigation, Writing – review & editing. IR: Funding acquisition, Investigation, Project administration, Writing – review & editing. SP: Formal analysis, Investigation, Methodology, Resources, Writing – review & editing. RakK: Software, Supervision, Validation, Writing – review & editing. SKM: Formal analysis, Methodology, Resources, Software, Visualization, Writing – review & editing. VP: Formal analysis, Software, Validation, Writing – review & editing. SanjaK: Formal analysis, Investigation, Methodology, Writing – review & editing. BK: Formal analysis, Investigation, Resources, Writing – review & editing. TK: Investigation, Software, Validation, Writing – review & editing. SM: Formal analysis, Investigation, Methodology, Writing – review & editing. MP: Conceptualization, Investigation, Writing – review & editing. RSa: Conceptualization, Investigation, Writing – review & editing. RajK: Data curation, Methodology, Writing – review & editing. AMu: Methodology, Writing – review & editing, Data curation, Software. PKumar: Formal analysis, Investigation, Writing – review & editing, Methodology. ManoK: Investigation, Project administration, Writing – review & editing, Formal analysis. DM: Investigation, Writing – review & editing, Methodology, Project administration. AsK: Writing – review & editing, Conceptualization, Investigation. RajS: Writing – review & editing, Methodology, Software, Supervision. BM: Data curation, Formal analysis, Writing – review & editing, Investigation. NS: Data curation, Formal analysis, Writing – review & editing, Resources. AKumari: Formal analysis, Writing – review & editing, Data curation, Supervision. JK: Formal analysis, Resources, Writing – review & editing, Software. SG: Formal analysis, Resources, Writing – review & editing, Conceptualization. JS: Writing – review & editing, Formal analysis, Resources. SC: Investigation, Writing – review & editing, Methodology, Validation. RR: Writing – review & editing, Formal analysis, Investigation. MuK: Methodology, Writing – review & editing, Project administration. VinK: Methodology, Project administration, Writing – review & editing. KS: Formal analysis, Methodology, Project administration, Writing – review & editing. UU: Investigation, Methodology, Software, Writing – review & editing. KB: Methodology, Software, Writing – review & editing. RanS: Conceptualization, Formal analysis, Methodology, Project administration, Writing – review & editing. RC: Investigation, Writing – review & editing. VikK: Investigation, Methodology, Writing – review & editing. AY: Data curation, Methodology, Writing – review & editing. AnmK: Data curation, Writing – review & editing. ManiK: Data curation, Methodology, Writing – review & editing. AC: Data curation, Writing – review & editing. RSe: Data curation, Writing – review & editing. SanjeK: Data curation, Writing – review & editing. DK: Data curation, Writing – review & editing. PS: Data curation, Writing – review & editing. SSar: Data curation, Writing – review & editing. ShK: Data curation, Project administration, Writing – review & editing. VaK: Data curation, Writing – review & editing. KK: Data curation, Writing – review & editing. PKumari: Data curation, Formal analysis, Writing – review & editing. AvK: Data curation, Writing – review & editing. SR: Data curation, Formal analysis, Writing – review & editing. TP: Data curation, Writing – review & editing. BJ: Data curation, Writing – review & editing. AJ: Conceptualization, Funding acquisition, Methodology, Project administration, Software, Supervision, Validation, Writing – review & editing. DT: Funding acquisition, Methodology, Supervision, Writing – review & editing. SSag: Data curation, Funding acquisition, Methodology, Project administration, Resources, Supervision, Writing – review & editing.
Funding
The author(s) declare that no financial support was received for the research and/or publication of this article.
Acknowledgments
We acknowledge financial and technical support from Government of Bihar for initiating for funds and technical support. Indian Council of Agricultural Research (ICAR), CGIAR and all donors who supported this research through their contributions are highly acknowledged. We also acknowledge the farmers for providing their time, resources, sharing their experiences and expertise. All the field technicians are highly acknowledged.
Conflict of interest
The authors declare that the research was conducted in the absence of any commercial or financial relationships that could be construed as a potential conflict of interest.
The author(s) declared that they were an editorial board member of Frontiers, at the time of submission. This had no impact on the peer review process and the final decision.
Generative AI statement
The author(s) declare that no Gen AI was used in the creation of this manuscript.
Publisher's note
All claims expressed in this article are solely those of the authors and do not necessarily represent those of their affiliated organizations, or those of the publisher, the editors and the reviewers. Any product that may be evaluated in this article, or claim that may be made by its manufacturer, is not guaranteed or endorsed by the publisher.
Supplementary material
The Supplementary Material for this article can be found online at: https://www.frontiersin.org/articles/10.3389/fsufs.2025.1564812/full#supplementary-material
References
Agarwal, V. P., Gupta, N. K., Gupta, S., and Singh, G. (2021). Screening of wheat germplasm for terminal heat tolerance under hyper-arid conditions. Cereal Res. Commun. 49, 375–383. doi: 10.1007/s42976-020-00116-y
Ahmed, M., Singla, N., and Singh, K. (2024). Market integration and price transmission in wheat markets of India: a transaction cost approach. J. Agribus. Dev. Emerg. Econ. 14:552. doi: 10.1108/JADEE-06-2022-0123
Akter, N., and Islam, M. R. (2017). Heat stress effects and management in wheat: a review. Agron. Sustain. Dev. 37, 1–19. doi: 10.1007/s13593-017-0443-9
Arshad, M., Amjath-Babu, T., Krupnik, T. J., Aravindakshan, S., Abbas, A., Kächele, H., et al. (2017). Climate variability and yield risk in South Asia's rice–wheat systems: emerging evidence from Pakistan. Paddy Water Environ. 15, 249–261. doi: 10.1007/s10333-016-0544-0
Asseng, S., Ewert, F., Martre, P., Rotter, R. P., Lobell, D., Cammarano, D., et al. (2015). Rising temperatures reduce global wheat production. Nat. Clim. Change 5, 143–147. doi: 10.1038/nclimate2470
Ben Hassen, T., and El Bilali, H. (2022). Impacts of the Russia-Ukraine War on Global Food Security: towards more sustainable and resilient food systems. Foods 11:2301. doi: 10.3390/foods11152301
Bhatt, R., Singh, P., Hossain, A., and Timsina, J. (2021). Rice–wheat system in the northwest Indo-Gangetic Plains of South Asia: issues and technological interventions for increasing productivity and sustainability. Paddy Water Environ. 19, 345–365. doi: 10.1007/s10333-021-00846-7
Chaudhary, P., Xu, M., Ahamad, L., Chaudhary, A., Kumar, G., et al. (2023). Application of Synthetic Consortia for Improvement of Soil Fertility, Pollution Remediation, and Agricultural Productivity: A Review. Agronomy 13, 643. doi: 10.3390/agronomy13030643
Chhokar, R. S., Sharma, R. K., Kumar, N., Singh, R. K., and Singh, G. P. (2023). Advancing sowing time and conservation tillage—the climate-resilient approach to enhance the productivity and profitability of wheat. Int. J. Plant Prod. 17, 121–131. doi: 10.1007/s42106-022-00216-1
Demyanyuk, O., Oliinyk, K., Davydiuk, H., Yula, V., Shatkovska, K., Mostoviak, I., et al. (2023). Productivity of winter wheat under cultivation technologies of different intensity. Zemdirbyste Agric. 110:9. doi: 10.13080/z-a.2023.110.013
Dhankher, O. P., and Foyer, C. H. (2018). Climate resilient crops for improving global food security and safety. Plant Cell Environ. 41, 877–884. doi: 10.1111/pce.13207
Dubey, R., Pathak, H., Chakrabarti, B., Singh, S., Kumar, D., Gupta, R. C., et al. (2020). Impact of terminal heat stress on wheat yield in India and options for adaptation. Agric. Syst. 181:102826. doi: 10.1016/j.agsy.2020.102826
Elahi, E., Weijun, C., Zhang, H., and Nazeer, M. (2019). Agricultural intensification and damages to human health in relation to agrochemicals: application of artificial intelligence. Land Use Policy 83, 461–474. doi: 10.1016/j.landusepol.2019.02.023
Food and Agriculture Organization of the United Nations (FAO) (2021). State of Food Security and Nutrition in the World 2021. FAO. Available online at: https://www.fao.org/state-of-food-security-nutrition/en/
Fu, Y., Dai, J., Yang, H., Gao, B., Ma, Y., Qiao, Y., et al. (2025). Newer wheat cultivars achieved greater yield and water productivity through root and canopy synergies in the North China Plain. Field Crops Res. 328:109880. doi: 10.1016/j.fcr.2025.109880
Giraldo, P., Benavente, E., Manzano-Agugliaro, F., and Gimenez, E. (2019). Worldwide research trends on wheat and barley: A bibliometric comparative analysis. Agronomy 9:352. doi: 10.3390/agronomy9070352
Gupta, P. K., Balyan, H. S., Gahlaut, V., Saripalli, G., Pal, B., Basnet, B. R., et al. (2019). Hybrid wheat: past, present and future. Theor. Appl. Genet. 132, 2463–2483. doi: 10.1007/s00122-019-03397-y
Gupta, R., Somanathan, E., and Dey, S. (2017). Global warming and local air pollution have reduced wheat yields in India. Clim. Change 140, 593–604. doi: 10.1007/s10584-016-1878-8
Hasanain, M., Singh, V. K., Rathore, S. S., Meena, V. S., Meena, S. K., Shekhawat, K., et al. (2024). Crop establishment and nutrient management options: optimizing productivity, maximizing profitability and mitigating adverse climatic conditions in the maize-based production system of Northwest India. Field Crops Res. 318:109606. doi: 10.1016/j.fcr.2024.109606
Hasanain, M., Singh, V. K., Rathore, S. S., Meena, V. S., Meena, S. K., Shekhawat, K., et al. (2025). Sustainable strategies in maize-wheat systems: integrating tillage, residue, and nutrient management for food-energy-carbon footprint optimization. Renew. Sustain. Energy Rev. 211:115316. doi: 10.1016/j.rser.2024.115316
Hussain, J., Khaliq, T., Ahmad, A., Akhter, J., and Asseng, S. (2018). Wheat responses to climate change and its adaptations: a focus on arid and semi-arid environments. Int. J. Environ. Res.12, 117–126. doi: 10.1007/s41742-018-0074-2
INCCA (2010). India: Greenhouse Gas Emissions 2007. Indian Network for Climate Change Assessment; Ministry of Environment and Forests, Government of India. Available online at: https://www.iitr.ac.in/wfw/web_ua_water_for_welfare/water/WRDM/MOEF_India_GHG_Emis_2010.pdf
Islam, A. F. M. T., Islam, A. K. M. S., Islam, G. M. T., Bala, S. K., Salehin, M., Choudhury, A. K., et al. (2022). Adaptation strategies to increase water productivity of wheat under changing climate. Agric. Water Manag. 264:107499. doi: 10.1016/j.agwat.2022.107499
Ito, R., Vasconcelos, H. L., and Feeley, K. J. (2018). Global climate change increases risk of crop yield losses and food insecurity in the tropical Andes. Glob. Change Biol. 24, e592–e602. doi: 10.1111/gcb.13959
Jalota, S., Kaur, H., Kaur, S., and Vashisht, B. (2013). Impact of climate change scenarios on yield, water and nitrogen-balance and-use efficiency of rice–wheat cropping system. Agric. Water Manag. 116, 29–38. doi: 10.1016/j.agwat.2012.10.010
Jardón, M., Alvarez-Prado, S., Vanzetti, L., Gonzalez, F. G., Pérez-Gianmarco, T., Gómez, D., et al. (2023). Physiological and environmental dissection of developmental drivers for predicting heading date in wheat based on Vrn1, Ppd1 and Eps-D1 allelic characterization. Field Crops Res. 292:108810. doi: 10.1016/j.fcr.2023.108810
Jat, H. S., Khokhar, S., Prajapat, K., Choudhary, M., Kakraliya, M., Gora, M. K., et al. (2025a). A decade of conservation agriculture in intensive cereal systems: transitioning to soil resilience and stable yield trends in a climate crisis. J. Environ. Manage. 373:123448. doi: 10.1016/j.jenvman.2024.123448
Jat, M. L., Chakraborty, D., Ladha, J. K., Parihar, C. M., Datta, A., Mandal, B., et al. (2022). Carbon sequestration potential, challenges, and strategies towards climate action in smallholder agricultural systems of South Asia. Crop Environ. 1, 86–101. doi: 10.1016/j.crope.2022.03.005
Jat, M. L., Chakraborty, D., Ladha, J. K., Rana, D. S., Gathala, M. K., McDonald, A., et al. (2020). Conservation agriculture for sustainable intensification in South Asia. Nat. Sustain. 3, 336–343. doi: 10.1038/s41893-020-0500-2
Jat, R. K., Meena, V. S., Durgude, S., Sohane, R. K., Jha, R. K., Kumar, A., et al. (2025b). Bridging the gap: challenges and adoption of climate-resilient agriculture technologies in agricultural landscapes across agro-climatic zones of Bihar, India. Front. Sustain. Food Syst. 8:1504388. doi: 10.3389/fsufs.2024.1504388
Jat, R. K., Singh, R. G., Kumar, M., Jat, M. L., Parihar, C. M., Bijarniya, D., et al. (2019). Ten years of conservation agriculture in a rice-maize rotation of Eastern Gangetic Plains of India: Yield trends, water productivity and economic profitability. Field Crops Res. 232, 1–10. doi: 10.1016/j.fcr.2018.12.004
Jiang, T., Wang, B., Duan, X., Liu, D. L., He, J., He, L., et al. (2023). Prioritizing agronomic practices and uncertainty assessment under climate change for winter wheat in the Loess Plateau, China. Agric. Syst. 212:103770. doi: 10.1016/j.agsy.2023.103770
Keil, A., D'Souza, A., and Donald, A. (2015). Zero-tillage as a pathway for sustainable wheat intensification in the Eastern Indo-Gangetic Plains: does it work in farmers' fields? Food Sec. 7, 983–1001. doi: 10.1007/s12571-015-0492-3
Keil, A., Mitra, A., McDonald, A., and Malik, R. K. (2020). Zero-tillage wheat provides stable yield and economic benefits under diverse growing season climates in the Eastern Indo-Gangetic Plains. Int. J. Agric. Sustain. 18, 567–593. doi: 10.1080/14735903.2020.1794490
Khan, A., Ahmad, M., Ahmed, M., and Hussain, M. I. (2021). Rising atmospheric temperature impact on wheat and thermotolerance strategies. Plants 10:43. doi: 10.3390/plants10010043
Kumar, D., Meena, V. S., and Singh, A. K. (2024). Super seeder advancing climate-resilient agricultural technology. Indian Farm. 74, 11–15.
Lobell, D. B., Burke, M. B., Tebaldi, C., Mastrandrea, M. D., Falcon, W. P., Naylor, R. L., et al. (2008). Prioritizing climate change adaptation needs for food security in 2030. Science 319, 607–610. doi: 10.1126/science.1152339
Lobell, D. B., Schlenker, W., and Costa-Roberts, J. (2011). Climate trends and global crop production since 1980. Science 333, 616–620. doi: 10.1126/science.1204531
McDonald, A. J., Balwinder-Singh, K., Srivastava, A., Craufurd, P., Kishore, A., Kumar, V., et al. (2022). Time management governs climate resilience and productivity in the coupled rice-wheat cropping systems of eastern India. Nat. Food 3, 542–551. doi: 10.1038/s43016-022-00549-0
Meena, S. K., Dwivedi, B. S., Meena, M. C., Datta, S. P., Singh, V. K., Mishra, R. P., et al. (2024). Insights from a 19-year field study: optimizing long-term nutrient supply strategies for enhanced crop productivity and nutritional security in rice–wheat systems. Discov. Appl. Sci. 6:512. doi: 10.1007/s42452-024-06195-4
Nagar, S., Singh, V. P., Arora, A., Dhakar, R., and Ramakrishnan, S. (2015). Assessment of terminal heat tolerance ability of wheat genotypes based on physiological traits using multivariate analysis. Acta Physiol. Plant. 37:257. doi: 10.1007/s11738-015-2017-2
Nelson, G. C., Rosegrant, M. W., Palazzo, A., Gray, I., Ingersoll, C., Robertson, R., et al. (2010). Food Security, Farming, and Climate Change to 2050: Scenarios, Results, Policy Options. Washington, DC: IFPRI.
Ortiz, R., Sayre, K. D., Govaerts, B., Gupta, R., Subbarao, G., Ban, T., et al. (2008). Climate change: can wheat beat the heat? Agric. Ecosyst. Environ. 126, 46–58. doi: 10.1016/j.agee.2008.01.019
Panday, S. C., Parihar, M., Meena, R. P., Choudhary, M., Meena, V. S., Mondal, T., et al. (2024). Long-term fertilization strategies for improving productivity, profitability and water-use efficiency of soybean–wheat cropping systems. J. Agric. Sci. 162, 444–457. doi: 10.1017/S0021859624000558
Pask, A., Joshi, A., Manes, Y., Sharma, I., Chatrath, R., Singh, G., et al. (2014). A wheat phenotyping network to incorporate physiological traits for climate change in South Asia. Field Crops Res. 168, 156–167. doi: 10.1016/j.fcr.2014.07.004
Patel, A., Kumar, S., Siddiqui, M. Z., Saxena, P., and Das, A. K. (2024). Effect of sowing dates and varieties on growth and yield of wheat (Triticum aestivum L.) in central plain zone of UP, India. J. Sci. Res. Rep. 30, 815–820. doi: 10.9734/jsrr/2024/v30i102505
Rahbari, M., Arshadi Khamseh, A., and Sadati-Keneti, Y. (2023). Resilience strategies in coping to disruptions of wheat supply chain caused by the Russia–Ukraine war crisis: case study from an emerging economy. Kybernetes 53, 2984–3018. doi: 10.1108/K-12-2022-1728
Rao, C. R., Raju, B. M. K., and Rao, A. S. (2016). A district level assessment of vulnerability of Indian agriculture to climate change. Curr. Sci. 110, 1939–1946. doi: 10.18520/cs/v110/i10/1939-1946
Ray, L. K., Goel, N. K., and Arora, M. (2019). Trend analysis and change point detection of temperature over parts of India. Theor. Appl. Climatol. 138, 153–167. doi: 10.1007/s00704-019-02819-7
Rehman, H. U., Tariq, A., Ashraf, I., Ahmed, M., Muscolo, A., Basra, S. M. A., et al. (2021). Evaluation of physiological and morphological traits for improving spring wheat adaptation to terminal heat stress. Plants 10:455. doi: 10.3390/plants10030455
Rogelj, J., Elzen, D., Höhne, N., Fransen, T., Fekete, H., Winkler, H., et al. (2016). Paris Agreement climate proposals need a boost to keep warming well below 2°C. Nature 534:631. doi: 10.1038/nature18307
Rohini, P., Rajeevan, M., and Srivastava, A. K. (2016). On the variability and increasing trends of heat waves over India. Sci. Rep. 6:26153. doi: 10.1038/srep26153
Sattar, A., Nanda, G., Singh, G., Jha, R. K., and Bal, S. K. (2023). Responses of phenology, yield attributes, and yield of wheat varieties under different sowing times in Indo-Gangetic Plains. Front. Plant Sci. 14:1224334. doi: 10.3389/fpls.2023.1224334
Shahid, M., Shafi, Z., Ilyas, T., Singh, U. B., and Pichtel, J. (2024). Crosstalk between phytohormones and pesticides: insights into unravelling the crucial roles of plant growth regulators in improving crop resilience to pesticide stress. Sci. Hortic. 338:113663. doi: 10.1016/j.scienta.2024.113663
Sharma, S., and Majumder, P. (2017). Increasing frequency and spatial extent of concurrent meteorological droughts and heatwaves in India. Sci. Rep. 7:15896. doi: 10.1038/s41598-017-15896-3
Shirsath, P. B., Aggarwal, P. K., Thornton, P. K., and Dunnett, A. K. (2017). Prioritizing climate-smart agricultural land use options at a regional scale. Agric. Syst. 151, 174–183. doi: 10.1016/j.agsy.2016.09.018
Singh, M., Sah, S., and Singh, R. (2023). The 2023-24 El Ni?o event and its possible global consequences on food security with emphasis on India. Food Sec. 15, 1431–1436. doi: 10.1007/s12571-023-01419-8
Snedecor, G. W., and Cochran, W. G. (1989). Statistical Methods, 8th Edn. Ames: Iowa State Univ., 54, 71–82.
Tao, F., Zhang, L., Zhang, Z., and Chen, Y. (2022). Climate warming outweighed agricultural managements in affecting wheat phenology across China during 1981-2018. Agric. For. Meteorol. 316:108865. doi: 10.1016/j.agrformet.2022.108865
Thind, H. S., Sharma, S., Sidhu, H. S., Singh, V., and Yadvinder-Singh. (2023). Tillage, crop establishment and residue retention methods for optimising productivity and profitability under rice-wheat system. Crop Pasture Sci. 74, 828842. doi: 10.1071/CP21595
Wang, S., Niu, Y., Shang, L., Li, Z., Lin, X., Wang, D., et al. (2023). Supplemental irrigation at the jointing stage of late sown winter wheat for increased production and water use efficiency. Field Crops Res. 302:109069. doi: 10.1016/j.fcr.2023.109069
Wen, P., Wei, Q., Zheng, L., Rui, Z., Niu, M., Gao, C., et al. (2023). Adaptability of wheat to future climate change: effects of sowing date and sowing rate on wheat yield in three wheat production regions in the North China Plain. Sci. Total Environ. 901:165906. doi: 10.1016/j.scitotenv.2023.165906
Keywords: cropping systems, planting time, climate resilient strategies, profitability, productivity
Citation: Meena VS, Jat RK, Durgude S, Kumar S, Sohane RK, Jha RK, Kumar A, Kumar U, Kumar A, Singh RN, Reddy IR, Pazhanismy S, Kumar R, Meena SK, Prakash V, Kumar S, Mukherjee A, Kumar B, Kumar T, Mandal S, Prasad M, Sahu R, Kumar R, Kumar P, Kumar M, Mandal D, Kumar A, Singh R, Mandal BK, Singh NK, Kumari A, Kumar J, Gangwar SK, Soren J, Chhetri KB, Chaudhary S, Rajput RS, Kumar M, Kumar V, Sharda K, Umesh UN, Singh RK, Chaubey R, Kumar V, Yadav A, Kumar A, Kumar M, Chaurasiya A, Senapati R, Kumar S, Kumar D, Singh PK, Sarkar S, Kumari S, Kumari V, Kumari K, Kumari P, Kumar A, Rai SK, Pratap T, Jha BK, Jha AK, Tripathi DP and Sagar S (2025) Climate-resilient strategies for wheat farming: minimizing climate impact, optimizing productivity, and maximizing profitability in the subtropical agroecological landscape of India. Front. Sustain. Food Syst. 9:1564812. doi: 10.3389/fsufs.2025.1564812
Received: 22 January 2025; Accepted: 13 June 2025;
Published: 16 July 2025.
Edited by:
Shobha Poudel, Fondazione Eni Enrico Mattei, ItalyReviewed by:
M. B. Shanabhoga, National Institute of Veterinary Epidemiology and Disease Informatics (ICAR), IndiaMeenakshi Gupta, Sher-e-Kashmir University of Agricultural Sciences & Technology of Jammu, India
Copyright © 2025 Meena, Jat, Durgude, Kumar, Sohane, Jha, Kumar, Kumar, Kumar, Singh, Reddy, Pazhanismy, Kumar, Meena, Prakash, Kumar, Mukherjee, Kumar, Kumar, Mandal, Prasad, Sahu, Kumar, Kumar, Kumar, Mandal, Kumar, Singh, Mandal, Singh, Kumari, Kumar, Gangwar, Soren, Chhetri, Chaudhary, Rajput, Kumar, Kumar, Sharda, Umesh, Singh, Chaubey, Kumar, Yadav, Kumar, Kumar, Chaurasiya, Senapati, Kumar, Kumar, Singh, Sarkar, Kumari, Kumari, Kumari, Kumari, Kumar, Rai, Pratap, Jha, Jha, Tripathi and Sagar. This is an open-access article distributed under the terms of the Creative Commons Attribution License (CC BY). The use, distribution or reproduction in other forums is permitted, provided the original author(s) and the copyright owner(s) are credited and that the original publication in this journal is cited, in accordance with accepted academic practice. No use, distribution or reproduction is permitted which does not comply with these terms.
*Correspondence: Vijay Singh Meena, dmlqYXlzc2FjLmJodUBnbWFpbC5jb20=; Raj Kumar Jat, ci5qYXRAY2dpYXIub3Jn; Sunita Kumari Meena, c3VuaXRhLm1lZW5hQHJwY2F1LmFjLmlu; Tarun Kumar, ZHIudGFydW5AcnBjYXUuYWMuaW4=
 Vijay Singh Meena
 Raj Kumar Jat
 Shubham Durgude
 Suneel Kumar1
 R. K. Jha
 Illathur R. Reddy
 S. Pazhanismy
 Rakesh Kumar
 Sunita Kumari Meena
 Ved Prakash
 Anirban Mukherjee
 Krishna Bahadur Chhetri
 Sourav Chaudhary
 Ranjan Kumar Singh
 Vikash Kumar
 Asheesh Chaurasiya
 Sanjeev Kumar
 Devesh Kumar
 Prabhat Kumar Singh
 Sudip Sarkar