Abstract
The agricultural development, resource availability and nutritional outcomes are inherently interconnected, particularly in ecologically vulnerable regions. In such context, fluctuations in resource endowments, especially water, directly impact agricultural productivity, which in turn shapes household income and food consumption patterns. Despite growing policy focus on improving agricultural output and food security, a fragmented understanding of how these domains interact has limited the effectiveness of interventions. This study, therefore, undertaken to bridge this knowledge gap by providing an integrated analysis of how natural resources and agricultural practices collectively influence nutritional outcomes in the Central Indian Landscape (CIL) in South Asia. A primary survey of 1,403 households was carried out from 20 villages across seven districts of the CIL and applied ordered probit model to identify important drivers which influences nutritional outcomes. On average, about 40% of total agricultural area was kept fallow either during monsoon or post-monsoon period largely due to poor water availability in dug wells, which is the major source of irrigation. For most crops, yield was ranged from 0.5 to 1.5 t ha−1. Livestock is an integral part of the farming system as 60% of the households own cattle, buffalo and goats. Income sources are diverse, with agriculture and livestock contributing significantly to large farmers’ income, while marginal and small farmers rely more on labor and remittances. The average annual household income for marginal farmers and large farmers is US$ 1,240 and US$ 4,930, respectively. A model analyzing factors influencing nutritional indicators such as energy, protein, and iron intake reveals that larger landholdings, higher income, education, and participation in welfare programs like Mahatma Gandhi National Rural Employment Guarantee Act (MGNREGA) improve nutritional outcomes. Family size negatively impacts dietary intake, while irrigated land positively affects energy, protein, and iron intake. These findings suggests that the critical need for integrated water resource management along with improving irrigation infrastructures, climate-resilient agriculture practices and promoting education and expanding access to social welfare programs are key to enhancing income, food and nutritional security of resource-poor households in vulnerable ecologies.
Highlights
About 40–60% of total agricultural land in the Bundelkhand region is kept fallow due to water scarcity.
Sustained agricultural production strongly influenced by soil types, water availability, and seasonal rainfall.
Agriculture and livestock sectors contribute 50–80% of total household annual income in drylands.
Irrigation infrastructure, education and access to social welfare programs are key to enhancing nutritional outcomes.
Introduction
Agriculture and allied sectors continue to be the major sources of income and livelihood for a large portion of the population in developing worlds like Asia and Africa. This sector currently feeds 7.8 billion people which is expected to increase to 9.7 billion by 2050 (Fukase and Martin, 2020; United Nations, 2019) and contributes about 6.4% of total world’s economic production and accounts for 32% of global employment (Priyadarshini and Abhilash, 2020; MoyenUddin, 2020; Loizou et al., 2019; Garibaldi and Pérez-Méndez, 2019; FAO, 2013). More than 60% of the population in developing countries from Asia and Africa is engaged in agriculture and allied sectors for securing their livelihoods (Bhuyan et al., 2020; Thapliyal et al., 2019; FAO, 2015; FAO, 2013). The current productivity level in these countries is much lower than the productivity levels of developed countries (Cenacchi et al., 2013; Fuglie, 2018). The resource endowment capacity and adoption of diverse livelihood strategies influence the agricultural production or productivity and thereby the nutritional status of the households (Rask and Rask, 2011; Qi et al., 2025; Hanes et al., 2018). Narayanan (2015) observed that socio-economic and gender-related issues are key barriers to food access and nutritional status among rural households. The scholars at recent period have stressed on promotion of agricultural sustainability through the sustainable use of resources is a way forward to addressing this issue of rural families in developing countries (Bouma, 2021; Li et al., 2021; Zhang et al., 2018; Claudia et al., 2013). Further, climate change, depletion of natural resource endowment, poor socio-economic factors, and the inadequate implementation of government welfare and agro-ecological policies and programs are major challenges to agricultural productivity and nutritional status among the rural families (Ward et al., 2020). The extent of land degradation is considered as one of the factors for poor resource endowments as variety of socio-economic and environmental benefits have a strong relationship with the health of the landscape (Zanzanaini et al., 2017). The changing climate aberrations are also further increasing the uncertainty in the performance of production system (Tripathi and Mishra, 2017; Tripathi et al., 2016). Simultaneously, changing food habits and economic growth is demanding additional resources to produce the same quantity of food (Vallino et al., 2020; Kopittke et al., 2019; Aleksandrowicz et al., 2019; Headey et al., 2018; Fukase and Martin, 2016) which adds extra pressure on the available resources. As a result, a large section of the population lives below the poverty threshold and agonizes with malnutrition.
In view of the above concerns, sustainable intensification is seen as an important policy priority, particularly for developing countries. Several studies have shown that the current agricultural productivity of the rainfed ecosystem is two to four times lower than the achievable potential (Wable et al., 2021; Sharma et al., 2010; Mandal et al., 2020; Srivastava et al., 2016) which can be achieved by integrating landscape and field-scale climate resilient interventions (Anantha et al., 2022). By following this approach, a number of public welfare programs have been targeted to improve resource endowment, crop productivity and employment opportunities to address agricultural development, rural poverty and malnutrition (Djanibekov and Gaur, 2018). However, limitations in technology adoption due to poor awareness, lack of capacity and poor asset endowments hinder the ability of the smallholder farmers to realize the gains from the agriculture sector (Harris and Orr, 2014; Schneider and Gugerty, 2011). In most of these public welfare programs, technology demonstrations and adoption are in a scattered manner which restricts the visibility of the impact created (Anantha et al., 2021b). Further, the assessment methods of newly adopted technologies generally compare the impact on per hectare basis which may not reflect the real impact on household income due to fragmented landholdings (Singh et al., 2021a, 2021b).
There are growing efforts to understand the impact of an integrated approach on the production system and its effects on rural livelihoods. However, it requires a holistic understanding on the current resource status and its linkages with production system, income and nutrition levels (Nichols, 2020; Pingali et al., 2017). Past studies have followed a compartmental approach and considered either a single component or dealt with a limited database to assess resources availability (Singh, 2020). Recent meta-analysis undertaken by Ricciardi et al. (2020) mapped 888 on-farm interventions used to combat water scarcity from 560 studies across the globe indicates research bias toward yields rather than livelihoods. The study further reveals the gaps in evidence for many commonly proposed solutions, including livestock management and solutions to protect natural resources at the farm-level. There is limited evidence linking resource endowments, agricultural production and nutritional outcomes from a systems perspective for achieving sustainability.
In this context, the current study seeks to examine how do local resource endowments such as landholding status, access to irrigation, education attainment and participation in public welfare programs interact with other socio-economic variables to influence agricultural productivity and nutritional outcomes of the rural communities in the study regions. Therefore, we hypothesize that households with more favourable resource endowments, characterized by larger landholdings, reliable access to irrigation, higher levels of education, and active participation in public welfare programs, are more likely to achieve higher agricultural productivity, which in turn leads to better nutritional outcomes. This relationship is mediated by the ability of these households to adopt risk-minimizing strategies, diversify income sources, and invest in improved food consumption. Recognizing these local dynamics is imperative to understand the broader socio-economic and environmental issues that align with the sustainable development goals such as reducing inequalities, promoting sustainable communities, ensuring responsible consumption and production and taking urgent action on climate change.
Theoretical framework: sustainable livelihoods approach (SLA)
The Sustainable Livelihoods Approach (SLA) offers a comprehensive and integrative framework for examining the complex interrelationships between asset-based endowments, livelihood strategies, and outcomes such as nutritional well-being and agricultural resilience. Rooted in the traditions of development studies and poverty alleviation, SLA has evolved as a tool for analyzing the multifaceted dimensions of rural livelihoods, particularly in developing contexts. It considers how individuals and households mobilize and transform a diverse portfolio of assets—natural, human, social, physical, and financial capital—within specific institutional, socio-political, and environmental contexts to sustain and improve their living conditions. Despite its robust utility in development research, the application of SLA to the analysis of agricultural adaptation and nutrition remains relatively underdeveloped. This study seeks to fill that gap by employing SLA as an analytical lens to explore the relationship between resource expenditures and nutritional outcomes among rural farming households in the study regions of Uttar Pradesh, India. In doing so, it positions SLA not merely as a static model of asset distribution but as a dynamic and relational framework capable of contextualizing localized socio-economic and environmental processes.
Following Ellis (2003), this study conceptualizes livelihoods as an opportunity set or ensemble of capabilities, resources, and activities necessary for securing a viable living. This perspective broadens the understanding of livelihood strategies beyond economic transactions, encompassing social networks, institutional access, environmental constraints, and individual agency. In this regard, the SLA framework provides a conceptual bridge linking local resource endowments to household-level agricultural practices and nutritional status. Each asset domain within SLA plays a pivotal role in shaping both agricultural outcomes and nutritional security:
In agrarian economies, access to and control over natural resources directly influence food production and food consumption. In regions like Uttar Pradesh, where rainfall patterns are increasingly erratic and irrigation infrastructure is unevenly distributed, natural capital becomes a critical determinant of household nutrition and adaptive capacity.
Education levels, agricultural knowledge, and health status affect how households engage with and benefit from agricultural innovations. Educated farmers are more likely to adopt climate-resilient crops, diversify income sources, and make informed decisions regarding nutrition and resource use.
Strong social networks facilitate collective action, provide informal safety nets, and improve access to government schemes such as food rations or agricultural subsidies. These networks are especially vital during periods of environmental stress or market shocks.
Access to markets, roads, storage facilities, and farming equipment enhances agricultural productivity and reduces post-harvest losses, thereby improving both income potential and dietary diversity. The absence of such infrastructure in rural Uttar Pradesh often exacerbates food insecurity.
The availability of financial resources allows households to invest in agricultural inputs, buffer consumption during lean seasons, and access healthcare and nutritious food. However, reliance on informal credit often increases vulnerability due to exploitative interest rates and debt cycles.
Sustainable Livelihood Approach, beyond its focus on livelihood outcomes, offers a conceptual entry point into adaptive capacity, particularly under conditions of environmental uncertainty and socio-economic transformation. Adaptation strategies, including crop diversification, off-farm income generation, and the adoption of climate-smart agriculture (CSA), are mechanisms through which households build resilience to shocks while attempting to maintain nutritional adequacy (Singh et al., 2021b). However, adaptation is not equally accessible to all households. This study expands SLA by integrating an equity-focused lens, recognizing that systemic disparities in gender, caste, and socio-economic status shape access to livelihood assets and, consequently, the ability to adapt. Marginalized groups often face structural barriers in accessing land titles, credit facilities, and institutional support (ADB, 2008), which undermines both their agricultural productivity and nutritional status.
While the SLA recognizes the enabling role of institutional contexts, this study critiques current policy interventions for their limited reach and effectiveness in targeting the most vulnerable. Many welfare programs, although well-intentioned, suffer from issues of leakage, exclusion, and poor implementation at the grassroots level. For example, access to food subsidies, irrigation schemes, or women’s self-help groups may be skewed in favor of socially privileged groups, thereby entrenching existing inequalities (FAO, 2015). The SLA, in this study, is therefore extended to emphasize governance and institutional accountability as integral to sustaining livelihoods.
By integrating agricultural adaptation, equity considerations, and policy critique into the SLA framework, this study enhances its analytical scope and relevance for dryland food security research. The adapted SLA framework used here does not view assets or outcomes in isolation but highlights the interactive and feedback-based nature of livelihood systems. It situates nutritional status as both an outcome and a determinant of livelihood viability—creating a recursive loop in which poor nutrition undermines human capital and future adaptive capacity. In doing so, the present research contributes to the global discourse on sustainability and rural development by offering a contextualized, multi-scalar understanding of how local realities mediate the pursuit of sustainable livelihoods.
Materials and methods
Study area
Bundelkhand region of the Central Indian Landscape is one of the hotspots of poverty, malnutrition, land degradation, poor agriculture and low livestock productivity despite having rich resource endowment (Singh et al., 2022; Sahu et al., 2015; Singh et al., 2014). The region spreads across 6.9 million ha between Madhya Pradesh and Uttar Pradesh states comprising 14 districts with 15.5 million population. This region receives 700–900 mm annual rainfall, yet suffers from water scarcity and land degradation due to poor groundwater recharge as more than 30% rainfall is lost as surface runoff from uplands and due to the presence of a granite layer (Singh et al., 2019; Singh et al., 2022). The water-holding capacity of soil mostly ranged from 10–18% due to severe water erosion (Singh et al., 2021a, 2021b; Garg et al., 2020a; Biswas et al., 2017; Thomas et al., 2016; Singh et al., 2014). Temperature of the region is extreme as it varies from 3–5°C (Min temp) in winter during Dec-Jan to as high as 40–48°C (Max temp) during April–June. Overgrazing, deforestation and change in climatic conditions have caused land degradation and loss in several ecosystem services (Swetalina and Thomas, 2016; Singh, 2020). The region is largely dependent on shallow groundwater resources for domestic and agricultural uses (Anantha et al., 2022; Dev et al., 2022; Garg et al., 2020a). Due to the hard-rock geology, groundwater recharge mainly occurs in shallow and unconfined aquifers characterized by poor specific yield (1–3%). The water level in dug wells (4–8 m deep) is depleted rapidly after the monsoon, with communities having to endure water scarcity, especially during the summer (Singh et al., 2021a, 2021b; Garg et al., 2020a; Singh et al., 2014). The region’s undulating topography, high temperature, poor and erratic rainfall and low soil fertility have led to poor agricultural productivity (0.2–2.0 t/ha) and food insecurity (Rao et al., 2013; Shakeel et al., 2012). Farmers in the region grow crops that consume less water, such as groundnut, black gram, sesame and millets during the kharif (rainy season), and wheat, chickpea, barley, mustard and lentils during the rabi (post-rainy winter) season (Table 1). Crops grown during the wet season may require supplemental irrigation during dry spells, whereas most of the crops grown in the dry season require irrigation support. The region has a high incidence of poverty (30–55% in different districts), low literacy rate (57% overall, 43% in women) and highly vulnerable population of women and landless (Mitra and Rao, 2019; Varua et al., 2018).
Table 1
| Season | Crops | Crop duration (days) | Irrigation status | Jun | July | Aug | Sept | Oct | Nov | Dec | Jan | Feb | Mar | Apr | May |
|---|---|---|---|---|---|---|---|---|---|---|---|---|---|---|---|
| Kharif (Rainy season) | Black gram | 70–75 | Rainfed | ||||||||||||
| Sesame | 70–75 | Rainfed | |||||||||||||
| Millet | 90–100 | Rainfed | |||||||||||||
| Groundnut | 110–120 | 1–2 irrigations | |||||||||||||
| Rabi (Post-rainy/winter season) | Mustard | 110–130 | 1–2 irrigations | ||||||||||||
| Lentil | 110–130 | 1–2 irrigations | |||||||||||||
| Chickpea | 120–130 | 1–2 irrigations | |||||||||||||
| Barley | 120–130 | 2–3 irrigations | |||||||||||||
| Wheat | 120–140 | 3–5 irrigations |
The crop calendar of major crops in Bundelkhand region, Uttar Pradesh, Central India.
The kharif season coincides with the monsoon period whereas the rabi season coincides with the winter period. Grey shaded area signifies the duration of crops in months.
Data collection and analysis
Historical rainfall data
Rainfall data of 23 rain gauge stations (Figure 1) from all seven districts of Bundelkhand region of Central Indian Landscape, between 1950 and 2017 on daily time scale, was retrieved from the India Meteorological Department (IMD), Pune, India. Data was equally divided into two parts viz., 1950–1983 and 1984–2017 and analyzed to understand the trends in terms of the amount and distribution of rainfall on a spatial and temporal scale.
Figure 1

Location of pilot villages along with rainfall variability in Bundelkhand region of Central Indian Landscape.
Household survey
A household survey was conducted through face-to-face interviews between March and July 2018. The sample size of 1,403 households comprising seven districts was determined using proportionate sampling (10% of the total population), based on power calculations to ensure statistical validity for econometric analysis (Lohr, 2019). The interviews were conducted with the household head or, if unavailable, the most senior household member present at the time. Households were categorized as marginal, small, medium, or large farms, allowing for comparative analysis of nutritional disparities associated with varying levels of agricultural productivity. Prior to the interviews, written informed consent was obtained from all participants. Data collection was carried out by trained enumerators who were fluent in the local language and well-acquainted with the region. The questionnaire was translated into local language to eliminate any misunderstanding during the data collection. To minimize potential bias and ensure consistency, enumerators were rigorously trained, and responses were recorded using a pre-tested, structured questionnaire.
Data reliability was enhanced through cross-validation against secondary sources, including government agricultural statistics and prior studies on food security in the region (FAO, 2013; Anantha et al., 2021a, 2021c). Multicollinearity was assessed using the Variance Inflation Factor (VIF) and Contingency Coefficients (CC), which revealed no significant concerns. To detect heteroskedasticity, robust standard error estimation techniques were applied (Wooldridge, 2013). The comprehensive questionnaire gathered detailed information on household demographics, primary occupations, livelihood strategies, farm resources, physical assets, crop and livestock patterns, yields, groundwater availability and access, adoption of agricultural and natural resource management practices, and household level food consumption and nutrition outcomes.
The extent of agricultural land cultivated during the kharif and rabi seasons and that remains fallow were analyzed in respective districts. Resource availability status in terms of groundwater availability, ownership of wells, water marketing, source of energy for withdrawing water for irrigation were also analyzed for the sampled households. Household income was grouped into five major sources viz., agriculture, livestock, wage labor, remittances and other sources. Agricultural income constitutes crop produce from both kharif (rainy season: June to October) and rabi (post-rainy season: November to March) seasons. Total gross income was obtained by multiplying crop yield (obtained from primary survey) by farm gate price and subtracting the total cost of cultivation. The cost of cultivation includes items such as labor, seed, fertilizer and pesticides, irrigation, hiring of machinery, etc. Livestock income was calculated by adding income from milk (after deducting the management cost) and livestock sale Eqs 1–4.
Where, NIa = Net income (US$/HH/year); Yi is crop yield (t/ha) for plot i; Ai is area of the plot i (ha); Ci is cost of cultivation of plot i (US$/ha); n = number of plots farmers owning.
Where, NId = Net income from dairy (US$/household/year); c = Number of cattle in a household, b = number of buffalo in a household; My = milk yield (liter/day); Dm = Days of milking (−); Mp = Market price (US$/liter); Mc = Maintenance cost (US$/animal/year).
Where, NIs = Net income from animal sale; As = Number of animals sold (−); Mp = Market price (US$/animal); Mc = Maintenance cost (US$/animal); n = Types of animals owned by a household (cattle, buffalo, and goat).
To analyze farmers’ perception about their nutritional intake capacity, choices of their adaptation were considered. The target variable for the study, i.e., farmers’ opinions about their nutritional intake capacity, is ordinal. Farmers in the study regions were asked to respond to four different choices of their adaptation level of a particular coping strategy (i.e., 1 = poor nutritional intake, 2 = medium nutritional intake, 3 = high nutritional intake). To analyze such ordinal data, the literature employs ordered logit and probit models (Kursa and Rudnicki, 2010; Liaw and Wiener, 2002; Breiman, 2001). To assess the factors explaining their preference for using a particular strategy, we have estimated an ordered probit model. It is generated by a continuous unobserved latent variable, which, on crossing a threshold. In this case, the threshold represents sample households access level of nutritional intake. However, the selection of two models is chiefly a matter of convenience and which model is most used in the relevant area of research (Long, 1997). This study employs the order probit model as it has wider applicability to assess the ordinal nature of a target variable. As described in Wooldridge (2002), the order probit model is based on latent regression and denoted as Eq 5.
Where represents latent and continuous measure of adaptation strategy by a farm household h, is a vector of explanatory variables, is vector of parameters to be estimated, and describes a random error term, which follows a normal distribution.
Specifically, the ordered probit model of the present study presented as below:
Where is the unobserved latent variable indicating the nutritional intake capacity for households , is the error term.
are the parameter to be estimated, and the explanatory variables include socioeconomic and resource factors. The description of the explanatory variables has been presented in Table 2.
Table 2
| Variable | Description | Type (Superscript) | Coding scheme |
|---|---|---|---|
| Family Size | Number of members in household | Continuous | Numeric |
| Respondent Age | Age of respondent | Continuous | Numeric |
| log (Income) | Log of total household income | Continuous | Logarithmic form |
| Land Size | Farm categories based on land size | Categorical | 1 = Marginal+Small, 2 = Medium, 3 = Large |
| Livestock | Whether household owns livestock | Dummy | 1 = Yes, 0 = No |
| Education | Education level of household head | Categorical | 1–5 levels (illiterate to college+) |
| Gender | Whether the household is male headed | Dummy | 1 = Male, 0 = Female |
| Occupation | Main household occupation | Categorical | 1 = Agriculture (Agri), 2 = Wage labour & Agri, 3 = Agri & others |
| Financial Source | Main source of financial loan | Categorical | 1 = Cooperative Banks, 2 = Private/FMIs, 3 = Commercial banks |
| MGNREGA | Household participation in MGNREGA | Dummy | 1 = Yes, 0 = No |
| Irrigation Sources | Type of irrigation access | Categorical | 1 = No irrigation, 2 = Rainfed, 3 = Irrigated |
Description of explanatory variables used in the analysis.
The observed ordinal outcomes variables, for example Energy Intake, is derived from the latent variables as:
Similar equations apply for Protein Intake and Iron Intake. The parameter ∝ represent thresholds or cut-off points, which can be estimated along with the parameter. The sign of the estimated parameter can be directly interpreted because of the increasing nature of the ordered classes. The ordered probit model can be estimated using maximum likelihood (ML).
The log likelihood function is numerically maximized subject to The ML estimate and are consistent and asymptotically efficient and, accordingly, it is assumed that the error term also follows a normal distribution.
The parameter estimated in the ordered probit model only explained the direction of the effect of explanatory variables on the dependent variable, but did not represent the actual magnitude of change or probabilities in the coefficients. This is because the coefficients of the ordered probit model differ by a scale factor. To overcome this problem, we have estimated the marginal effect of the ordered probit model. The marginal effects or marginal probabilities are functions of the probability itself and measure the expected change in probability of a particular choice being made with respect to a unit change in an independent variable from the mean (Greene, 2000).
Where, is the normal density function, j is the threshold parameter and is the explanatory variable.
We have estimated calorie, protein and iron intake based on food consumption (cereals, pulses, vegetables, and edible oil). Standard values of calorie, protein and iron was taken from Indian Council of Medical Research, New Delhi (ICMR, 2010) and National Institute of Nutrition, Hyderabad (NIN, 2011) for different food items and estimated per capita for sampled households. To examine the nutritional intake capacity of the households, we have divided each of the nutritional intake variables (energy intake, protein intake, and iron intake) into three categories:
Energy Intake: Poor energy intake (<1800 calories/day), medium energy intake (1800 to 2,400 calories/day), high energy intake (>2,400 calories/day).
Protein Intake: Poor protein intake (<40 g/day), medium protein intake (40–60 g/day), high protein intake (>60 g/day).
Iron Intake: Poor iron intake (<10 mg/day), medium iron intake (10–20 mg/day), high iron intake (>20 mg/day).
Cross-sectional econometric analysis is associated with the problem of multicollinearity and heteroscedasticity. Multicollinearity is checked using variance inflation factor (VIF) and contingency coefficients (CC). The mean of the VIF value for all the independent variables is 3.22 which is below 10 suggesting no problem of multicollinearity. Similarly, values of the CC have shown no multicollinearity problem among dummy variables. In addition, the issue of heteroskedasticity of the model was addressed using the robust standard error procedure. According to Wooldridge (2013), robust standard error could effectively solve heteroskedasticity since it gives relatively accurate p-value to ensure the significance of the model.
Results
Rainfall characterization
The region receives nearly 85% of the annual rainfall during July to September months. Long-term data (between 1950 and 2017) of 23 rainfall gauging stations located in seven districts of the Uttar Pradesh’s Bundelkhand region in Central Indian Landscape showed a declining rainfall pattern. Figure 1 shows spatial pattern in rainfall variability between 1950–1983 and 1984–2017. It revealed that districts such as Jalaun, Hamirpur and Mahoba are affected more in terms of reduction in rainfall amount in recent decades (1984–2017) compared to previous decades (1950–1983). The average annual rainfall of the study region was 867 mm during 1950–1983, which declined to 683 mm during 1984–2017. Out of 23 stations, two stations showed no reduction, rainfall reduced by 10–20% for 10 stations, 20–30% for 3 stations, and more than 30% for 7 stations during 1984–2017 compared to 1950–1983. Such declining trend is due to reduction in number of rainfall events from 47 during 1950–1983 to 39 during 1984–2017 in different categories (medium: 10–30 mm, high: 30–50 mm and very high: >50 mm) which clearly indicates evidence of climate change in the region. This has had an adverse impact on water balance at the regional scale, especially on groundwater recharge (Singh et al., 2014) and agricultural productivity (Shakeel et al., 2012).
Household characterization
The sampled households are categorized into four major classes based on landholding size—marginal (<1 ha), small (1–2 ha); medium (2–4 ha) and large (>4 ha). Out of 1,403 households (HHs), 45% (631 HHs) are marginal, 34% (476 HHs) small, 14% (196 HHs) medium and 7% (100 HHs) households fall under the large holding category. The survey was done with the household head (who takes decisions in the household), whose average age was 50 years and education level were 9 years (Table 3). The average household size of the country is 4.8, whereas the same for Uttar Pradesh is 5.7. However, our survey revealed that the household size in Bundelkhand region is 7.2. The average household size of marginal farmers is 6.3; it increased with increasing landholding size. The female–male ratio in current survey was 850:1,000 which is far below than the national average (924:1,000). The average number of working members in the household is 3.4 (47%) and out of that 2.3 are male members.
Table 3
| Particulars | Landholding size | Bundelkhand region | |||
|---|---|---|---|---|---|
| Marginal (<1 ha) | Small (1–2 ha) | Medium (2–4 ha) | Large (>4 ha) | ||
| No of HHs | 631 | 476 | 196 | 100 | 1,403 |
| Average education# | 8 | 9 | 9 | 10 | 9 |
| Average age of respondent | 49 | 52 | 54 | 57 | 51 |
| Family size | 6.3 | 7.4 | 8.3 | 9.4 | 7.2 |
| No. of male members | 2.1 | 2.7 | 3.1 | 4.2 | 2.6 |
| No. of female members | 1.8 | 2.2 | 2.6 | 3 | 2.2 |
| No. of children | 2.7 | 2.7 | 3 | 2.7 | 2.7 |
| Average no. of working members | 3 | 3.6 | 4.1 | 4.4 | 3.4 |
| Average no. of male working members | 1.9 | 2.4 | 2.7 | 3.2 | 2.3 |
Socio-economic and demographic characteristics of households.
# completed years of education.
Land use and cropping pattern
A total of about 2,300 ha agricultural land is with sampled farmers (1,403 HHs), which is equivalent to an average landholding size of 1.64 ha. Only 51 and 72% of the area was cultivated during kharif and rabi season, respectively, indicating 123% cropping intensity. About 12% of total agricultural land is cultivated completely under rainfed conditions and 39% with the support of supplemental irrigation during kharif season. On the other hand, during rabi season, 11% of the total agricultural land area is cultivated completely under rainfed condition and 61% with supplemental irrigation (Table 4). About 49 and 28% of total agricultural land was kept fallow during kharif and rabi seasons of 2017–2018, respectively. The declining rainfall pattern has a strong relationship with increasing fallow land within the district. Districts such as Banda, Hamirpur, Jalaun and Mahoba are highly affected by the reduced rainfall, and they coincide with the highest fallow land during kharif season.
Table 4
| Period | Season/crop | Per cent area of total agricultural land under rainfed condition | Per cent area of total agricultural land under supplemental irrigation | Average no. of supplemental irrigations | Per cent fallow land |
|---|---|---|---|---|---|
| Kharifseason | |||||
| July–Oct | Groundnut | 2.0 | 13.5 | 3 | |
| July–Sept | Black/Green gram | 1.6 | 9.7 | 1 | |
| July–Oct | Sesame | 2.1 | 6.5 | 1 | |
| July–April | Pigeonpea | 3.9 | 2.7 | 2 | |
| July–Oct | Millet/sorghum | 1.9 | 3.4 | 2 | |
| July–Oct | Other crops | 0.3 | 3.1 | 2 | |
| Total | 12 | 39 | 49 | ||
| Rabiseason | |||||
| Nov–Mar | Wheat | 5.3 | 43.1 | 5 | |
| Nov–Feb | Chickpea | 2.9 | 8.9 | 2 | |
| Oct–Feb | Mustard | 1.6 | 4.4 | 2 | |
| Nov–Feb | Field pea | 0.6 | 2.6 | 3 | |
| Nov–Feb | Lentil | 0.7 | 1.1 | 3 | |
| Nov–Mar | Barley | 0.2 | 0.5 | 3 | |
| Total | 11 | 61 | 28 |
Crop-wise agricultural land use status of sample households during 2017–18 kharif and rabi season in Bundelkhand, Uttar Pradesh (Total agricultural land = 2,305 ha).
Groundnut, black gram and green gram are the major kharif season crops covering about 27% of total agricultural land. Sesame, pigeonpea, and millets (sorghum and pearl millet) cover about 24% of total agricultural land. All crops were predominantly rainfed. However, most of the farmers provided one or two supplemental irrigations during dry spells (in monsoon period) which is very common in Bundelkhand region. During rabi season, wheat is the most dominant crop, covering about 50% of total agricultural land as it is the staple crop in the region. In addition, its crop residue is used as dry fodder for feeding animals throughout the year. Chickpea, mustard, field pea, lentil and barley are grown in about 24% of total agricultural land. Most of these crops required supplemental irrigation as rainfall during the rabi season is negligible.
Groundnut, black gram and green gram are predominantly grown in Jhansi, Lalitpur and Mahoba districts, whereas pigeonpea and millets are cultivated in Banda and Chitrakoot during kharif (Figure 2). On the other hand, sesame, millets and pigeonpea are grown in Hamirpur and Jalaun during kharif season. Further, fallow land was more than 50% of total agricultural land in Banda, Chitrakoot, Hamirpur, Jalaun and Mahoba districts. Fallow land in Jhansi and Lalitpur was less than 30% of total agricultural land in kharif season. Comparative analysis of fallow land in kharif season shows that it is largely associated with soil types and groundwater availability. Higher proportion of fallow land was found in districts (Chitrakoot, Banda, Hamirpur) predominant in Vertisols as agricultural operations are difficult in these soils during the monsoon due to higher clay content. Whereas in Alfisols-dominated districts such as Jhansi, Lalitpur and Mahoba, farmers are able to cultivate kharif season crops, resulting in lesser areas under fallow condition during the monsoon period. However, farmers who cultivate during kharif season provide at least one or two supplemental irrigations to save their crops from intermittent droughts.
Figure 2

Current cropping pattern during kharif season in Bundelkhand region, Uttar Pradesh (GN, Groundnut; BG/GG, Black gram/green gram; M/S, Millets; PP, Pigeonpea; SE, Sesame; OR, Others; FA, Fallow).
The cropping pattern in these districts is mainly driven by the rainfall pattern, soil types and water availability. As Alfisols are dominant in Jhansi, Lalitpur and Mahoba, these districts are suitable for groundnut cultivation in the kharif season. Long-duration pigeonpea (7–9 months) fits well with Vertisols in Banda, Chitrakoot and Hamirpur districts characterized by relatively higher moisture-holding capacity (150–200 mm/m). Moreover, farmers in districts where Vertisols are predominant also follow the practice of inter-cropping with sorghum, millets and other pulses to bring diversity in the production system with cereal-legume combination.
Further, Figure 3 describes the cropping system and its percentage area in different districts during rabi season. Wheat is grown across all districts with supplemental irrigation, covering more than 50% area. Chickpea is also grown in Hamirpur, Mahoba, Banda, Chitrakoot and Jalaun covering 15–20% of total agricultural land during rabi. Mustard is largely cultivated in Banda, Chitrakoot, Hamirpur and Jalaun covering 10–15% of total agricultural land of respective districts. Field pea is mainly grown in Jalaun and Mahoba covering 8–12% of the total agricultural land in the district. During rabi season, farmers left around 30% land fallow, however, there is large variation across districts. It is realized that the cropping system followed in rabi season is largely dependent on water availability (both residual soil moisture and irrigation water availability). As Jalaun and Hamirpur districts experience frequent droughts due to climate change, cultivating sesame during kharif has been largely adopted in past 5–10 years. Moreover, mustard and chickpea, which require less water, are being cultivated during rabi season. Farmers with assured water availability (with supplemental irrigation) have attempted to cultivate wheat as it requires minimum 4–5 irrigations.
Figure 3

Current cropping pattern during rabi season in Bundelkhand region, Uttar Pradesh (BL, Barley; CP, Chickpea; FP, Field pea; LT, Lentil; MD, Mustard; WT, Wheat; FA, Fallow).
Water resources availability and use pattern
The number of wells and their functioning status is described in Table 5. The number of irrigation wells were found to increase over the period. The number of wells before 1980 was only 61 among 1,403 households but increased to 536 wells after 2010. Declining rainfall is one of the reasons for increasing dependence on groundwater resources. The study revealed that about 2/3rd (66%) of the wells were found functioning for 3–6 months, whereas only 12% of wells were working throughout the year. Further, area irrigated by different sources revealed that dug wells are the major source of irrigation in Jhansi, Lalitpur and Mahoba districts; whereas Jalaun, Hamirpur and Banda are mainly dependent on borewells as groundwater level is deep in these districts as compared to Jhansi, Lalitpur and Mahoba (Figures 4a,b). Hydro-geological factors influence the type of wells functioning in respective districts.
Table 5
| Year | Number of wells for irrigation use | % wells functioning | |||
|---|---|---|---|---|---|
| <3 months | 3–6 months | months | >9 months | ||
| Before 1980 | 61 | 9 | 63 | 14 | 14 |
| 1980–1990 | 188 | 7 | 76 | 9 | 8 |
| 1991–2000 | 360 | 6 | 76 | 10 | 8 |
| 2001–2010 | 459 | 6 | 68 | 16 | 11 |
| After 2010 | 536 | 5 | 66 | 16 | 12 |
Status of irrigation wells in Bundelkhand region, Uttar Pradesh.
Figure 4

District-wise agriculture land use status (fallow, rainfed, and source-wise irrigated area) during (a)kharif, (b)rabi season.
The well ownership and water marketing pattern suggested that there is an increasing trend in ownership of wells along with landholding size (Figure 5). About 35% of marginal and 55% of large farmers have their own wells. Out of total households, 20–25% farmers purchased water from neighboring farmers. About 30–50% marginal and small farmers cultivated their land under rainfed condition, whereas this percentage was 25–30% for medium and large farmers. The survey further indicated that across the farm typology, investment for irrigation was found as US$ 20 (marginal farmers), US$ 70 (small farmers) and US$ 105-185/ha/year (medium and large farmers). In other words, US$ 20–25 is required to provide one supplemental irrigation for 1.0 ha land. Marginal and small farmers were able to provide only 1 to 2 irrigations per year, whereas medium and large farmers provided 4 to 8 irrigations per year.
Figure 5

Farmer typology-wise (a) sources of irrigation (own wells, purchased, and rainfed); (b) water rent paid in Bundelkhand region, Uttar Pradesh.
District-wise sources of irrigation, water marketing pattern along with type of wells and pump sets used for withdrawing water from wells is presented in Figure 6. It is revealed that about 50–80% of farmers in Jhansi, Lalitpur and Mahoba districts have their own wells (dug wells) and there is no dependence on water purchasing. Most of these wells are fitted with diesel pump sets as the depth of dug wells is shallow and ranging between 5–15 m (average 10 m). A considerable proportion (40–70%) of farmers in Banda, Jalaun and Hamirpur districts purchase irrigation water mainly from borewells system and both electric and diesel sets are being used for pumping.
Figure 6

(a) Source of irrigation (own wells, purchased, and rainfed); (b) type of wells; and (c) type of pumps used for withdrawing irrigation water in different districts of Bundelkhand region, Uttar Pradesh.
Table 6 summarizes average crop yield across districts during kharif season and there was a variation in crop yields across the districts due to soil types, rainfall pattern and management practices. The average yield of black gram and green gram was 620 kg/ha; groundnut—1,450 kg/ha; millets—600 kg/ha; pigeonpea—30 kg/ha, sesame—530 kg/ha; and sorghum—860 kg/ha. Table 7 revealed that the crop yield during rabi season is also varied from district to district. Average yield of mustard crop was 1,240 kg/ha, that of chickpea, field pea and lentil was 1,400–1,500 kg/ha, and, barley and wheat yield was 2,500 kg/ha. The average crop yields in the region were found to be 30–40% lower than the state and national average.
Table 6
| District | Blackgram/greengram | Groundnut | Millet | Pigeonpea | Sesame | Sorghum |
|---|---|---|---|---|---|---|
| Banda | – | – | 710 | 900 | 390 | 760 |
| Chitrakoot | 630 | – | 420 | 770 | 360 | 740 |
| Hamirpur | – | 1,200 | – | 840 | 670 | 880 |
| Jalaun | 530 | – | 630 | 630 | 800 | 1,050 |
| Jhansi | 670 | 1,800 | – | – | 340 | – |
| Lalitpur | 600 | 1,280 | – | – | 330 | – |
| Mahoba | 680 | 1,550 | – | 530 | 840 | – |
| Bundelkhand average | 620 | 1,450 | 600 | 730 | 530 | 860 |
Variation in crop yields (kg/ha) in different districts of Bundelkhand region, Uttar Pradesh, during kharif season.
Table 7
| Mustard | Chickpea | Field pea | Lentil | Barley | Wheat | |
|---|---|---|---|---|---|---|
| Banda | 1,050 | 1,030 | 1,250 | 2,000 | – | 2,770 |
| Chitrakoot | 780 | 980 | 1,220 | – | – | 1,670 |
| Hamirpur | 1,350 | 970 | – | 1,270 | – | 2,470 |
| Jalaun | 1,090 | 1,360 | 1,470 | 950 | – | 2,590 |
| Jhansi | – | 1,650 | 1,880 | – | 2,990 | 3,000 |
| Lalitpur | – | 2,000 | – | – | – | 2,350 |
| Mahoba | 1,920 | 1,810 | 1,700 | – | 2,000 | 2,530 |
| Bundelkhand average | 1,240 | 1,400 | 1,500 | 1,410 | 2,500 | 2,500 |
Variation in crop yields (kg/ha) in different districts of Bundelkhand region, Uttar Pradesh, during rabi season.
Livestock ownership pattern
Livestock is an integral part of the farming system in the Bundelkhand region and forms a major part of income sources. About 56% of the sampled households had cattle; 60% households owned buffalos and 28% households had goats. Further, the survey data indicated that marginal and small farmers own majority of cattle, buffaloes and goats. The average cattle, buffalo and goat population stands at 1.7, 2.8, and 5 per household, respectively (Table 8). However, the average number of animals (cattle, buffalo, and goats) per household was more with large farmers compared to other categories of farmers. Figure 7 revealed that 55–65% of households in respective districts own cattle; 55–75% households own buffalos, whereas large variation was found with goat. Goat owning households were found highest in Hamirpur, Mahoba, and Jalaun (40–45% HHs) which coincides with low cropping intensity and declining rainfall status.
Table 8
| Typology | % HHs having cattle | No. of cattle per HH | % HH having buffalo | No. of buffalo per HH | % HH having goats | No. of goats per HH |
|---|---|---|---|---|---|---|
| Marginal (<1 ha) | 24.1 | 1.6 | 23.9 | 1.8 | 12 | 3.5 |
| Small (1–2 ha) | 19.1 | 1.7 | 20.2 | 2.2 | 9 | 6.2 |
| Medium (2–4 ha) | 7.6 | 1.7 | 10.5 | 2.5 | 5 | 4.3 |
| Large (>4 ha) | 5.0 | 1.9 | 5.7 | 4.5 | 2 | 6.1 |
| Total HHs | 55.8 | 1.7 | 60.3 | 2.8 | 28 | 5.0 |
Status of livestock resources across farmers’ typology in Bundelkhand region, Uttar Pradesh.
Figure 7

Ownership of cattle population in different districts of Bundelkhand region, Uttar Pradesh. Sources of household income.
Household income
There are five major sources of income, and these vary by landholding size (Figure 8). Total annual income of marginal, small, medium, and large farmers was US$ 1,240, US$ 1,690, US$ 2,375, and US$ 4,870 per household per year, respectively. The per capita income was US$ 0.54, US$ 0.63 and US$ 0.79/person/day, for marginal, small and medium category households, whereas the per capita income was US$ 1.42/person/day for large farmers. The share of agriculture and livestock income in total income was 50% (marginal), 60% (small), 70% (medium) and 78% (large farmers) and rest of the income was drawn from labor, remittances and other sources. The income share from wage labor is 18, 12, 7 and 3% for marginal, small, medium and large farmers, respectively. Further, contribution from remittances in total income is 26, 19, 12 and 11% for marginal, small, medium and large farmers, respectively.
Figure 8

Sources of household income for different farmers’ typology in Bundelkhand region, Uttar Pradesh.
The district-wise variation in annual household income is evident as the average annual household income ranged between US$ 975 to US$ 2,505/HH/annum (Figure 9). The contribution from agriculture and livestock together ranged from 49–85% of total annual income. Among the districts, the highest income was in Jhansi with US$ 2,905/HH/annum, which has major contribution from agriculture and livestock (85%), followed by Jalaun with US$ 2,505/HH/annum. The contribution from labor was US$ 345 (Lalitpur), followed by US$ 265/HH/annum (Banda) and US$ 240/HH/annum (Jalaun). Income from remittances was found highest in Banda (US$ 705/HH/annum), followed by Jalaun (US$ 465/HH/annum) and Mahoba (US$ 290/HH/annum).
Figure 9
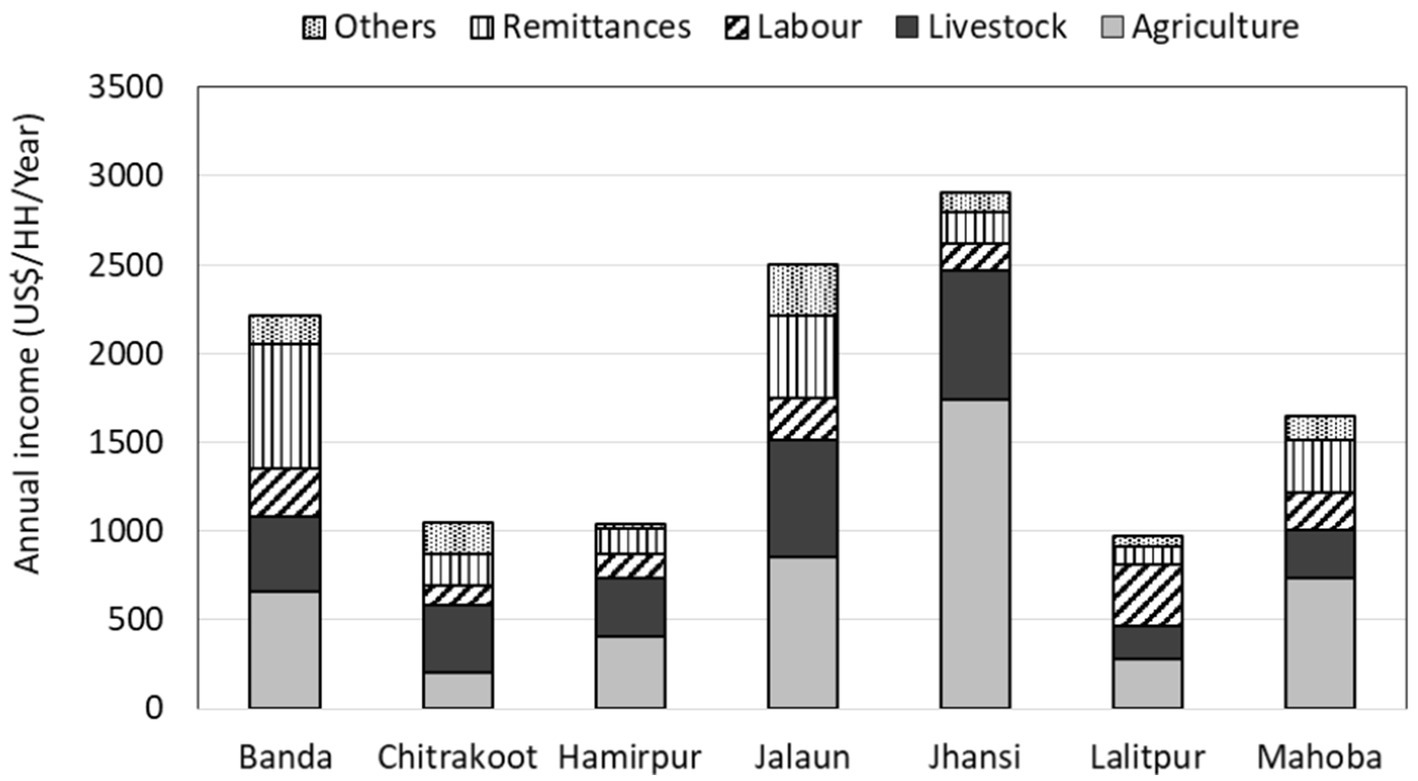
Sources of household income across different districts in Bundelkhand region, Uttar Pradesh.
Relationship between resource endowments, income and nutrition
Energy intake
The results of the ordered probit model of factors influencing energy intake among the sample households in the study regions are presented in Table 9. The sign of the parameters of each significant variable explained the direction of effects of various independent variables on energy intake categories.
Table 9
| Variables | Parameter | Marginal effect () | ||
|---|---|---|---|---|
| Poor | Medium | High | ||
| Family size | −0.245*** | 0.075*** | $−0.029*** | −0.045*** |
| Resp_age | 0.037 | −0.011 | 0.004 | 0.007 |
| Log_total_Y | 0.067* | −0.020* | 0.008* | 0.012 |
| Land size | ||||
| Medium | 0.163* | −0.050* | 0.019* | 0.030* |
| Large | 0.101 | −0.030 | 0.012 | 0.018 |
| Livestock’s | ||||
| Yes | 0.176 | −0.051 | 0.021 | 0.029 |
| Education | ||||
| Primary | 0.056 | −0.017 | 0.007 | 0.009 |
| Upper primary | −0.059 | 0.017 | −0.007 | −0.009 |
| High school & inter | 0.267** | −0.085** | 0.032** | 0.052** |
| College and above | 0.151 | −0.046 | 0.018 | 0.028 |
| Gender | ||||
| Male | 0.090 | −0.027 | 0.011 | 0.016 |
| Occupation | ||||
| Wage Lab & Agri. | −0.067 | 0.020 | −0.008 | −0.012 |
| Agri & Others | 0.027 | −0.008 | 0.004 | 0.005 |
| Finance sources | ||||
| Private banks and FMIs | 0.092 | −0.028 | 0.011 | 0.017 |
| Commercial banks | 0.093 | −0.029 | 0.011 | 0.017 |
| MGNREGA | ||||
| Yes | 0.220** | −0.070* | 0.026** | 0.045* |
| Nature_irrigation | ||||
| Rainfed | 0.276 | −0.069 | 0.032 | 0.037 |
| Irrigated | 0.459** | −0.124** | 0.054* | 0.064** |
| Number of obs | 1,131 | |||
| Wald chi2(18) | 43.97 | |||
| Prob > chi2 | 0.0006 | |||
| Pseudo R2 | 0.266 | |||
| Log likelihood = | −800.69071 |
Energy intake among sampled households across seven districts of Bundelkhand region, Uttar Pradesh.
*p < 0.10; **p < 0.05; ***p < 0.01.
Variables, namely family size, are inversely associated with the energy intake capacity, while it is shown to have a positive association with income (log of total income), medium farm size, high school education, participation in Mahatma Gandhi National Rural Employment Guarantee Act (MGNRGEA), and irrigated land. Specifically, the marginal effect result indicates that the probability of an additional family member falling into the poor energy intake category rises by 7.5%, whereas the probability of them falling into the medium and high energy intake categories decreases by 2.9 and 4.5%, respectively. The positive parameter of income indicates that every additional unit increases in the total income (agriculture and non-agricultural sources) decreases the likelihoods of energy intake in the poor category by 2% while increasing the probabilities of falling into the medium and high energy intake categories by 0.8 and 1.2%, respectively. This might be due to the better purchasing power of high-income households on nutritious and quality foods, thereby improving their overall energy intake as compared to the poorer households.
With every unit increase in land holding size among medium farmers, the probability of falling into the poor energy intake category reduces by 5%, whereas the probabilities of falling into the medium and high categories increases by 1.9 and 3%, respectively. This suggests that households with medium-size land holdings produce sufficient food for their own consumption and possibly a surplus for sale in the market. This helps to improve food security, dietary intake, and the ability of the households to generate revenue. Households (household head) with high school education are observed to be 8.5% less likely to fall into the poor energy intake category and 3.2 and 5.2% more likely to fall into the medium and high categories, respectively. This highlights the significance of education in enhancing dietary diversity and decision-making that contribute to better health and energy intake.
The marginal effect of participation in MGNREGA shows the likelihoods of falling into poor energy intake categories among the sample households reduces by 7.0% and rises by 2.6 and 4.5%, respectively, for them to fall into the medium and high energy intake categories. This shows the significance of the MGNREGA program in generating employment opportunities and thereby improving their food intake and nutritional status among the sample households in the study regions. Marginal and small-holder farmers are the major beneficiaries of this welfare program. Every additional unit increase in irrigated land leads to the likelihood of falling into the poor category, declining by 12.4%, and it increases the likelihood by 5.4 and 6.4% among the medium and high energy intakes, respectively.
On the other hand, certain explanatory variables such as livestock ownership, gender, occupation and access to financial sources did not show statistically significant effects on household energy intake levels. Nonetheless, their inclusion in the model remains important for capturing the border structural context and for evaluating the robustness of the findings. The lack of a significant relationship between livestock ownership and energy intake suggests that livestock may serve more as a form of economic security than as a direct source of energy rich food for household consumption. Similarly, the gender of the household head did not significantly impact energy intake, which may reflect relatively equitable food distribution within households, particularly in agrarian rural settings.
The insignificance of occulation type indicates that income differences across these occupational categories may not be substantial enough to influence food purchasing behavior. This may imply that total household income, rather than the nature of employment, is a more critical determinant of energy intake. Additionally, access to financial institutions showed no significant association with dietary energy intake. This suggests that access to credit or loans alone does not necessarily lead to improved nutrition unless those resources are specifically directed toward food security or nutrition related expenditures.
Protein intake
The parameter of the (−0.1610) ordered probit model reveals a negative association between protein intake and family size (Table 10). Further, it implies that larger families are associated with 6.2% higher probability of falling into the poor protein intake category and the probability of decreasing the same by 2.4 and 3.8% for the medium and high categories, respectively. This suggests the difficulty of the distribution of adequate protein intake to each member of a large family size. Total income exhibits a positive effect (0.0669), indicating an increase in income reduces the likelihood of poor protein intake by 2.6% and increases the likelihood of medium and high intake by 1 and 1.6%, respectively. This suggests a higher income level enables adequate access to foods with high protein contents. Land holding size and protein intake showed a positive association. Specifically, with every addition unit increase in land size holding among the medium-sized farmers, the likelihood of falling into the poor protein intake decreases by 5.4% and rises the likelihood of falling into the medium and high intake categories by 2 and 3.4%. Large landholding sizes enable the sample households to cultivate more varieties of crops with effective use of available resources, which in turn enhance their agricultural productivity and food availability.
Table 10
| Variables | Parameter | Marginal effect () | ||
|---|---|---|---|---|
| Poor | Medium | High | ||
| Family size | −0.1610** | 0.0619** | $-0.0237** | −0.0382** |
| Respo_age | 0.0069 | −0.0027 | 0.0010 | 0.0016 |
| Log_Total_Y | 0.0669** | −0.0258** | 0.0099** | 0.0159** |
| Land size | ||||
| Medium | 0.1415* | −0.0544* | 0.0204* | 0.0340* |
| Large | 0.0337 | −0.0130 | 0.0054 | 0.0077 |
| Livestock’s | ||||
| Yes | −0.0162 | 0.0062 | −0.0024 | −0.0039 |
| Education | ||||
| Primary | 0.1098 | −0.0427 | 0.0174 | 0.0253 |
| Upper primary | −0.0730 | 0.0286 | −0.0133 | −0.0153 |
| High school & inter | 0.2423** | −0.0932** | 0.0336** | 0.0596** |
| College and above | 0.2040* | −0.0788 | 0.0294* | 0.0493 |
| Gender | ||||
| Male | 0.1623 | −0.0624 | 0.0239 | 0.0385 |
| Occupation | ||||
| Wage Lab & Agri. | −0.0778 | 0.0300 | −0.0119 | −0.0181 |
| Agri & Others | −0.2779 | 0.1075 | −0.0493 | −0.0582 |
| Finance sources | ||||
| Private banks and FMIs | 0.0130 | −0.0050 | 0.0019 | 0.0031 |
| Commercial banks | 0.0395 | −0.0152 | 0.0057 | 0.0094 |
| MGNEGA | ||||
| Yes | 0.2407** | −0.0913** | 0.0296*** | 0.0618** |
| Nature_irrigation | ||||
| Rainfed | 0.4820** | −0.1847** | 0.1005* | 0.0842*** |
| Irrigated | 0.5578** | −0.2141*** | 0.1118** | 0.1022*** |
| Number of obs | 1,131 | |||
| Wald chi2(18) | 43.64 | |||
| Prob > chi2 | 0.0007 | |||
| Pseudo R2 | 0.212 | |||
| Log likelihood = | −1129.1689 | |||
Protein intake among sampled households across seven districts of Bundelkhand region, Uttar Pradesh.
*p < 0.10; **p < 0.05; ***p < 0.01.
Emphasizing the role of education in supporting improved dietary practices, high school education was linked with a 9.3% reduction in the likelihood of poor protein intake and a 3.4 and 5.9% rise in the medium and high intake categories, respectively. Participation of MGNREGA reduces the falls in the poor protein intake category by 9.1% and increases its likelihoods of medium and high intake by 2.9 and 6.2%, respectively, highlighting the improvement of the welfare program in improving the food security in the study region. Irrigated land further reduces the probability of poor protein intake by 21.4% and increases the probability of medium and high intake protein intake by 11.2 and 10.2%, respectively. This shows the importance of consistent irrigation in the promotion of higher crop yields and adequate protein availability.
The lack of a significant relationship between respondent age and protein intake suggest that dietary decisions are more influenced by household-level factors or income rather than individual age related preferences. Similarly, livestock ownership does not show a significant effect on protein consumption, possibly because animal-based products like milk, meat, or eggs are not fully integrated into the household diet. This may indicate that livestock is primarily kept for income-generating purpose rather than for household nutrition. The insignificance of primary and upper primary education levels implies that only higher education such as secondary or college has a substantial impact on nutritional related decisions. Basic education may not sufficiently raise awareness about balanced diets or improve access to nutritious foods. Gender of the household head also shows no significant effect on protein intake, suggesting that food access and consumption within households might be relatively gender neutral.
Moreover, different occupational categories including agricultural wage labourers and those in non-agricultural work do not significantly influence protein intake. This could be due to relatively uniform income levels across these occupations, which are insufficient to create notable differences in dietary quality. Access to financial institutions such as private or commercial banks does not appear to affect protein consumption. This is likely because such access not necessarily lead to spending targeted at improving diet or increasing protein intake.
Iron intake
The family size has a negative parameter (−0.158), indicating an increase in family size is associated with a lower iron intake capacity of the sample households (Table 11). In particular, for an increase in every additional family member, the probability of falling into the poor iron intake and medium iron intake categories rises by 6 and 3.9%, respectively. Conversely, the probability of falling into the high iron intake category decreases by 5.5%.
Table 11
| Variables | Parameter | Marginal effect () | ||
|---|---|---|---|---|
| Poor | Medium | High | ||
| Family size | −0.1585** | 0.0159** | 0.0390** | −0.0548** |
| Respo_age | −0.0029 | 0.0003 | 0.0007 | −0.0010 |
| Log_Total_Y | 0.1115*** | −0.0112*** | −0.0274*** | 0.0386*** |
| Land size | ||||
| Medium | 0.0867 | −0.0085 | −0.0217 | 0.0302 |
| Large | −0.0035 | 0.0004 | 0.0008 | −0.0012 |
| Livestock’s | ||||
| Yes | 0.0408 | −0.0042 | −0.0098 | 0.0140 |
| Education | ||||
| Primary | 0.0461 | −0.0050 | −0.0105 | 0.0155 |
| Upper primary | −0.0377 | 0.0044 | 0.0080 | −0.0124 |
| High school & inter | 0.2680*** | −0.0247** | −0.0704** | 0.0951*** |
| College and above | 0.3136** | −0.0279** | −0.0844** | 0.1122** |
| Gender | ||||
| Male | 0.1016 | −0.0109 | −0.0234 | 0.0344 |
| Occupation | ||||
| Wage Lab & Agri. | −0.0054 | 0.0005 | 0.0013 | −0.0019 |
| Agri & Others | 0.0363 | −0.0035 | −0.0091 | 0.0126 |
| Finance sources | ||||
| Private banks and FMIs | −0.0258 | 0.0026 | 0.0063 | −0.0089 |
| Commercial banks | 0.0018 | −0.0002 | −0.0005 | 0.0006 |
| MGNEGA | ||||
| Yes | 0.2650** | −0.0226*** | −0.0729** | 0.0955** |
| Nature_irrigation | ||||
| Rainfed | 0.1315 | −0.0165 | −0.0256 | 0.0421 |
| Irrigated | 0.2598* | −0.0297 | −0.0564** | 0.0861** |
| Number of obs | 1,131 | |||
| Wald chi2(18) | 49.54 | |||
| Prob > chi2 | 0.0001 | |||
| Pseudo R2 | 0.272 | |||
| Log likelihood = | −883.588 | |||
Iron intake among sampled households across seven districts of Bundelkhand region, Uttar Pradesh.
*p < 0.10; **p < 0.05; ***p < 0.01.
This might be due to resource dilution, such as food among the family members, limited dietary diversity, and limited households’ ability to purchase the iron-intake foods, namely meat, fish, and other non-vegetarian items. Reduction in per capita income might be the potential reason for the reduction of iron per capita among the households. Similar to the preceding findings, the parameter value (0.115) signifies a positive association between the income level and iron intake capacity of the households. From the marginal effect, it is observed that every unit increase in income reduces the likelihoods of having poor iron intake capacity by 1.1% and rises the likelihoods of having medium and high intake by 2.7 and 3.9%, respectively. This indicates higher income improves access to higher iron-intake foods. Further, obtaining high school education reduces the likelihoods of poor iron intake by 2.5% and raises the likelihoods of medium and high iron intake by 7 and 9.5%, respectively. Further, the likelihood of sample respondents with college degrees and above falling into the low and medium iron intake category decreased by 2.79 and 8.44%, respectively, while the likelihood of falling into the high iron intake category increased by 11.2%. This indicates the significance of education in enhancing the dietary choices and iron intake capacity of households.
The sample households that participate in the MGNREGA have a lower probability of falling into the poor and medium iron intake categories (2.3 and 7.3%, respectively), and a higher probability of falling into the high intake category (9.55%). This highlights the effectiveness of the MGNREGA program to improve nutrition intake and food security in the study regions. Irrigated land was further observed to improve the iron intake capacity of the sample households. Every additional unit increase in irrigated land will lead to a likelihood of poor iron intake by 2.97% and increase the probability of medium and high iron intakes by 5.6 and 8.6%, respectively.
Regarding iron intake among the sampled households, factors such as the respondent’s age, landholding size, livestock ownership, education level, gender, occupation, and sources of finance were found to be statistically insignificant across different categories. This indicates that these variables do not have a direct impact on the household’s iron intake levels. Age and gender appear to have little effect on intra-household food allocation or preferences for iron-rich foods. Similarly, livestock ownership did not lead to improved iron intake, possibly due to limited consumption of iron-rich animal products. Low levels of education may not provide sufficient nutritional knowledge, while the insignificance of land size and occupation suggests that merely owning land or engaging in certain types of work does not guarantee diverse dietary practices. Furthermore, access to credit from banks or microfinance institutions does not seem to correlate with improved iron intake, implying that financial access alone does not translate into better nutritional outcomes.
Discussion
Resource demand–supply gap
This paper examined the resource availability, agricultural productivity, income, and nutritional status across various household category in the Bundelkhand region of the Central Indian Landscape. Farmers in the area cultivate approximately 50–60% of their agricultural land during either the kharif or rabi season, leaving the remaining land fallow. As a result, the overall cropping intensity remains at around 123%. Limited water resources and poor internal drainage in Vertisols are the primary factors restricting cropping intensity. Districts characterized by Alfisols mainly cultivate crops during the kharif season, supported by supplemental irrigation. However, due to water scarcity, a considerable portion of land is left fallow during the rabi season. In contrast, districts dominated by Vertisols often leave land fallow during the kharif due to waterlogging, relying more heavily on rabi season cultivation.
Farmers expressed their preferences for rabi season crops, citing lower risks compared to kharif season crops, which are dependent on monsoon. The kharif season is associated with a high likelihood of crop failure caused by delayed rainfall, prolonged dry spells, drought or unseasonal rains during crop maturity, discouraging farmers from cultivation during this period. Many farmers emphasized the desire to grow assured crops. However, allocating irrigation water to kharif season crops could reduce freshwater availability for rabi season crops. Farmers with wells that function year-round are able to grow crops in both seasons. On the contrary, those with limited or non-functional wells often leave their land fallow, even in the rabi season. Land use patterns during the rabi season are primarily determined by water availability from shallow dug wells of borewells. In the kharif season, land use depends on a combination of water availability, soil type, hydrogeological conditions, and rainfall.
Agriculture and livestock are major sources of income for all categories of households. However, marginal and small farmers frequently supplement their income through labor activities, either locally or by integrating elsewhere. Large farmers earn about 70–80% of their income from agriculture and livestock and the rest through other sources, including labor and remittances. The annual household income of marginal, small and medium farmers ranged from US$ 1,200 to 2,400 with 5 to 6 members in a family, whereas that of large farmers is US$ 4,930 supporting 7–8 members in a family. The findings also revealed that over 90% of surveyed households have a per capita income below the poverty threshold of US$ 1.25/person/day. Notably, even large farmers are close to this threshold, indicating that severe poverty affecting the region.
Opportunities for resource optimization
Land degradation remains a major challenge to achieving higher cropping intensity and productivity in the region. In addition, access to supplemental irrigation significantly influences farmers’ income. As groundwater is the primary source of irrigation, rejuvenating the landscape offers a promising strategy to address water scarcity, enhance productivity, and convert fallow land into productive use in dryland areas (Ricciardi et al., 2020). Previous studies have demonstrated that cropping intensity can be effectively increased through decentralized rainwater harvesting interventions (Singh et al., 2022; Dev et al., 2022; Garg et al., 2022b; Garg et al., 2022a, 2022c; Singh et al., 2021a, 2021b; Garg et al., 2020a; Garg et al., 2020b; Singh et al., 2014). Integrating landscape-level and field-scale technologies has successfully transformed large areas of fallow land into productive cultivation. These interventions have improved land and water use efficiency by 80–100%, boosted agricultural production by over >50%, and increased farmers’ income two to three times compared to the baseline (Anantha et al., 2022). For instance, Garg et al. (2020a) highlights the rainwater harvesting potential in the Bundelkhand region through the restoration of traditional structures like havelis that became defunct over time due to lack of collective action, leading to reduced ecosystem services (Singh et al., 2022; Singh et al., 2021a, 2021b; Sahu et al., 2015). Moreover, various in-situ measures, such as agroforestry also offer effective solution for combating land degradation and enhancing groundwater recharge (Garg et al., 2021; Ghosh et al., 2019; Chavan et al., 2016). These efforts have shown that combining rainwater harvesting with productivity enhancement in agriculture and livestock can significantly increase farmer income. Despite these benefits, many ridge lines remain untreated with appropriate landscape treatments. Public welfare programs have traditionally focused on midlands, neglecting upland areas which has led to continued degradation and the conversion of productive land into permanent fallows. A combination of landscape-based and field-scale interventions offers a viable path toward sustainable crop intensification in degraded regions by ensuring moisture availability, critical in water scarce environments (Anantha et al., 2022). In the Bundelkhand region, poor socio-economic status of farmers is largely driven by limited irrigation availability and insufficient non-farm employment opportunities (Singh, 2020). To tackle low productivity in both agriculture and livestock sectors, integrated efforts are needed, including, improved land, water and nutrient management, better agronomic practices and targeted capacity-building initiatives.
Fallow land, which account for 40–60% in different seasons, presents a huge untapped potential. This can be harnessed through natural resource management practices, such as ensuring proper drainage during monsoons in Vertisols-dominant landscape (Singh et al., 2014). Water conservation and demand management strategies are key to addressing these challenges. While conservation practices increase water availability, demand management optimizes the use of land and water resources, thereby reducing pressure on the environment (Kumara et al., 2010; Pradhan et al., 2018). Residual soil moisture in fallow land often evaporates unproductively. This moisture can be redirected toward productive transpiration through crop intensification efforts (Jägermeyr et al., 2016; Hoff et al., 2010; Rockström, 2003).
Empirical findings emphasize the importance of socio-economic and educational factors in shaping nutritional outcomes. Large family sizes tend to negatively impact nutritional intake, while higher household income improves it. Educational attainment, especially at the high school level and above, significantly improves both protein and iron intake, indicating that education plays a vital role in promoting better dietary decisions. Participation in MGNREGA also correlates with improved nutritional status, particularly iron intake, demonstrating its effectiveness in enhancing food security. Moreover, irrigation contributes to better access to nutrient-rich foods, linking agricultural productivity with nutritional improvement. These findings highlight the need for targeted policy interventions that address family size, income, education, and farming practices to improve nutrition in the study regions of Uttar Pradesh.
Research implications for policy
Though the interplays between resource endowments, agricultural productivity and nutritional outcomes have been widely studied, the existing literature often examines these components in isolation rather than as an integrated system. Dryland agriculture, particularly in regions like Bundelkhand, faces acute challenges due to water scarcity, land degradation and climate variability which has a direct impact on food security and nutritional outcomes (Prăvălie, 2016; Squires et al., 2019). While previous studies have focused on yield improvements as a primary strategy for enhancing food security, there is limited empirical evidence linking resource endowments to household nutritional status through a structured econometric approach (Ricciardi et al., 2020).
By employing system-based perspectives with an integration of resource availability, agricultural productivity, and nutritional outcomes in a single analytical framework, the study is a value addition to the existing literature. The ordered probit model allows for a comprehensive understanding about the differentiation between varying levels of nutritional adequacy along with the major contributory factors among the households, providing more precise policy recommendations (Nichols, 2020).
While global studies on dryland agriculture emphasize macro-level trends (Pingali et al., 2017; Stavi et al., 2022), this study provides deep insights into household-level vulnerabilities, offering actionable recommendations for targeted interventions. Additionally, the results reveal the significance of social welfare programs, i.e., MGNREGA in mitigating nutritional deficiencies, emphasizing multisectoral policy strategies, beyond agricultural intensification are imperative for sustainable development (FAO, 2006; Anantha et al., 2022).
Conclusion
This study highlights the critical interplay between resource availability, agricultural productivity, household income, and nutritional outcomes in Bundelkhand, a region deeply affected by seasonal water scarcity, declining rainfall, and persistent poverty. The analysis reveals that cropping intensity remains limited to 123%, with a significant proportion of agricultural land left fallow due to poor irrigation access and soil-related constraints. The dominance of Vertisols and Alfisols directly influences farmers’ cultivation choices, with waterlogging restricting kharif production in some areas, while water scarcity limits rabi season expansion in others. Additionally, farmers’ preference for rabi crops over kharif reflects their risk-minimization strategy, driven by uncertain monsoon patterns and the fear of crop failure.
The findings highlights that income disparities remain crucial issues, with large farmers earning the majority of their income through agriculture and livestock, while marginal and small farmers depend heavily on wage labour and migration. Despite differences in landholding size, the majority of surveyed households remain below the poverty threshold, signifying the urgent need for interventions that enhance economic stability. The study also establishes a strong correlation between resource endowments and nutritional intake, showing that households with better access to irrigation, higher income levels, and greater educational attainment experience improved protein and iron consumption. Additionally, participation in social welfare programs like MGNREGA plays a direct role in increasing food security, particularly by enabling access to iron-rich foods for vulnerable households.
Given the dominance of rainfed agriculture, the study highlights the need for landscape rejuvenation as a transformative solution for addressing Bundelkhand’s agricultural and nutritional challenges. Empirical evidence supports the effectiveness of decentralized rainwater harvesting and agroforestry interventions, which have been shown to increase cropping intensity, convert fallow land into productive cultivation, and enhance household income two to threefold. The untapped potential of fallow land (40–60%) represents a key opportunity for crop intensification, provided that proper drainage systems and sustainable water conservation measures are implemented.
This study makes a compelling case for integrated policy interventions that address land degradation, water scarcity, and socio-economic vulnerabilities. It recommends rehabilitating defunct water structures, strengthening agroforestry practices, and promoting demand-side water management strategies as essential steps toward sustainable agricultural intensification. Furthermore, expanding education, irrigation infrastructure, and targeted welfare programs will be critical in improving food security and enhancing long-term livelihood resilience in Bundelkhand. Future research should focus on scaling up landscape-based interventions, assessing climate adaptation strategies, and exploring governance mechanisms that support sustainable development in water-scarce regions. Through collaborative efforts among policymakers, research institutions, and farming communities, Bundelkhand can move toward a more resilient agricultural system that secures livelihoods and ensures food security despite persistent environmental challenges.
Statements
Data availability statement
The original contributions presented in the study are included in the article/supplementary material, further inquiries can be directed to the corresponding author.
Author contributions
NP: Methodology, Writing – review & editing, Writing – original draft, Formal analysis. KA: Conceptualization, Writing – review & editing, Investigation, Writing – original draft, Methodology, Formal analysis, Supervision, Data curation. KG: Formal analysis, Writing – original draft, Methodology, Data curation, Conceptualization, Writing – review & editing. VA: Writing - review & editing, Methodology, Data curation. RS: Methodology, Project administration, Writing - review & editing. MJ: Writing - review & editing.
Funding
The author(s) declare that no financial support was received for the research and/or publication of this article.
Acknowledgments
Authors gratefully acknowledge the Government of Uttar Pradesh for providing funding support to implement the “Knowledge Intensive Sustainable Agricultural Network – Mission India for Transforming Agriculture” (KISAN MITrA) project under the Doubling Farmers’ Income initiative in Bundelkhand region of the state. Authors also acknowledge the support rendered by various collaborating institutions and the farming community during the course of investigation.
Conflict of interest
The authors declare that the research was conducted in the absence of any commercial or financial relationships that could be construed as a potential conflict of interest.
Generative AI statement
The authors declare that no Gen AI was used in the creation of this manuscript.
Publisher’s note
All claims expressed in this article are solely those of the authors and do not necessarily represent those of their affiliated organizations, or those of the publisher, the editors and the reviewers. Any product that may be evaluated in this article, or claim that may be made by its manufacturer, is not guaranteed or endorsed by the publisher.
References
1
ADB. (2008). Access to land by the rural poor: The case of Nepal. Paper presented at the seminar organized by the Centre on integrated rural development for Asia and the Pacific (CIRDAP), July 6, Dhaka, Bangladesh.
2
AleksandrowiczL.GreenR.JoyE. J. M.HarrisF.DangourA. D.HainesA.et al. (2019). Environmental impacts of dietary shifts in India: a modelling study using nationally-representative data. Environ. Int.126, 207–215. doi: 10.1016/j.envint.2019.02.004
3
AnanthaK. H.GargK. K.BarronJ.DixitS.VenkataradhaA.SinghR.et al. (2021a). Impact of best management practices on sustainable crop production and climate resilience in smallholder farming systems of South Asia. Agric. Syst.194:103276. doi: 10.1016/j.agsy.2021.103276
4
AnanthaK. H.GargK. K.MosesS. D.PatilM. D.SawargaonkarG. L.KamdiP. J.et al. (2021b). Impact of natural resource management interventions on water resources and environmental services in different agroecological regions of India. Groundw. Sustain. Dev.13:100574. doi: 10.1016/j.gsd.2021.100574
5
AnanthaK. H.GargK. K.PetrieC. P.DixitS. (2021c). Seeking sustainable pathways for fostering agricultural transformation in peninsular India. Environ. Res. Lett.16:044032. doi: 10.1088/1748-9326/abed7b
6
AnanthaK. H.GargK. K.SinghR.VenkataradhaA.DevI.PetrieC. A.et al. (2022). Landscape resource management for sustainable crop intensification. Environ. Res. Lett.17:014006. doi: 10.1088/1748-9326/ac413a
7
BhuyanB.SahooB. K.SuarD. (2020). Nutritional status, poverty, and relative deprivation among socio-economic and gender groups in India: is the growth inclusive?World Dev. Perspect.18. doi: 10.1016/j.wdp.2020.100180
8
BiswasH.SenaD. R.KumarG.LakariaB. L.RaizadaA.KumarS.et al. (2017). Effect of water storage structures on groundwater recharge in India. Groundw. Sustain. Dev.4, 49–56. doi: 10.1016/j.gsd.2017.01.002
9
BoumaJ. (2021). How about the role of farmers and of pragmatic approaches when aiming for sustainable development by 2030?Eur. J. Soil Sci., 73:1–2. doi: 10.1111/ejss.13166
10
BreimanL. (2001). Random forests. Mach. Learn.45, 5–32. doi: 10.1023/A:1010933404324
11
CenacchiN.CoxC. M.FisherM.GarrettK.KooJ.PerezN. D.et al. (2013). “Sustainable agricultural intensification: the promise of innovative farming practices” in 2013 global food policy report. eds. FritschelH.MarbleA., International Food Policy Research Washington DC: International Food Policy Research Institute. 43–52.
12
ChavanS. B.UthappaA. R.SridharK. B.KeerthikaA.HandaA. K.NewajR.et al. (2016). Trees for life: creating sustainable livelihood in Bundelkhand region of Central India. Curr. Sci.111, 994–1002. doi: 10.18520/cs/v111/i6/994-1002
13
ClaudiaR.BhaduriA.LawfordR. (2013). The nexus across water, energy, land and food (WELF): potential for improved resource use efficiency?Current Opinion in Environmental Sustainability, 5:617–624. doi: 10.1016/j.cosust.2013.11.002
14
DevI.SinghR.GargK. K.RamA.SinghD.KumarN.et al. (2022). Transforming livestock productivity through watershed interventions: a case study of Parasai-Sindh watershed in Bundelkhand region of Central India. Agric. Syst.196:103346. doi: 10.1016/j.agsy.2021.103346
15
DjanibekovU.GaurV. (2018). Nexus of energy use, agricultural production, employment and incomes among rural households in Uttar Pradesh, India. Energy Policy113, 439–453. doi: 10.1016/j.enpol.2017.11.023
16
EllisF. (2003). A livelihoods approach to migration and poverty reduction. Norwich: Department for International Development.
17
FAO (2006). The state of food and agriculture 2006: Food aid for food security? FAO agriculture series no. 37. Rome: FAO.
18
FAO (2013). FAO statistical yearbook 2013: World food and agriculture. Rome: FAO.
19
FAO (2015). The state of food and agriculture 2015. Social protection and agriculture: Breaking the cycle of rural poverty. Rome: FAO.
20
FuglieK. O. (2018). Is agricultural productivity slowing?Glob. Food Secur.17, 73–83. doi: 10.1016/j.gfs.2018.05.001
21
FukaseE.MartinW. (2016). Who will feed China in the 21st century? Income growth and food demand and supply in China. J. Agric. Econ.67, 3–23. doi: 10.1111/1477-9552.12117
22
FukaseE.MartinW. (2020). Economic growth, convergence, and world food demand and supply. World Dev.132:104954. doi: 10.1016/j.worlddev.2020.104954
23
GargK. K.AkurajuV.AnanthaK. H.SinghR.WhitbreadA. M.DixitS. (2022a). Identifying potential zones for rainwater harvesting interventions for sustainable intensification in the semi-arid tropics. Sci. Rep.12:3882. doi: 10.1038/s41598-022-07847-4
24
GargK. K.AnanthaK. H.DixitS.NuneR.VenkataradhaA.WableP.et al. (2022b). Impact of raised beds on surface runoff and soil loss in Alfisols and Vertisols. Catena211:105972. doi: 10.1016/j.catena.2021.105972
25
GargK. K.AnanthaK. H.NuneR.VenkataradhaA.SinghP.GummaM. K.et al. (2020b). Impact of land use changes and management practices on groundwater resources in Kolar district, southern India. J. Hydrol. Reg. Stud.31:100732. doi: 10.1016/j.ejrh.2020.100732
26
GargK. K.AnanthaK. H.VenkataradhaA.DixitS.SinghR.RagabR. (2021). Impact of rainwater harvesting on hydrological processes in a fragile watershed of South Asia. Groundwater59, 839–855. doi: 10.1111/gwat.13099
27
GargK. K.SinghR.AnanthaK. H.SinghA. K.AkurajuV. R.BarronJ.et al. (2020a). Building climate resilience in degraded agricultural landscapes through water management: a case study of Bundelkhand region, Central India. J. Hydrol.591:125592. doi: 10.1016/j.jhydrol.2020.125592
28
GaribaldiL. A.Pérez-MéndezN. (2019). Positive outcomes between crop diversity and agricultural employment worldwide. Ecol. Econ.164:106358. doi: 10.1016/j.ecolecon.2019.106358
29
GhoshA.KumarS.MannaM. C.SinghA. K.SharmaP.SarkarA.et al. (2019). Long-term in situ moisture conservation in horti-pasture system improves biological health of degraded land. J. Environ. Manag.248:109339. doi: 10.1016/j.jenvman.2019.109339
30
GreeneW. H. (2000). Econometric analysis. 4th Edn: Prentice Hall. New York: New York University.
31
GargK. K.AnanthaK. H.NuneR.VenkataradhaA.SinghP.GummaM. K.et al, (2020b). Impact of landuse changes and management practices on groundwater resources in Kolar district, Southern India. J. Hydrol: Reg. Stud. 31, 100732.
32
HanesM.QiS.ZhangX. (2018). Agricultural production diversity, dietary diversity and nutritional status: panel data evidence from Tanzania. Agric. Econ. Res. Rev.31, 213–224. doi: 10.1016/j.worlddev.2019.104856
33
HarrisD.OrrA. (2014). Is rainfed agriculture really a pathway from poverty?Agric. Syst.123, 84–96. doi: 10.1016/j.agsy.2013.09.005
34
HeadeyD.HirvonenK.HoddinottJ. (2018). Animal sourced foods and child stunting. Am. J. Agric. Econ.100, 1302–1319. doi: 10.1093/ajae/aay053
35
HoffH.FalkenmarkM.GertenD.GordonL.KarlbergL.RockströmJ. (2010). Greening the global water system. J. Hydrol.384, 177–186. doi: 10.1016/j.jhydrol.2009.06.026
36
ICMR (2010). Nutrient requirements and recommended dietary allowances for Indians: A report of the expert group of the Indian Council of Medical Research. New Delhi: Indian Council of Medical Research.
37
JägermeyrJ.GertenD.SchaphoffS.HeinkeJ.LuchtW.RockströmJ. (2016). Integrated crop water management might sustainably halve the global food gap. Environ. Res. Lett.11, 1–14. doi: 10.1088/1748-9326/11/2/025002
38
KopittkeP. M.MenziesN. W.WangP.McKennaB. A.LombiE. (2019). Soil and the intensification of agriculture for global food security. Environ. Int.132:105078. doi: 10.1016/j.envint.2019.105078
39
KumarP.HerndonE.RichterD. (2020). Critical agents of change at earth’s surface. Eos. doi: 10.1029/2020EO149750
40
KumaraT. M. K.KandpalA.PalS. (2010). A meta-analysis of economic and environmental benefits of conservation agriculture in South Asia. J. Environ. Manag.269:110773. doi: 10.1016/j.jenvman.2020.110773
41
KursaM. B.RudnickiW. (2010). Feature selection with Boruta package. J. Stat. Softw.36, 1–13. doi: 10.18637/jss.v036.i11
42
LiF.ZhangK.RenJ.YinC.ZhangY.NieJ. (2021). Driving mechanism for farmers to adopt improved agricultural systems in China: the case of rice-green manure crops rotation system. Agric. Syst.192:103202. doi: 10.1016/j.agsy.2021.103202
43
LiawA.WienerM. (2002). Classification and regression by randomForest. R News2, 18–22.
44
LohrS. L. (2019). Sampling: Design and analysis. 3rd Edn. Boca Raton, FL: CRC Press.
45
LoizouE.KarelakisC.GalanopoulosK.MattasK. (2019). The role of agriculture as a development tool for a regional economy. Agric. Syst.173, 482–490. doi: 10.1016/j.agsy.2019.04.002
46
LongJ. S. (1997). Regression models for categorical and limited dependent variables. London: SAGE Publications.
47
MandalS.VemaV. K.KurianC.SudheerK. P. (2020). Improving the crop productivity in rainfed areas with water harvesting structures and deficit irrigation strategies. J. Hydrol.586:124818. doi: 10.1016/j.jhydrol.2020.124818
48
MitraA.RaoN. (2019). Gender, water, and nutrition in India: an intersectional perspective. Water Altern.12, 169–191.
49
MoyenUddinM. M. (2020). What are the dynamic links between agriculture and manufacturing growth and environmental degradation? Evidence from different panel income countries. Environ. Sustain. Indic.7:100041. doi: 10.1016/j.indic.2020.100041
50
NarayananS. (2015). Food security in India: the imperative and its challenges. Agric. Pol.10, 1–12. doi: 10.1002/app5.62
51
NicholsC. (2020). Nutrition sensitive agriculture: an equity-based analysis from India. World Dev.133:105004. doi: 10.1016/j.worlddev.2020.105004
52
NIN (2011). Dietary guidelines for Indians – a manual. Hyderabad: Indian Council of Medical Research.
53
PingaliP.MittraB.RahmanA. (2017). The bumpy road from food to nutrition security – slow evolution of India's food policy. Glob. Food Secur.15, 77–84. doi: 10.1016/j.gfs.2017.05.002
54
PradhanA.ChanC.RoulP. K.HalbrendtJ.SipesB. (2018). Potential of conservation agriculture (CA) for climate change adaptation and food security under rainfed uplands of India: a transdisciplinary approach. Agric. Syst.163, 27–35. doi: 10.1016/j.agsy.2017.01.002
55
PrăvălieR. (2016). Drylands extent and environmental issues: a global approach. Earth-Sci. Rev.161, 259–278. doi: 10.1016/j.earscirev.2016.08.003
56
PriyadarshiniP.AbhilashP. C. (2020). Policy recommendations for enabling transition towards sustainable agriculture in India. Land Use Policy96:104718. doi: 10.1016/j.landusepol.2020.104718
57
QiS.HanesM.ZhangX. (2025). The impact of agricultural production diversity on farmer household dietary diversity: a case study of Nanjing City. Front. Nutr.12:1493371. doi: 10.3389/fnut.2025.1493371
58
RaoA. V. R. K.WaniS. P.SinghK. K.AhmedM. I.SrinivasK.BairagiS. D.et al. (2013). Increased arid and semi-arid areas in India with associated shifts during 1971-2004. J. Agrometeorol.15, 11–18. doi: 10.54386/jam.v15i1.1431
59
RaskK.RaskN. (2011). Economic development and food production–consumption balance: a growing global challenge. Food Policy36, 186–196. doi: 10.1016/j.foodpol.2010.11.015
60
RicciardiV.WaneA.SidhuB. S.GoddeC.SolomonD.McCulloughE.et al. (2020). A scoping review of research funding for small-scale farmers in water scarce regions. Nat. Sustain.3, 836–844. doi: 10.1038/s41893-020-00623-0
61
RockströmJ. (2003). Water for food and nature in drought-prone tropics: vapour shift in rain-fed agriculture. Philos. Trans. R. Soc. Lond. Ser. B Biol. Sci.358, 1997–2009. doi: 10.1098/rstb.2003.1400
62
SahuR. K.RawatA. K.RaoD. L. N. (2015). Traditional rainwater management system (‘Haveli’) in Vertisols of Central India improves carbon sequestration and biological soil fertility. Agric. Ecosyst. Environ.200, 94–101. doi: 10.1016/j.agee.2014.11.005
63
SchneiderK.GugertyM. K. (2011). Agricultural productivity and poverty reduction: linkages and pathways. Evans Sch. Rev.1, 56–74. doi: 10.7152/esr.v1i1.12249
64
ShakeelA.JamalA.ZaidyM. N. (2012). A regional analysis of food security in Bundelkhand region (Uttar Pradesh, India). J. Geogr. Reg. Plan.5, 252–262. doi: 10.5897/JGRP12.023
65
SharmaB. R.RaoK. V.VittalK. P. R.RamakrishnaY. S.AmarasingheU. (2010). Estimating the potential of rainfed agriculture in India: prospects for water productivity improvements. Agric. Water Manag.97, 23–30. doi: 10.1016/j.agwat.2009.08.002
66
SinghS. (2020). Farmers’ perception of climate change and adaptation decisions: a micro-level evidence from Bundelkhand region, India. Ecol. Indic.116:106475. doi: 10.1016/j.ecolind.2020.106475
67
SinghR.AkurajuV.AnanthaK. H.GargK. K.BarronJ.WhitbreadA. M.et al. (2022). Traditional rainwater management (Haveli cultivation) for building system level resilience in a fragile ecosystem of Bundelkhand region, Central India. Front. Sustain. Food Syst.6:826722. doi: 10.3389/fsufs.2022.826722
68
SinghR.GargK. K.AnanthaK. H.VenkataradhaA.DevI.DixitS.et al. (2021a). Building resilient agricultural system through groundwater management interventions in degraded landscapes of Bundelkhand region, Central India. J. Hydrol. Reg. Stud.37:100929. doi: 10.1016/j.ejrh.2021.100929
69
SinghR.GargK. K.WaniS. P.TewariR. K.DhyaniS. K. (2014). Impact of water management interventions on hydrology and ecosystem services in Garhkundar-Dabar watershed of Bundelkhand region, Central India. J. Hydrol.509, 132–149. doi: 10.1016/j.jhydrol.2013.11.030
70
SinghR.MachanuruR.SinghB.ShrivastavaM. (2021b). Climate-resilient agriculture: enhance resilience toward climate change, In. Singh, S., Singh, P., Rangabhashiyam, S., and Srivastava, K.K. (Eds). Global Climate Change. 45–61. doi: 10.1016/B978-0-12-822928-6.00016-2
71
SinghP. K.VermaS. K.MorenoJ. A.SinghV. K.MalviyaV. P.OliveiraE. P.et al. (2019). Geochemistry and Sm Nd isotope systematics of mafic-ultramafic rocks from the Babina and Mauranipur greenstone belts, Bundelkhand craton, India: implications for tectonic setting and Paleoarchean mantle evolution. Lithos330, 90–107. doi: 10.1016/j.lithos.2019.02.010
72
SquiresJ. E.AloisioL. D.GrimshawJ. M.BashirK.DorranceK.CoughlinM.et al. (2019). Attributes of context relevant to healthcare professionals’ use of research evidence in clinical practice: a multi-study analysis. Implement. Sci.14:52. doi: 10.1186/s13012-019-0900-8
73
SrivastavaP.SinghR.TripathiS.RaghubanshiA. S. (2016). An urgent need for sustainable thinking in agriculture – an Indian scenario. Ecol. Indic.67, 611–622. doi: 10.1016/j.ecolind.2016.03.015
74
SwetalinaN.ThomasT. (2016). Evaluation of hydrological drought characteristics for Bearma basin in Bundelkhand region of Central India. Procedia Technol.24, 85–92. doi: 10.1016/j.protcy.2016.05.013
75
StaviI.Roque de PinhoJ.PaschalidouAnastasiaK.Adamo SusanaB.Galvinet al. (2022). Food security among the dryland pastoralists and agropastoralists: The climate, land-use change, and population dynamics nexus. The Anthropocene Review, 9: 299–32.
76
ThapliyalS.MukherjiA.MalghanD. (2019). Economic inequality and loss of commons: evidence from India. World Dev.122, 693–712. doi: 10.1016/j.worlddev.2019.06.012
77
ThomasT.JaiswalR. K.GalkateR. V.NayakT. R. (2016). Reconnaissance drought index based evaluation of meteorological drought characteristics in Bundelkhand. Procedia Technol.24, 23–30. doi: 10.1016/j.protcy.2016.05.005
78
TripathiA.MishraA. K. (2017). Knowledge and passive adaptation to climate change: an example from Indian farmers. Clim. Risk Manag.16, 195–207. doi: 10.1016/j.crm.2016.11.002
79
TripathiA.TripathiD. K.ChauhanD. K.KumarN.SinghG. S. (2016). Paradigms of climate change impacts on some major food sources of the world: a review on current knowledge and future prospects. Agric. Ecosyst. Environ.216, 356–373. doi: 10.1016/j.agee.2015.09.034
80
United Nations (2019). World population prospects: The 2019 revision. New York: United Nations.
81
VallinoE.RidolfiL.LaioF. (2020). Measuring economic water scarcity in agriculture: a cross-country empirical investigation. Environ. Sci. Pol.114, 73–85. doi: 10.1016/j.envsci.2020.07.017
82
VaruaM. E.WardJ.MaheshwariB.DaveS.KookanaR. (2018). Groundwater management and gender inequalities: the case of two watersheds in rural India. Groundw. Sustain. Dev.6, 93–100. doi: 10.1016/j.gsd.2017.11.007
83
WableP. S.GargK. K.NuneR.VenkataradhaA.AnanthaK. H.SrinivasanV.et al. (2021). Impact of agricultural water management interventions on upstream–downstream trade-offs in the upper Cauvery catchment, southern India: a modelling study. Irrig. Drain., 71:1–23. doi: 10.1002/ird.2662
84
WardP. J.de RuiterM. C.MardJ.SchraterK.VanL. A.VeldkampT.et al. (2020). The need to integrate flood and drought disaster risk reduction strategies. Water Secur.11:100070. doi: 10.1016/j.wasec.2020.100070
85
WooldridgeJ. M. (2002). Econometric Analysis of Cross Section and Panel Data. The MIT Press Cambridge.
86
WooldridgeJ. M. (2013). Introductory econometrics: A modern approach. 5th Edn. Mason, OH: South-Western Cengage Learning.
87
ZanzanainiC.TrầnB. T.SinghC.HartA.MilderJ.DeClerckF. (2017). Integrated landscape initiatives for agriculture, livelihoods and ecosystem conservation: an assessment of experiences from south and Southeast Asia. Landsc. Urban Plan.165, 11–21. doi: 10.1016/j.landurbplan.2017.03.010
88
ZhangX.DavidsonE. A.MauzerallD. L.SearchingerT. D.DumasP.ShenY. (2018). Quantitative assessment of agricultural sustainability reveals divergent priorities among nations. One Earth4, 529–544. doi: 10.1016/j.oneear.2021.08.01
Summary
Keywords
dryland agriculture, household nutrition, household income, natural resources, semi-arid tropics
Citation
Padhan N, Anantha KH, Garg KK, Akuraju V, Singh R and Jat ML (2025) Interplay of resource endowments, agriculture and nutritional outcomes in the Central Indian Landscape. Front. Sustain. Food Syst. 9:1596474. doi: 10.3389/fsufs.2025.1596474
Received
19 March 2025
Accepted
07 July 2025
Published
30 July 2025
Volume
9 - 2025
Edited by
Jason Grant, Virginia Tech, United States
Reviewed by
Paidamoyo Mataranyika, University of Namibia, Namibia
Sheng Yao, Anhui Academy of Agricultural Sciences (CAAS), China
Abd. Rahim, State University of Makassar, Indonesia
Updates
Copyright
© 2025 Padhan, Anantha, Garg, Akuraju, Singh and Jat.
This is an open-access article distributed under the terms of the Creative Commons Attribution License (CC BY). The use, distribution or reproduction in other forums is permitted, provided the original author(s) and the copyright owner(s) are credited and that the original publication in this journal is cited, in accordance with accepted academic practice. No use, distribution or reproduction is permitted which does not comply with these terms.
*Correspondence: K. H. Anantha, Anantha.kanugod@icrisat.org
Disclaimer
All claims expressed in this article are solely those of the authors and do not necessarily represent those of their affiliated organizations, or those of the publisher, the editors and the reviewers. Any product that may be evaluated in this article or claim that may be made by its manufacturer is not guaranteed or endorsed by the publisher.